After completing this chapter, the reader will be able to perform the following:
1. Define all the key terms in this chapter.
2. State all the important relationships in this chapter.
3. Differentiate between fluoroscopic and radiographic imaging.
4. Recognize the unique features of an image-intensified fluoroscopic unit and explain how the image is created and viewed.
5. Explain the process of brightness gain and the conversion factor during image intensification.
6. Define automatic brightness control and state its function.
7. Explain how using the magnification mode affects image quality and patient exposure.
8. Identify common types of image degradation resulting from image-intensified fluoroscopy.
9. Differentiate among the types of television cameras used to convert the output phosphor image for viewing on a television monitor.
10. List the types of recording devices available for image-intensified fluoroscopy.
11. Compare and contrast features of image-intensified units from digital fluoroscopic units.
12. Differentiate between continuous and pulsed fluoroscopy and their impacts on patient radiation dose.
13. State radiation safety procedures used to reduce exposure to the patient and personnel.
14. Recognize the need for quality control on fluoroscopic units.
Key Terms
analog-to-digital converter (ADC)
automatic brightness control (ABC)
brightness gain
camera tube
charge-coupled device (CCD)
continuous fluoroscopy
conversion factor
electrostatic focusing lenses
fluoroscopy
flux gain
image intensification
input phosphor
magnification mode
minification gain
output phosphor
photocathode
pulsed fluoroscopy
spatial resolution
The previous chapters discussed radiographic imaging for producing static radiographs of anatomic tissues. Furthermore, imaging of the functioning or motion (dynamics) of anatomic structures is needed for evaluation and is accomplished by fluoroscopy. For example, in order to visualize the stomach emptying its contents into the small bowel, images must be created in a continuous form for accurate evaluation of the functioning. Most fluoroscopic procedures also require the use of contrast media to visualize internal structures and their functioning. This chapter discusses the components of fluoroscopic units, viewing and recording systems, and the digital fluoroscopy process in use today.
Fluoroscopy
Fluoroscopy allows imaging of the movement of internal structures. It differs from radiographic imaging by its use of a continuous beam of x-rays to create images of moving internal structures that can be viewed on a monitor. Internal structures, such as vascular or gastrointestinal systems, can be visualized in their normal state of motion with the aid of special liquid or gas substances (contrast media) that are either injected or instilled.
In image-intensified fluoroscopy, the milliamperage (mA) used during imaging is considerably lower (0.5 to 5 mA) than that in the radiographic mode, which is operated at a higher mA of 50 to 1200 mA. A low mA provides for the increased time the fluoroscope is operated. Because the time of exposure is lengthened, the control panel includes a timer that buzzes audibly when 5 min of x-ray fluoroscopic time has been used. Another important feature of a fluoroscopic unit is the deadman switch. The continuous x-ray beam is activated by either a hand switch on the unit or a foot pedal that must be continuously depressed for the x-rays to be produced. Releasing the pressure applied to the pedal or switch terminates the radiation exposure.
Image Intensification
Image intensification (Figure 10-1) is the process in which the exit radiation from the anatomic area of interest interacts with the input phosphor (a light-emitting material, such as cesium iodide) for conversion to visible light. The light intensities are equal to the intensities of the exit radiation and are converted to electrons by a photocathode (photoemission). The electrons are focused by electrostatic focusing lenses and accelerated toward an anode to strike the output phosphor (coated with light-emitting crystals, such as zinc cadmium sulfide) and create a brighter image.
Important Relationship
Image-Intensified Fluoroscopy
Dynamic imaging of internal anatomic structures can be accomplished with the use of an image intensifier. The exit radiation is absorbed by the input phosphor, converted to electrons, sent to the output phosphor, released as visible light, and converted to an electronic video signal for transmission to the television monitor.
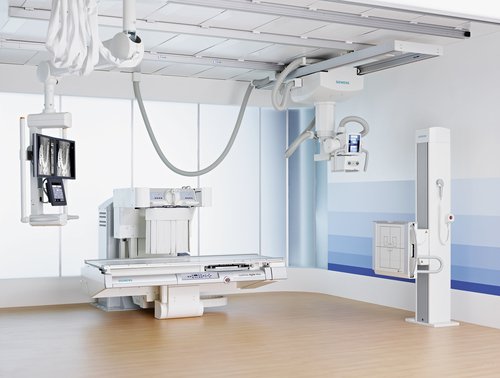
The image light intensities from the output phosphor are converted to an electronic video signal and sent to a television monitor for viewing. Figure 10-2 is an example of a typical radiographic and image-intensified fluoroscopic unit. Additional filming devices, such as spot film or cine (movie film), can be attached to the fluoroscopic system to create permanent radiographic images of specific areas of interest.
FIGURE 10-1A, Fluoroscopic system used for dynamic imaging of internal structures. B, Major components of an image intensifier.
FIGURE 10-2 A typical radiographic and image-intensified fluoroscopic unit.
Brightness Gain
A brighter image is a result of high-energy electrons striking a small-output phosphor. Accelerating the electrons increases the light intensities at the output phosphor (flux gain). The reduction in the size of the output phosphor image compared with that of the input phosphor image also increases the light intensities (minification gain). Brightness gain is the product of both flux gain and minification gain and results in a brighter image on the output phosphor.
Important Relationship
Brightness Gain
A brighter image is created on the output phosphor when accelerated electrons strike a smaller output phosphor.
Although the term brightness gain continues to be used, it is now a common practice to express this increase in brightness with the term conversion factor. Conversion factor is an expression of the luminance at the output phosphor divided by the input exposure rate, and its unit of measure is the candela per square meter per milliroentgen per second (cd/m2/mR/s). The numeric conversion factor value is roughly equal to 1% of the brightness gain value. For example, a brightness gain of 20,000 would have a conversion factor of 200. The higher the conversion factor or brightness gain value, the greater the efficiency of the image intensifier. See Box 10-1 for brightness gain and conversion factor formulas.
Automatic Brightness Control
The radiographer must also be familiar with automatic brightness control (ABC), a function of the fluoroscopic unit that maintains the overall appearance of the fluoroscopic image (contrast and density) by automatically adjusting the kilovoltage peak (kVp), mA, or both. ABC generally operates by monitoring the current through the image intensifier or the output phosphor intensity and adjusting the exposure factor if the monitored value falls below preset levels. The fluoroscopic unit allows the operator to select a desired brightness level, and this level is subsequently maintained by ABC. ABC is slightly slow in its response to changes in patient tissue thickness and tissue density as the fluoroscopy tower is moved about over the patient; this is visible to the radiographer as a lag in the image brightness on the monitor as the tower is moved.
BOX 10-1Brightness Gain and Conversion Factor Formulas
FIGURE 10-3 Magnification mode. When the image intensifier is operated in magnification mode, the voltage to the electrostatic focusing lenses is increased. This increase tightens the diameter of the electron stream, and the focal point is shifted farther from the output phosphor, resulting in a magnified image.
Magnification Mode
Another function of some image intensifiers is the multifield mode or magnification mode. Most image intensifiers in use today have this capability. When operated in magnification mode, the voltage to the electrostatic focusing lenses is increased. This increase tightens the diameter of the electron stream, and the focal point is shifted farther from the output phosphor (Figure 10-3). The effect is that only the electrons from the central area of the input phosphor interact with the output phosphor and contribute to the image, giving the appearance of magnification. For example, a 30/23/15 cm trifocus image intensifier can be operated in any of these three modes. When operated in the 23 cm mode, only the electrons from the central 23 cm of the input phosphor interact with the output phosphor; the electrons about the periphery miss and do not contribute to the image. The same is true for the 15 cm mode. Selecting the magnification mode automatically adjusts the x-ray beam collimation to match the displayed tissue image and avoids irradiating tissue that does not appear in the image. The degree of magnification (magnification factor [MF]) may be found by dividing the full-size input diameter by the selected input diameter. For example: MF = 30 ÷ 15 = 2× magnification.
This magnification improves the operator’s ability to see small structures (spatial resolution, discussed shortly) but at the expense of increasing the patient dose. Remnant x-ray photons are converted to light and then to electrons and are focused on the output phosphor. If fewer electrons are incident on the output phosphor, the output intensity decreases. To compensate, more x-ray photons are needed at the beginning of the process to produce more light, resulting in more electrons at the input end of the image intensifier. ABC automatically increases x-ray exposure to achieve this. Again, with an increase in x-rays used comes an increase in patient dose.
Important Relationship
Magnification Mode and Patient Dose
Operating the image intensifier in one of the magnification modes increases the operator’s ability to see small structures but at the price of increasing the radiation dose to the patient.
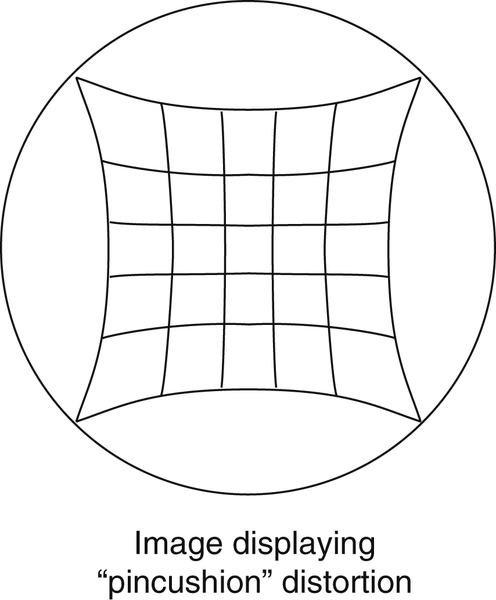
FIGURE 10-4 Pincushion distortion. Appearance of the pincushion effect. The circle represents the television monitor display, and the grid represents the effect on the image.
Magnification modes improve spatial resolution, which refers to the smallest structure that may be detected in an image. Spatial resolution is measured in line pairs per millimeter (Lp/mm), and typical fluoroscopic systems have spatial resolution capabilities of 4 to 6 Lp/mm but greatly depend on the rest of the imaging chain (i.e., the viewing and recording systems).
Distortion is also an issue with image-intensified fluoroscopy. In radiography, distortion is a misrepresentation of the true size or shape of an object. In the case of fluoroscopy, shape distortion can be a problem. In fluoroscopy, distortion is a result of inaccurate control or focusing of the electrons released at the periphery of the photocathode and the curved shape of the photocathode. The combined result is an unequal magnification (distortion) of the image, creating what is called a “pincushion appearance” (Figure 10-4). This problem also causes a loss of brightness around the periphery of the image, which is referred to as vignetting.
One last factor to consider with image intensifiers is noise. Image noise results when insufficient information is present to create the image. In the case of fluoroscopy, this lack of image-forming information ultimately goes back to an insufficient quantity of x-rays. If too few x-rays exit the patient and expose the input phosphor, not enough light will be produced, decreasing the number of electrons released by the photocathode to interact with the output phosphor. This results in a “grainy” or “noisy” image (Figure 10-5). Although other factors in the fluoroscopic chain may contribute to noise, the solution generally comes back to increasing the mA (quantity of radiation). See Box 10-2 for fluoroscopic equipment inspection checklist.
Viewing Systems
The original image intensifiers produced an image that was viewed using a mirror optics system—something akin to a sophisticated way of looking at the output phosphor with a “rearview mirror.” Conventionally, the viewing system is now a closed-circuit television monitor system. To view the image from the output phosphor on a television monitor, it must first be converted to an electrical signal (often referred to as video signal) by the television camera. Two devices are commonly used today to accomplish this: a camera tube and a charge-coupled device (CCD). The camera tube and CCD differ in their size and readout process.
Television Cameras
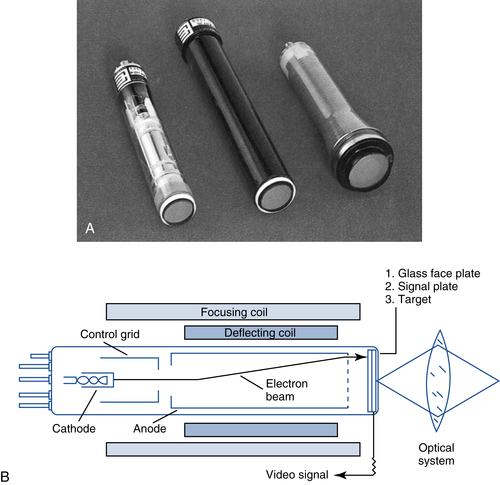
Television cameras used in order to display the fluoroscopic image include the older camera tube (vidicon/Plumbicon) and the newer CCD. The camera tube has a vacuum tube approximately 15 cm (6 in) in length that encloses an electron gun and a photoconductive target assembly (Figure 10-6). The diameter of the tube is the same size as that of the output phosphor. The light from the output phosphor arrives at the target assembly either by fiber optics or by a lens system. A steady stream of electrons from the electron gun scans the target assembly very quickly from left to right and top to bottom (raster pattern). As the stream of electrons bombards the target, anywhere there is light intensity from the output phosphor image there will be an electrical signal leaving the tube. Scanning a brighter or higher light intensity results in the electrical signal leaving the camera tube with a higher strength. The darker or lower the light intensities scanned, the lower the strength of the electrical signal. The electrical signal leaving the camera tube varies in strength in proportion to the varying brightness of the image being scanned. This electrical (video) signal goes to the television monitor to complete the display process.
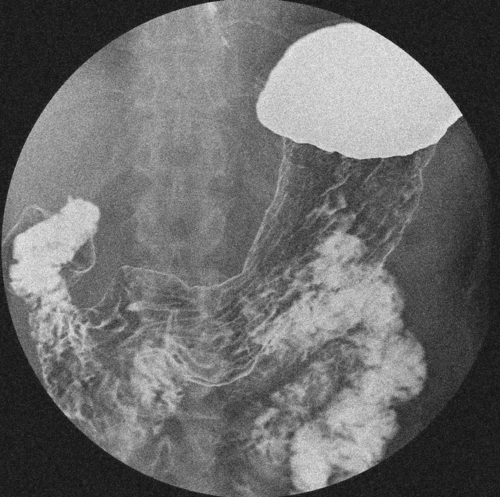
FIGURE 10-5 Quantum noise. If too few x-rays exit the patient and expose the input phosphor, not enough light will be produced, decreasing the number of electrons released by the photocathode to interact with the output phosphor. A “grainy” or “noisy” image results.
When the Bucky is parked at the foot of the table, the metal cover should expand and cover the entire opening.
Protective curtain
The curtain should be in good condition and move freely into place when the tower is moved to the operating position.
Tower—locks, power assist, control panel
The electromagnetic locks are in good working order, the power assist moves the tower about easily in all directions, and all control panel indicator lights are operational.
Exposure switch (deadman switch)
The switch is not sticking and operates the x-ray tube only while in the depressed position (also test the switch with the tower in the park position; it should not activate the x-ray tube while parked).
Collimator shutters
In the fully open position, the shutters should restrict the beam to the size of the input phosphor and be accurate to within ±3%.
Fluoroscopic timer
The timer should buzz audibly after 5 min of fluoroscopic “beam-on” time.
Monitor brightness
While exposing a penetrometer through a fluoroscopic phantom, the monitor image is adjusted to display as many of the penetrometer steps as possible.
Table tilt motion
The table tilts smoothly to its limit in both directions, and the angulation indicator is operational.
FIGURE 10-6A, Vidicon-type camera tube. B, The vidicon tube has a vacuum tube that encloses an electron gun and a photoconductive target assembly. The electrical signal leaving the camera tube varies in strength proportionally based on the varying brightness of the image being scanned.
The charge-coupled device (CCD) is a light-sensitive semiconducting device that generates an electrical charge when stimulated by light and stores this charge in a capacitor. The charge is proportional to the light intensity and is stored in rows of pixels. The CCD consists of a series of semiconductor capacitors, with each capacitor representing a pixel. Each pixel is composed of photosensitive material that dislodges electrons when stimulated by light photons. To digitize the charge from this device, the electrodes between each pixel, called row gates, are charged in sequence, moving the signal down the row, where it is transferred into the capacitors. From the capacitors, the charge is sent as an electronic signal to the television monitor. In this way, each pixel is individually “read” and sent to the television monitor (Figure 10-7).
FIGURE 10-7A, The charge-coupled device (CCD) is a light-sensitive semiconducting device that generates an electrical charge when stimulated by light and stores this charge in a capacitor. B, To digitize the charge from the CCD, the electrodes between each pixel, called row gates, are charged in sequence, moving the signal down the row where it is transferred into a capacitor. From the capacitors, the charge is sent as an electronic signal to the television monitor.
Compared with the vidicon-type camera tube, the CCD is read out by the charge in each pixel, whereas the vidicon is read out by an electronic beam. CCD TV cameras have some advantages over the camera tubes in that they are more sensitive to a wider range of light intensities and show no geometric distortion of the fluoroscopic display image. The CCD is smaller in size than the vidicon camera tube and works well in digital imaging.
Coupling of Devices
As mentioned earlier, the camera tube or CCD may be coupled to the output phosphor of the image intensifier by either a fiber-optic bundle or an optical lens system. The fiber-optic bundle is simply a bundle of very thin optical glass filaments. This system is very durable and simple in design but does not allow spot filming.
The optical lens system is a series of optical lenses that focus the image from the output phosphor on the television camera (camera tube or CCD). When spot filming is desired, a beam-splitting mirror (a partially silvered mirror that allows some light to pass through and reflects some in a new direction) is moved into the path of the output image and diverts some of the light to the desired spot-filming device (e.g., the photospot or cine camera) (Figure 10-1). This system, although allowing spot filming of this type, is more susceptible to rough handling, which may cause maladjustment of the mirror and lenses and result in a blurred image.
Television Monitor
The varying electrical (video) signals reach the television display monitor (cathode ray tube [CRT]) almost instantaneously. The CRT (Figure 10-8) includes an electron gun that scans the phosphor layer found on the inside of the glass front of the monitor, again in the raster pattern. As the video signal increases and decreases, so does the number of electrons emitted from the electron gun. The greater the number of electrons leaving the gun, the brighter the fluorescence of the phosphor, resulting in a bright spot on the display monitor. The lower the video signal, the fewer the electrons emitted from the gun and the lower the brightness of the displayed image.
FIGURE 10-8 CRT television monitor. The television monitor reconstructs the image from the output phosphor as a visible image. The CRT includes an electron gun that scans the phosphor layer found on the inside of the glass front of the monitor in a raster pattern.
In essence, the television monitor reconstructs the image from the output phosphor as a visible image. The image is created on the fluorescent screen one line at a time starting in the upper left-hand corner and moving to the right (active trace). It then blanks (turns off) and returns to the left side (horizontal retrace). This process continues to the bottom of the screen. It then returns to the top (vertical retrace) and begins again by placing a line between each of the previously drawn lines. This action creates a television frame. Typical television monitors are called 525-line systems because the traces create a 525-line frame. High-resolution monitors have 1024 lines per frame. However, the monitor continues to be the weak link in terms of the resolution of the fluoroscopic chain. The image intensifier is capable of resolving approximately 5 Lp/mm, whereas the monitor can display only 1 to 2 Lp/mm.
Important Relationship
Coupling Systems and the Television Monitor
The camera tube and CCD are devices that couple the image intensifier to the television monitor to convert the image from the output phosphor to an electronic (video) signal that can be reconstructed on the television monitor.
Liquid Crystal Display (LCD) Monitors
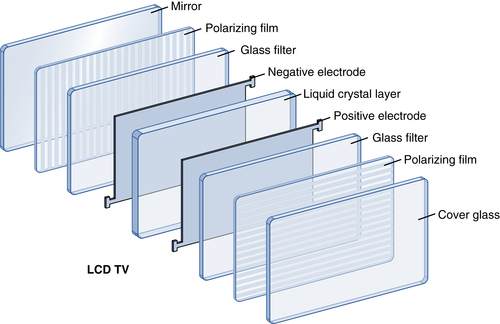
LCD monitors are a modern display monitor option. LCD monitors offer superior resolution and brightness over television monitors. They work in a completely different way than television monitors. LCD monitors are made up of several layers (See Figure 10-9). The heart of the LCD is the liquid crystal layer sandwiched between polarizing layers. The liquid crystal layer contains nematic liquid crystals. These crystals are typically rod-shaped and are semi-liquid. They exist in an unorganized “twisted” state. When an electric current is applied, they organize or “untwist.” In the untwisted state, they organize into configurations that block or allow light to pass through depending on the polarizing filters. The polarized layers on each side are oriented perpendicular to one other, meaning that light that may be able to pass through one would be at the wrong orientation to pass through the other. When electric current is applied to the liquid crystal layer, the “untwisting” changes the orientation of light passing through the back layer and allows it to pass through the front. A TFT panel is located behind the liquid crystal layer. The number of TFTs is equal to the number of pixels displayed. The TFTs control the current to each pixel and switch it on or off by causing the liquid crystals to twist or untwist. A monochromatic LCD monitor will display the light as shades of gray. A color LCD monitor has a color filter layer added to display shades of color. The intensity of light is controlled by the current to the crystals, which is controlled by the TFTs. This in turn determines the shade of gray if monochromatic or the shade of color if using a color monitor.
FIGURE 10-9 Liquid Crystal Display (LCD) Monitors are composed of several layers.
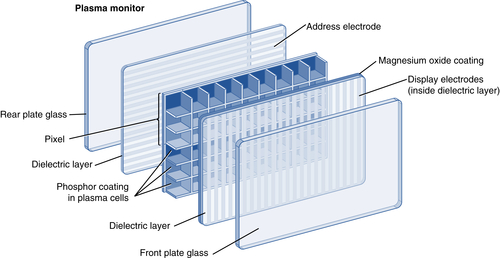
Plasma Monitors
Plasma monitors are another modern display option. Plasma monitors are very similar in construction to LCD monitors, but instead of a liquid crystal layer, they have a thin layer of pixels (see Figure 10-10). Each pixel contains three neon- and xenon-gas-filled cells (sub-pixels). Each of these cells is coated with a different phosphor layer formula that will produce red, green, or blue light when stimulated. On each side of this layer of pixels are dielectric layers. When electricity is passed between these dielectric layers through the pixels, the gas within is ionized. The liberated electrons release ultraviolet radiation in order to return to the shell of an atom. The ultraviolet radiation in turn stimulates the phosphor coating in the cell, producing visible light of a color corresponding to the phosphor formula. The current through the pixels (and sub-pixels) is modulated by the electrodes several thousand times per second, thereby controlling the intensity of light produced. This control and modulation process makes it possible for plasma monitors to produce billions of different shades of color.
FIGURE 10-10 Plasma monitors are very similar in construction to LCD monitors, but instead of a liquid crystal layer, they have a thin layer of pixels.
FIGURE 10-11 A typical image-intensified fluoroscopic unit showing two types of recording systems, cassette spot filming and a photo-spot camera.
Recording Systems
Cassette spot filming has been a standard of image-intensified fluoroscopic imaging for many years (Figure 10-11). This is a static imaging process in which a standard radiographic cassette is used to obtain an image. With this system, the cassette is loaded into the lower part of the fluoroscopic tower and “parked” in a protective envelope in the back. When the spot-film exposure button is pressed, the cassette is moved into position between the patient and image intensifier, and the machine shifts from fluoroscopic to radiographic mode and exposes the film. In the shift to radiographic mode, the mA increases from one of the 0.5 to 5 mA fluoroscopic modes to one of the 50 to 1200 mA radiographic modes. Because this method of imaging uses the radiographic mode, it requires a much higher radiation dose to the patient than the other methods. As an alternative to exposing the entire film, the tower is generally equipped with a series of masking shutters that can “divide” the cassette and allow numerous exposures on one cassette, such as two exposures on one cassette, four on one, and six on one. In each setting, the image is smaller and organized as one of multiple images on one film.
Important Relationship
Cassette Spot Filming
Cassette spot-film devices are a means of recording static images during an image-intensified fluoroscopic examination. The unit shifts to radiographic mode (using a higher mA), and the radiation dose to the patient is much higher than in the fluoroscopic mode.
Film cameras (sometimes called photo-spot cameras) have also been a mainstay of image-intensified fluoroscopy (refer back to Figure 10-11). 105 mm film or 70 mm roll film are the most commonly used varieties. The photo-spot camera is also a static imaging system that is used with an optical lens system incorporating a beam-splitting mirror. When the spot-film exposure switch is pressed, the beam-splitting mirror is moved into place, diverting some of the beam toward the photo camera and exposing the film. This device uses the visible light image from the output phosphor of the image intensifier and photographically exposes the 105 mm (or 70 mm) film, similar to a 35 mm film camera used in photography. This system allows very fast imaging of up to 12 frames per second, and because it “photographs” the image off of the output phosphor of the image intensifier, it requires approximately half the radiation dose of the cassette spot-filming system.
With image-intensified fluoroscopy, videotape or DVD recording is an option when dynamic imaging is desired. This process uses a VHS videotape or DVD recorder connected to the television monitor. From this point, it operates quite similar to a home recording system. During fluoroscopic examinations, the “record” button is pressed on the system, and it records the image from the monitor. Although not typically used in today’s fluoroscopic systems, such imaging is useful in functional studies of the esophagus or for placement of catheters or medical devices.
As more departments transition to fully digital environments and eliminate film and chemical processing, a greater dependence is being placed on digital imaging and storage means. Without chemical processing and film, cassette spot filming and photo-spot imaging go away. If the fluoroscopic signal is in digital form, the size of the data files makes it impossible to record any length of dynamic images on a VHS tape.
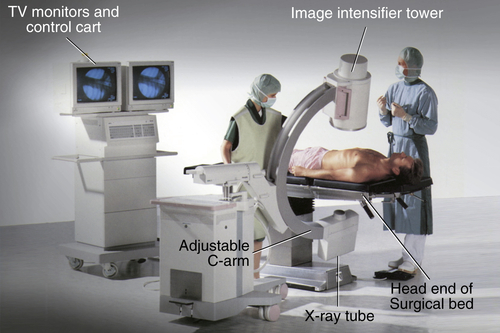
Mobile C-arm Units
Mobile C-arm units have fluoroscopic capabilities that are typically used in the operating room when imaging is necessary during surgical procedures. Display monitors are also included, offering both static and dynamic imaging during the procedure. Because it is a fluoroscopic system, many of the features of a fixed fluoroscopic unit are also made available with a C-arm. A C-arm unit is designed with an x-ray tube and image intensifier attached in a C configuration (Figure 10-12). As a result, the unit can be positioned in a variety of planes, enabling viewing from different perspectives. Generally, three sets of locks are provided to move and hold the C-arm in place. One set moves the entire “c” toward or away from the base (the equivalent of moving a table side to side). Another set allows the “c” to pivot about its axis (the equivalent of angling a general radiographic tube head assembly). The last set allows the “c” to slide along its arc (the equivalent of moving the patient from anteroposterior or posteroanterior positions to oblique to lateral positions without having to move the patient).
FIGURE 10-12 A mobile C-arm unit.
As a general rule, the x-ray tube should be positioned under the patient and the image intensifier above the patient. Positioning the C-arm in this manner during the imaging procedure reduces the radiation exposure to the operator. Because the C-arm uses fluoroscopy, standard radiation exposure techniques and safety practices used during fluoroscopy in the radiology department must also be adhered to during operation of a C-arm unit. The radiographer should also pay particular attention to the distance between the patient and the x-ray tube as well as to total fluoroscopy time. Here, too, fluoroscopy is being used in an “uncontrolled” environment, and it is the radiographer’s responsibility to monitor and apply radiation safety measures.
Digital Fluoroscopy
Similar to image-intensified fluoroscopy, digital fluoroscopy has evolved over time. Early versions of digital fluoroscopy used an image-intensified fluoroscopic chain but added an analog-to-digital converter (ADC) and a computer between the TV camera and the monitor (Figure 10-13). An analog-to-digital converter (ADC) is a device that takes the video (analog) signal and divides it into a number of bits (1s and 0s) that the computer “understands.” The number of bits into which the signal is divided determines the contrast resolution (number of shades of gray) of the system. The ADC is necessary for the computer to process and display the image. Once in digital form, the image can be postprocessed and stored in that format or printed onto film using a dry laser printer.
The incorporation of a CCD into this setup further improved digital fluoroscopy. The CCD eliminated some of the problems associated with the camera tube. The CCD is more light sensitive (higher detective quantum efficiency [DQE]) and exhibits less noise and no spatial distortion. It also has a higher spatial resolution and requires less radiation in the system, reducing patient dose.
A more recent advance in digital fluoroscopy is the introduction of a flat-panel detector in place of an image intensifier (Figure 10-14). Two forms of flat-panel detectors may be used for fluoroscopic applications: the cesium iodide amorphous silicon indirect-capture detector and the amorphous selenium direct-capture detector. For use as a dynamic digital detector (i.e., in digital fluoroscopy applications), there are a few differences between the two. Generally, the digital detectors must respond in rapid sequences to create a dynamic image. Current dynamic digital detectors are capable of up to 60 frames per second. To accomplish this, rapid readout speeds (by which the active matrix processes the image data) are necessary.
FIGURE 10-13 Analog and digital signals in fluoroscopy. The video signal from the television camera is analog, where the voltage signal continuously varies. This analog signal is sampled (a), producing a stepped representation of the analog video signal (b). The numerical values of each step are stored (c), producing a matrix of digital image data. The binary representation of each pixel value in the matrix is stored and can be manipulated by a computer. The value of each pixel can be mapped to a brightness level for viewing on a display monitor or to an optical density for hard copy on film.
FIGURE 10-14 Digital fluoroscopy using flat-panel-detector technology.
Currently, the most commonly used flat-panel detector for fluoroscopic applications is the cesium iodide amorphous silicon indirect-capture detector. The scintillator of this system uses cesium iodide or gadolinium oxysulfide as the phosphor. The photodetector is amorphous silicon, which is a liquid that can be painted onto a substrate (foundation or underlying layer) and is the material that makes flat-panel detectors possible. The other component is a TFT array. TFTs are electronic components layered onto a glass substrate that includes a readout, charge collector, and light-sensitive elements. The panel is configured into a network of pixels (or detector elements [DELs]) covered by the scintillator plate with each pixel containing a photodetector and a TFT. With this system, x-ray energy is absorbed by the scintillator and converted to light energy. This light is then absorbed by the photodetectors and converted to electrical charges, which are in turn captured and transmitted by the TFT array to the monitor for display.
Flat-panel detectors are very popular in interventional and cardiology applications and are gaining ground in general fluoroscopy. They are much lighter and more compact, they produce a digital signal directly (no need for a camera tube or ADC), and because it is a digital system producing a digital signal (without the electronic components of the old image-intensified system), there is less electronic noise. Detector arrays are currently available in sizes of 25 × 25 cm to 40 × 40 cm.
Although the cesium iodide amorphous silicon indirect-capture detector is essentially the same as that for DR, there are a few differences for use as a dynamic digital detector in digital fluoroscopy applications. In general, dynamic versions of these detectors must respond in rapid sequences to create a dynamic image. Current dynamic versions are capable of up to 60 frames per second. To accomplish this, rapid readout speeds (how the active matrix processes the image data) are necessary. The design is a two-dimensional rectilinear array of pixels that can be electronically processed line by line in a fraction of a second. Furthermore, for fluoroscopic applications, very-low-noise flat-panel-detector systems are needed. Fluoroscopy generally operates at a low dose output; hence, any operational noise degrades the fluoroscopic image, making noise a greater factor in detectors used for this application.
The use of flat-panel detectors in place of an image intensifier offers several advantages. The first is a reduction in the size, bulk, and weight of the fluoroscopic tower. A flat-panel detector greatly reduces all three, allowing easier manipulation of the tower, greater flexibility of movement, and greater access to the patient during the examination. A flat-panel detector with a 12” × 16” active area occupies less than 25% of the volume of a 12” image intensifier tube and less than 15% of the volume of a 16” image intensifier tube. The flat-panel detectors also replace the spot filming and other recording devices. They are capable of operating in radiographic mode, so that in many cases, additional radiographic images are not needed. The images, both dynamic and static, are recorded by the system and can be readily archived with the patient record in a Picture Archiving and Communication System (PACS). It should be noted that the images produced are very large data files, as spot images can be 8 MB or larger and dynamic images as large as 240 MB per second. Furthermore, flat-panel detectors do not degrade with age; are more durable; present a rectangular field providing more information; and have better contrast resolution, higher DQE, wider dynamic range, and all the postprocessing options common to digital images. The spatial resolution of flat-panel detectors is the same for all field of view options provided binning (the process of grouping and averaging adjacent DELS) is not used and is higher than that of an image-intensified system (2.5–3.2 Lp/mm versus 1–2 Lp/mm). Finally, flat-panel detectors do not exhibit most image artifacts seen with image intensifiers. Flat-panel detectors have a 60 times larger operational dynamic range than image intensifier systems and, because of this, do not exhibit veiling glare. Because the DELs of a flat-panel detector are arranged in a grid pattern (uniform columns and rows), they do not exhibit the pincushion and S distortion artifacts. Vignetting (unequal brightness) and defocusing artifacts are also eliminated with flat-panel detectors. They do all of this with as much as a 50% lower radiation dose to the patient.
Important Relationship
Digital Fluoroscopic Systems
The use of flat-panel detectors in place of an image intensifier offers several advantages, such as a reduction in the size, bulk, and weight of the fluoroscopic tower, allowing for easier manipulation of the tower and greater access to the patient during the examination. The flat-panel detectors also replace the spot filming and other recording devices, and, because they are capable of operating in radiographic mode, in many cases, additional radiographic images are not needed. The images, both dynamic and static, can also be readily archived with the patient record in a PACS.
The mA used to operate a digital fluoroscopic unit is similar to the mA used in the radiographic mode, in the hundreds, as opposed to image intensified fluoroscopy in the low mA range. In addition, the x-ray beam is not continuously operated, but is rather automatically pulsed to reduce the heat loading on the tube. Similar to image-intensified fluoroscopy, the average exposure to the image receptor or detector signal needs to be maintained in order to produce a diagnostic-quality digital fluoroscopic image. Generator controls, such as automatic dose rate and automatic exposure rate, are similar to the concept of automatic brightness control (ABC) previously discussed. These controls change the kVp, mA, or both in combination to adjust the exposure factors to maintain the brightness and contrast needed for the fluoroscopic image. Maintaining the average exposure or signal to the image receptor will also vary the radiation dose to the patient and therefore the operator needs to monitor any available dose measurements displayed.
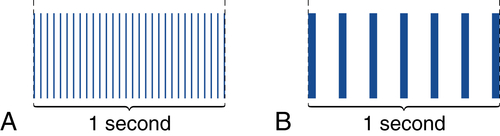
Continuous Versus Pulsed Fluroscopy
With modern image-intensified fluoroscopic units, the operator has the option of selecting a continuous or pulsed x-ray beam during the fluoroscopic procedure (Figure 10-15). When operated in the continuous fluoroscopy mode, the x-ray exposure continues without interruption while the exposure pedal/button is activated. This results in 30 frames of fluoroscopic images each second. When a fluoroscope is operated in the continuous mode, the patient receives a high amount of radiation exposure due to the increased number of fluoroscopic images. In addition, because there are many more images per second, patient motion may be visible.
Important Relationship
Continuous Fluoroscopy
Operating the fluoroscope in a continuous mode will produce 30 frames of images each second, increase patient dose, and may increase the visibility of patient motion.
FIGURE 10-15 Continuous versus Pulsed Fluoroscopy. A, Continuous fluoroscopy produces 30 images (frames) during a period of 1 s. B, Pulsed fluoroscopy can vary the number of images (frames) per second. This example has 7 frames per second.
Operating in a pulsed fluoroscopy mode means the x-ray exposure is not continuous and has gaps of no exposure between each image frame. These units may have several options in the pulsed mode, such as selecting the number of images (frames) per second or pulse rate (for example between 2–15 frames per second). The operator selects the pulse rate and the x-ray exposure pulses automatically occur while the fluoro pedal/button is depressed. When pulsed fluoroscopy is used, exposure parameters (kV and mA) are increased to maintain a satisfactory signal-to-noise ratio (SNR) for a quality image. However, because there are fewer image frames per second when compared to continuous fluoroscopy, the patient dose can be reduced. In addition, using the pulsed fluoroscopic mode will decrease the visibility of patient motion. It is recommended to use the lowest pulsed fluoroscopic mode required for the specific procedure.
A related feature of modern fluoroscopic units is the dose rate feature, low to high. Using a low fluoroscopic dose rate will reduce the dose to the patient but at the cost of increased noise in the images. Using a higher dose rate will reduce image noise but increase the dose to the patient. The operator needs to understand these features and how they affect patient dose. For example, if the lowest pulsed mode is used along with a high dose rate, patient dose is higher, when compared to a lower pulse mode and low dose rate.
Important Relationship
Pulsed Fluoroscopy
Operating the fluoroscope in a pulsed mode will reduce the number of images each second, decrease patient dose, and reduce the visibility of patient motion.
Radiation Safety
Radiation safety is just as important during fluoroscopic imaging as it is with radiographic imaging. It is the fluoroscopic operator’s responsibility to be knowledgeable about the equipment and methods to reduce patient radiation dose. A few methods of minimizing radiation dose to the patient during fluoroscopic procedures include omission of the grid during fluoroscopy, minimal use of the magnification feature, and the use of the last image hold where the x-ray exposure is not activated while the operator reviews the image.
Because older image-intensified fluoroscopic units use a continuous stream of x-rays, the exposure should be intermittently pulsed by the operator. Applying pressure to the exposure switch or pedal intermittently significantly reduces the exposure of both patients and personnel and reduces the heat load on the x-ray tube. Modern image-intensified and digital fluoroscopy use a controlled pulsed x-ray exposure, and the operator is not required to intermittently release the pressure. Operating the fluoroscope in the lowest pulsed mode along with a lower dose rate will minimize patient radiation dose.
Time, distance, and shielding are the standard radiation safety practices used during fluoroscopic imaging. Reducing the x-ray exposure time reduces the exposure to the patient and any personnel remaining in the room. The control panel timer produces an audible noise when 5 min of x-ray fluoroscopic time have been used. It is the operator’s responsibility to minimize the x-ray fluoroscopy, and the radiographer should document the total amount of x-ray fluoroscopic time used during the procedure. Modern fluoroscopic units provide dose monitoring in addition to the cumulative fluorotimer. The dose area product (DAP) and cumulative air kerma (kinetic energy released in a mass) provides radiation exposure data and need to be recorded in the patient’s medical record. If these dose-monitoring systems are not available, then the cumulative exposure time and number of acquired images need to be documented. In addition, the intensity of the x-ray exposure at the tabletop should not exceed 10 R per minute for units equipped with ABC and 5 R per minute for units without ABC. Whenever the patient’s exposure is reduced, personnel exposure also is reduced.
TABLE 10-1
Methods of Reducing Patient and Personnel Exposure During Fluoroscopy
• Operating the fluoroscope in the lowest pulsed mode along with a lower dose rate and the use of last image hold will minimize patient radiation dose.
• Reducing the amount of x-ray fluoroscopic time reduces patient and personnel exposure.
• Increase collimation, remove the grid, and minimize the use of magnification.
• Monitor and document the amount of total x-ray fluoroscopic time displayed in 5 min increments on the control panel in addition to the number of acquired radiographic images. If provided, cumulative radiation dose data should be recorded.
• The intensity of x-ray exposure at the tabletop should not exceed 10 R/min for units equipped with ABC and 5 R/min for units without ABC.
• The SSD should be not less than 38 cm (15 in) for stationary fluoroscopic units and not less than 30 cm (12 in) on mobile C-arm fluoroscopic units.
• Personnel in the fluoroscopic room during procedures should increase their distance from the patient to reduce exposure to scatter radiation.
• Personnel should wear appropriate lead shielding during fluoroscopic procedures.
• The Bucky slot cover must contain at least 0.25 mm of lead-equivalent shielding and cover the opened space on the side of the table.
• A protective curtain placed between the patient and operator must have at least 0.25 mm of lead equivalent.
The source-to-skin distance (SSD) should be no less than 38 cm (15 in) for stationary fluoroscopic units and no less than 30 cm (12 inches) on a mobile C-arm fluoroscopic unit. Increasing the SSD and decreasing the distance between the patient and the image receptor (OID) will decrease patient exposure. Increasing collimation and decreasing the number of acquired (radiographic) images will reduce patient exposure. If the fluoroscopic unit has features such as virtual collimation (x-ray field size can be adjusted without irradiating the patient) and the ability to save a sequence of fluoroscopic images without acquiring radiographic images, patient exposure will be further decreased. In addition, personnel other than the operator should increase their distance from the patient to reduce exposure to scatter radiation from the patient.
In addition to all personnel in the room wearing lead aprons (recommended 0.5 mm of lead equivalent), two additional types of shielding are required during fluoroscopy. Because the Bucky tray is positioned at the end of the table for operation of the under-table x-ray tube, a Bucky slot cover with at least 0.25 mm of lead equivalent should automatically cover the opened space at the side of the table. In addition, a protective lead curtain with at least 0.25 mm of lead equivalent must be placed between the patient and the operator to reduce exposure to the operator. Table 10-1 lists methods of reducing patient and personnel exposure during fluoroscopy.
Quality Control
Quality control programs are vitally important for all ionizing-radiation-producing equipment to monitor equipment performance and minimize patient dose. Fluoroscopic equipment is used extensively in health care and contributes significantly to the radiation dose received by the general population. Quality control is a team effort among the radiographer, radiologist, and medical physicist. Although some equipment monitoring and data may be collected by a radiographer, performance tests and their interpretation are typically performed by a medical physicist. However, the radiographer should be familiar with the monitoring and testing necessary to ensure that the fluoroscopic unit is operating correctly.
BOX 10-3Quality Control (QC) Specific to Fluoroscopic Equipment
QC Test
Description
Fluoroscopic system resolution
Tests the system’s ability to display details of small objects (high-contrast resolution) and larger objects (low-contrast resolution).
Fluoroscopic automatic brightness control (ABC) performance
Evaluates image quality for changes in exposure parameters such as high dose rate, pulsed modes, and field of view (FOV)
Fluoroscopic phantom image quality
Evaluates the quality of the displayed fluoroscopic image, including image distortion or lag.
Fluoroscopic exposure rates
Measures the intensity of the x-ray beam. Fluoroscopic exposure rate should not exceed 10 R/min for units with ABC systems and 5 R/min for those without ABC systems.
Fluoroscopic alignment test
Ensures the radiation beam aligns with the center of the image intensifier within 2% of the SID.
Patient dose monitoring system calibration, if present
Evaluates proper function of patient dose monitoring systems such as DAP meters.
Digital monitor performance
Evaluates the display characteristics of the monitor (described in Chapter 4)
The radiographer, in particular, a quality control radiographer, may be responsible for the operational inspection of the equipment. This inspection should be conducted using a checklist of the items found in Box 10-2 at least every 6 months. The radiographer may also be responsible for an inspection of the imaging suite itself to examine the general physical condition of the room, unit, supporting electrical cables, and control booth, noting any wear or deterioration. This inspection of the physical condition should be placed on the same schedule and conducted along with the operational inspection.
The other important part of the quality program is the performance inspection and equipment testing (Box 10-3 lists a few common fluoroscopic quality control tests). Although a quality control radiographer may perform some of these tests, an appropriately trained and licensed medical physicist should conduct and interpret this portion of the program and oversee the entire quality control monitoring program.
Chapter Summary
• Fluoroscopy allows imaging of the movement of internal structures by its use of a continuous beam of x-rays.
• Image intensification provides a brighter image for viewing. The exit radiation is absorbed by the input phosphor, converted to electrons, sent to the output phosphor, released as visible light, and converted to an electronic video signal for transmission to the television monitor.
• Brightness gain is the product of flux gain and minification gain and results in a brighter image on the output phosphor.
• Automatic brightness control (ABC) maintains the overall appearance of the image by monitoring the current through the image intensifier or the output phosphor intensity and adjusting exposure factors if the monitored values fall below preset levels.
• Image intensifiers provide a multifield mode that magnifies the image. When operating the unit in the magnification mode, spatial resolution improves but patient exposure increases.
• To view the fluoroscopic image on a television monitor, it must be converted to an electrical signal by a camera tube or charge-coupled device (CCD).
• Cassette spot film, photo-spot cameras, cine film, and videotape/DVD are all methods of recording static or dynamic images during image-intensified fluoroscopy.
• Cassette spot filming shifts to the radiographic mode using a higher mA and increases patient exposure.
• A C-arm unit is designed with an x-ray tube and image intensifier attached in a C configuration. As a result, the unit can be positioned in a variety of planes, enabling viewing from different perspectives.
• Digital fluoroscopy can be accomplished by attaching an analog-to-digital converter (ADC) between the camera tube or CCD and the television monitor.
• The use of flat-panel detectors in place of an image intensifier offers several advantages, such as reductions in the size, bulk, and weight of the fluoroscopic tower, allowing easier manipulation of the tower and greater access to the patient during the examination.
• Flat-panel detectors also replace spot filming and other recording devices, and, because they are capable of operating in radiographic mode, in many cases, additional radiographic images are not needed. The images, both dynamic and static, can also be readily archived with the patient record in a PACS.
• Image-intensified fluoroscopy uses a lower mA (0.5–5 mA), whereas digital fluoroscopy uses a higher mA (100–1200 mA). Digital fluoroscopy uses a pulsed x-ray beam, whereas older image intensifiers operate as a continuous x-ray beam exposure unless the operator produces intermittent x-ray exposures.
• Radiation safety practices include reducing the amount of fluoroscopic time and shielding the operator with the Bucky slot cover and a protective curtain placed between the patient and the operator. The source-to-skin distance (SSD) should be not less than 38 cm (15 in) for stationary fluoroscopic units and not less than 30 cm (12 in) on a mobile fluoroscopic unit, and the intensity of the x-ray exposure at the tabletop should not exceed 10 R/min.
• Quality control procedures are important for monitoring the performance of the fluoroscopic unit.
 Important Relationship