Appendix D
Answer Key for Chapter 9: Image Evaluation
 Activity 1
Image Quality
Digital
An optimal digital image of the hip was produced using the following exposure technique:
| 200 mA | 12:1 grid ratio |
| 50 ms | CR image receptor |
| 70 kVp | 8×12 in collimation |
| 40-inch SID | Patient thickness 10 cm |
| 0.6 mm small focal spot | Minimal OID |
Without compensation, the proposed changes are made one by one. On the following chart, indicate the effect, if any, that each change has on the exposure to IR, contrast, and spatial resolution of the radiographic image.
1. If the exposure to the IR, contrast, or spatial resolution of the image is increased, mark a + in the space provided.
2. If the exposure to the IR, contrast, or spatial resolution of the image is decreased, mark a − in the space provided.
3. If the exposure to the IR, contrast, or spatial resolution of the image is unchanged, mark a 0 in the space provided.
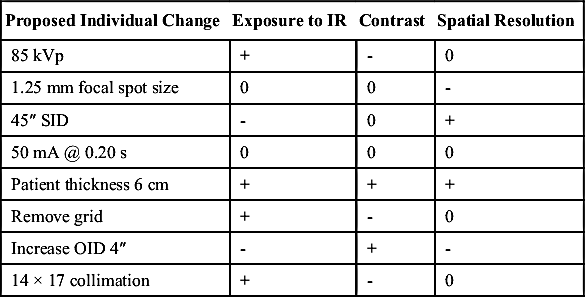
Activity 2
Image Quality
Film
An optimal film radiograph of the pelvis was produced using the following exposure technique:
| 100 mA | 12:1 grid ratio |
| 0.5 s | 400 speed F/S |
| 70 kVp | 14×17 in collimation |
| 40-inch SID | Patient thickness 14 cm |
| 1.25-mm large focal spot | Minimal OID |
| 92° F development temperature | |
| 90-s processing time |
Without compensation, the proposed changes are made one by one. On the following chart, indicate the effect, if any, that each change has on the density, contrast, and recorded detail of the radiographic image.
1. If the radiographic density, contrast, or recorded detail of the image is increased, mark a + in the space provided.
2. If the radiographic density, contrast, or recorded detail of the image is decreased, mark a − in the space provided.
3. If the radiographic density, contrast, or recorded detail of the image is unchanged, mark a 0 in the space provided.
| Proposed Change | Density | Contrast | Recorded Detail |
| Increase SID to 48″ | - | 0 | + |
| Use 200 mAs | + | -∗ | 0 |
| Increase kVp to 80 | + | - | 0 |
| Film-screen speed 200 | - | 0 | + |
| Increase patient thickness to 18 cm | - | - | - |
| 10 × 12 in collimation | - | + | 0 |
| Development temperature decreased | - | - | 0 |
| Patient moves during exposure | 0 | 0 | - |
| Angle tube 20° | - | 0 | - |
| Change to 8:1 grid ratio | + | - | 0 |
| Use 0.6 mm focal spot size | 0 | 0 | + |
| Increase OID 3″ | - | + | - |

Activity 3
Image Quality Calculations
Solve for the missing variable or calculate the new exposure factor to maintain exposure to the IR as in the initial exposure technique. Show all calculations.
mAs
15% rule
| Initial kVp = 70 | Initial kVp = 80 | Initial kVp = 75 |
| Initial mAs = 10 | Initial mAs = 100 | Initial mAs = 35 |
| New kVp = 70 + 15% = 80.5 | New kVp = 80 − 15% = 68 | New kVp = 75 + 2(15%) = 99.19 |
| New mAs = 5 | New mAs = 200 | New mAs = 8.75 |
| 70 × 1.15 = 80.5 kVp | 80 × 0.85 = 68 kVp | 75 × 1.15 = 86.25 × 1.15 = 99.19 kVp |
| 10 ÷ 2 = 5 mAs | 100 × 2 = 200 mAs | 35 ÷ 2 = 17.5 ÷ 2 = 8.75 mAs |
mAs-Distance Conversions
| Initial mAs = 100 | Initial time = 0.5 s | Initial mAs = 125 |
| Initial SID = 40 in | Initial SID = 60 in | Initial SID = 56 in |
| New SID = 72 in | New SID = 25 in | New SID = 40 in |
| New mAs = 324 | New time = 0.0868 | New mAs = 63.78 |
 |  |  |

Grid Conversions


Film-Screen Speed (F/s Spd.)
| Initial mAs = 25 | Initial mAs = 10 | Initial time = 0.25 |
| Initial F/s Spd. = 200 | Initial F/s Spd. = 600 | Initial F/s Spd. = 100 |
| New F/s Spd. = 400 | New F/s Spd. = 300 | New F/s Spd. = 50 |
| New mAs = 12.5 | New mAs = 20 | New time = 0.5s |
| Table Continued | ||

 |  |  |
| X = 12.5 mAs | X = 20 mAs | X = 0.5 s |

Word Problems
1. A digital image of the hip was created using 75 kVp @ 5 mAs, a 12:1 grid, a 40-inch SID and a small focal spot size. The exposure indicator value denotes insufficient exposure to the IR and the image displays excessive noise. What adjustments to the exposure technique would improve the quality of the image if repeated?
A general rule of thumb for insufficient exposure to the IR is to double the mAs. Because exposure indicators vary by manufacturer, it is important for the radiographer to assess how far the exposure indicator is below its desired value and then adjust the mAs appropriately.
2. During a fluoroscopic procedure, the radiation exposure is 50 mR at a distance of 100 cm from the radiation source. Calculate the radiation exposure at a distance of 150 cm.
Using the Inverse Square Law:

3. A good-quality AP pelvis image was created in the radiology department using 80 kVp @ 15 mAs, a 40-in SID, and a 12:1 grid ratio. A request to image a similar-sized patient’s pelvis with the mobile x-ray unit requires the SID to be increased to 48 in and the use of an 8:1 grid ratio. What adjustments in the exposure technique would provide a similar quality image?
Assuming that the mobile unit has a comparable radiation output to the stationary x-ray unit, calculate the new mAs for changes in SID and grid ratio:
a. 15 m A s X = ( 40 ) 2 ( 48 ) 2 ; 2304 × 15 = 1600 X ; 34,560 1,600 = X ; X = 21.6 m A s 
b. 21.6 m A s X = 5 4 ; 21.6 × 4 = 5 X ; 86.4 5 = X ; X = 17.28 m A s 
4. A good-quality KUB image was created on a patient measuring 10 cm using 80 kVp @ 20 mAs, a 40-in SID, a 12:1 grid, and a large focal spot size. What adjustment in exposure technique would be done if the next patient requiring a KUB measured 15 cm?
A general rule of thumb for patient variations is to adjust the mAs by a factor of 2 for every 4-5 cm change in thickness:
80 kVp @ 40 mAs (20 mAs × 2), 40” SID, 12:1 grid, and a large focal spot size
Activity 4
Image Quality Exposure Conversions
Calculate the new exposure factor to maintain a similar exposure to the IR as in the initial exposure technique. Show all calculations.
| Initial Digital Exposure Technique | New Digital Exposure Technique | |
| 100 mAs | 40.82 mAs | |
| 80 kVp | TO | 58 kVp |
| 12:1 grid | No grid | |
| 56-in SID | 40-in SID |
Calculations
1. The kVp is decreased by 15% twice and requires a factor of 2 increase of the mAs for each decrease.


2. The grid is removed and requires a decrease in mAs.

3. The SID is decreased and requires a decrease in mAs.

Activity 5
Image Quality Exposure Conversions
Calculate the new exposure factor for maintaining a similar exposure to the IR as in the initial exposure technique. Show all calculations.
| Initial Film-Screen Exposure Technique | New Film-Screen Exposure Technique | |
| 200 mA | 261.4 mA | |
| 0.05 s | ⅕ s | |
| 65 kVp | TO | 75 kVp |
| 6:1 grid | 8:1 grid | |
| 40-in SID | 56-in SID | |
| 400 F/S speed | 100 F/S speed |
Calculations
1. The kVp is increased by 15% and requires a decrease in mAs by a factor of 2:

2. The grid ratio is increased and requires an increase in mAs:

3. The SID is increased and requires an increase in mAs:

4. The film-screen speed is decreased and requires an increase in mAs:

5. The new mA needs to be calculated:

Image Evaluation
The ability to recognize exposure technique errors and their resultant effects on the radiographic image is an important problem-solving skill. The following exercises provide you with an opportunity to apply the knowledge gained from previous chapters in identifying causes of poor-quality images for both digital and film-screen IRs.
Activity 6
Image Evaluation
Matching
One of the four computed radiography (CR) images is of good quality, whereas the others are the results of errors. Match each image with its corresponding statement:


Activity 7
Image Evaluation
Multiple Choice
Select the most likely exposure technique error responsible for the poor-quality image, and write your answer in the middle column:


Image Analysis
The ability to evaluate image quality and problem solve for improvement involves several skills. Knowledge of how exposure factors affect image quality individually and in combination is the first step toward successful problem solving. In addition, the ability to accurately calculate exposure factor changes is necessary for improving image quality.
The following image quality exercises are opportunities to develop problem-solving skills by applying the knowledge learned in previous chapters.
Activity 8
Image Analysis
Film Image Evaluation: Image Quality Analysis
Radiograph 1
kVp = 70
F/S speed = 400
mAs = 4
Grid ratio = 12:1
SID = 40 in
Focal spot = small
Optical density = 1.04

Radiograph 2
kVp = 60
F/S speed = 100
mAs = 6.3
Grid ratio = 6:1
SID = 34 in
Focal spot = large
Optical density = 0.30

Evaluation:
• Visually compare Radiograph 1 and Radiograph 2, and comment on the quality of the density, contrast, and sharpness of Radiograph 2. State whether Radiograph 2 needs to be repeated and explain why.
• Evaluate each change in exposure factor, and discuss its appropriateness and how it affects the density, contrast, or sharpness (even if not apparent) of the image and patient exposure.
• Calculate the appropriate mAs value for each of the cumulative changes to determine why Radiograph 2 displays its level of density, contrast, and sharpness.
• Identify the correct mAs value that should have been used for each of the exposure factor changes to maintain density as in Radiograph 1. Last, compare the actual mAs used in Radiograph 2 with the calculated mAs value that was needed to maintain density and contrast. In addition, make other exposure factor recommendations to improve the quality of the image.
Calculate and Respond
➢ The kVp decreased by 15% in image 2 and requires an increase in mAs by a factor of 2:

➢ The SID was decreased from 40 in to 34 in, and the mAs would need to decrease:

➢ The film-screen speed was decreased from 400 to 100 and requires an increase in mAs:

➢ The grid ratio was changed from 12:1 to 6:1, and the mAs would need to decrease:

➢ In comparing Radiograph 2 with Radiograph 1, there is decreased density in Radiograph 2. In the area of interest, Radiograph 2 had an OD of 0.30, which is below the diagnostic range. This image would be considered unacceptable and needs to be repeated because the visibility of the area of interest is too low for diagnostic interpretation.
➢ Radiograph 2 has a decrease in kVp of 15% (70 to 60), which would decrease the density and increase the contrast; an increase in mAs by a factor of 2 would be needed to compensate. The mAs would need to be 8 instead of 4. A kVp of 60 for the knee is lower than needed, and requires a higher mAs resulting in increased patient exposure.
➢ The SID was decreased from 40 in to 34 in, which would increase the radiation intensity reaching the body part and increase the density. The mAs would need to be decreased from 8 to 5.78. Decreasing the SID would also increase the magnification and decrease recorded detail in the image.
➢ The film-screen speed was decreased from 400 to 100, which would require an increase in mAs from 5.78 to 23.12. Decreasing the film-screen speed would not only increase the recorded detail in the image but also increase patient exposure.
➢ The grid was changed to a lower grid ratio from 12:1 to 6:1, which would decrease contrast because more scatter radiation reached the film and density was increased. Radiographic contrast was decreased because of the excessive scatter reaching the film. The mAs needs to be decreased to compensate and should have been 13.87 instead of 23.12. Using a lower grid ratio for the knee would decrease patient exposure.
➢ Finally, a large focal spot was used instead of a small focal spot, and this would have decreased the recorded detail in the image.
➢ After all the changes in exposure factors, Radiograph 2 is too light because 6.3 mAs was used instead of 13.87 mAs. The SID should be 40 inches to improve the sharpness in addition to using a smaller focal spot. The film-screen speed should be faster to reduce patient exposure.
Activity 9
Image Analysis
Computed Radiography Image Evaluation (Recommended S Number Between 100 and 300)
Radiograph 1
kVp = 81
mAs = 5
Focal spot = small
Grid ratio = 12:1
SID = 40 in
Central ray perpendicular
S number = 156

Radiograph 2
kVp = 59
mAs = 1.1
Focal spot = large
Tabletop = no grid
SID = 30 in
Central ray angled 20° caudad
S number = 620

Evaluation
• Visually compare Radiograph 1 and Radiograph 2, and comment on the quality of the contrast and spatial resolution of Radiograph 2. State whether Radiograph 2 should be repeated and explain why.
• Evaluate each change in exposure factor, and discuss its appropriateness and how it affected the exposure to the IR, contrast, and/or spatial resolution (even if not apparent) of the image and patient exposure.
• Calculate the appropriate mAs value for each of the cumulative changes to determine why Radiograph 2 displays its level of contrast, spatial resolution, and S number.
• Identify the correct mAs value that should have been used for each of the exposure factor changes to maintain the quality as in Radiograph 1. Last, compare the actual mAs used in Radiograph 2 with the calculated mAs value that was needed to maintain sufficient exposure to the IR. In addition, make other exposure factor recommendations to improve the quality of the image.
Calculate and Respond
➢ The kVp decreased by 15% twice in image 2 and would require an increase in mAs by a factor of 4:

➢ The SID was decreased from 40 in to 30 in, and the mAs would need to decrease:

➢ The grid ratio was removed, and the mAs would need to decrease:

➢ In comparing Radiograph 2 with Radiograph 1, the brightness levels are similar; however, the contrast is decreased, and there is an increase in quantum noise visible. This image would be considered unacceptable and needs to be repeated because the visibility of the area of interest is too low for diagnostic interpretation.
➢ Radiograph 2 has a decrease in kVp of 15% twice (81 to 59), which would decrease the exposure to the IR and increase contrast; an increase in mAs by a factor of 4 would be needed to compensate. The mAs would need to be 20 instead of 5. A kVp of 59 for the hip is lower than needed, which requires more mAs and results in increased patient exposure.
➢ The SID was decreased from 40 inches to 30 inches, which would increase the radiation intensity reaching the anatomic part and IR. The mAs would need to be decreased from 20 to 11.25. Decreasing the SID would also increase magnification and decrease spatial resolution in the image.
➢ The grid was removed, which would decrease contrast because more scatter radiation reached the IR, thereby reducing radiographic contrast by adding fog to the image. The mAs would need to be decreased to compensate and should be 2.25 instead of 11.25. A grid should be used with the hip because of the amount of scatter radiation reaching the IR. However, removing the grid requires a decrease in mAs, and this would reduce patient exposure.
➢ A large focal spot was used instead of a small focal spot, and this would decrease the spatial resolution in the image.
➢ The central ray was angled 20° caudad, which caused increased shape distortion and decreased the spatial resolution in the image.
➢ In comparing the S number between the two images, the S number is increased from 156 in Radiograph 1 to 620 in Radiograph 2. This indicates a low exposure to the IR and is outside of the recommended range for the hip.
➢ After all the changes in the exposure factors, the mAs should have been 2.25 mAs instead of the 1.1 mAs actually used in Radiograph 2. The insufficient exposure to the IR is indicated by the high S number. The brightness was maintained in Radiograph 2 as a result of automatic rescaling during computer processing. The SID should be 40 in to improve the spatial resolution in addition to using a smaller focal spot and remove the 20°- central ray angulation.