Chapter 29 Hemodialysis and Extracorporeal Blood Purification
Intermittent hemodialysis is an extracorporeal renal replacement therapy (RRT) used primarily to manage the biochemical and fluid disorders of uremia. Hemodialysis was performed first in experimental dogs in 19131,57 and now is established as the foundation for the management of end-stage kidney disease in human patients.78 Hemodialysis has been described in dogs for nearly this same period, but only recently has it transitioned from clinical obscurity to the advanced standard for the management of acute renal failure in dogs and cats.34,38,59,96 The demand for hemodialysis in veterinary therapeutics has expanded rapidly in the past 10 years, and today hemodialysis facilities have been established throughout the United States as well as in Brazil, India, Israel, Italy, Switzerland, Thailand, Portugal, and Japan for applications in companion animals. The dog and cat equally share the demand and use of therapeutic hemodialysis, and extracorporeal techniques and equipment for the delivery of hemodialysis are safe and effective for animals as small as 1.5 kg and or as large as 600 kg. Diverse creatures from tortoises and rabbits to sheep and horses have been managed with creative modifications of the procedures and equipment devised for human application.37
The primary therapeutic application for extracorporeal therapies in animals is for the supportive management of uremia as a renal replacement therapy (Box 29-1). No conventional medical therapies can reproduce the efficacy of extracorporeal procedures for correction of the cumulative biochemical, acid-base, endocrine, and fluid disorders associated with kidney failure. Acute kidney injury is the most common indication for intermittent hemodialysis in dogs and cats. Delay in instituting dialysis leads to greater uremic symptomatology, morbidity, and recruitment of additional organ dysfunction.34,37,59 Indefinite use of intermittent hemodialysis in animals with chronic kidney disease is equally indicated, but cost and logistic realities have limited its routine use for this indication in animals in contrast to human therapeutics. Finite periods of hemodialysis may be prescribed as part of the perioperative management of animals undergoing renal transplantation. Preoperative dialysis facilitates the surgical candidacy and surgical stability of the patient. Postoperatively, hemodialysis is used in the management of delayed graft function, acute rejection, surgical complications, or pyelonephritis to support the animal until the episode has resolved. Extracorporeal therapies, including hemodialysis or hemoperfusion, alone or in combination can be used to clear toxins and toxic metabolites from animals after accidental poisoning or drug overdose.34,148,161,185 The use of extracorporeal therapies for toxin removal is gaining greater recognition as an important extension of extracorporeal techniques in veterinary therapeutics.
Box 29-1 Indications for Dialytic and Extracorporeal Therapies in Animals
Acute Kidney Injury
2. Failure of fluid administration or diuretic therapy to initiate an adequate diuresis
3. Failure of conventional therapy to control the azotemia, biochemical, or clinical manifestations of acute uremia
4. Life-threatening fluid overload
5. Life-threatening electrolyte (hyperkalemia, hypernatremia, hyponatremia) or acid-base disturbances
6. Severe azotemia—BUN >100 mg/dL; serum creatinine >10 mg/dL
7. Clinical course refractory to conservative therapy for 12 to 24 hours
Physical principles of hemodialysis
Dialytic therapies alter the composition of body fluids by exposing blood to a contrived solution, the dialysate, across an interposed semipermeable membrane. The mass transfer of solute and water occurs by diffusive and convective forces across the membrane, and the magnitude of the exchange is predicated on the chemical and physical characteristics of the solute and the ultrastructure of the porous membrane. Water and low-molecular-weight solutes (<500 Da) pass readily through the membrane pores, but the movement of larger solutes, plasma proteins, and the cellular components of blood are restricted by pore size and physical characteristics of the membrane.
Diffusive transfer (dialysis) occurs by the thermal motion of the molecules in each solution (blood and dialysate), causing their random encounter with the membrane and subsequent transfer through porous channels of the appropriate size. These random events are proportional to the respective concentration and thermodynamic potential of the solute on each side of the membrane, and net solute transfer is directed from the solution at higher concentration to the solution at lower concentration or thermodynamic potential. When there is no concentration gradient for a solute across the membrane, the solute is at a filtration equilibrium. At this point, the driving force for diffusion stops, and there is no further net change in concentration of the respective solutions despite ongoing bidirectional and equal molecular exchanges between them.
The diffusive potential for every solute varies under differing physiologic condition. Molecular weight is the main determinant of kinetic motion and contributes inversely to the rate of diffusion for individual solutes. Small solutes such as urea (60 Da) diffuse faster than larger solutes such as creatinine (113 Da), and generally the plasma concentration of small solutes decrease faster than those of larger solutes during the course of dialysis.47,142 The intrinsic permeability of a membrane for each solute also influences directly its diffusive potential. Membrane permeability is determined by its thickness, its effective surface area, and the number, size, and shape of its pores or diffusion channels.142 In addition to intrinsic solute and membrane characteristics, molecular charge, protein binding, volume of distribution, and cellular seclusion influence the bulk transfer of uremia toxins and solutes from the body independently from their predicted diffusion.
Convective transport of solutes across dialysis membranes is associated with the process of ultrafiltration, in which water is driven through the membrane by hydrostatic pressure gradients. Diffusible solutes dissolved in the water are swept through the membrane by solvent drag.142 Unlike diffusive transport, convective transport does not require a concentration gradient across the membrane and does not alter diffusive gradients or serum concentrations. The transmembrane hydrostatic pressure gradient between the blood and dialysate compartments, the hydraulic permeability, and the surface area of the membrane determine the rate of ultrafiltration and solute transfer. During hemodialysis, a dialysate-directed transmembrane pressure gradient (dialysate pressure < blood-side pressure) is generated to initiate and control the rate of ultrafiltration. Independent changes in the dialysate- and blood-side pressures can influence the rate of ultrafiltration by attendant changes to the transmembrane pressure. The hydraulic permeability of a dialyzer is determined by physical features of the membrane (e.g., composition, thickness, pore size) and is rated by its ultrafiltration coefficient, Kuf, defined as milliliters of fluid transferred per hour per milliliters of mercury of transmembrane pressure. Hemodialyzers are qualified as low flux or high flux according to their Kuf. A minimal transmembrane pressure of 25 mm Hg is required for ultrafiltration to offset the oncotic pressure of plasma proteins, which favors fluid reabsorption and opposes ultrafiltration. Convective transport can contribute to total solute removal, especially for large solutes with limited diffusibility. However, for standard hemodialysis, ultrafiltration primarily is targeted at fluid removal, and convective clearance contributes less than 5% to total solute removal. Convective clearance techniques are exploited further in the process of hemofiltration where solute removal occurs entirely by ultrafiltration with replacement of desired solutes and fluid with a prefilter or postfilter reinfusion solution. Hemodiafiltration and continuous renal replacement therapy (CRRT) represent hybrid treatment modalities combining both diffusive dialysis and large volume ultrafiltration to achieve solute and fluid removal.15,81
Uremia Toxins, The Role of Urea, and adequacy of hemodialysis
Uremia retention solutes (uremia toxins) are broadly classified based on their physicochemical properties as small (water-soluble) solutes (MW, <500 Da), middle molecules (>500 Da), and protein-bound solutes (>15,000 Da).178,179,180,182 The foundations for this arbitrary classification have been based primarily on their characteristics for dialytic removal.182 The volume of distribution of each of these substances further determines its compartmentalization and accessibility for dialytic removal.23,97,178,182 Hundreds of solutes have demonstrated intrinsic toxicity that mimics or reproduce particular aspects of the uremic syndrome, and thousands of retained solutes have now been demonstrated by mass spectroscopy in uremic subjects.133,177,182 Some retained solutes, such as urea, have minimal inherent toxicity but serve as markers for retention of similar but unidentified solutes with greater clinical significance.49,180
Small water-soluble solutes have demonstrated significance in the expression of uremia because both the morbidity and mortality of uremia can be corrected by their removal with conventional dialysis.179,182 Extensive prospective studies in human patients with kidney failure confirm significant outcome benefits associated with the extent of small-molecular-weight solute removal (i.e., dialysis dose).71,73,106,120,124 However, uremic toxicity is more complex than can be explained by retention of small-molecular-weight solutes and attention has refocused on retention of middle molecules and protein-bound solutes that are poorly removed by dialysis.74,77,133,177,182
There is an empirical link between the appearance of uremic signs and the accumulation of nitrogenous end-products of protein (amino acid) oxidation. Urea is a small-molecular-weight (60 Da) nitrogenous metabolite whose plasma concentration exceeds that of all other uremic solutes. It contributes minimally to the clinical manifestations of uremia86 but has remained fundamentally associated with the morbidity and outcome of uremic syndrome because of its abundance and its link to the metabolism of dietary and endogenous nitrogen.49,64 No single retention solute (including urea) has been shown to explain the major consequences of the uremic syndrome. Azotemia must be viewed as a marker for the collective appearance of numerous small water soluble compounds, protein carbamylation, redirected metabolic pathways, or other small-molecular-weight solutes coupled to nitrogen metabolism and/or bound to body proteins.
The proven correlation of urea removal by hemodialysis with outcome in renal failure has prompted the designation of urea as a surrogate index for all putative small-molecular-weight retention solutes that remain unidentified or unmeasured.49,82,120 Reduction of urea appearance and the extrarenal removal of urea are used to prescribe the therapy for uremia and to monitor the efficiency and adequacy of these therapies. 50,76,172 This designation is both rational and problematic. Urea is uncharged, present at high concentration, readily detected, and readily diffused across all body fluid compartments and the dialysis membrane. As such, it serves as an excellent solute to document dialyzer performance and whole body clearance of low-molecular-weight solutes. However, these unique features and its minimal uremic toxicity question whether it appropriately or accurately reflects the dialytic behavior of other solutes with more profound uremic toxicity and thus may overrepresent removal of these solutes.68,180,181
Dietary protein intake directly influences the generation rate (appearance) of urea, and dialytic clearance and residual renal function influence its removal from the body. Thus serum urea concentration is poised to reflect renal function and dialytic and nutritional adequacy. The individual contributions of urea generation, its removal, and its distribution volume to steady-state serum urea concentration cannot be differentiated by routine urea measurement; however, perturbations of the steady-state induced by dialysis allow kinetic dissection of these independent parameters by formal urea kinetic analysis in patients undergoing hemodialysis (Figure 29-1).48,64,141 The kinetics of urea generation and removal have become the bellwether of the adequacy assessment of dialysis delivery and nutritional status in uremic subjects. 76 The role of urea to function as a global surrogate for uremic toxicity remains controversial in light of the broader recognition and assessment of middle molecules and protein-bound solutes as retained uremia solutes. Similarly, urea assessment provides an incomplete appraisal of dialysis delivery despite its documented utility and evidence as a predictor of dialysis adequacy. Nevertheless, the clinical assessment of urea and urea kinetic modeling remain the recommended and established indices for determining adequacy and delivery of therapeutic hemodialysis.73,76,82,106,120
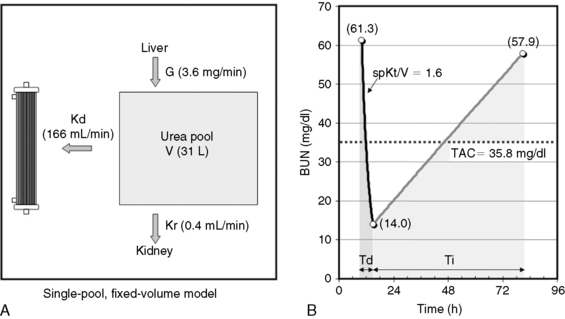
Fig. 29-1 A, Single-pool, fixed-volume kinetic model of the urea metabolism and representative modeled kinetic parameters determined in a 33-kg dog on intermittent maintenance hemodialysis consuming approximately 56 g of dietary protein. Urea is generated in the liver as the major end product of protein metabolism. The urea generation rate, G (mg of urea/min), determines the accumulation of urea in the urea pool with a volume, V (L). Its removal from the urea pool is determined by the continuous residual renal clearance, Kr (mL/min), and intermittently by hemodialysis via the urea clearance of the dialyzer, Kd (mL/min). B, Graphic illustration of a three-point BUN profile (before and after hemodialysis values in parentheses) that can be fitted to the single-pool model in the right panel. With direct measurement of renal and dialyzer urea clearances (Kr, Appendix, Equation 6 and Kd, Appendix, Equation 5, respectively), kinetic modeling allows computation of the urea generation rate (G, Appendix, Equation 9), the urea distribution volume (V, Appendix, Equation 10), and the time-average concentration of BUN (TAC, Appendix, Equation 1). The dose of dialysis expressed as the fractional clearance of the urea distribution volume using single-pool kinetics (spKt/V, Appendix, Equation 11) also can be calculated. Td is the duration of dialysis, and Ti is the duration of the interdialytic interval. AUC is the area under the BUN versus the time curve and can be estimated using a trapezoidal method or ideally calculated by fitting the changes in BUN to the kinetic model.
A variety of manipulation and mathematical models have been developed to characterize the kinetics of urea during dialysis and its relationship to adequacy.* Of these, the fractional clearance of the urea distribution volume (Kt/V) has become the standard measure for the dose of dialysis delivered during a dialysis session.76 From the same analysis, the generation rate of urea (G) can be derived to estimate the protein catabolic rate (PCR) of the patient as a measure of the adequacy of dietary protein intake, and the volume of distribution of urea (V) can be computed to better define hydration and adjustment to the dose (Figure 29-1).
Dialysis adequacy
The optimal outcome for animals with acute renal failure is survival until renal function has recovered, but secondary goals may vary qualitatively depending on the nature of the underlying disease. An optimal outcome additionally should promote physiologic and metabolic stability to facilitate recovery and promote an acceptable quality of life while minimizing secondary injury to the recovering kidneys or other organs (heart, lungs, gut, brain). As an outcome, survival is multifactorial and predicated on the diversity of the underlying cause and comorbidities, in addition to the delivered therapy. As such, outcome assessment by survival alone may be disassociated from recovery of renal function or adequate delivery of dialysis.34,149 Consequently, more sensitive and predictive outcome measures should be considered for assessment of dialysis adequacy, including recovery of renal function, improvement of the systemic manifestations of uremia, and reduction of complications attending uremia or its therapy.19
Survival is the optimal outcome for animals with end-stage renal disease because there is no prospect for recovery of renal function. Realistic outcomes for these animals that are treated with hemodialysis vary depending on age, chronicity of the disease, comorbidities, and residual renal function. Appropriate markers for dialysis adequacy include length of survival, owner perceived quality of life (e.g., activity, social interaction, appetite), elimination of uremic symptomatology (hypertension, hyperphosphatemia, anemia), nutritional adequacy, and elimination of dialysis-associated complications.
For both acute and chronic dialysis, survival is a difficult outcome parameter to correlate specifically to dialytic interventions. Yet, despite these constraints, the kinetically modeled dose of dialysis (Kt/V) has been shown to correlate independently with survival as an outcome in humans undergoing maintenance hemodialysis,73,106,120,124 and it is likely to be linked similarly to the success of dialysis in animals. The empirical use of proven standards of dialysis adequacy and clinical experience in human patients are useful first approximations for appropriate veterinary standards of dialysis adequacy until evidence-based standards are determined in animals.34,59
Quantification of hemodialysis delivery and urea kinetic modeling
The delivery (dose) and efficacy of hemodialysis can be expressed in a variety of ways with differing degrees of complexity and utility. Predialysis and immediate postdialysis concentrations of routine serum chemistries (e.g., urea nitrogen, creatinine, phosphorus, bicarbonate, electrolytes) are the simplest expression of efficacy and can be applied similarly to their use in conventional therapy (Figures 29-1 and 29-2).48,105,120,172,183 Although useful to document the instantaneous outcome of the treatment, these assessments do not facilitate the uniform prescription of dialysis to animals of differing size or metabolic status. Nor do they help to clarify the excretory impact of the therapy beyond the intradialytic interval. The predialysis and postdialysis concentrations of plasma urea and creatinine can be expressed further as reduction ratios (URR and CrRR, respectively), which are used routinely to evaluate the intensity of therapy (Appendix, Equations 2 and 3).* Urea reduction ratio (URR) can be expressed either as the fractional or percent in change in urea during the treatment and is the most universally used predictor of adequacy for dialysis sessions in animals (Figures 29-3 and 29-4; Table 29-2). The average dialysis treatment in cats and most dogs will achieve a URR approaching 95%. This high level of treatment intensity is due to a combination of relative long treatment time and relatively smaller patient size (5 to 40 kg) compared with humans in which a URR target is 60% to 65%. In very large animals (50 to 70 kg), this degree of treatment intensity is often difficult to obtain, and a URR of 80% to 85% is typical.
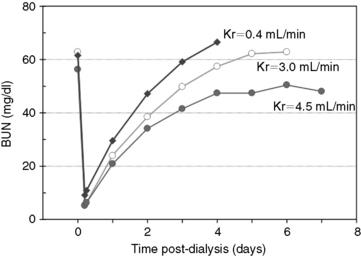
Figure 29-2 Changes in BUN during and after 5 hours of hemodialysis treatments in a 33-kg dog presented for acute antifreeze poisoning at varying degrees of residual urea clearance. The predialysis and immediate postdialysis BUN concentrations reflect a simple assessment of treatment intensity (dose). The eKt/V (approximately 2.9 per session) for the dialysis treatments was identical for each level of urea clearance, yet the rate of increase and the equilibrated BUN concentration after stopping dialysis increased inversely with residual urea clearance.
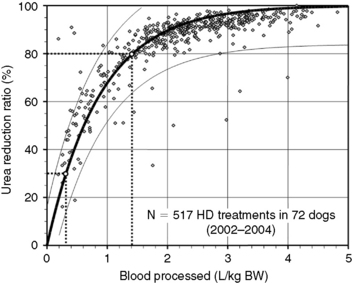
Figure 29-3 Prediction of dialysis treatment intensity (urea reduction ratio [URR]) as a function of the volume of blood processed in 72 dogs undergoing hemodialysis. URR was computed from predialysis and postdialysis BUN concentration (Appendix, Equation 2). The volume of blood processed (Qb × Td) was indexed to body weight to compare dogs of different sizes. The relation (modeled as URR = 1−e−a(Qb × Td/BW), r2 = 0.69) is displayed as a thick solid line with its 95% confidence interval (CI; thin lines). To achieve a low-efficiency treatment with URR equal to 30%, a volume of 0.3 L of blood/kg of body weight must be processed during the treatment (e.g., 6 L in a 20-kg dog). The variation in resulting URR (95% CI, 15% to 45%) underscores the necessity for close monitoring of the delivered (and not prescribed) dose of dialysis for each treatment. Similarly, a URR of 80% is obtained with 1.4 L (95% CI, 0.9 to 2.9) of blood processed per kilogram of body weight (e.g., 28 L in a 20-kg dog).
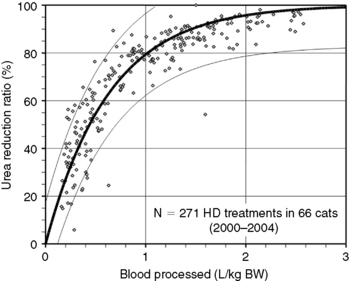
Figure 29-4 Prediction of dialysis treatment intensity (urea reduction ratio [URR]) as a function of the volume of blood processed in 66 cats undergoing hemodialysis. Other conventions are as described for Figure 29-4. The closer correlation (r2 = 0.85) between volume of blood processed and URR in cats compared with dogs is probably because of the more uniform body shape and sizes in this species.
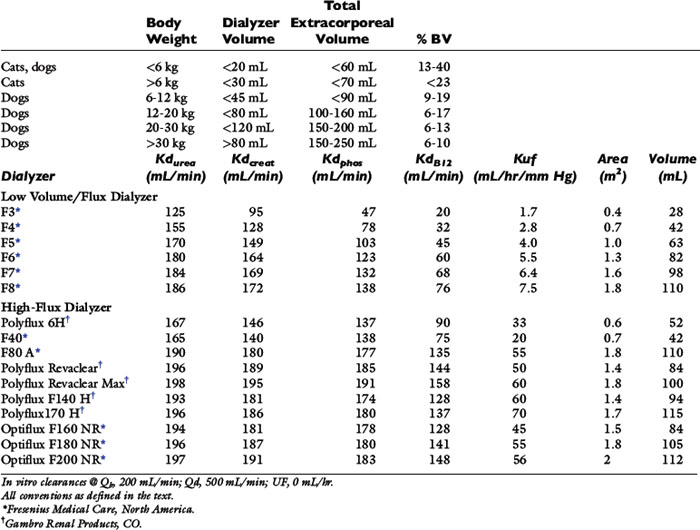
Table 29-1 Recommended Extracorporeal Volumes and Characteristics of Hemodialyzers Used for Hemodialysis in Dogs and Cats
Reduction ratios are convenient for clinical assessment but do not account for all aspects of solute transfer. Uremic toxicity and patient well-being are not predicted necessarily by the highest or lowest concentration or the intermittent change of specific retained uremia solutes.65 The integrated exposure to uremia toxins over time is considered by some a more realistic determinant of well-being and therapeutic adequacy.63,104,106,115,143 For urea, this is expressed as the time-averaged concentration (TACurea), which is calculated as the area under the BUN profile (curve) divided by the duration of the dialysis cycle (Figure 29-1; Appendix, Equation 1). TACurea has been shown to predict morbidity and outcome in human patients undergoing hemodialysis and provides an integrated overview of urea dynamics (and presumably uremia toxicity) during a single or over multiple dialysis cycles. It has been highly predictive of dialysis adequacy and outcome for survival but remains nonspecific and fails to distinguish the multifactorial contributions to urea metabolism during the dialysis cycle, including dialysis dose, urea generation, nutritional adequacy, residual clearance, and distribution volume.48,98,104,107,120
At face value, neither predialysis BUN nor TACurea are adequate surrogates to characterize the adequacy of dialytic therapy or urea metabolism. An animal with a low predialysis BUN can represent effective dialysis (high dialysis delivery), recovering renal function (increased residual renal clearance), inadequate nutrition (low urea generation rate or PCR), or volume overload (expanded urea distribution volume). Conversely, under dialysis, worsening renal function, high catabolic rate, or volume contraction can all be reflected by a high predialysis BUN.
The dose of dialysis delivered to the patient can be defined alternatively by the amount of clearance provided by the hemodialyzer during the dialysis session. Using the measured (instantaneous) clearance of the dialyzer for urea (Kd, mL/min) and the dialysis session length (Td, minutes), the dose of dialysis can be defined as Kd × Td or the volume of the patient cleared of urea (depurated volume) during the treatment (mL). This value can be indexed further to the total reservoir or distribution volume of urea in the patient (V, mL) to compare treatment efficacy among patients of different body sizes as V is equal to the patient’s total body water. This expression is analogous to conventional dosing of drugs as milligrams per kilogram of body weight. The value obtained with this kinetic expression, Kt/V, (Appendix, Equation 11) is unitless and represents the fractional clearance of the urea distribution volume.48,50,64,157,172 Kt/V has become the international reference for dialysis dosing and delivery.76
This assessment of dialysis dose and intensity advances our understanding of the delivery of dialysis during individual treatments but requires the additional measurement of Kd (Appendix, Equation 5) and the imprecise estimation of V from the patients weight and hydration status. These predictions of dialysis dose are limited by simplifying assumptions regarding urea generation, fluid removal, and solute transference during the session, which require more extensive evaluation. A more fundamental understanding and precise description of solute dynamics during dialysis can be derived from kinetic modeling of the intradialytic and interdialytic changes in BUN similar to pharmacokinetic profiles used to describe drug metabolism.48,64,141 Urea kinetic modeling (UKM) is fundamental to understanding the prescription, monitoring, and quality assurance of hemodialysis procedures and must be familiar to all practitioners of this therapeutic modality. It dissects the mutually independent influences of dialysis, residual renal function, nutrition, catabolism, and distribution volume on the intermittent perturbations in urea concentration during and between the dialysis sessions. This kinetic approach to urea metabolism also yields the fractional clearance of urea (Kt/V) as a measure of dose in addition to urea generation rate (G), protein catabolic rate (PCR), and the distribution volume of urea (V) that are ionic dialysance otherwise beyond clinical assessment.
The simplest kinetic assessment of urea during intermittent hemodialysis is represented by a single-pool, fixed-volume model, in which the entire volume of distribution of urea (i.e., total body water) is presumed to behave as a single pool with no change in volume or urea input during the treatments (see Figure 29-1). 47,48,141-143 In this simplified model, the only kinetic variable is total urea clearance (K), which represents the sum of residual renal clearance (Kr) and the clearance of the dialyzer (Kd) (see Figure 29-1; Appendix, Equations 5 and 6).186 The absolute removal of urea in this system will be reflected by the change in urea concentration at any time during dialysis such that:
where Ct is the urea concentration at time = t; C0 is the predialysis urea concentration at t = 0; K is the total urea clearance; and V is the volume of urea distribution. Rearrangement of Equation 1 provides Equation 2 for single-pool (sp) conditions,
Equation 2 is the fundamental kinetic expression for the fractional clearance of urea (dialysis dose) during a single dialysis session. In the simplified single-pool model, the kinetic prediction of dialysis dose can be derived very simply from the measured predialysis and postdialysis BUN concentrations. It must be emphasized, that this expression represents a gross oversimplification of the events and kinetic variables during therapeutic hemodialysis and should be used only to provide a rough estimate of the dialysis dose.
During a therapeutic dialysis session, the relationships between G, V, and K (illustrated in Figure 29-1) are more complex, highly interdependent, and cannot be described mathematically by a single simple relationship. Mathematical description of each variable, however, can be defined in terms of the other two with formal urea kinetic modeling (Appendix, Equations 8 through 10). When one of the variables (G, V, or K) is known, the others can be resolved by simultaneous iterative solution of the equations to yield a unique solution for the unknowns when residual renal clearance (Kr), instantaneous dialyzer clearance (Kd), ultrafiltration volume, and the measured changes in BUN during and after the treatment are known.47,48,141-143 These computations are performed easily with commercially available software or can be programmed into routine spreadsheet applications.
The simplified single-pool, fixed-volume model presumes conditions not generally valid in therapeutic dialysis sessions and loses accuracy if total body water (TBW) changes during or between treatments. The model also loses accuracy during high-efficiency treatments of short duration, when the urea distribution does not behave as a single homogenous compartment. Delayed diffusion from the intracellular compartment or variations in diffusion among discrete fluid compartments (e.g., skin, muscle, gut) with different perfusion and transference characteristics creates a solute disequilibrium between compartments that promotes a postdialysis rebound of urea that is not predicted by immediate postdialysis blood sampling.47,55,126,144 Deviations in the assumptions for single-pool, fixed-volume kinetics can be minimized by measurement of the postdialysis urea at 45 to 60 minutes after the end of the dialysis treatment rather than immediately postdialysis. By this time, intercompartmental shifts (or rebound) have reestablished solute equilibrium, and the plasma concentration reflects the equilibrated concentration of urea across all body compartments.47,151,163As stated previously, therapeutic hemodialysis deviates considerably from the single-compartment model illustrated in Figure 29-1. Retained solutes, including urea, can be distributed in multiple compartments, which are partially secluded from the dialyzer by delayed transfer or differences in regional perfusion. Most dialysis treatments also require ultrafiltration, and urea generation proceeds throughout the session which further deviate the serum urea concentration from single-pool predictions. These deviations from single-pool, fixed volume assumptions can be improved to provide greater accuracy to urea kinetic analysis by using more mathematically complex double-pool142 or noncompartmental kinetic modeling methods (Figure 29-5). The double-pool variable volume kinetic model accounts for intercompartmental solute diffusion during and after completion of hemodialysis, and dpKt/V is regarded as the standard for dialysis dose. Optionally, correction algorithms that account for these compartmental deviations have been applied to single-pool assessments using additional blood sampling and appropriate software in human patients.41,48,69 These correction formulas minimize many of the limitations of single-pool estimates but have not been validated in animals. More accurate predictions of dialysis dose also can be obtained using single-pool kinetic calculations by incorporating an equilibrated BUN obtained 45 to 60 minutes after cessation of the treatment as the end-dialysis value. Use of the equilibrated BUN in the single-pool calculations yields eKt/V as a measured dialysis dose that closely approximates the dpKt/V and better reflects whole patient clearance. Both the eKt/V and the dpKt/V assessments of dialysis dose will be lower than dose predicted as the spKt/V.
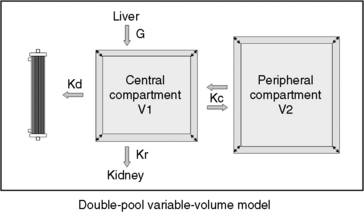
Figure 29-5 Graphic illustration of the double-pool variable-volume kinetic model of the urea metabolism during high efficiency hemodialysis. In this model, the urea generation rate (G), the renal clearance (Kr), and the dialyzer clearance (Kd) are the major determinants of urea content in the central compartment (volume V1). An additional peripheral compartment (volume V2) continuously exchanges solutes and water with the central pool. The bidirectional rate constant for urea transference between the two pools is indicated by Kc. When Kc = 1, urea diffuses freely between the compartments and the system reverts to a single-pool model. A lower Kc implies a slower diffusional component into and out of the peripheral compartment. If the peripheral compartment remains unaccounted for, single-pool kinetic modeling results in a lower apparent V, a more rapid decrease of the urea concentration in the central pool, a greater postdialysis rebound, and overestimation of the dose of dialysis, Kt/V. Anatomically, the two compartments can represent the extracellular and intracellular spaces, respectively, or body areas with different perfusion characteristics.
Online measurement of these kinetic determinants of dialyzer performance and dialysis dose can be computed in real-time with ionic dialysance techniques that advance the monitoring of individual dialysis sessions and ensure adequate dialysis delivery (Figure 29-6). Automated, bloodless kinetic modeling systems using ionic clearance are available on many modern delivery systems and provide kinetic assessments for each dialysis treatment as an alternative to blood-based modeling techniques.24,67,108,114,118 Dialysance of a dialyzer is a measure of solute mass transfer across the dialysis membrane when the solute is present in both the blood and dialysate. Ionic dialysance is a kinetic assessment of the transfer characteristics of the ionic solutes in the blood and dialysate. The collective concentration ionic solutes in solution can be measured by the conductivity of the solution, which is proportional to the electric current conducted through the solution. The conductivity of both plasma and the dialysate is influenced primarily by the concentration of sodium and chloride and will change with perturbations of these solutes.67,114 The clearance of a solute by the dialyzer is equal to its dialysance when the solute is present only in the blood and is absent in the dialysate. The collective dialysance of small-molecular-weight ions (such as sodium) is considered equivalent to the dialysance of urea, and consequently ionic dialysance can be used as a reasonable surrogate for the dialysance of urea. In conventional single-pass hemodialysis, circuits in which the dialysate contains no urea, urea dialysance becomes equal to urea clearance, and ionic dialysance becomes an acceptable predictor of the urea clearance of the dialyzer, Kd-urea. Analogous to measurement of blood-based dialyzer clearance, ionic dialysance is computed from measurements of dialysate conductivity (concentration of ionic solutes) at the inlet and outlet ports of the dialyzer in response to transient changes in inlet dialysate conductivity and the instantaneous dialysate and blood flow rates.*
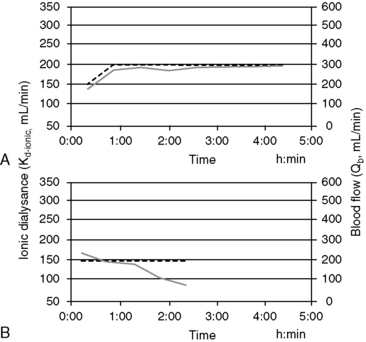
Figure 29-6 Screen shots of the ionic dialysance display of the Gambro Phoenix illustrating the ionic dialysance (solid line, left axis) and blood flow (dashed line, right axis) throughout a dialysis session. A, Demonstrates constant dialyzer performance and extraction ratio during the treatment with a Kd-ionic of approximately 195 mL/min at a Qb of 300 mL/min (extraction ratio, 0.65). B, Illustrates a marked and progressive decrease in Kd-ionic after 1.5 hours of treatment associated with extensive clotting of the dialyzer necessitating termination of the treatment.
When ionic dialysance is programmed sequentially during the dialysis treatment, serial updates of the instantaneous clearance (Kd-ionic) of the dialyzer can be monitored, and the depurated volume for treatment (Kd-ionic × t) is predicted at the end of the session. The ionicKt/V, as a surrogate for spKt/V, provided when the ionic dialysance is indexed to urea distribution volume, V. The availability and simplicity of ionic dialysance to predict dialysis delivery at every treatment should promote a better understanding of the kinetics of dialytic therapy and the efficacy of dialysis prescriptions.
Sudden or progressive decreases of Kd-ionic during the treatment can alert possible clotting in the dialyzer or development of access recirculation that may compromise the adequacy of the treatment. It is also possible to make interim projections of the ionicKt/V for the session to ensure the treatment targets will be met by the end of the scheduled session time. If therapeutic targets will not be met under current circumstances, adjustments to treatment time, blood flow, and dialysate flow, access repositioning, or dialyzer exchange can be initiated to modify the forecast treatment to ensure adequacy.29
Routine animal hemodialysis is provided intermittently three times weekly based on human convention. As for humans, this schedule represents a compromise between clinical benefits, time constraints, and financial burden. However, recent experience in human patients with daily dialysis schedules has demonstrated marked theoretical and clinical benefits to the increased dialysis frequency.† Because diffusion is a first order process, dialysis becomes more efficient as the frequency of dialysis increases.28,46,66,99 Critical analysis of varying dialysis schedules has shown the total weekly dose calculated as the sum of the individual treatments is not equivalent among dialysis schedules with differing frequencies. Daily treatment schedules have equivalent clinical outcomes to traditional three times a week hemodialysis schedules even when delivered at a lower total weekly dose. For example, six treatments per week at a spKt/V of 1.0 per treatment are more efficient than three conventional treatments per week with a spKt/V of 2.0 per treatment. To reconcile these differences, the concept of standard Kt/V (stdKt/V) has been proposed to compensate for the differences in efficiency when comparing schedules with different intermittence.50,64-6699 Standard Kt/V is an hypothetical continuous urea clearance that would achieve a constant blood urea concentration identical to the average predialysis urea concentration for all intermittent treatments provided during the week. This theoretical concept allows comparisons among dialysis schedules with differing dialysis times and intervals, including the extreme case of continuous therapy.
A dialysis schedule with three 4-hour treatments per week with a spKt/V of 2.0 per treatment is equivalent to a stdKt/V of 2.7. Increasing the schedule to six 2-hour treatments per week (spKt/V, 1.0 per treatment) with the same total 12 hours of weekly dialysis substantially increases the amount of dialysis delivered to the equivalent stdKt/V of 3.9 (Appendix, Equation 12). Stated differently, a three times a week, 240-minute treatment schedule (stdKt/V, 2.7) requiring 12 hours of treatment could be provided with equivalent efficacy by considerably shorter treatments of 70 minutes per session if provided six times weekly for a total weekly dialysis time of 7 hours. Although reduction of the individual treatment time is possible according to this analogy and for illustrative purposes, this recommendation would not be clinically prudent.52,55,66,113 Conversely, decreasing the frequency of dialysis to two treatments per week would require extension of each treatment to almost 24 hours to achieve an equivalent stdKt/V. These quantitative predictions illustrate the marked benefits to increased frequency of therapy and are in accordance with recent clinical observations, suggesting it is difficult to compensate for decreased frequency of therapy with longer treatment times.47,50,172
As an alternative to sdtKt/V for comparing the equivalency of intermittent and continuous therapies, including residual renal function, the intermittent kinetics of hemodialysis can be converted to a continuous equivalent clearance (EKR).25,28,50,183,186 This concept is more intuitive for most clinicians as the relative contribution of dialysis can be compared directly with residual renal function and with other intermittent or continuous dialytic therapies (Appendix, Equation 7). Total patient clearance (renal clearance, Kr, and dialyzer clearance, EKR) is expressed in the familiar term (milliliters per minute) of clearance, similar to the glomerular filtration rate, and the resulting total clearance can be used to predict the expected uremic morbidity, similar to patients with earlier stages of chronic kidney disease.
A prerequisite for the validity of most urea kinetic modeling algorithms is the presumption of steady-state urea metabolism (i.e., constant food intake (quality and quantity), constant endogenous nitrogen metabolism and catabolism, stable body weight, and a regular dialysis schedule).48 These conditions rarely exist for most veterinary applications of hemodialysis that are prescribed for acute kidney failure; however, classic double-pool, equilibrated, and EKR analyses appear valid under these conditions in human patients if careful attention is paid to the accuracy of all input variables.26,44,87
The rationale to scale dialysis dose to the nebulous index (V) that cannot be readily measured has kinetic justification and historical acceptance. The first order kinetics of urea removal by dialysis proceeds with an elimination constant equal to Kd/V and is a measure of the intensity of the treatment. Even though V is not measured directly, it is derived mathematically to yield the expression, Kt/V, with kinetic modeling. Recently, however, the universality of scaling dialysis dose to the urea distribution volume has been questioned in human patients as the relative distribution volume varies independently of body size, between genders, and in patients of differing body composition.43 Consequently, scaling dialysis dose to V may promote under treatment in some individuals and relative overtreatment in others. The comparative significance of this issue has not been addressed in animals, but it is likely the diversity of size, species, and breed, in addition to gender, in animal patients that could impose even greater variance in the relative urea distribution volume than seen in humans.
The effect of dose of dialysis on outcome has been demonstrated in humans with end-stage chronic kidney disease in several large-scale clinical studies.* The dose of dialysis that is adequate to manage dogs and cats with either acute or chronic kidney failure needs to be established using appropriate tools for treatment quantification. However, until these parameters are established, routine application of UKM extends therapeutic insights of dialysis delivery far beyond reliance on routine chemistry tests and clearly benefits the assessment and clinical management of uremic animals. Kinetic parameters and quantitation of dialysis delivery are important tools for quality assurance of dialytic therapy in animals; however, they are not therapeutic goals per se.186 The provision of a yet-to-be-defined minimal dose of dialysis is only one of the requirements of therapeutic adequacy, and management of uremia necessitates an individually tailored global approach to the animal.
Use of hemodialysis to correct uremia
The major application of dialytic therapy is the transient elimination of innumerable and unspecified solutes and fluid retained during renal failure that would otherwise be cleared by healthy kidneys. The benefits of intermittent dialysis are transient, and with cessation of dialysis, the concentrations of urea and all retained uremia solutes with continued generation increase immediately until a new steady state is achieved or until the next dialysis session (Figures 29-1 and 29-3). It is firmly established that uremia is associated with retention of a myriad of low-molecular-weight solutes that are effectively predicted by the blood urea concentration; dialytic removal of these solutes to minimize the time-averaged urea concentrations mitigates the associated morbidity and mortality of uremia but does not resolve all uremic symptomatology.* It is equally established that additional classes of retention solutes including protein-bound, low-molecular-weight solutes, secluded solutes, and so called middle molecules with a molecular weight between 500 Da and 60,000 Da are poorly dialyzed by conventional high-flux diffusive and hemofiltration techniques, limiting the efficacy of extracorporeal techniques.† The diffusive removal of urea and small-molecular-weight solutes is exceptionally efficient in animals because of their small size (volume) relative to the surface area and clearance capabilities of the hemodialyzer. Theoretically, these solute and the fluid abnormalities attending uremia could be corrected temporarily during a single hemodialysis session, but clinical sequelae associated with abrupt excursions in the solute and fluid content of the patient limit the rate and magnitude that they can be altered. The change in solute concentration (e.g., urea) during dialysis is influenced by the size of the animal and the interactive parameters defining the dialysis prescription (see Appendix, Equation 8). The intensity of dialysis can be adjusted by altering blood flow rate (Qb), dialysate flow rate (Qd), clearance of the hemodialyzer (Kd), rate of ultrafiltration (UF), or length of the dialysis session (Td) to accommodate the size and therapeutic needs of the animal. After dialysis, BUN (and other retained uremia solutes) increases in proportion to urea generation from dietary nitrogen and endogenous protein catabolism (G) and inversely with residual renal function (Kr) (see Figures 29-1 and 29-2). Higher dietary protein intake, increased catabolism, and lower residual renal function will produce a steeper increase and higher steady-state concentration of urea after dialysis unless interrupted by an intervening dialysis treatment before achieving a steady state (Figure 29-2). The peak predialysis urea, time-averaged urea concentrations, and the exposure to urea and other uremic toxins will be lower the more frequently and effectively a patient is dialyzed.46,48,50,64,186
The hemodialysis session is defined by the dialysis prescription, which is formulated interactively with consideration of the physical and clinical condition of the patient and the alterations of body fluid volume and composition subject to dialytic correction. The prescription must accommodate the physiologic, hematologic, and biochemical status of the patient before dialysis and target the desired modifications at the end of the session (Box 29-2). Patient assessment includes (1) species, breed, weight; (2) degree of azotemia; (3) hemodynamic stability and predisposition to hypotension and hypovolemia (i.e., body weight, estimated blood volume, blood pressure, volemic status); (4) hematocrit and total plasma solids; (5) electrolyte and acid-base abnormalities; (6) oxygenation capacity; and (7) bleeding potential. The prescription is individualized for each patient and every dialysis session by selecting dialytic options that best achieve the solute removal and ultrafiltration goals of the session without predisposing therapeutic risk. Specific factors regulating these processes are prescribed independently and are outlined in Box 29-3. Hemodialysis prescriptions for animals have been derived empirically as consensus-based guidelines for a diverse array of animal types and clinical conditions. There has been little validation or standardization of dialysis therapy based on outcome assessment. However, animal dialysis has advanced over the past 40 years, and dialysis prescriptions are based on a solid understanding of the physical and physiological principles governing dialysis and clinical aspects of uremia.
Box 29-2 Clinical Considerations Influencing the Hemodialysis Prescription
1. Patient characteristics (species, size, age, body condition)
2. Severity of the azotemia and retained uremic toxins
3. Electrolyte and mineral disorders: sodium, potassium, chloride, bicarbonate calcium, magnesium, and phosphate
4. Acid-base imbalances and depleted or deficient solutes: bicarbonate, calcium, glucose
5. Exogenous intoxications (e.g., ethylene glycol)
6. Hydration status and fluid balance
7. Physiologic disturbances: blood pressure, body temperature, oxygenation, change in body weight, mental state
9. Medications, surgical history, and comorbid clinical conditions
Box 29-3 Components of the Hemodialysis Prescription
1. Selection of the hemodialyzer (surface area, bundle volume, solute and ultrafiltration characteristics, hemocompatibility, and biocompatibility)
2. Selection of extracorporeal circuit and priming solution
4. Dialysis time (Td) and scheduled bypass time
5. Dialysate composition and/or modeling
6. Dialysate flow rate and direction (Qd)
8. Access connection (“single needle,” reversed direction)
9. Anticoagulation (anticoagulant, target ACT, protocol)
10. Ultrafiltration (volume target, rate)
Hemodialysis prescription for acute kidney injury (AKI)
The rapid accumulation of retained solutes in acute uremia intensifies expression of the clinical signs and metabolic disturbances compared with the uremia of chronic kidney disease. Hemodialysis prescriptions are prioritized to resolve hyperkalemia, profound azotemia, fluid imbalance, metabolic acidosis, and persistent nephrotoxins and to accommodate ongoing therapies (e.g., parenteral feeding). The therapeutic efficiency of hemodialysis must be applied judiciously to prevent overtreatment when the risks of dialysis disequilibrium syndrome, hypovolemia, hypotension, and bleeding are high. Consequently, dialysis goals for initial treatments in animals with AKI differ considerably from the goals and prescription for later dialysis treatments.
Hemodialyzers
Selection of the hemodialyzer is based initially on its contribution to the extracorporeal volume and secondarily on its diffusive, convective, and biocompatibility properties according to guidelines in Table 29-1. The smallest neonatal hemodialyzer currently available has a 0.3 m2 surface area and a 28-mL blood volume compartment (F3, Fresenius Medical Care, Waltham, Mass.). For cats and dogs weighing less than 6 kg, a dialyzer with a surface area between 0.2 and 0.4 m2 and a priming volume less than 30 mL generally is tolerated. A synthetic dialyzer (neonatal or pediatric) with a surface area between 0.4 and 0.8 m2 and a priming volume less than 45 mL is appropriate for use in dogs weighing between 6 and 12 kg of body weight. Dialyzers with surface areas up to 1.5 m2 and priming volumes up to 80 mL can be used on dogs between 12 and 20 kg of body weight. Larger dialyzers with surface areas greater than 2.0 m2 and priming volumes greater than 100 mL can be used in dogs weighing more than 30 kg.
Table 29-2 Treatment Intensity Prescription
| Initial Treatment | |
| BUN <200 mg/dL | URR <0.5 at no greater than 0.1 URR/hr |
| 200-300 mg/dL | URR 0.5-0.3 at no greater than 0.1 URR/hr |
| >300 mg/dL | URR ≤ 0.3 at no greater than 0.05-0.07 URR/hr |
| Second Treatment | |
| BUN <200 mg/dL | URR 0.6-0.7 at 0.12-0.15 URR/hr |
| 200-300 mg/dL | URR 0.6-0.4 at no greater than 0.05-0.1 URR/hr |
| >300 mg/dL | URR ≤ 0.4 at no greater than 0.05-0.1 URR/hr |
| Third and Subsequent Treatments | |
| BUN <150 mg/dL | URR >0.8 at >0.15 URR/hr |
| 150-300 mg/dL | URR 0.5-0.6 at 0.15-0.1 URR/hr |
| >300 mg/dL | URR 0.5-0.6 at <0.1 URR/hr |
A dialyzer with a smaller surface area (0.3 to 0.5 m2) than recommended may be chosen preferentially in dogs of all sizes for initial hemodialysis treatments when the BUN concentration is greater than 200 mg/dL to reduce the intensity of the treatment and risk of dialysis disequilibrium. Solute removal follows first order kinetics, and animals with marked azotemia (BUN >250 mg/dL) will experience quantitatively greater urea removal per unit of time and blood flow than those with lesser degrees of azotemia. For patients with severe azotemia a low-efficiency dialyzer with a lower urea clearance may be more appropriate and safer than use of a high-efficiency device. A smaller dialyzer can be selected also for initial treatments with reduced blood flow rates to limit the resident time of blood in the dialyzer to minimize clotting. At a blood flow rate of 20 mL/min, the resident time of blood in a 28-mL dialyzer is only 1.4 minutes compared with 9 minutes in a 1.5-m2 dialyzer with a blood volume of 180 mL.
Treatment Intensity
Initial dialysis treatments are prescribed to be less intensive (slower blood flow rate, smaller dialyzer surface area, and possibly shorter treatment time) than those prescribed for subsequent treatments. At slow blood flow rates, urea extraction across the dialyzer approaches 100%, and urea clearance (Kd-urea, in milliliters per minute) is approximately equal to extracorporeal blood flow (Qb, in milliliters per minute). When high-efficiency and high-flux dialyzers are used, Kd-urea increases quantitatively with Qb until blood flow exceeds 200 mL/min.47 At blood flow rates above 200 mL/min, the relationship flattens as urea clearance is influenced by membrane characteristics and dialysate flow in addition to Qb.47 At blood flow rates greater than 300 mL/min, dialyzer performance is influenced minimally by increased single-pass flow, but total solute removal during the treatment will increase as a function of the cumulative flow through the dialyzer. The total volume of blood passed through the dialyzer during the treatment (Qb × Td) has been established as a reasonable predictor of the intensity of the treatment as estimated by the URR (Figures 29-3 and 29-4).34,59,96 This relationship can be used as an operational parameter to guide the prescription and delivery of dialysis to the target URR for differing severities of uremia and phases of management (Table 29-2).
Dialysis Time
Once the target URR is defined for the treatment, the approximate volume of blood requiring dialytic processing to achieve the goal can be determined (Figures 29-3 and 29-4). From this volume (Qb × t), appropriate combinations of blood flow rate (Qb) and dialysis time (t) can be derived. For patients with moderate to severe azotemia, a long dialysis session time (slow Qb) is preferable to a short session time (fast Qb) that yields the same volume of processed blood and prescribed URR. Prescription of a dialysis session time less than 180 minutes could promote use of inappropriate blood flow rates that induce rapid changes in BUN and life-threatening dialysis complications. Short treatments usually cause inadequate URR outcomes that delay resolution of the azotemia. A patient with an initial BUN concentration of 250 mg/dL treated for 120 minutes to yield a URR of 0.2 (0.1 URR/hr, postdialysis BUN, 200 mg/dL) may rebound to a BUN approaching 250 mg/dL by the next treatment. The subsequent treatment will be constrained by the same concerns for rapid urea reduction and dialysis disequilibrium at issue for the initial treatment because no progress was made to resolve the azotemia. A safe and more effective approach for initial treatments is to prescribe extended-slow dialysis to target a URR between 0.4 and 0.5 (or more) over 4 to 8 (or more) hours. Once the predialysis BUN is less than 150 mg/dL, dialysis time can be maintained or increased in both dogs and cats concurrent with faster blood flow rates to achieve higher URRs.
The hourly URR can be used as an additional guide to determine the appropriate treatment time. An excessive rate of urea reduction is more likely to cause intradialytic complications than the absolute decrease in BUN over the dialysis session.96 The risk of dialysis disequilibrium syndrome can be minimized by adherence to the hourly URR recommendations as indexed to the degree of azotemia in Table 29-2. With these guidelines, an appropriate treatment time can be determined readily by dividing the URR goal for the treatment by the designated hourly URR. Animals become more tolerant to rapid urea shifts as their azotemia is reduced and as the number of dialysis treatments is increased. More aggressive hourly URR goals can be prescribed beyond the initial two to three treatments at a later stage of management. It should be emphasized that URR is determined cumulatively over the entire dialysis treatment, but the rate and absolute change in serum urea and osmolality will be highest at the beginning of the treatment. Despite appropriate URR prescription for the treatment, hourly URR recommendations could exceed safe guidelines at the beginning of the treatment in extremely azotemic animals if the URR goal is too high or the treatment time is short.
Extended slow dialysis treatments also facilitate removal of large volumes of fluid that risk volume contraction and hypotension during shorter treatments. Treatment intensity is indexed to urea transfer, which occurs faster than solutes (e.g., potassium, phosphate, and creatinine) that are less diffusible or compartmentalized and poorly transferable. Longer treatments enhance removal of urea in addition to secluded solutes that do not behave like urea.55,63,113
Extracorporeal Blood Flow
Blood flow is a major determinant of treatment intensity and becomes defined in sequence as the URR goal; required volume of processed blood and treatment time are decided. For a 20 kg dog with AKI and a BUN of 295 mg/dL, a URR of 0.4 (40%) might be prescribed. The requisite treatment volume for this target would be 0.4 L/kg or 8 L of total treatment (see Table 29-2; Figure 29-3). Appropriate combinations of dialysis time and blood flow rate are next computed to achieve the 8 L goal. For a 240-minute dialysis session time (0.1 URR/hr), the required Qb would be 33 mL/min (i.e., 8000 mL/240 minutes; 1.7 mL/kg/min), whereas for a 360-minute session time (0.06 URR/hr), the required Qb would be 22 mL/min (1.1 mL/kg/min). A higher first treatment URR target could be selected with appropriate extension of the treatment time to maintain a safe hourly URR.
Without URR-derived estimates for Qb, blood flow must be determined empirically to provide adequate and safe treatments. When the initial BUN concentration is greater than 300 mg/dL, the blood flow rate should be limited to 1 to 1.5 mL/kg/min or less to prevent overly intense or rapid treatment. If the BUN concentration is between 150 and 300 mg/dL, blood flow for initial treatments should be limited to 1.5 to 2.0 mL/kg/min. At these slow blood flow rates, urea extraction across the dialyzer will be essentially complete and the urea clearance will equal Qb. By the third and subsequent treatments, the BUN usually is less than 150 mg/dL, and blood flow can be increased cautiously to 5 mL/kg/min. For intense, high-efficiency treatments during the maintenance phase of management, blood flow rates between 10 and 20 mL/kg/min or the maximal flow achieved by the vascular access can be used.
For severely uremic cats or small dogs with BUN concentrations greater than 250 mg/dL, it is preferable to extend the treatment time to greater than 5 hours while providing exceptionally slow blood flow and urea clearance rates to deliver a sufficiently gradual target of <0.1 URR/hr. In some cases, it may not be possible to adjust the pump speed sufficiently to deliver a blood flow rate slow enough to correct the azotemia safely. For example, a 4 kg cat with an initial BUN of 330 mg/dL would require approximately 1.2 L of blood processing to achieve a treatment URR of 0.4 (or 40%) (Figure 29-4). If the treatment were delivered safely over 360 minutes (0.07 URR/hr), the required Qb would be 3.3 mL/min. The dilemma is most dialysis machines cannot deliver accurately a blood flow at this low rate. A faster Qb will intensify the treatment and shorten the time to treatment goal unacceptably. At a Qb of 10 mL/min (which is still too slow for many machines), the treatment time would be only 120 minutes (0.2 URR/hr) and unsafe for the target URR. In these circumstances, it is possible to extend the treatment time and lower the effective Qb by alternating periods of active dialysis with deliberate intervals of bypass in which blood flow continues but dialysate flow and hence dialysis are stopped. There is some continued diffusion into the dialysate contained in the dialyzer as the system is placed in bypass, but generally, alternating 5 to 10 minutes of dialysis with 5 to 20 minutes of bypass decreases the effective Qb and hourly URR, and extends the time to treatment goal by twofold to fourfold. Ultrafiltration continues during the bypass, facilitating fluid removal during the extended treatment time. Blood flow can be increased during the bypass intervals to minimize clotting in the extracorporeal circuit without the risk of excessive dialysis.
Dialysate Composition
Dialysate composition and its temperature and flow rate are active components of the dialysis prescription. Dialysate is formulated to maximize elimination of uremia toxins, prevent depletion of normal blood solutes, replenish depleted solutes, and minimize physiologic and metabolic perturbations during and after the dialysis sessions. Conventional dialysate formulations for dogs and cats include sodium, approximately 145 mmol/L (dogs), 150 mmol/L (cats); potassium, 0.0 to 3.0 mmol/L, bicarbonate, 25 to 40 mmol/L; chloride, approximately 113 mmol/L (dogs), approximately 117 mmol/L (cats); calcium, 1.5 mmol/L; magnesium, 1.0 mmol/L; and dextrose, 200 mg/dL, which are produced online from standard dialysate concentrates. Dialysate flow conventionally is 500 mL/min but can be decreased to reduce solute clearance during initial treatments or increased to maximize the intensity of maintenance treatments. For practical purposes, however, there is little additional solute clearance until dialysate flow exceeds twice the counter current blood flow rate.78,158 Urea extraction across the dialyzer is nearly complete at the blood flow rates used during initial treatments, so it is not practical (or possible on most delivery systems) to reduce dialysate flow sufficiently to alter dialysis efficiency.
Rapid solute removal exposes the patient to nonphysiologic osmotic shifts that can cause osmotic disequilibrium between the vasculature, the interstitium, and cells. The accompanying shifts of fluid out of the vasculature and interstitium can cause signs of hypovolemia, hypotension, cramping, nausea, vomiting, and neurologic manifestations of dialysis disequilibrium syndrome. The patient may experience additional hypovolemia, hypotension, and poor catheter performance when ultrafiltration is superimposed on these effects. These signs are especially likely to develop early in the treatment when solute removal is the greatest. To offset these physiologic trends, the sodium composition of the dialysate can be modeled (or profiled) so that dialysate sodium is adjusted systematically during the treatment to counteract solute disequilibrium, promote vascular refilling, and lessen or prevent these adverse signs.22,60,129,169 Dialysate sodium can be programmed to change in stepped or linear adjustments from hypernatremic (155 to 160 mmol/L) during the initial stages of the dialysis treatment to isonatremic or hyponatremic (150 to 140 mmol/L) at the termination of the treatment. During the hypernatremic phase of the profile, the sodium gradient from dialysate to plasma causes sodium loading and expansion of intravascular volume during this critical time when the extracorporeal circuit has filled, ultrafiltration has started, and solute removal is greatest.
The efficacy of sodium profiling has not been validated in animals but appears beneficial in human patients predisposed to hypotension or intradialytic discomfort.* A modeled dialysate with a sodium concentration of 155 mmol/L for the initial 20% to 25% of the treatment, 150 mmol/L for the next 40% of the treatment, and 140 to 145 mmol/L for the remainder of the treatment has been used for small dogs that are not hypertensive and predisposed to hypovolemia.34,59 For cats, sodium modeling using the respective sodium concentrations of 160 mmol/L, 155 mmol/L, and 145 to 150 mmol/L appears to prevent hypotension in the face of the large extracorporeal volume required for hemodialysis. The effects of sodium modeling on intravascular volume are illustrated in Figure 29-7 in which expansion (refilling) of blood volume coincides with the application of a high-to-low dialysate profile in a dog receiving concurrent ultrafiltration.
Modeling dialysate sodium from isonatremic or hyponatremic to hypernatremic (dogs: 145 mmol/L for the initial 20% to 25% of the treatment, 150 mmol/L for the next 40% of the treatment, and 155 mmol/L for the remainder of the treatment; cats: 150 mmol/L, 155 mmol/L, and 160 mmol/L, respectively) has been used prophylactically to forestall the neurologic manifestations of dialysis disequilibrium in severely azotemic animals. This sodium profile promotes osmotic (sodium) loading of the ECF in the later stages of treatment when urea disequilibrium can cause osmotic fluid shifts into the intracellular compartment, exacerbating cerebral edema and increased intracranial pressure. This profile has been derived empirically but appears to offer a margin of protection in animals with BUN concentrations greater than 200 mg/dL. Conceptually, this low-to-high dialysate profile could increase the osmolality of the ECF by 20 mOsm/kg (approximately equivalent to the osmotic effects of 60 mg/dL of urea disequilibrium), promoting an osmotic buffer to lessen fluid shifts into cells (Figure 29-8).
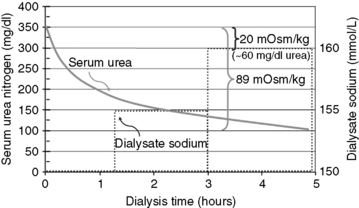
Figure 29-8 Hypothetical plot of the changes in serum urea nitrogen and dialysate sodium concentration during a dialysis treatment employing low-to-high sodium profiling from 150 to 160 mmol/L. The 20 mOsm/kg (NaCl) change in serum osmolality resulting from the sodium modeling could help offset, in part, the 89 mOsm/kg change in serum osmolality resulting from the dialytic change in urea of 250 mg/dL during the treatment. The osmotic buffer provided by dialysate sodium profiling is equivalent to the approximately 60 mg/dL change in blood urea nitrogen.
Sodium profiling will alter the patient’s sodium balance if the cumulative sodium transfer is other than neutral. A positive sodium balance is expected with the low-to-high profile and is accepted for initial treatments in patients at risk for dialysis disequilibrium. Patients may develop untoward complications, including postdialysis thirst, interdialysis weight gain, hyperkalemia, and hypertension if the profile consistently promotes sodium accumulation. This can be significant during maintenance hemodialysis in animals as documented in human patients.51 Routine high sodium dialysate profiles have been shown to exaggerate potassium rebound and increase interdialytic serum potassium concentrations in human dialysis patients.45 In dogs undergoing maintenance hemodialysis, sodium profiling from low to high promoted a 50% reduction in the prevalence of hyperkalemia compared with dialysis with standard dialysate.122 Severe hypertension can been seen in animals in association with prolonged use of high sodium dialysate profiling, and the profile must be adjusted to produce neutral sodium balance, or an isonatric dialysate should be used if these signs are recognized.
A standard dialysate potassium concentration of 3 mmol/L can be used for most animals with acute or chronic renal failure. Essentially all potassium is sequestered in the intracellular compartment, and the excessive potassium load must transfer from this compartment. Consequently, serum potassium concentration may not be corrected adequately during short dialysis sessions if a standard dialysate is used in animals with severe hyperkalemia or during treatments using slow blood flow rates. Similarly, the extracellular potassium load in animals treated medically for severe hyperkalemia before dialysis may become sequestered in cells and not accessible for dialytic removal during short dialysis treatments.
Consistent evidence in human patients suggests large dialysis potassium gradients or rapid changes in serum potassium concentration during sessions employing a dialysate potassium <1.0 mmol/L can alter the intracellular/extracellular potassium ratio and resting cell membrane potential to increase the risk for ventricular arrhythmias and sudden cardiovascular death.88,103,132,134,135 Sudden intradialytic cardiovascular death is uncommon in animals perhaps due to the acute versus chronic nature of the patient populations and the relative differences in cardiovascular comorbidities between animals and humans. Nevertheless, these identified risks should prompt reconsideration of current recommendations. At a minimum, the appearance of ventricular arrhythmias during the treatment warrants changing to a dialysate containing 2 or 3 mmol/L of potassium. Until additional evidence becomes available, the future use of dialysate solutions with 0 mmol/L of potassium should be prescribed with caution.
Buffer Formulation
Hydrogen ions are at too low a concentration for the acid burden to be disposed by dialysis alone. Alternatively, the acid load can be buffered by base equivalents supplied in the dialysate. High-flux and high-efficiency dialysis procedures require a bicarbonate-based dialysate that has replaced virtually all use of acetate as a source of base equivalents in both human and animal dialysis. Bicarbonate is formulated to a concentration higher than that of plasma to cause accrual of new buffer by the patient and to replenish the deficits caused by production and retention of metabolic acids. The amount of base equivalents transferred depends on the dialysate buffer concentration, choice of dialyzer, the blood and dialysate flow rates, and the distribution of hydrogen ions during the dialysis session.58,75
Many delivery systems can proportion dialysate bicarbonate concentration from 20 to 40 mmol/L. Use of a low dialysate bicarbonate concentration (25 mmol/L) has been suggested for animals with severe metabolic acidosis (serum bicarbonate <12 mmol/L) on the premise a higher bicarbonate concentration may correct the bicarbonate deficit too rapidly, increase cerebrospinal fluid (CSF) Pco2, decrease CSF pH, and precipitate paradoxical cerebral acidosis, cerebral edema, and dialysis disequilibrium syndrome.9,11,34 In practice, it is difficult to change the serum bicarbonate concentration during short treatments at low blood flow rates even with high dialysate bicarbonate concentrations.58 Under these conditions, dialysate bicarbonate can be set to 30 mmol/L with little likelihood of neurologic complications. It should be decreased promptly if the animal shows signs of tachypnea, restlessness, stupor, blindness, or other clinical evidence of impending dialysis disequilibrium syndrome. Dialysate bicarbonate concentration should be set more cautiously between 20 to 25 mmol/L for intensive dialytic treatment in animals with severe metabolic acidosis associated with nonazotemic diseases such as antifreeze intoxication. A low dialysate bicarbonate concentration also should be selected for treatment of animals with metabolic or respiratory alkalosis. Inappropriate selection of a high dialysate bicarbonate could worsen the alkalemia. For maintenance hemodialysis treatments, a dialysate bicarbonate concentration of 30 mmol/L will produce a postdialysis serum bicarbonate concentration of approximately 23 mmol/L after 4 or 5 hours of dialysis. A dialysate concentration of 35 to 40 mmol/L yields greater accrual of buffer but often is associated with relentless panting during the treatment.
Dialysate Additions
Hyperphosphatemia is a common feature of acute and chronic uremia,35,36,95,131 and for both conditions the dialysate is formulated to contain no phosphate to facilitate phosphate removal. The dialysance of phosphate is more complex than for either urea or creatinine with four contributory pools possibly participating in its removal.165 These interactive extracellular, intracellular, and reserve pools of phosphate are large, compartmentalized, poorly exchangeable with the serum pool, and subject to regulatory control. Consequently, the amount of phosphate eliminated during a dialysis treatment may be small compared with the overall phosphate load.91,115,165 Hyperphosphatemia usually is not corrected during short and less intensive treatments, but it can be normalized or transient hypophosphatemia can develop with daily hemodialysis schedules or treatments longer than 4 or 5 hours.34,91,165 Postdialysis hypophosphatemia rebounds rapidly after treatment without development of clinical signs in uremic animals. In contrast, persistent hypophosphatemia and the risks of hemolysis, decreased oxygen delivery, or CNS and neuromuscular disturbances can develop in animals with normal predialysis serum phosphate concentrations when dialyzed with a standard (no phosphate) dialysate. For these conditions (i.e., hemodialysis for toxin or fluid removal or well-managed patients with CKD), the dialysate phosphate concentration can be adjusted to physiologic concentrations by addition of a neutral sodium phosphate solution (Fleet Enema, Fleet Brand Pharmaceuticals, C. B. Fleet Company, Inc., Lynchburg, Va.) to the dialysate concentrate. The amount of phosphate additive required will vary depending on the proportioning ratio of the delivery system, but 67 mL (2.2 oz) or 133 mL (4.5 oz) of Fleet Enema solution per gallon of concentrate solution produces a dialysate phosphate concentration that is approximately 2 mg/dL or 4 mg/dL, respectively, when proportioned at roughly1:40.
Ethyl alcohol is an important additive to bicarbonate-based dialysate for the treatment of acute ethylene glycol or methanol intoxications.31 Alcohol is added directly to the acid concentrate in sufficient volume to produce an enriched dialysate with a proportioned concentration of approximately 0.1% ethanol.119 The ethanol diffuses from the dialysate into the patient to maintain a constant blood alcohol concentration sufficient to competitively inhibit alcohol dehydrogenase and minimize further metabolism of the ethylene glycol while it is being dialyzed from the patient.
Dialysate Temperature
Dialysate temperature is taken for granted as a component of the dialysis prescription but should be regarded as a functional contributor to the dialysis session. Dialysis machines manufactured for human patients usually are configured with an upper dialysate temperature limit at 38° C, which is the lower temperature reference for normal dogs and cats. This is the temperature typically prescribed for routine dialysis sessions in animals without regard for the benefits or consequences of alternative temperature prescriptions. Most hypothermic patients will warm to approximately 38° C by the end of the dialysis session. Most animals develop chills with the dialysate temperature set to 38° C because of cooling of the blood in the extracorporeal circuit before it returns to the animal. These signs can be controlled with heated blankets or heat lamps.
Dialysate temperature also influences the hemodynamic stability of patients during routine dialysis treatments and patients predisposed to hypotension during hemodialysis.* Dialysate set to normal body temperature can cause heat accumulation and an increase in core body temperature. Even subtle increases in body temperature can augment the development of hypotension in animals undergoing ultrafiltration.150 This hemodynamic response is initiated by cutaneous vasoconstriction induced by ultrafiltration-associated hypovolemia and decreased dissipation of the accumulated heat. At a critical increase in core body temperature, a thermal homeostatic reflex is triggered, causing peripheral vasodilatation, decreased peripheral vascular resistance, and symptomatic hypotension.103,109,110,140,155 Finite increases in body temperature can be documented in animals during routine dialysis treatments with ultrafiltration.
Animal patients inadvertently may be protected from moderate or overt hemodynamic events by the imposed lower temperature limits of human dialysis delivery systems. Recent studies in human patients demonstrated hemodynamic tolerance is better preserved in dialysis treatments when the patient maintains isothermic balance or is slightly cooled.30,109,110,150,176 To obviate temperature-mediated hemodynamic events, core body temperature should be monitored in patients throughout the dialysis session—especially in patients undergoing rapid ultrafiltration or those predisposed to hypotension. If core temperature increases above normal, dialysate temperature should be adjusted to maintain an isothermic core temperature throughout the treatment.127 For animals predisposed or symptomatic for hypotension during dialysis, decreasing the dialysate temperature by 0.5° C to 1.5° C could induce peripheral vasoconstriction and central redistribution of blood, increase vascular resistance, and improve oxygenation during the treatment.176 Integrated biofeedback systems with blood temperature sensors on the arterial blood line are available to monitor and prevent temperature-related hypotensive or vasodilatory events. An effector system dissipates increased heat through programmed alterations in dialysate temperature, which decrease the temperature of the returning blood to maintain an isothermal core body temperature throughout the dialysis session.102,109,127,145
Anticoagulation
The interaction of blood with the materials and irregularities of the dialysis membrane and extracorporeal circuit activate the coagulation cascade, promote thrombosis in the extracorporeal circuit, and necessitate routine anticoagulation of patients during the dialysis session.170 In fact, it was the discovery of the anticoagulant, hirudin, that enabled the initial development of hemodialysis.1 All triggers and components of the coagulation cascade, and activation and aggregation of platelets participate variably to induce clotting during dialysis. Active strategies to balance anticoagulation and coagulation must be employed to prevent these events for dialysis to succeed yet remain safe.
Inadequate anticoagulation promotes thrombosis of the dialyzer, causing inefficient treatments, blood loss in the extracorporeal circuit, and potential for an abrupt cessation of the treatment. Excessive anticoagulation can cause serious bleeding, although this is infrequent. Unfractionated heparin has been used as the standard anticoagulant for intermittent hemodialysis for 40 years.36 Despite this experience, coagulation remains variable from animal-to-animal and treatment-to-treatment and remains problematic to control. The large extracorporeal circuit and slow blood flow rate required in severely uremic animals contributes to the anticoagulation difficulties and makes monitoring essential throughout the dialysis session. Automated activated clotting time (ACT) is used most commonly to prescribe and monitor safe heparin requirements, but other coagulation measures can be used with equal reliability. Automated ACT has proven reliable and predictive with point-of-care convenience and cost-effectiveness. Low-molecular-weight heparins are used with increased frequency in human dialysis, but there appears to be little difference in their respective efficacy during the dialysis session. The transition to low-molecular-weight heparins is directed to minimize heparin-induced complications, especially heparin-induced thrombocytopenia.170 To date, there is little experience with the use of low-molecular-weight heparins in veterinary dialysis, but the relative safety of unfractionated heparin and cost have obviated a need for change.
The predisposition for clotting the dialysis circuit varies with individual characteristics of the animal in addition to its underlying disease, the choice of hemodialyzer membrane, predialysis hematocrit, extracorporeal blood flow rate, volume of the extracorporeal circuit, predialysis ACT, and rate of ultrafiltration. A standard protocol for anticoagulation during hemodialysis includes a loading dose of heparin from 10 to 25 units/kg IV (cats) and from 25 to 50 units/kg IV (dogs). The loading dose is administered 5 to 10 minutes before starting dialysis to establish an ACT in the target range of 1.5 to 1.8 times the reference ACT or approximately 150 to 180 seconds. After starting dialysis, a continuous infusion of heparin at 20 to 50 U/hr (cats) or 50 to 100 U/kg/hr (dogs) is provided to maintain the ACT in the target range. The hourly heparin dose is adjusted or intermittent boluses of heparin are administered based on sequential ACT measurements performed every 30 to 60 minutes to maintain the ACT target. The target ACT can be increased to 200 to 250 seconds if the animal demonstrates a propensity to clot the extracorporeal circuit. The loading and hourly dose is set to an ACT target of 125 to 150 seconds if there is moderate risk of bleeding.
Under some clinical circumstances, the risks of bleeding from heparin administration are too great despite the necessity to provide dialysis. These equally compelling circumstances mandate alternative anticoagulation strategies that preclude the use of heparin or systemic anticoagulation of the patient. The decision to avoid systemic anticoagulation or perform a “no heparin” treatment is determined by the animal’s relative risks for consequential bleeding. Active bleeding, recent or impending major surgery, percutaneous biopsy (within 24 to 48 hours), severe trauma, hyphema, gastric ulceration, uremic lung, and a predisposition for CNS hemorrhage represent contraindications for systemic heparinization and candidate conditions for “no heparin” hemodialysis.
There are four common alternatives for “no heparin” hemodialysis. In many circumstances, a “no heparin” protocol really means drastically reduced heparin or regional heparin rather than a complete absence of heparin use. In cases where there is a severe, life-threatening potential for bleeding (i.e., CNS hemorrhage, uremic lung), the risks for any degree of anticoagulation may be too extreme for any use of heparin.
Reduced Heparin
Most treatments are performed with some heparin delivery to the extracorporeal circuit. If the predialysis ACT is already increased or within the standard target range, the heparin prime usually can be eliminated. In most animals (even those with increased ACT measurements) some heparin is delivered to the extracorporeal circuit to prevent overt clotting (especially in treatments employing slow blood flow rates). This may be on the order of 10 U/hr (cats) or 10 U/kg/hr (dogs) up to 100 or 200 U/hr in small and large dogs, respectively. Clotting occurs preferentially in the venous header of the dialyzer followed, in order of frequency, in the venous drip chamber, the fiber bundle, the arterial header of the dialyzer, and in the arterial drip chamber. The drip chambers are particularly prone to clotting if the blood flow rate is <20 mL/min as there is little stirring at these flows, and the chamber volume remains static. Under these conditions, the heparin infusion can be split and delivered directly into both the arterial and venous chambers. It also is helpful during slow treatments to pause the treatment every 20 to 30 minutes by placing the system in bypass and increasing the blood flow to dislodge accumulating thrombin aggregates and clots.
No Heparin
Truly no heparin treatments can be performed, but they demand considerable attention. The extracorporeal circuit usually is recirculated with heparin during the setup to promote binding of heparin to the plastic surfaces. This procedure had merit for some membranes (i.e., Hemophan), which could bind heparin covalently. It is uncertain if this procedure is rational with newer synthetic membranes, which may not bind heparin. Before starting the treatment, the excessive heparin is removed from the circuit by a saline rinse (refresh) that is at least three times the volume of the circuit. No heparin prime or maintenance dose of heparin is provided during the treatment. The risk of clotting can be minimized by maintaining the blood flow rate as high as possible, keeping the treatment time to less than 2.5 hours, and flushing the extracorporeal circuit with 25 to 50 cc of saline every 15 to 30 minutes. Saline flushing dislodges accumulating thrombin aggregates and clots, and permits visual inspection of the dialyzer for clotting. The excessive volume associated with flushing can be removed by ultrafiltration if necessary.
Regional Anticoagulation with Heparin and Protamine
This procedure introduces heparin into the arterial blood line to anticoagulate the extracorporeal circuit and reverses (antagonizes) the actions of heparin with protamine in the venous outflow before returning the blood to the patient. Regional anticoagulation avoids anticoagulating the patient while permitting effective anticoagulation of the dialysis circuit. Although conceptually attractive, it is rarely performed because of the difficulty of precisely regulating the balance of anticoagulation and antagonism.
Regional Citrate Anticoagulation
In another regional approach to anticoagulate, only the extracorporeal circuit uses the sequential administration of citrate and calcium.7 Trisodium citrate is infused into the arterial blood path to chelate calcium, decrease ionized calcium, and prevent activation of the coagulation cascade while blood is circulated in the extracorporeal circuit. On the venous side, calcium is reinfused to normalize ionized calcium and reestablish normal coagulation before blood is returned to the patient. Regional citrate anticoagulation is used routinely in a variety of extracorporeal therapies, including CRRT and apheresis, but is not used commonly in intermittent hemodialysis. Although this represents an attractive approach, there are a variety of predictable complications that require careful monitoring and procedural fine tuning. The balancing of citrate and calcium infusions is critical and often problematic. If the citrate infusion is inadequate, the system is predisposed to clotting. If it is excessive, the patient is predisposed to hypocalcemia and metabolic acidosis. If the calcium supplementation is inadequate or excessive, the patient develops hypocalcemia or hypercalcemia, respectively. Other possible complications include hypernatremia from the trisodium citrate infusion and metabolic alkalosis from metabolism of excessive citrate or returned calcium-citrate complexes. This may become a more standardized procedure for hemodialysis in animals as greater experience is gained with the variety of extracorporeal techniques in which it is used more routinely.
Real-time monitoring of “no heparin” treatments is critical to their success and to prevent overt clotting complications. The goals of monitoring are to adjust intradialytic procedures to minimize progressive clotting in the system and to abort the treatment before catastrophic clotting causes loss of the entire extracorporeal blood volume (Figure 29-9). The presence of clotting often can be predicted by visual inspection of the extracorporeal circuit and measurement of dialyzer performance throughout the treatment. The most subtle evidence of potential clotting is often seen in the arterial and/or venous drip chambers as sticky fibrin tags or a film on the surface of the chambers. Visible clots in the headers of the dialyzer can be recognized as dark shapes within the blood pool. Clotting in the fiber bundle also can be recognized by darkened streaks in the bundle, but this appearance will vary with different membranes. Evidence of fibrin deposition and clotting can be identified more readily by flushing the extracorporeal circuit periodically with saline to displace the blood in the circuit. Serial flushing helps clear developing clots to prevent their extension and to document worsening of the clotting.
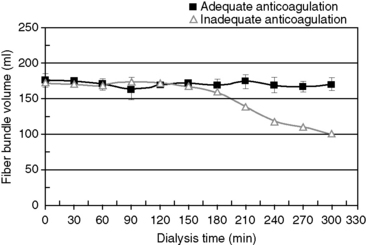
Figure 29-9 Mean ± SD changes in fiber bundle volume of high-flux dialyzers during hemodialysis treatments in a dog using adequate heparin administration (squares) and treatments using inadequate heparin (approximately half) dosing (triangles). Progressive clotting of the dialyzers develops after 180 minutes of treatment, and can be detected and monitored by sequential changes in fiber bundle volume.
At a constant blood flow and ultrafiltration rates, progressive clotting in the fiber bundle can be identified by a progressive increase in transmembrane pressure (TMP). As the surface area of the dialyzer declines with clotting of the fiber bundle volume, a greater TMP is required to achieve the ultrafiltration goal set in the ultrafiltration controller. Some delivery systems permit adjustment of the “maximum TMP” setting to a value just above the TPM established for the treatment. If clotting occurs and the TPM increases above this preset value, a “maximum TMP alarm” will sound to alert the operator to the increasing TPM and likely clotting. This process works very well for the early detection of clotting in the fiber bundle, but the maximum TMP limit must be readjusted if the blood flow or the ultrafiltration rates are changed during the treatment.
Evidence of clotting in the fiber bundle can also be detected by decreasing dialyzer performance throughout the treatment. Dialyzer performance can be monitored by sequential bedside measurements of the urea clearance of the dialyzer (at constant blood flow) or by real-time measurement of ionic dialysance available and displayed on some dialysis delivery systems (See previous Dialysis Adequacy section). Progressive or sudden decreases in clearance suggest active clotting in the dialyzer. These monitoring techniques provide a quantitative prediction of the degree of clotting (loss of membrane surface area), which could be used to trigger contingencies to modify the anticoagulation protocol or to stop the treatment. For example, a 25% to 30% decline in clearance predicts a similar magnitude of clotting and could prompt a contingency to replacement of the hemodialyzer, increase the blood flow rate, initiate saline flushing of the extracorporeal circuit, or discontinue the treatment for fear of greater blood loss. It should be recognized that these techniques only detect clotting in the fiber bundle and could fail to detect severe clotting in the arterial or venous header of the dialyzer or clotting in the venous drip chamber, which could cause a sudden and catastrophic interruption of the treatment and loss of the entire extracorporeal blood volume. In some cases obstruction of the arterial or venous headers with cessation of all flow of blood in the extracorporeal circuit can develop without activation of the arterial or venous pressure alarms and continued rotation of the blood pump.
It is possible to accurately and sequentially measure the fiber bundle volume of the dialyzer in vivo in real-time during the course of the dialysis session using indicator dilution techniques with ultrasonic detectors.90 The fiber bundle volume is computed from the ultrasound-detected transit time of an injected saline bolus through the dialyzer. The volume of blood in the bundle is determined from the relationship, FBV = Qb × T, where FBV is the volume in the blood compartment of the dialyzer, Qb is the extracorporeal blood flow rate, and T is the mean transit time through the dialyzer. A decrease in mean transit time reflects the increased velocity of blood flowing through a smaller volume. A decrease in bundle volume reflects the loss of flowing blood channels due to clotting.
Hemodialysis prescription for chronic kidney disease
Experience with long-term intermittent hemodialysis for animals with chronic kidney disease is less than for acute uremia, yet hemodialysis is clearly indicated, effective, and affords a good quality of life for animals with CKD. Many of the considerations used to prescribe acute hemodialysis are equally valid for chronic dialytic therapy. Adequacy standards for animals with CKD await future definition, but intensive hemodialysis provided every 2 to 3 days can augment its medical management. As animals are supported beyond their fated life expectancy with dialysis, the spectrum and severity of uremic signs increase. Collectively, chronic malnutrition, fluid overload, hyperkalemia, hyperparathyroidism, metabolic bone disease, refractory hypertension, progressive anemia, infection, and drug interactions and toxicities replace concerns of hypothermia, hypovolemia, and dialysis disequilibrium syndrome so prevalent in animals with acute kidney injury.
The dialysis prescription for chronic kidney disease is targeted to reduce the azotemia maximally during each session. Animals starting hemodialysis with severe uremia should be approached similarly to those with acute uremia until the predialysis BUN is less than 100 mg/dL. Thereafter, high-efficiency dialysis schedules are well tolerated. Chronic dialysis prescriptions have been derived empirically but should promote a predialysis BUN less than 70 mg/dL, a postdialysis BUN less than 10 mg/dL, and a time-averaged BUN less than 50 mg/dL. The targeted spKt/V should be greater than 2.0 per session to provide an equivalent renal clearance (EKR) of at least 10% of normal renal function. The choice of dialyzer and dialysate composition generally are similar to those for maintenance treatments in animals with acute uremia. Blood flow rate can be increased cautiously to 15 to 25 mL/kg/min or the performance limits of the vascular access, and dialysis time lengthened to 300 minutes or longer. The temptation to reduce dialysis time with opportunities to use higher efficiency dialyzers and faster blood and dialysate flow rates should be avoided. Longer treatment times may appear to have limited additional efficiency for urea removal, but many solutes, including creatinine, phosphate, potassium, and middle-molecular-weight solutes, have different kinetic profiles and are slower to dialyze or have delayed transference from cellular or sequestered compartments.47,50,55,63,101 Effective clearance of these solutes requires longer treatments than would be adequate for urea removal.
Three treatments per week is the traditional schedule for human patients with end-stage CKD and is used for animal patients with serum creatinine concentrations greater than 8 mg/dL. A twice-weekly dialysis schedule has been used for animals with serum creatinine concentrations between 5 mg/dL and 8 mg/dL before starting dialysis therapy, but a twice-weekly schedule likely represents the minimum recommendation that will be beneficial. Even highly efficient individual treatments performed twice weekly provide only small contributions to the weekly solute clearance required for therapeutic adequacy.47,55,63,64,101 There are finite limits to the efficacy of individual dialysis treatments to improve the time-averaged solute concentrations of a patient. Solute generation and rebound proceed unopposed by dialysis during the interdialytic period. These processes contribute substantially to the cumulative solute retention throughout the week and become more significant as the interdialysis interval lengthens.* The limitations of hemodialysis can only be improved with more frequent and longer dialysis schedules that impart greater efficiency to this intermittent clearance technique rather than more intensive dialysis.† A twice-weekly dialysis schedule only will be effective if the patient has sufficient residual renal function (i.e., a continuous clearance) to offset the effects of solute accumulation in the interdialysis interval to maintain predialysis azotemia and TAC within therapeutic guidelines (see Figure 29-2).
Chronic maintenance hemodialysis is an indefinite therapeutic commitment, and efforts must be taken to prevent long-term complications that are not as evident during shorter-term treatments. Maintenance of the vascular access is paramount, and rigorous attention must be paid to ensure that minor infections are resolved, and the catheter is protected from physical damage or movement within the subcutaneous tunnel. Animals supported with chronic hemodialysis still must be given standard medical therapy to manage the nutritional deficiencies, anemia, mineral disturbances, acidosis, and hypertension associated with end-stage CKD.59,131 Prolonged survival unmasks features of CKD rarely identified in animals managed only with medical therapy. Malnutrition, hyperkalemia, fluid retention, renal osteodystrophy, hypercalcemia, and refractory hypertension become consistent clinical features and therapeutic challenges.
Support for renal transplantation
Renal transplantation is a management option for both dogs and cats with renal failure when other options for treatment are exhausted and there is no likelihood for recovery of renal function.2,4,17 Hemodialysis frequently is used as a bridge to renal transplantation to resolve the uremia and metabolic disturbances contributing to the risks of anesthesia and surgery. Hemodialysis expands the pool of animals acceptable for renal transplantation that otherwise would be considered unsuitable and unlikely to survive because of the severity of their uremia.34,35 Finite periods of dialytic support may be used for animals with acute kidney injury in which transplantation provides the most favorable long-term or most cost-effective outcome. The hemodialysis prescription for animals awaiting renal transplantation is predicated on the severity of the uremia and attendant signs as described for acute and chronic kidney disease, but the course of dialysis should be as short as possible to minimize development of complications that would jeopardize the success or opportunity for transplantation. Any dialysis-associated infection could delay indefinitely or preclude transplantation and must be avoided. Repeated administration of blood products may sensitize the recipient, making it incompatible with a potential donor. After transplantation, hemodialysis frequently is used to manage acute uremia precipitated by delayed graft function, surgical complications, acute rejection, or pyelonephritis.
Use of hemodialysis to correct disorders of fluid balance
Animals with oliguric or anuric AKI have too little excretory function to eliminate administered fluids and become subject to life-threatening fluid accumulation.35 Similarly, polyuric animals with severe CKD accumulate orally administered fluids associated with tube feeding and parenteral fluids used to supplement hydration or to manage episodes of decompensation. Hypervolemia and circulatory overload develop under both circumstances as expressed by chemosis, pleural effusion, peripheral or pulmonary edema, congestive heart failure, and hypertension. Once established, overhydration may not resolve with cessation of fluid delivery or diuretic administration, leaving no medical therapies to manage these disorders. Restoration of fluid balance is an important indication for hemodialysis and a consistent component of the dialysis prescription.
During hemodialysis, fluid can be extracted from the patient by the process of ultrafiltration. The volume and rate of fluid removal must be prescribed for each dialysis session based on the estimated volume excess and deviation from the animal’s ideal dry body weight. Ideal dry body weight is a progressively derived value determined as the body weight at which additional fluid removal would produce hypotension or signs of hypovolemia.83,84 Ideal dry weight usually is predicted from recent historical weight measurements before the onset of illness, or it is estimated from the postdialysis weight when blood pressure was controlled or there was no demonstrated fluid accumulation. Ideal dry weight should not be considered a static parameter but should be redefined regularly to compensate for ongoing changes in the animal’s lean body mass and body fat. Failure to update the targeted ideal dry weight can trigger a prescription for excessive or inadequate ultrafiltration, leading to hypovolemia or progressive overhydration, respectively, as the patient gains or loses nonfluid mass.83 Progressive deviation from dry weight also can be recognized by routine assessment of body condition.33,34,112,117 The determination of dry weight can be elusive on the basis of clinical parameters alone and often is facilitated by more objective techniques including blood volume assessment and bioimpedance spectroscopy.187,188
The rate and volume of ultrafiltration achieved is contingent on the hemodynamic stability of the animal. All available hemodialyzers have sufficient ultrafiltration performance to remove fluid from the vascular space faster than its rate of redistribution (refill) from the interstitium and intracellular compartments. This imbalance can promote hypovolemia, hypotension, and circulatory collapse if ultrafiltration is not prescribed and monitored carefully. The process of ultrafiltration is precisely regulated by the dialysis machine, but small errors or deviations in the tolerance of these systems can cause unscheduled volume losses in small animals during the course of a dialysis session. Slow rates of ultrafiltration between 5 and 10 mL/kg/hr generally are tolerated by dogs and cats, but faster rates must be prescribed cautiously and adjusted according to the animal’s vital signs and blood pressure or by use of fluid monitoring equipment (e.g., in-line blood volume monitor, venous oxygen saturation, continuous weight, bioimpedance spectroscopy).* In-line blood volume monitors are especially useful to assess the efficacy and the safety of ultrafiltration (Figure 29-10).167,168
A lack of change in blood volume during ultrafiltration indicates the rate of fluid removal from the vasculature is precisely matched by a fluid transfer from the extravascular fluid load. If blood volume does not decrease after starting ultrafiltration, a faster rate of fluid removal could be attempted to increase the efficiency of fluid removal. As the vascular refill rate lags behind the ultrafiltration rate, the relative change in blood volume becomes negative in proportion to the deficit in vascular refilling. The change in blood volume stabilizes when the forces for vascular refilling match ultrafiltration. Moderate fluid loads can be removed at a steady 5% to 8% decrease in relative blood volume without overt clinical consequences. More intensive ultrafiltration at a stable 10% to 12% decrease in blood volume is tolerated by some animals with readily transferable fluid loads, but greater decreases in blood volume are likely to lead to clinically evident hypovolemia. The rate of change in blood volume during ultrafiltration helps predict the animal’s ability to surrender the fluid burden and attain dry weight.84 Steep changes in relative blood volume at greater than 10% per hour (especially at the initiation of the treatment) forecast an excessive ultrafiltration rate that is unlikely to plateau at a safe level (see Figure 29-10). If ultrafiltration is stopped transiently, a rapid positively directed change in blood volume indicates the fluid load has not been corrected completely, whereas no change suggests the animal is at dry weight. A positive change in blood volume may be seen when the dialysate sodium is greater than the animal’s serum sodium concentration causing a shift of fluid into the animal or after administration of intravenous or oral fluids or mannitol (see Figure 29-7).
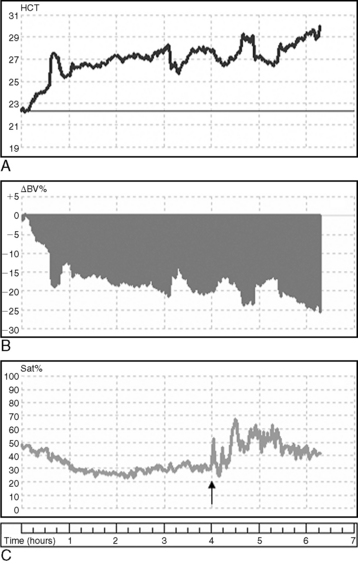
Figure 29-10 Change in hematocrit (HCT, A), relative blood volume (ΔBV%, B), and venous oxygen saturation (Sat%, C) assessed by an in-line monitor in a dog with acute uremia during hemodialysis and continuous ultrafiltration. The figure illustrates the decreases in relative blood volume and venous oxygen saturation associated with hypovolemia induced by ultrafiltration. The late increase in oxygen saturation reflects the supplemental administration of oxygen (arrow).
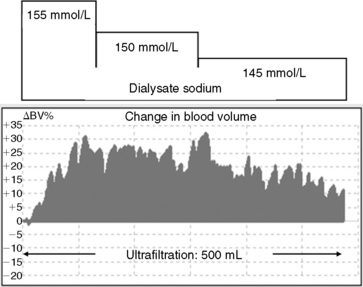
Figure 29-7 Relative percent changes in blood volume (ΔBV%) assessed by an in-line blood volume monitor in response to stepped sodium profiling and simultaneous ultrafiltration during hemodialysis in an uremic dog. The concentration and duration of each dialysate sodium step are indicated by the bars at the top of the figure. The sodium profiling supports a positive blood volume during the simultaneous ultrafiltration.
Animals often tolerate ultrafiltration better at the beginning of the treatment than at the end, and the rate of fluid removal can be profiled to achieve greater fluid losses at the beginning and scaled back later in the session to achieve the same treatment goal. Sodium profiling can be used to offset the hypovolemic and hypotensive effects of aggressive ultrafiltration to maximize fluid removal. Sodium loading during the hypernatremic stages of the modeling profile expands intravascular volume and facilitates redistribution of fluid from the interstitium and intracellular compartments (see Figure 29-7). The administration of small doses of 6% hydroxyethyl starch (hetastarch; at 1 to 2 mL/kg) can facilitate achievement of the ultrafiltration target by maintaining intravascular volume, supporting vascular refilling, and preventing hypotension. The net volume of fluid subsequently removed will far exceed the volume administered and improve the efficiency of the ultrafiltration prescription. Progressive hypovolemia from excessive ultrafiltration is detectable with in-line blood volume monitors well before development of hemodynamic signs, permitting adjustment of the ultrafiltration rate to avert hemodynamic complications. Changes in blood pressure and heart rate are rarely sensitive or early predictors of hypovolemia under these conditions.
Venous oxygen saturation also is a sensitive indicator of hemodynamic stability. Sudden or progressive decreases reflect directional decreases in cardiac output secondary to hypovolemia and can foreshadow impending hypotensive events. Venous oxygen saturation can be measured continuously with an in-line hematocrit monitor or observed visibly as darkening (desaturation) of blood in the extracorporeal circuit (Figure 29-10).167 Any decrease in venous oxygen saturation should prompt immediate assessment of the patient and possible adjustment to the ultrafiltration goals.
Ultrafiltration and diffusive solute removal are independent processes controlled by separate functions of the delivery system. Animals with life-threatening fluid overload and severe azotemia are at risk for excessive solute removal and dialysis disequilibrium syndrome if the treatment is protracted to resolve the overhydration. Conversely, they remain at increased cardiopulmonary risk if the overhydration is not corrected during low intensity treatments. Both of these contrasting dialysis requirements and risks can be managed safely by prescribing periods of ultrafiltration without hemodialysis throughout the treatment or by scheduling independent periods of ultrafiltration before or after the azotemia has been treated to an appropriate URR. During ultrafiltration without dialysis, the machine is placed in bypass mode to stop dialysate flow to the dialyzer (and diffusive solute removal), while blood flow and transmembrane pressure gradients are maintained to continue ultrafiltration. This technique permits slower and more complete fluid removal without producing unsafe rates of diffusive hemodialysis. Isolated ultrafiltration can be used in nonuremic patients to treat fluid congestion associated with heart failure and pulmonary edema refractory to diuretics.* Resolution of the fluid burden from patients with congestive heart failure may improve hemodynamic function, clinical well-being, pulmonary function, drug dependency, and exercise capacity.5,111,154 Similar indications exist in animals, and this aspect of extracorporeal therapy should be evaluated further. Ultrafiltration requirements for individual treatments can be increased to offset administered loads of blood products, drugs, and alimentation solutions. Ultrafiltration becomes especially important in oliguric animals with no excretory capacity and no tolerance for additional volume. The volume of essential fluid-containing therapies should be balanced by equivalent or proportional fluid removal during the dialysis session to balance the anticipated fluid input. Net fluid balance at the end of the dialysis treatment is the difference between the delivered ultrafiltered volume and the volume of the priming solution administered at the beginning of the treatment and the amount of rinse-back fluid used to return blood to the animal. Air can be used as a rinse-back medium to displace the extracorporeal blood rather than fluid to maximize net fluid removal.
Ultrafiltration contributes marginally to total solute removal during the treatment by convective transfer. Convective solute removal does not change the plasma concentration of solutes as occurs with dialysis because the transfer occurs with plasma water at the existing concentration. Dialysis dose predicted by URR, simple urea kinetic models, and measurement of postdialysis serum urea concentrations will underestimate true dialysis dose because of a failure to account for the convective contributions.48
Use of hemodialysis to correct electrolyte imbalances
Uremic animals experience a wide spectrum of electrolyte imbalances because the kidneys are responsible for homeostatic regulation of body electrolytes. Hyperkalemia is the most common and life-threatening electrolyte imbalance encountered in animals with either acute or chronic uremia and can cause severe cardiovascular instability and death. The toxicity of potassium is intensified by acidosis, hypocalcemia, and hyponatremia that may coexist with uremia. Hyperkalemia is a consistent complication of acute uremia intensifying with the severity of the azotemia and presence of oligoanuria.35,36,95
Predialysis hyperkalemia has been recognized with increased frequency in dogs maintained on hemodialysis for greater than 2 weeks.122 Preliminary findings demonstrated 20 of 27 dogs (74%) undergoing dialyzed for longer than 2 weeks had episodes of predialysis hyperkalemia associated with approximately 50% of 544 hemodialysis sessions. The hyperkalemia ranged in severity between 6 and 10 mmol/L and may be associated with varying degrees of hyponatremia, hypercalcemia, and metabolic acidosis. Its prevalence is associated with the duration of dialytic support, degree of azotemia, ultrafiltration requirements, and the intensity of dialysis.122 Chronic hyperkalemia often is difficult to manage and poses a persistent and life-threatening risk. The causes remain unknown but likely involve dialysis-induced disruptions of cell potassium or cell volume regulation, excesses in dietary potassium load, or altered potassium regulation associated with severe chronic uremia. The use of a dialysate containing 0 mmol/L of potassium decreased the prevalence of hyperkalemia at future dialysis sessions by 50% compared with a standard dialysate containing 3.0 mmol/L potassium. Use of a standard dialysate may actually increase the prevalence for severe hyperkalemia (serum potassium >7.0 mmol/L). More recently, evidence in dogs with chronic kidney disease suggests hyperkalemia can be induced directly by the use of therapeutic renal diets commonly fed to dogs with CKD and dogs undergoing maintenance dialysis.149 These observations support a role for an excessive dietary potassium load rather than causal effects of the dialysis prescription.149
Life-threatening electrocardiographic abnormalities resulting from hyperkalemia may be reversed completely within minutes of initiating hemodialysis using a dialysate containing 0 mmol/L of potassium (Figure 29-11). The mechanism for the immediate effect is not known but is disassociated from improvements in serum potassium concentration, which remains unchanged at this stage of the treatment. Consequently, for dialysis sessions in which the predialysis serum potassium is greater than 6.0 mmol/L, a dialysate containing 0 mmol/L of potassium has been recommended.34,38,59 Transfer of potassium from secluded intracellular pools may lag behind its rate of removal from the extracellular compartment by the dialyzer, causing transient hypokalemia at the end of dialysis sessions. 136 A rebound hyperkalemia occurs following the delayed transfer from intracellular pools within hours of ending dialysis that extends to the next dialysis treatment. Daily dialysis may be required until the bulk of the potassium burden is corrected.
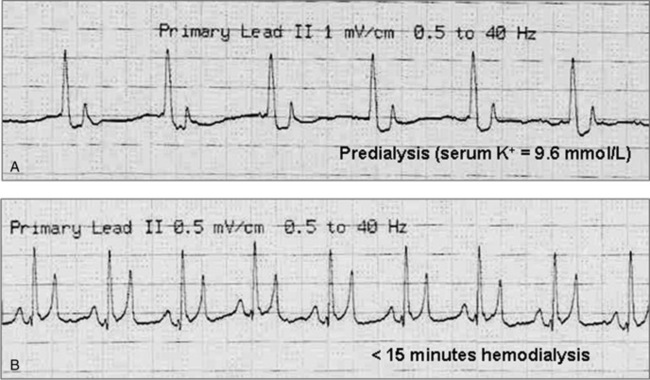
Figure 29-11 A, Predialysis electrocardiogram (ECG) from a uremic dog with a serum potassium concentration of 9.6 mmol/L and evident cardiotoxicity. B, ECG from the same animal within 15 minutes of starting hemodialysis with a 0 mmol/L potassium dialysate. The improvement in the ECG was independent of changes in the peripheral potassium concentration.
In contrast to medical treatments for hyperkalemia, which merely shift extracellular potassium to intracellular pools or antagonize its neuromuscular toxicity, hemodialysis eliminates excessive potassium loads from both extracellular and intracellular pools.134 Additional guidelines for the dialytic management of hyperkalemia were discussed previously under the Hemodialysis Prescription for Acute Kidney Injury section.
The dialysate sodium concentration can be proportioned to concentrations ranging from 125 to 160 mmol/L. It also can be programmed (or profiled) to change in user-defined patterns throughout the dialysis session to achieve specific treatment goals or to correct predialysis dysnatremias. Hyponatremia caused by sodium losses from excessive vomiting, diarrhea, diuretic administration, parenteral sodium-free fluid administration, or oral water can be corrected by programming the dialysate sodium concentration to increase in stepped increments or continuous gradients to the desired postdialysis concentration. Hypernatremia caused by excessive bicarbonate or hypertonic saline administration may be difficult or inappropriate to correct with additional fluid administration but can be resolved easily by adjusting the dialysate sodium concentration in progressive or incremental steps until the desired sodium concentration is reached. The rate of correction can be regulated precisely without overcorrection. Excessive isonatremic loads of sodium can be eliminated by ultrafiltration alone without simultaneous changes in serum sodium concentration. With the exception of minor Gibbs-Donnan effects, the ultrafiltrate is formed with the same sodium concentration present in plasma water. Consequently, large sodium loads can be eliminated without perturbations in sodium concentration or the risk of inducing sodium disequilibrium, which may trigger redistribution of fluid and electrolytes from intracellular stores.45,135
Use of hemodialysis in acute intoxications
Elimination of toxins and support for the consequences of the intoxication are important but overshadowed applications of hemodialysis.20,79,175 This use of hemodialysis is especially important if there has been a delay in medical management, there is limited endogenous clearance of the toxin or its metabolites, or there is no specific antidote for the toxicant. Hemodialysis can be used to eliminate toxins from the body before they promote cellular damage or before they are converted to more toxic metabolites. The dialytic removal of exogenous toxins is governed by the same molecular characteristics that define dialytic clearance of endogenous toxins. Molecular size, concentration in plasma water, distribution volume, degree of protein binding, and lipid solubility significantly influence the potential for a toxin’s elimination.14,161,185 Toxins or drugs with low-molecular-weights (<1500 Da), small volumes of distribution, and minimal protein binding are excellent candidates for diffusive and convective clearance. A small volume of distribution (<1.0 L/kg) predicts the toxin is protein-bound or restricted to the extracellular space and accessible for extracorporeal clearance. A toxin with a large distribution volume (>1.0 L/kg) is likely to be concentrated in tissues and will have minimal transference or availability in plasma water for removal. Only the free fraction of protein-bound toxins can be dialyzed readily, and toxins or drugs that are highly protein bound may not be good candidates for dialytic removal.
Ethylene glycol has a molecular weight of 62 Da, negligible protein binding, and a volume of distribution equivalent to total body water (0.5 to 0.8 L/kg) and consequently is an excellent candidate for dialytic removal. With timely dialysis, ethylene glycol can be removed from the body before its enzymatic oxidation to more toxic metabolites, including glycoaldehyde, glycolate, glyoxylate, and oxalate.14,20,34,137,161 Toxins that are highly bound to serum proteins, including diazepam, salicylates, nonsteroidal antiinflammatory drugs (NSAIDs), and tricyclic antidepressants, are dialyzed less effectively, but dialysis may still be a therapeutic option. Redistribution (rebound) of a toxin or drug from peripheral tissues or cellular compartments to plasma may limit the efficacy of dialysis to resolve the poisoning. If redistribution of the toxin from extravascular pools is much slower than its dialytic removal, the animal may become reintoxicated within hours after completing dialysis. For these sequestered toxins, the length and frequency of dialysis may need to be increased to facilitate their whole-body elimination.
Hemoperfusion is an adsorptive extracorporeal therapy used to manage endogenous and exogenous intoxications that are not cleared efficiently by hemodialysis. Adsorption is the principle of molecular attachment of a solute to a material surface. In contrast to the physical separation between blood and dialysate that occurs during hemodialysis, during hemoperfusion blood is exposed directly to an adsorbent with the capacity to selectively or nonselectively bind toxins of defined chemical composition within the blood path. Hemoperfusion is a small but defined niche in medical therapeutics, which should be incorporated more broadly into extracorporeal therapies in veterinary medicine. 20,79,152 Hemoperfusion is effective at eliminating high-molecular-weight, protein-bound, or lipid-soluble toxins or drugs that are cleared poorly, if at all, by hemodialysis (i.e., diffusion and convection). Toxic indications include mushroom poisoning (amanitin toxins and phalloidin), herbicides, insecticides, overmedication, hepatic failure, and sepsis.79,152,161 Candidate toxins include barbiturates, salicylates, antimicrobials, antidepressants, chemotherapeutics, and NSAIDs that historically have been regarded as poorly removed by either hemodialysis or hemoperfusion. Hemoperfusion represents an important extension of the extracorporeal therapies that can be provided at regional hemodialysis programs for the management of intoxications for which there are no effective or efficient therapeutic alternatives.
Typical adsorbents used for hemoperfusion contain a vast and complex network of interstices and pores of varied shape and size. Toxic solutes interact by electrostatic and hydrogen bonds within the pores in the sorbent becoming entrapped and thus cleared from the blood. Selection of the adsorbent is critical for effective and safe hemoperfusion and must meet the following general criteria: (1) high adsorptive capacity for the drug(s) or toxin(s) to be removed; (2) nontoxic and hemocompatible; (3) minimal adsorptive selectivity for normal blood constituents; (4) sterile, free of endotoxins, and noncarcinogenic; and (5) compositional stability when exposed to blood (free of leachables).
Activated charcoal has been the adsorbent used most commonly to eliminate endogenous and exogenous toxins in vivo.27,152,161 Toxic substances are cleared according to their molecular size and affinity for the charcoal, concentration in extracellular fluid, distribution volume, degree and affinity of protein binding, and lipid solubility. Activated carbons can remove solutes with a molecular mass ranging from 60 to greater than 21,000 Da.27,185
Activated charcoal has a robust adsorptive capacity approaching 1000 m2/g but generally is nonselective in its solute binding. It can be manufactured with pore sizes ranging from <10 Å to greater than 100 Å to control the selectivity of solute removal. The larger the pore size, the larger the molecules that can be removed. With small pores (<10 Å), there is less concern about depleting molecules such as albumin, which would jeopardize safety. To prevent the release of fine residuals that could embolize in the kidneys, spleen, or lungs, most activated charcoals used for hemoperfusion are enveloped in an ultra-thin surface coatings (albumin-cellulose, cellulose, dextran) to prevent the release of residuals and improve biocompatibility and hemocompatibility without undue compromise to their adsorbent efficiency. The surface membrane has little influence on solutes with low molecular mass such as creatinine, uric acid, hippuran, indoles, and vitamin B12. For solutes with higher molecular mass (>3,500 Da), however, the surface membrane limits diffusion to the pores in the interior of the carbon. The combination of hemodialysis for small solute removal and hemoperfusion for removal of larger, protein-bound, or lipid-soluble molecules provides a broad spectrum of blood purification in animal poisonings61 (Figure 29-12).
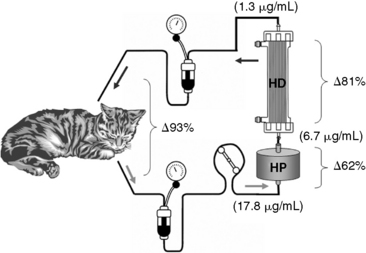
Figure 29-12 Combined hemoperfusion (HP) and hemodialysis (HD) for the treatment of enrofloxacin overdose in a uremic cat. A neonatal extracorporeal circuit was modified to include a 50-mL Clark biocompatible HP system (Clark Research and Development Inc., Folsom, La.) activated charcoal cartridge upstream to a Cobe 100HG hemodialyzer (Gambro Renal Products, Lakewood, Colo.). This combined blood purification technique resulted in a marked decrease in the blood enrofloxacin concentration (numbers in parentheses) through the extracorporeal circuit from 17.8 to 6.7 µg/mL (Δ62%) across the HP cartridge and from 6.7 to 1.3 µg/mL (Δ81%) across the hemodialyzer and 93% reduction across both devices at 10 minutes of treatment. Combined HD/HP provided a safe and effective additional route of clearance for enrofloxacin in this cat with renal compromise.
Despite the theoretical benefits, decisions to initiate extracorporeal therapies for patients with acute intoxications remains problematic. The current availability of experienced programs is limited, and the established benefits of extracorporeal therapies for known toxins are poorly defined. Extracorporeal therapy is generally indicated if the clinical signs of intoxication are progressive or deteriorating and if the toxin can be cleared faster with the intervention than by endogenous clearance. For an intoxicant such as ethylene glycol, experience with hemodialysis is extensive, documented, and effective; treatment decisions are easily justified. Hemodialysis is the most efficient and cost-effective means to clear this toxin (and its metabolites) from the animal and to prevent the renal and extrarenal consequences associated with the intoxication. It can be recommended and justified above all other treatments. For other toxins, documentation of efficacy and outcome is limited, but the window and opportunity for possible benefit is finite and decreases hourly following exposure.
The goals for extracorporeal therapies (hemodialysis and hemoperfusion) are to eliminate the toxin and its metabolites entirely from the animal as quickly as possible and to correct the accompanying fluid, electrolyte, and acid-base disturbances, and attending uremia. For suspected poisonings amenable to extracorporeal elimination hemodialysis or hemodialysis/hemoperfusion should be initiated immediately upon diagnosis to ensure rapid elimination of the toxin regardless of previous antidotal therapy or the absence of clinical signs. If the animal needs to be transported, appropriate antidotal therapy should be administered in addition to general supportive therapies.
For some toxins (such as ethylene glycol), it generally is possible to eliminate 90% to 95% or more of the toxin with a single intensive extracorporeal treatment. For intoxications other than ethylene glycol, experience is more anecdotal and recommendations for extracorporeal blood purification must be made with less evidence. Therapeutic decisions must be balance against the historical consequences of the intoxication, the efficacy of alternative therapies, and the potential for adverse consequences of the procedure. Hemoperfusion should be considered for lipid soluble, highly protein-bound toxins with molecular mass larger than the cutoff limits of the dialysis membrane. Therapy is more efficacious when the volume of distribution is small (plasma volume or ECF volume [i.e., <0.5 L/kg]). The treatment goal for detoxification is 100% elimination of the toxin and toxic metabolites. This is often difficult to achieve when experience with a specific toxins is limited and detection assays are unavailable during the procedure. For toxins and drugs including amatoxins, fluoroquinolones, and NSAIDs where morbidity is certain and molecular characteristics are favorable, urgent decisions to initiate combined hemodialysis/hemoperfusion must be ad hoc but are generally justified because of the low morbidity of these procedures and the possibility to alter the clinical course and outcome. As evidence for outcome benefits is acquired, more definitive recommendations can be justified. A precise definition of the window of opportunity for these therapeutic interventions is necessary for realistic therapeutic recommendations. Many toxins, such as amatoxins, will have sharply delimited therapeutic window in which the toxin can be eliminated before the clinical course is solidified and intervention is unjustified.
Hemodialysis is indicated for the treatment of poisoning or drug overdose with ethylene glycol, methanol, ethanol, salicylate, lithium, phenobarbital, acetaminophen, theophylline, aminoglycosides, tricyclic antidepressants, and possibly metaldehyde. 14,20,79,161,185 Hemodialysis secondarily corrects the acid-base and electrolyte abnormalities and the azotemia that accompany some intoxications (e.g., ethylene glycol, salicylate). Hemodialysis should be initiated once conventional treatments are deemed ineffective and continued until the concentration of the toxin has decreased to an acceptable level and the clinical toxicity has disappeared. Dialysis treatments should be continued for prolonged periods for toxins with delayed toxicity (i.e., paraquat), low blood concentrations, or significant redistribution following treatment.
Ethylene glycol (antifreeze poisoning) is a common intoxication in companion animal practice.34-36,59,95,96,173 Clinical signs develop within minutes and progress variably from lethargy, nausea, vomiting, dehydration, agitation, and depression to convulsions, coma, and death. Severe metabolic acidosis and hypocalcemia are seen with significant exposure, and in later stages of the intoxication (12 to 24 hours), hypertension, cardiopulmonary failure, and acute oliguric renal failure dominate the clinical presentation. Ethylene glycol concentrations are highly variable and significantly higher in nonazotemic compared with azotemic dogs presented for antifreeze poisoning (Figure 29-13).137 Serum ethylene glycol and glycolic acid concentrations may persist for days at toxic concentrations in azotemic or anuric animals despite therapy with alcohol or 4-methylpyrazole. These inhibitors of alcohol dehydrogenase merely delay the enzymatic conversion of ethylene glycol, and their efficacy relies on the potential for renal elimination of both the toxin and its metabolites.
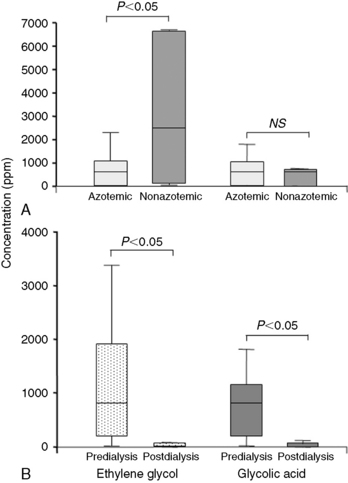
Figure 29-13 A, Box and whisker plots of the serum concentrations for ethylene glycol (left) and glycolic acid (right) in azotemic (light boxes; n = 20) and nonazotemic (dark boxes; n = 6) dogs presenting for hemodialysis. B, Box and whisker plots of the change in serum ethylene glycol (left) and glycolic acid (right) concentrations before and following hemodialysis in 26 azotemic and nonazotemic dogs poisoned with antifreeze.123
The goals for hemodialysis are to eliminate the ethylene glycol and its metabolites from the animal as quickly as possible and to correct the accompanying fluid, electrolyte, and acid-base disturbances and attending uremia. For suspected poisonings, hemodialysis should be initiated immediately to ensure rapid elimination of the toxin regardless of previous administration of antidotal therapy or the absence of clinical signs. If the animal needs to be transported, an initial dose of ethanol or 4-methylpyrazole should be administered, and existing dehydration and metabolic acidosis should be corrected.38,173 It generally is possible to eliminate 90% to 95% or more of the toxin with a single intensive dialysis treatment (Figure 29-14).34,35,137 However, the necessary amount of dialysis to deliver when toxicologic results are unavailable to confirm toxin removal during the treatment is problematic. Urea (MW, 60 Da) is similar in molecular size and distribution volume to ethylene glycol (MW, 62 Da) and can serve as an index for changes in ethylene glycol clearance similar to its surrogate role for removal of small-molecular-weight uremic toxins. The URR can be used to predict ethylene glycol reduction and the dialyzed blood volume required to achieve the removal goal (Figure 29-14).34,137 To achieve a 90% ethylene glycol reduction during the course of treatment, it is necessary to select treatment parameters that would promote the same URR for that patient.
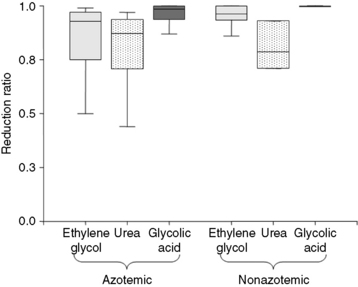
Figure 29-14 Box and whisker plots demonstrating the reduction ratios for ethylene glycol (light boxes), urea (stippled boxes), and glycolic acid (dark boxes) in azotemic (n = 20) and nonazotemic (n = 6) dogs. These observations demonstrate that both ethylene glycol and glycolic acid have removal kinetics similar to those for urea, and urea reduction ratio can serve as a convenient surrogate to predict removal of these toxins with hemodialysis.
For nonazotemic animals, 90% to 100% of the toxin should be removed during the first dialysis treatment. A second treatment is provided if delivery is incomplete during the first session or if there is a rebound in ethylene glycol after treatment. Vascular access with a temporary dialysis catheter generally provides adequate blood flow. The highest efficiency hemodialyzer compatible with the extracorporeal volume requirement of the animal should be used to maximize diffusive removal of the toxins. Blood flow rates between 15 and 25 mL/kg/min or faster are tolerated. A standard dialysate flow between 500 and 600 mL/min is used but can be increased if the blood flow rate is greater than 300 mL/min. A dialysate formulated with 3 or 4 mmol/L potassium, 30 to 35 mmol/L bicarbonate, and a physiologic sodium concentration is appropriate unless specific electrolyte, acid-base, or hemodynamic disorders are present. A neutral sodium phosphate additive should be added to the dialysate for nonuremic animals to prevent hypophosphatemia (see previous Dialysate Additives section). Ethanol should be added to the dialysate concentrate to achieve a dialysate ethanol concentration of approximately 0.1% in an effort to inhibit ongoing metabolism of ethylene glycol to its toxic metabolites during the extended hours of dialysis (see previous Dialysate Additives section). Ultrafiltration can be used to correct pulmonary edema or congestive heart failure secondary to the toxin or fluid administration. However, ultrafiltration is minimally effective for pulmonary effusions arising from respiratory distress syndrome or uremic pneumonitis associated with antifreeze poisoning.
In uremic animals, the goals for aggressive toxin removal are constrained by requirements to prevent dialysis disequilibrium syndrome, and dialysis must be delivered carefully to accommodate all of the patient’s needs. A temporary hemodialysis catheter generally is placed to expedite the initial treatment, but it is replaced with a permanent tunneled catheter after 2 weeks if additional dialysis is required. If the BUN concentration is less than 125 mg/dL, an intensive treatment as used in nonuremic animals is suitable. For animals with BUN concentrations greater than 150 mg/dL, the dialysis prescription should target a 90% to 100% ethylene glycol reduction, but it must be delivered with a slow, extended treatment tailored to the hourly URR targets appropriate for the degree of azotemia (see Table 29-2). For severely uremic animals, safe urea reduction and greater toxin removal is achieved when dialysis is provided over 6 to 10 hours. The remainder of the dialysis prescription should be formulated to specific complications accompanying the uremia, fluid volume status, acid-base and electrolyte disturbances, and hemodynamic stability. Ethanol can be added to the dialysate concentrate as described previously for nonazotemic animals. Mannitol (Mannitol Injection USP, Abbott Laboratories, North Chicago, Ill.) can be administered at 0.5 to 1.0 g/kg intravenously 45 to 60 minutes after starting dialysis in both mild and severely azotemic animals to prevent manifestations of dialysis disequilibrium syndrome.
Application of extracorporeal therapies should not be limited to single modalities but should be sequenced and combined to best match the clinical course and kinetics of the toxicant. Continuous versus intermittent therapies should not be considered mutually exclusive but rather complimentary. There is little justification not to include a dialytic device with a hemoperfusion cartridge when contemplating hemoperfusion. For many toxins, hemodialysis has the potential to improve toxin clearance in concert with hemoperfusion despite theoretical predictions to the contrary (Figure 29-12). Dose, blood concentration, changes in protein binding of the toxin, concurrent drugs/toxins, acid-base status, membrane type, and other variables may influence the diffusive potential of a toxin under different clinical conditions. The presence of the hemodialyzer in the extracorporeal circuit provides the potential for better thermal regulation and opportunity to correct coexisting fluid volume, electrolyte, acid-base, or uremic complications. Placement of the hemodialyzer after the hemoperfusion cartridge also helps to prevent depletion of calcium and glucose by charcoal sorbents and isolates the hemoperfusion cartridge from the ultrafiltration control system that may promote excessive fluid removal and hemoconcentration in the dialyzer should pressure increase in the sorbent bed.
Hemoperfusion with activated charcoal is generally safe but poses potential disadvantages or complications not generally experienced with hemodialysis. One of the principal concerns is the innate hemocompatibility of the adsorbent. Hemoperfusion with activated charcoal (as well as other sorbent materials) can cause thrombocytopenia and leukopenia because platelets and leukocytes become adhered to the sorbent or entrapped in fibrin films or clots formed on the charcoal. Platelets are destroyed also by surface irregularities of the charcoal bed. These effects are not unique to activated charcoal and are potential complications of polymer-based sorbents. Thrombocytopenia can be especially problematic if daily treatments are required that preclude adequate regeneration of platelets between treatments. If hemoperfusion is not combined with hemodialysis, the patient may experience significant cooling because of the duration the extracorporeal blood is exposed to room temperature. The sorbent bed also may become saturated at unpredictable times during the treatment resulting in incomplete removal of the toxin. Saturation of the sorbent is easily demonstrated by measuring the extraction ratio [(Atox – Vtox)/Atox] across the device or its whole blood clearance [Qb × extraction ratio], where Atox and Vtox are the concentrations of the solute or toxin at the inlet and outlet of the hemoperfusion cartridge, respectively, and Qb is the blood flow rate.
Complications of hemodialysis
The clinical and procedural complications associated with hemodialysis in humans and animals have been reviewed.34,59,78,147 The most serious complications include those associated with the interaction of the patient with the dialysis machinery, vascular access, hemodynamic stability, and solute disequilibrium. Hemodialysis is a technically complex therapy applied to patients with profound physiologic and metabolic derangements. Therapeutic complications can be anticipated from both the technical aspects of the process, the dynamic oscillations of solute and fluid homeostasis, exposure to nonbiologic materials, and sources of contamination and toxicities associated with procedural and medical therapies. Often it is difficult to distinguish whether adverse events are caused by the severity of the uremia, the intensity of its treatment, or the consequences of the intervention. The frequency and severity of complications related to homeostatic excursions early in dialysis diminish as the patient adapts to the procedures and the uremia is controlled, but they often are replaced by more subtle homeostatic imbalances imposed chronically.
The number and relative frequency but not the types of complications encountered in veterinary dialysis have changed over the past 25 years. In early years, dialysis disequilibrium and hemorrhage related to anticoagulation were the most common causes of fatal complications. Now, fatal dialysis-related complications are rarely encountered. Even in severely uremic patients, dialysis disequilibrium is averted by tailoring dialysis prescriptions to each patient and by use of precautionary measures including slow, less intensive prescriptions, prophylactic mannitol administration, and sodium profiling to minimize osmotic shifts in high-risk patients.
Symptomatic hypotension remains a persistent threat because of the increasing willingness to dialyze smaller patients and those with critical comorbidities. Blood pressure should be monitored at 15- to 30-minute intervals throughout the dialysis session to remain proactive and attentive to this concern. The susceptibility to hypotensive events is influenced by body size, hydration status, the severity of the uremia, the presence of concurrent cardiac disease or co-morbid conditions (e.g., hemorrhage, anemia, sepsis, pancreatitis), and current medications (e.g., antihypertensives, diuretics). For cats and small dogs, the volume of the extracorporeal circuit may exceed 25% to 30% of the intravascular volume and cause hypovolemia as the circuit is filled. The rapid removal of plasma solutes in the early stages of a dialysis treatment decreases intravascular volume and opposes refilling of fluid from the extravascular space. Excessive or rapid ultrafiltration that exceeds vascular refilling is the most frequent cause of hypovolemia and transient hypotension. Dialysis-induced hypotension usually responds quickly to modest fluid supplementation with either crystalloid or colloid solutions as vascular volume refills and fluid from the extravascular space is mobilized. Administration of small volumes of synthetic colloid solutions often is more effective at maintaining blood pressure, blood volume, and ongoing ultrafiltration with less net fluid administration. Nevertheless, changes in fluid removal patterns (i.e., slower ultrafiltration rates and longer treatment times) and minute-to-minute monitoring of changes in blood volume have mitigated the exacerbation of hypotension in the majority of patients.
Transcutaneous venous catheters remain the most feasible angioaccess for animal dialysis, but they represent the most predictable, problematic, and serious source of dialysis-related complications.59 Dialysis catheter thrombosis and cranial vena caval stenosis are still common problems, but earlier and more aggressive use of thrombolytic agents, selection of less thrombogenic catheters, and proactive catheter replacement have diminished the clinical impact of this important complication. There has been no noticeable change in prevalence of dialysis catheter infection over the years. The majority of infections reflect exit site or tunnel infections, and the prevalence of catheter-related bacteremia or septicemia is low, especially when considering the hygiene of animal patients. Yet, nearly 40% of veterinary dialysis patients have documented infection at some site including infections of the dialysis catheter, urine, feeding tube exit site, and other site leaving plenty of room for greater vigilance and improvement in this area.
Dialysis disequilibrium syndrome is a serious neurologic manifestation induced by rapid dialysis of animals with severe azotemia. Its pathogenesis is not completely understood but culminates with cerebral edema, increased intracranial pressure, and potential herniation of the brainstem.34,78,121,125 The disproportionate removal of solutes (mostly urea) from ECF relative to intracellular fluid in the brain imposes an osmotic pressure causing influx of water into brain cells, cerebral edema, and an increase in intracranial pressure.78,125,159,160 A possible molecular explanation suggests the relative distribution of urea channels is reduced and the distribution of water channels is increased in the brain of uremic animals. These adaptations exacerbate the delayed transference of urea from the brain during dialysis, causing increased osmotic accumulation of water.125 Paradoxical cerebral acidosis caused by rapid correction of severe metabolic acidosis and large transmembrane bicarbonate gradients also has been suggested to impose osmotic gradients by induction of idiogenic osmoles within the brain, causing further brain swelling.8-12
The risk for dialysis disequilibrium is greatest in cats and small dogs during initial dialysis treatments when the severity of azotemia and metabolic acidosis is greatest. Clinical signs such as tremors, restlessness, disorientation, vocalization, amaurosis, seizures, and coma may develop during the dialysis session or up to 24 hours after dialysis. If not recognized and managed properly, the syndrome may progress to seizures, coma, and death from respiratory arrest following herniation of the brainstem or compression of the cerebellum.34 In dogs, dialysis disequilibrium syndrome generally is insidious and commences with restlessness and vocalization before the onset of seizures or coma and affords ample opportunity to intervene at an early stage. In cats, the development of serious or fatal manifestations frequently is more acute and without warning.
Treatment of dialysis disequilibrium syndrome requires immediate attention, slowing or discontinuing the hemodialysis treatment, and intravenous administration of hypertonic (20% to 25%) mannitol (0.5 to 1.0 g/kg intravenously) to increase plasma osmolality and dissipate the osmotic gradient. Diazepam is used as needed to control seizures. For high-risk animals, the intensity of the dialysis treatment should be reduced purposefully by interspacing periods of dialysis with periods of bypass and decreasing the dialysate bicarbonate to better match that of the patient (see Hemodialysis Prescription for Acute Kidney Injury section). Mannitol can be administered prophylactically at 0.5 to 1.0 g/kg intravenously after the initial 20% to 25% of the dialysis treatment and also at the end of the treatment to reduce delayed onset of signs. Mild signs usually dissipate immediately with mannitol administration, whereas severe signs may require several doses and 24 to 48 hours of supportive care before resolution. Respiratory arrest from cerebral edema and brainstem compression requires ventilatory support until the edema resolves but carries a poor prognosis for recovery.
Outcome and prognosis
Dogs have been supported on chronic intermittent hemodialysis as long as 1.5 years, but complications related to vascular access and anemia management often curtail dialytic support beyond 6 months. Regional availability and financial and time constraints further limit use of hemodialysis for management of either acute or chronic uremia for extended periods of time. For acute kidney injury, renal recovery is not predicated on dialysis, but rather the cause, extent of damage, comorbid diseases, multiple organ involvement, and availability of diagnostic and therapeutic services. Overall survival rates of dogs and cats treated with hemodialysis for AKI is 41% to 52%, but survival time is highly dependent on the cause.3,59,96,149 The survival rate for AKI of infectious causes varies between 58% to 100%.3,59,62,123,149 Hemodynamic and metabolic causes have a reported 40% to 72% survival rate.62,123,149 Only 20% to 40% of patients dialyzed with AKI from toxic causes (especially ethylene glycol ingestion) survive.* This average of 50% survival has been reported in most studies over the past 15 years and is a marked improvement from the 15% expected survival rate from the earliest years of dialysis or for survival of animal patients with comparable stages of AKI treated conventionally without hemodialysis.36,39 Of the nonsurviving patients, about half die or are euthanized because of extrarenal conditions (e.g., pancreatitis, respiratory complications, DIC, and financial limitations). About a third of nonsurviving animals are euthanized due to failure of recovery of renal function within a narrow window of time that is dictated usually by economic constraints. Ongoing uremic signs, dialysis complications, and unknown causes account for the remaining patient deaths. Of surviving patients, approximately half regain normal renal function (defined by normal serum creatinine concentration) and half have persistent chronic kidney disease. A clinical scoring system for severity and outcome prediction of dogs with AKI receiving hemodialysis has been developed that may facilitate better characterization of dialysis outcomes in the future.149
Studies assessing survival in animals treated with conventional therapy cannot be compared with those managed with dialysis.36 There are often large disparities in the severity of the renal injury for animals managed with these respective approaches, and the window for survival is finite for animals treated conventionally and indefinite for animals treated with dialysis. Severity scoring and staging of AKI likely will provide more precise understanding of outcomes in the future.
Overall, these observations illustrate hemodialysis has a vital role in the therapeutic stratification of dogs and cats with uremia that remain nonresponsive to conventional medical therapy. Hemodialysis improves survival for animals with AKI beyond what would be expected with conventional management of the same animals. Clinical evidence and experience in human patients suggest a role for earlier intervention with renal replacement to avoid the morbidity of uremia and to promote better metabolic stability and recovery.
Future of veterinary hemodialysis
The establishment of hemodialysis and extracorporeal therapies in animal patients has had a long and sluggish evolution from experimental curiosity to the therapeutic mainstream. Currently, hemodialysis stands as a novel and technically complex therapy with narrowly targeted clinical indications and regional availability. For a large population of animal patients, it is the advanced standard for the management of acute and chronic uremia, life-threatening poisoning, and fluid overload for which there is no alternative therapy. Nevertheless, its tether to the clinical mainstream is tenuous and rest on the ongoing advocacy of its current practitioners to further expand its availability worldwide. Its future development will be secured by ongoing technological advancements in its human counterpart. The area that remains most critical and pivotal for the future rests on the comprehensive understanding of its physical and physiologic principles by those who apply this therapy to animals and the availability of high quality and comprehensive training opportunities for the future advocates and practitioners of this discipline worldwide.
1 Able J.J., Rowntree L.G., Turner B.B. On the removal of diffusible substances from circulating blood of living animals by dialysis. J Pharmacol Exp Ther. 1914;5:275-316.
2 Adin C.A. Screening criteria for feline renal transplant recipients and donors. Clin Tech Small Anim Pract. 2002;17:184-189.
3 Adin C.A., Cowgill L.D. Treatment and outcome of dogs with leptospirosis: 36 cases (1990-1998). J Am Vet Med Assoc. 2000;216:371-375.
4 Adin C.A., Gregory C.R., Kyles A.E., et al. Diagnostic predictors of complications and survival after renal transplantation in cats. Vet Surg. 2001;30:515-521.
5 Agostoni P.G., Marenzi G.C. Sustained benefit from ultrafiltration in moderate congestive heart failure. Cardiology. 2001;96:183-189.
6 Al-Hilali N., Al-Humoud H.M., Ninan V.T., et al. Profiled hemodialysis reduces intradialytic symptoms. Transplant Proc. 2004;36:1827-1828.
7 Apsner R., Buchmayer H., Gruber D., Sunder-Plassmann G. Citrate for long-term hemodialysis: prospective study of 1,009 consecutive high-flux treatments in 59 patients. Am J Kidney Dis. 2005;45(3):557-564.
8 Arieff A.I. More on the dialysis disequilibrium syndrome. West J Med. 1989;151:74-76.
9 Arieff A.I. Dialysis disequilibrium syndrome: current concepts on pathogenesis and prevention. Kidney Int. 1994;45:629-635.
10 Arieff A.I., Guisado R., Massry S.G., et al. Central nervous system pH in uremia and the effects of hemodialysis. J Clin Invest. 1976;58:306-311.
11 Arieff A.I., Lazarowitz V.C., Guisado R. Experimental dialysis disequilibrium syndrome: prevention with glycerol. Kidney Int. 1978;14:270-278.
12 Arieff A.I., Mahoney C.A. Pathogenesis of dialysis encephalopathy. Neurobehav Toxicol Teratol. 1983;5:641-644.
13 Bankhead M.M., Toto R.D., Star R.A. Accuracy of urea removal estimated by kinetic models. Kidney Int. 1995;48:785-793.
14 Bayliss G. Dialysis in the poisoned patient. Hemodial Int. 2010;14(2):158-167.
15 Bellomo R., Ronco C. Continuous haemofiltration in the intensive care unit. Crit Care. 2000;4:339-345.
16 Berg R.I., Francey T., Segev G. Resolution of acute kidney injury in a cat after lily (Lilium lancifolium) intoxication. J Vet Intern Med. 2007;21:857-859.
17 Bernsteen L., Gregory C.R., Kyles A.E., et al. Renal transplantation in cats. Clin Tech Small Anim Pract. 2000;15:40-45.
18 Bhimani J.P., Ouseph R., Ward R.A. Effect of increasing dialysate flow rate on diffusive mass transfer of urea, phosphate and {beta}2-microglobulin during clinical haemodialysis. Nephrol Dial Transplant. 2010.
19 Blake P.G. Adequacy of dialysis revisited. Kidney Int. 2003;63:1587-1599.
20 Borkan S.C. Extracorporeal therapies for acute intoxications. Crit Care Clin. 2002;18(2):393-420.
21 Boure T., Vanholder R. Biochemical and clinical evidence for uremic toxicity. Artif Organs. 2004;28:248-253.
22 Brummelhuis W.J., van Geest R.J., van Schelven L.J., Boer W.H. Sodium profiling, but not cool dialysate, increases the absolute plasma refill rate during hemodialysis. ASAIO J. 2009;55(6):575-580.
23 Brunet P., Dou L., Cerini C., et al. Protein-bound uremic retention solutes. Adv Ren Replace Ther. 2003;10:310-320.
24 Carl D.E., Feldman G. Estimating dialysis adequacy using ionic dialysance. Ren Fail. 2008;30(5):491-498.
25 Casino F.G., Lopez T. The equivalent renal urea clearance: a new parameter to assess dialysis dose. Nephrol Dial Transplant. 1996;11:1574-1581.
26 Casino F.G., Marshall M.R. Simple and accurate quantification of dialysis in acute renal failure patients during either urea non-steady state or treatment with irregular or continuous schedules. Nephrol Dial Transplant. 2004;19:1454-1466.
27 Chandy T., Sharma C.P. Activated charcoal microcapsules and their applications. J Biomater Appl. 1998;13(2):128-157.
28 Charra B., Calemard E., Ruffet M., et al. Survival as an index of adequacy of dialysis. Kidney Int. 1992;41:1286-1291.
29 Chesterton L.J., Priestman W.S., Lambie S.H., Fielding C.A., Taal M.W., Fluck R.J., et al. Continuous online monitoring of ionic dialysance allows modification of delivered hemodialysis treatment time. Hemodial Int. 2006;10(4):346-350.
30 Chesterton L.J., Selby N.M., Burton J.O., McIntyre C.W. Cool dialysate reduces asymptomatic intradialytic hypotension and increases baroreflex variability. Hemodial Int. 2009;13(2):189-196.
31 Chow M.T., Di Silvestro V.A., Yung C.Y., et al. Treatment of acute methanol intoxication with hemodialysis using an ethanol-enriched, bicarbonate-based dialysate. Am J Kidney Dis. 1997;30:568-570.
32 Coli L., Ursino M., Donati G., et al. Clinical application of sodium profiling in the treatment of intradialytic hypotension. Int J Artif Organs. 2003;26:715-722.
33 Cooper B.A., Aslani A., Ryan M., et al. Comparing different methods of assessing body composition in end-stage renal failure. Kidney Int. 2000;58:408-416.
34 Cowgill L.D., Francey T. Hemodialysis. In: DiBartola S.P., editor. Fluid therapy in small animal practice. St Louis: Elsevier; 2006:650-677.
35 Cowgill L.D., Francey T. Acute uremia. In: Ettinger S.J., Feldman E.C., editors. Textbook of veterinary internal medicine: diseases of the dog and cat. Philadelphia: WB Saunders; 2004:1731-1751.
36 Cowgill L.D., Langston C.E. Acute Kidney Injury. In: Bartges J., Polzin D., editors. Nephrology and Urology of Small Animals. Wiley-Blackwell, 2011. (in press)
37 Cowgill L.D., Langston C.E. History of hemodialysis in dogs and companion animals. In: Ing T.S., Rahman M.A., Kjellstrand C.M., editors. Dialysis: history, development and promise. Singapore: World Scientific Publishing Company, 2010. (in press)
38 Cowgill L.D., Langston C.E. Role of hemodialysis in the management of dogs and cats with renal failure. Vet Clin North Am Small Anim Pract. 1996;26:1347-1378.
39 Cowgill L.D., Maretzki C.H. CVT Update: Veterinary Applications of Hemodialysis. In: Bonagura J.D., editor. Kirk’s Current Veterinary Therapy XII: Small Animal Practice. Philadelphia: W. B. Saunders; 1995:975-977.
40 Daugirdas J.T. The post:pre-dialysis plasma urea nitrogen ratio to estimate K.t/V and NPCR: mathematical modeling. Int J Artif Organs. 1989;12:411-419.
41 Daugirdas J.T. Second generation logarithmic estimates of single-pool variable volume Kt/V: an analysis of error. J Am Soc Nephrol. 1993;4(5):1205-1213.
42 Daugirdas J.T., Depner T.A., Gotch F.A., Greene T., Keshaviah P., Levin N.W., et al. Comparison of methods to predict equilibrated Kt/V in the HEMO Pilot Study. Kidney Int. 1997;52(5):1395-1405.
43 Daugirdas J.T., Levin N.W., Kotanko P., Depner T.A., Kuhlmann M.K., Chertow G.M., et al. Comparison of proposed alternative methods for rescaling dialysis dose: resting energy expenditure, high metabolic rate organ mass, liver size, and body surface area. Semin Dial. 2008;21(5):377-384.
44 Debowska M., Lindholm B., Waniewski J. Adequacy indices for dialysis in acute renal failure: kinetic modeling. Artif Organs. 2010;34(5):412-419.
45 De Nicola L., Bellizzi V., Minutolo R., et al. Effect of dialysate sodium concentration on interdialytic increase of potassium. J Am Soc Nephrol. 2000;11:2337-2343.
46 Depner T.A. Benefits of more frequent dialysis: lower TAC at the same Kt/V. Nephrol Dial Transplant. 1998;13:20-24.
47 Depner T.A. Hemodialysis adequacy: basic essentials and practical points for the nephrologist in training. Hemodial Int. 2005;9(3):241-254.
48 Depner T.A. Prescribing hemodialysis: a guide to urea modeling. Boston: Kluwer Academic Publishers; 1990.
49 Depner T.A. Uremic toxicity: urea and beyond. Semin Dial. 2001;14:246-251.
50 Depner T.A., Bhat A. Quantifying daily hemodialysis. Semin Dial. 2004;17:79-84.
51 Depner T.A., Ing T.S. Toxic fluid flux? Am J Kidney Dis. 2010;56(1):1-4.
52 Depner T.A., Gotch F.A., Port F.K., et al. How will the results of the HEMO study impact dialysis practice. Semin Dial. 2003;16:8-21.
53 Di Filippo S., Manzoni C., Andrulli S., et al. How to determine ionic dialysance for the online assessment of delivered dialysis dose. Kidney Int. 2001;59:774-782.
54 Di Filippo S., Manzoni C., Andrulli S., et al. Ionic dialysance allows an adequate estimate of urea distribution volume in hemodialysis patients. Kidney Int. 2004;66:786-791.
55 Eloot S., Van Biesen W., Dhondt A., Van de Wynkele H., Glorieux G., Verdonck P., et al. Impact of hemodialysis duration on the removal of uremic retention solutes. Kidney Int. 2008;73(6):765-770.
56 Eknoyan G., Beck G.J., Cheung A.K., et al. Effect of dialysis dose and membrane flux in maintenance hemodialysis. N Engl J Med. 2002;347:2010-2019.
57 Eknoyan G. The wonderful apparatus of John Jacob Abel called the “artificial kidney”. Semin Dial. 2009;22:287-296.
58 Feriani M. Behaviour of acid-base control with different dialysis schedules. Nephrol Dial Transplant. 1998;13(Suppl. 6):62-65.
59 Fischer J.R., Pantaleo V., Francey T., et al. Veterinary hemodialysis: advances in management and technology. Vet Clin North Am Small Anim Pract. 2004;34:935-967. vi–vii
60 Flanigan M.J. Role of sodium in hemodialysis. Kidney Int Suppl. 2000;76:S72-S78.
61 Francey T., Benitah N., Pantaleo V., et al. Use of combined hemoperfusion and hemodialysis in accidental enrofloxacin overdose. 2004 ACVIM Forum Proceedings. 2004;18:441-442.
62 Francey T., Cowgill L.D. Use of hemodialysis for the management of ARF in the dog: 124 cases (1990-2001). J Vet Intern Med. 2002;16:352.
63 Goldfarb-Rumyantzev A.S., Cheung A.K., Leypoldt J.K. Computer simulation of small-solute and middle-molecule removal during short daily and long thrice-weekly hemodialysis. Am J Kidney Dis. 2002;40(6):1211-1218.
64 Gotch F.A. Evolution of the single-pool urea kinetic model. Semin Dial. 2001;14:252-256.
65 Gotch F.A. Is Kt/V urea a satisfactory measure for dosing the newer dialysis regimens? Semin Dial. 2001;14:15-17.
66 Gotch F.A., Levin N.W. Daily dialysis: the long and the short of it. Blood Purif. 2003;21(4–5):271-281.
67 Gotch F.A., Panlilio F.M., Buyaki R.A., et al. Mechanisms determining the ratio of conductivity clearance to urea clearance. Kidney Int Suppl. 2004:S3-S24.
68 Grollman E.F., Grollman A. Toxicity of urea and its role in the pathogenesis of uremia. J Clin Invest. 1959;38:749-754.
69 Guh J.Y., Yang C.Y., Yang J.M., et al. Prediction of equilibrated postdialysis BUN by an artificial neural network in high-efficiency hemodialysis. Am J Kidney Dis. 1998;31:638-646.
70 Hakim R.M., Breyer J., Ismail N., et al. Effects of dose of dialysis on morbidity and mortality. Am J Kidney Dis. 1994;23:661-669.
71 Hakim R.M., Depner T.A., Parker T.F.3rd. Adequacy of hemodialysis. Am J Kidney Dis. 1992;20:107-123.
72 Heidenheim A.P., Muirhead N., Moist L., et al. Patient quality of life on quotidian hemodialysis. Am J Kidney Dis. 2003;42:36-41.
73 Held P.J., Port F.K., Wolfe R.A., et al. The dose of hemodialysis and patient mortality. Kidney Int. 1996;50:550-556.
74 Henle T., Miyata T. Advanced glycation end products in uremia. Adv Ren Replace Ther. 2003;10:321-331.
75 Henrich W.L. Hemodynamic instability during hemodialysis. Kidney Int. 1986;30:605-612.
76 Hemodialysis Adequacy 2006 Work Group. Clinical Practice Guidelines for Hemodialysis Adequacy, Update 2006. Am J Kidney Dis. 2006;48(Suppl. 1):S2-S90.
77 Herget-Rosenthal S., Glorieux G., Jankowski J., Jankowski V. Uremic toxins in acute kidney injury. Semin Dial. 2009;22(4):445-448.
78 Himmelfarb J., Chuang P., Schulman G. Hemodialysis. In: Brenner B.M., editor. Brenner &Rector’s the kidney. Philadelphia: Saunders Elsevier; 2007:1957-2006.
79 Holubek W.J., Hoffman R.S., Goldfarb D.S., Nelson L.S. Use of hemodialysis and hemoperfusion in poisoned patients. Kidney Int. 2008;74(10):1327-1334.
80 Huang Z., Gao D., Letteri J.J., Clark W.R. Blood-membrane interactions during dialysis. Semin Dial. 2009;22(6):623-628.
81 Huang Z., Letteri J.J., Ronco C., Clark W.R. Basic principles of solute transport. In: Kellum J.A., Bellomo R., Ronco C., editors. Continurous Renal Replacement Therapy. New York: Oxford University Press; 2010:25-32.
82 Ikizler T.A., Schulman G. Adequacy of dialysis. Kidney Int Suppl. 1997;62:S96-S100.
83 Ishibe S., Peixoto A.J. Methods of assessment of volume status and intercompartmental fluid shifts in hemodialysis patients: implications in clinical practice. Semin Dial. 2004;17:37-43.
84 Jaeger J.Q., Mehta R.L. Assessment of dry weight in hemodialysis: an overview. J Am Soc Nephrol. 1999;10:392-403.
85 Jaffrin M.Y., Fenech M., de Fremont J.F., et al. Continuous monitoring of plasma, interstitial, and intracellular fluid volumes in dialyzed patients by bioimpedance and hematocrit measurements. ASAIO J. 2002;48:326-333.
86 Johnson W.J., Hagge W.W., Wagoner R.D., et al. Effects of urea loading in patients with far-advanced renal failure. Mayo Clin Proc. 1972;47:21-29.
87 Kanagasundaram N.S., Greene T., Larive A.B., et al. Prescribing an equilibrated intermittent hemodialysis dose in intensive care unit acute renal failure. Kidney Int. 2003;64:2298-2310.
88 Karnik J.A., Young B.S., Lew N.L., Herget M., Dubinsky C., Lazarus J.M., et al. Cardiac arrest and sudden death in dialysis units. Kidney Int. 2001;60(1):350-357.
89 Kazory A., Ross E.A. Emerging therapies for heart failure: renal mechanisms and effects. Heart Fail Rev. (Aug 3):2010.
90 Krivitski N.M., Kislukhin V.V., Snyder J.W., MacGibbon D.R., Kuznetsova O.A., Reasons A.M., et al. In vivo measurement of hemodialyzer fiber bundle volume: theory and validation. Kidney Int. 1998;54(5):1751-1758.
91 Kuhlmann M.K. Phosphate elimination in modalities of hemodialysis and peritoneal dialysis. Blood Purif. 2010;29(2):137-144.
92 Kuhlmann U., Goldau R., Samadi N., et al. Accuracy and safety of online clearance monitoring based on conductivity variation. Nephrol Dial Transplant. 2001;16:1053-1058.
93 Lambie S.H., McIntyre C.W. Developments in online monitoring of haemodialysis patients: towards global assessment of dialysis adequacy. Curr Opin Nephrol Hypertens. 2003;12:633-638.
94 Langston C.E. Acute renal failure caused by lily ingestion in six cats. JAVMA. 2002;220:49-52.
95 Langston C.E. Acute Uremia. In: Ettinger S.J., Feldman C.E., editors. Textbook of Veterinary Internal Medicine. Philadelphia: Saunders Elsevier; 2010:1969-1984.
96 Langston C.E., Cowgill L.D., Spano J.A. Applications and outcome of hemodialysis in cats: a review of 29 cases. J Vet Intern Med. 1997;11:348-355.
97 Lesaffer G., De Smet R., D’Heuvaert T., et al. Comparative kinetics of the uremic toxin p-cresol versus creatinine in rats with and without renal failure. Kidney Int. 2003;64:1365-1373.
98 Levine J., Bernard D.B. The role of urea kinetic modeling, TACurea, and Kt/V in achieving optimal dialysis: a critical reappraisal. Am J Kidney Dis. 1990;15:285-301.
99 Leypoldt J.K., Jaber B.L., Zimmerman D.L. Predicting treatment dose for novel therapies using urea standard Kt/V. Semin Dial. 2004;17(2):142-145.
100 Lindsay R.M., Leitch R., Heidenheim A.P., et al. The London Daily/Nocturnal Hemodialysis Study—study design, morbidity, and mortality results. Am J Kidney Dis. 2003;42:5-12.
101 Locatelli F., Buoncristiani U., Canaud B., Köhler H., Petitclerc T., Zucchelli P. Dialysis dose and frequency. Nephrol Dial Transplant. 2005;20(2):285-296.
102 Locatelli F., Buoncristiani U., Canaud B., et al. Haemodialysis with on-line monitoring equipment: tools or toys? Nephrol Dial Transplant. 2005;20:22-33.
103 Locatelli F., Covic A., Chazot C., et al. Optimal composition of the dialysate, with emphasis on its influence on blood pressure. Nephrol Dial Transplant. 2004;19:785-796.
104 Lopot F., Valek A. Time-averaged concentration–time-averaged deviation: a new concept in mathematical assessment of dialysis adequacy. Nephrol Dial Transplant. 1988;3:846-848.
105 Lowrie E., Lew N. The urea reduction ratio (URR): a simple method for evaluating hemodialysis treatment. Contemp Dial Nephrol. 1991;12:11-20.
106 Lowrie E.G., Laird N.M., Parker T.F., et al. Effect of the hemodialysis prescription of patient morbidity: report from the National Cooperative Dialysis Study. N Engl J Med. 1981;305:1176-1181.
107 Lowrie E.G., Teehan B.P. Principles of prescribing dialysis therapy: implementing recommendations from the National Cooperative Dialysis Study. Kidney Int Suppl. 1983;23(Apr):S113-S122.
108 Maduell F., Vera M., Serra N., Collado S., Carrera M., Fernández A., et al. Kt as control and follow-up of the dose at a hemodialysis unit. Nefrologia. 2008;28(1):43-47.
109 Maggiore Q. Isothermic dialysis for hypotension-prone patients. Semin Dial. 2002;15:187-190.
110 Maggiore Q., Pizzarelli F., Santoro A., et al. The effects of control of thermal balance on vascular stability in hemodialysis patients: results of the European randomized clinical trial. Am J Kidney Dis. 2002;40:280-290.
111 Marenzi G., Lauri G., Grazi M., et al. Circulatory response to fluid overload removal by extracorporeal ultrafiltration in refractory congestive heart failure. J Am Coll Cardiol. 2001;38:963-968.
112 Mawby D.I., Bartges J.W., DAvignon A., et al. Comparison of various methods for estimating body fat in dogs. J Am Anim Hosp Assoc. 2004;40:109-114.
113 McFarlane P.A. More of the same: Improving outcomes through intensive hemodialysis. Semin Dial. 2009;22(6):598-602.
114 Mercadal L., Ridel C., Petitclerc T. Ionic dialysance: principle and review of its clinical relevance for quantification of hemodialysis efficiency. Hemodial Int. 2005;9(2):111-119.
115 Messa P., Gropuzzo M., Cleva M., et al. Behaviour of phosphate removal with different dialysis schedules. Nephrol Dial Transplant. 1998;13(Suppl. 6):43-48.
116 Michael M., Brewer E.D., Goldstein S.L. Blood volume monitoring to achieve target weight in pediatric hemodialysis patients. Pediatr Nephrol. 2004;19:432-437.
117 Michel K.E., Sorenmo K., Shofer F.S. Evaluation of body condition and weight loss in dogs presented to a veterinary oncology service. J Vet Intern Med. 2004;18:692-695.
118 Moret K., Beerenhout C.H., van den Wall Bake A.W., Gerlag P.G., van der Sande F.M., Leunissen K.M., et al. Ionic dialysance and the assessment of Kt/V: the influence of different estimates of V on method agreement. Nephrol Dial Transplant. 2007;22(8):2276-2282.
119 Noghnogh A.A., Reid R.W., Nawab Z.M., et al. Preparation of ethanol-enriched, bicarbonate-based hemodialysates. Artif Organs. 1999;23:208-209.
120 Owen W.F.Jr, Lew N.L., Liu Y., et al. The urea reduction ratio and serum albumin concentration as predictors of mortality in patients undergoing hemodialysis. N Engl J Med. 1993;329:1001-1006.
121 Palmer C.A. Neurologic manifestations of renal disease. Neurol Clin. 2002;20:23-34. v
122 Pantaleo V., Francey T., Cowgill L.D. Analysis of hyperkalemia in dogs on chronic hemodialysis. ACVIM Forum 2005. Baltimore, Md. J Vet Int Med. 2005;19:434.
123 Pantaleo V., Francey T., Fischer J.R., et al. Application of hemodialysis for the management of acute uremia in cats: 119 cases (1993-2003). J Vet Intern Med. 2004;18:418.
124 Parker T.F.3rd, Husni L., Huang W., et al. Survival of hemodialysis patients in the United States is improved with a greater quantity of dialysis. Am J Kidney Dis. 1994;23:670-680.
125 Patel N., Dalal P., Panesar M. Dialysis disequilibrium syndrome: a narrative review. Semin Dial. 2008;21(5):493-498.
126 Pedrini L.A., Zereik S., Rasmy S. Causes, kinetics and clinical implications of post-hemodialysis urea rebound. Kidney Int. 1988;34:817-824.
127 Pergola P.E., Habiba N.M., Johnson J.M. Body temperature regulation during hemodialysis in long-term patients: is it time to change dialysate temperature prescription? Am J Kidney Dis. 2004;44:155-165.
128 Petitclerc T. Festschrift for Professor Claude Jacobs. Recent developments in conductivity monitoring of haemodialysis session. Nephrol Dial Transplant. 1999;14:2607-2613.
129 Phipps L.M., Harris D.C. Review: modelling the dialysate. Nephrology (Carlton). 2010;15(4):393-398.
130 Polaschegg H.D. Automatic, noninvasive intradialytic clearance measurement. Int J Artif Organs. 1993;16:185-191.
131 Polzin D.J. Chronic Kidney Disease. In: Ettinger S.J., Feldman C.E., editors. Textbook of Veterinary Internal Medicine. Philadephia: Saunders Elsevier; 2010:1990-2020.
132 Pun P.H., Lehrich R.W., Honeycutt E.F., Herzog C.A., Middleton J.P. Modifiable risk factors associated with sudden cardiac arrest within hemodialysis clinics. Kidney Int. (Sep 1):2010.
133 Raff A.C., Meyer T.W., Hostetter T.H. New insights into uremic toxicity. Curr Opin Nephrol Hypertens. 2008;17(6):560-565.
134 Redaelli B. Electrolyte modelling in haemodialysis–potassium. Nephrol Dial Transplant. 1996;11(Suppl. 2):39-41.
135 Redaelli B. Hydroelectrolytic equilibrium change in dialysis. J Nephrol. 2001;14(Suppl. 4):S7-S11.
136 Redaelli B., Bonoldi G., Di Filippo G., et al. Behaviour of potassium removal in different dialytic schedules. Nephrol Dial Transplant. 1998;13(Suppl. 6):35-38.
137 Rollings C.E., Francey T., Cowgill L.D. Use of hemodialysis in uremic and non-uremic dogs with ethylene glycol toxicity. J Vet Intern Med. 2004;18:416.
138 Ronco C., Giomarelli P. Current and future role of ultrafiltration in CRS. Heart Fail Rev. (Oct 23):2010.
139 Ronco C., Ricci Z., Brendolan A., et al. Ultrafiltration in patients with hypervolemia and congestive heart failure. Blood Purif. 2004;22:150-163.
140 Rosales L.M., Schneditz D., Morris A.T., et al. Isothermic hemodialysis and ultrafiltration. Am J Kidney Dis. 2000;36:353-361.
141 Sargent J.A., Gotch F.A. Mathematic modeling of dialysis therapy. Kidney Int Suppl. 1980;10:S2-S10.
142 Sargent J.A., Gotch F.A. Principles and biophysics of dialysis. In: Maher J.F., editor. Replacement of renal function by dialysis: a textbook of dialysis. Boston: Kluwer Academic Publishers; 1989:87-143.
143 Sargent J.A., Lowrie E.G. Which mathematical model to study uremic toxicity? National Cooperative Dialysis Study. Clin Nephrol. 1982;17:303-314.
144 Schneditz D., Daugirdas J.T. Compartment effects in hemodialysis. Semin Dial. 2001;14:271-277.
145 Schneditz D., Ronco C., Levin N. Temperature control by the blood temperature monitor. Semin Dial. 2003;16:477-482.
146 Schroeder K.L., Sallustio J.E., Ross E.A. Continuous haematocrit monitoring during intradialytic hypotension: precipitous decline in plasma refill rates. Nephrol Dial Transplant. 2004;19:652-656.
147 Schulman G., Himmelfarb J. Hemodialysis. In: Brenner B.M., editor. Brenner & Rector’s the kidney. Philadelphia: WB Saunders; 2004:2564-2624.
148 Scott N.E., Francey T., Jandrye K. Baclofen intoxication in a dog successfully treated with hemodialysis and hemoperfusion coupled with intensive supportive care. J Vet Emerg Crit Care. 2007;17:191-196.
149 Segev G., Fascetti A.J., Weeth L.P., Cowgill L.D. Correction of hyperkalemia in dogs with chronic kidney disease consuming commercial renal therapeutic diets by a potassium-reduced home-prepared diet. J Vet Intern Med. 2010;24(3):546-550.
150 Selby N.M., McIntyre C.W. How should dialysis fluid be individualized for the chronic hemodialysis patient? Temperature. Semin Dial. 2008;21(3):229-231.
151 Shackman R., Chisholm G.D., Holden A.J., et al. Urea distribution in the body after haemodialysis. BMJ. 1962;5301:355-358.
152 Shalkham A.S., Kirrane B.M., Hoffman R.S., Goldfarb D.S., Nelson L.S. The availability and use of charcoal hemoperfusion in the treatment of poisoned patients. Am J Kidney Dis. 2006;48(2):239-241.
153 Sharma A., Espinosa P., Bell L., et al. Multicompartment urea kinetics in well-dialyzed children. Kidney Int. 2000;58:2138-2146.
154 Sheppard R., Panyon J., Pohwani A.L., et al. Intermittent outpatient ultrafiltration for the treatment of severe refractory congestive heart failure. J Card Fail. 2004;10:380-383.
155 Sherman R.A. Modifying the dialysis prescription to reduce intradialytic hypotension. Am J Kidney Dis. 2001;38:S18-S25.
156 Sherman R.A., Cody R.P., Rogers M.E., et al. Accuracy of the urea reduction ratio in predicting dialysis delivery. Kidney Int. 1995;47:319-321.
157 Shinaberger J.H. Quantitation of dialysis: historical perspective. Semin Dial. 2001;14:238-245.
158 Sigdell J.E., Tersteegen B. Clearance of a dialyzer under varying operating conditions. Artif Organs. 1986;10:219-225.
159 Silver S.M., DeSimone J.A.Jr, Smith D.A., et al. Dialysis disequilibrium syndrome (DDS) in the rat: role of the “reverse urea effect”. Kidney Int. 1992;42:161-166.
160 Silver S.M., Sterns R.H., Halperin M.L. Brain swelling after dialysis: old urea or new osmoles? Am J Kidney Dis. 1996;28:1-13.
161 Smith J.P., Chang I.J. Extracorporeal treatment of poisoning. In Brenner B.M., editor: Brenner and Rector’s The Kidney, 8th ed, Philadelphia: Saunders/Elsevier, 2008.
162 Smye S.W., Hydon P.E., Will E. An analysis of the single-pool urea kinetic model and estimation of errors. Phys Med Biol. 1993;38:115-122.
163 Smye S.W., Tattersall J.E., Will E.J. Modeling the postdialysis rebound: the reconciliation of current formulas. ASAIO J. 1999;45:562-567.
164 Song J.H., Park G.H., Lee S.Y., et al. Effect of sodium balance and the combination of ultrafiltration profile during sodium profiling hemodialysis on the maintenance of the quality of dialysis and sodium and fluid balances. J Am Soc Nephrol. 2005;16:237-246.
165 Spalding E.M., Chamney P.W., Farrington K. Phosphate kinetics during hemodialysis: Evidence for biphasic regulation. Kidney Int. 2002;61(2):655-667.
166 Stanley S.W., Langston C.E. Hemodialysis in a dog with acute renal failure from currant toxicity. Can Vet J. 2008;49:63-66.
167 Steuer R.R., Bell D.A., Barrett L.L. Optical measurement of hematocrit and other biological constituents in renal therapy. Adv Ren Replace Ther. 1999;6:217-224.
168 Steuer R.R., Harris D.H., Weiss R.L., et al. Evaluation of a noninvasive hematocrit monitor: a new technology. Am Clin Lab. 1991;10:20-22.
169 Stiller S., Bonnie-Schorn E., Grassmann A., et al. A critical review of sodium profiling for hemodialysis. Semin Dial. 2001;14:337-347.
170 Suranyi M., Chow J.S. Review: anticoagulation for haemodialysis. Nephrology (Carlton). 2010;15(4):386-392.
171 Suri R., Depner T.A., Blake P.G., et al. Adequacy of quotidian hemodialysis. Am J Kidney Dis. 2003;42:42-48.
172 Suri R.S., Depner T., Lindsay R.M. Dialysis prescription and dose monitoring in frequent hemodialysis. Contrib Nephrol. 2004;145:75-88.
173 Thrall M. Advances in therapy for antifreeze poisoning. Calif Vet. 1998;52:18-22.
174 Toussaint N.D. Review: differences in prescription between conventional and alternative haemodialysis. Nephrology (Carlton). 2010;15(4):399-405.
175 Tyagi P.K., Winchester J.F., Feinfeld D.A. Extracorporeal removal of toxins. Kidney Int. 2008;74(10):1231-1233.
176 van der Sande F.M., Wystrychowski G., Kooman J.P., Rosales L., Raimann J., Kotanko P., et al. Control of core temperature and blood pressure stability during hemodialysis. Clin J Am Soc Nephrol. 2009;4(1):93-98.
177 Vanholder R., Baurmeister U., Brunet P., Cohen G., Glorieux G., Jankowski J., et al. A bench to bedside view of uremic toxins. J Am Soc Nephrol. 2008;19(5):863-870.
178 Vanholder R., De Smet R., Glorieux G., et al. Review on uremic toxins: classification, concentration, and interindividual variability. Kidney Int. 2003;63:1934-1943.
179 Vanholder R., Glorieux G., De Smet R., et al. Low water-soluble uremic toxins. Adv Ren Replace Ther. 2003;10:257-269.
180 Vanholder R., Glorieux G., De Smet R., et al. New insights in uremic toxins. Kidney Int. 2003;63:S6-S10.
181 Vanholder R.C., Glorieux G.L., De Smet R.V. Uremic toxins: removal with different therapies. Hemodial Int. 2003;7:162-167.
182 Vanholder R., Van Laecke S., Glorieux G. The middle-molecule hypothesis 30 years after: lost and rediscovered in the universe of uremic toxicity? J Nephrol. 2008;21(2):146-160.
183 Waniewski J., Debowska M., Lindholm B. Theoretical and numerical analysis of different adequacy indices for hemodialysis and peritoneal dialysis. Blood Purif. 2006;24(4):355-366.
184 Wertman B.M., Gura V., Schwarz E.R. Ultrafiltration for the management of acute decompensated heart failure. J Card Fail. 2008;14(9):754-759.
185 Winchester J.F. Dialysis and hemoperfusion in poisoning. Adv Ren Replace Ther. 2002;9:26-30.
186 Yeun J.Y., Depner T.A. Complications related to inadequate delivered dose: recognition and management in acute and chronic dialysis. In: Lameire N., Mehta R.L., editors. Complications of dialysis. New York: Marcel Dekker, Inc; 2000:89-115.
187 Zhou Y.L., Liu H.L., Duan X.F., Yao Y., Sun Y., Liu Q. Impact of sodium and ultrafiltration profiling on haemodialysis-related hypotension. Nephrol Dial Transplant. 2006;21(11):3231-3237.
188 Zhu F., Kuhlmann M.K., Sarkar S., et al. Adjustment of dry weight in hemodialysis patients using intradialytic continuous multifrequency bioimpedance of the calf. Int J Artif Organs. 2004;27:104-109.
189 Zhu F., Sarkar S., Kaitwatcharachai C., et al. Methods and reproducibility of measurement of resistivity in the calf using regional bioimpedance analysis. Blood Purif. 2003;21:131-136.