2
M-Mode Imaging
Judy R. Mangion
Introduction
M-mode echocardiography provides superior temporal resolution, and therefore subtle changes are more readily appreciated with m-mode than with two-dimensional or three-dimensional methods. M-mode methods may include more precise measurement of cardiac chambers (provided they are obtained on-axis), independent motion of valvular vegetations, early closure or early opening of valve structures with respect to timing in the cardiac cycle (Fig. 2.1), identification of prosthetic valves and their function, assessment of paradoxical interventricular septal motion and dyssynchrony of the left ventricle, as well as fluttering of valve leaflets seen in association with valvular regurgitation (Fig. 2.2). The exaggerated motion, as well as restricted motion, of various cardiac structures is readily appreciated with m-mode.
An m-mode echocardiogram provides one-dimensional information regarding a particular cardiac structure as it relates to time and distance, with time displayed on the horizontal axis and depth or distance displayed on the vertical axis. The strength of the reflected echo is represented as the brightness of structures appearing on the image display (Fig. 2.3). The limitations of m-mode echocardiography relate to having to draw conclusions in one dimension about a three-dimensional structure. Furthermore, measurements are dependent on the identification of clearly defined borders, which may not be obtainable in technically challenging patients. With respect to m-mode’s derived ejection fractions, calculations may not be accurate when regional wall motion abnormalities are present.
Although m-mode echocardiography was described more than 50 years ago by Edler and Hertz, new concepts and technologies that take advantage of m-mode techniques continue to expand. For example, color m-mode echocardiography evolved in the 1990s to provide rapid evaluation of time-related events, such as diastolic mitral regurgitation, and has also been used to provide less load-dependent information regarding diastolic function. Color m-mode techniques have also been applied to the assessment of myocardial deformation or strain, in which a curved m-mode is traced along an area of interest of the myocardium and information is displayed in both parametric and graphic format, allowing sensitive evaluation of normal and abnormal patterns of ventricular contractility. M-mode images of the left ventricle are often displayed simultaneously during left ventricular strain analysis to improve interpretation of the curves with respect to the cardiac cycle. Although m-mode echocardiography has been around for a long time and the field of echocardiography has dramatically changed with numerous technological advances, m-mode recordings can still oftentimes provide additional and complementary information, resulting in a more accurate and complete echocardiographic assessment of the heart.
This chapter provides case examples of normal m-mode exams, as well as a diverse spectrum of abnormal m-mode exams illustrating classic cardiac anomalies. Each figure legend provides a “clinical pearl” highlighting important concepts involved in either technically obtaining or interpreting each m-mode image.
Normal M-Mode Measurements
Normal M-Mode Examination of the Aortic Root, Aortic Cusp Separation, and Left Atrial Dimension
Traditionally, m-mode measurements have been used to quantify aortic root size, aortic valve cusp separation, and left atrial dimensions. These measurements are obtained from the parasternal long-axis imaging plane. By convention, m-mode measurements are made leading edge to leading edge, which differs from two-dimensional measurements, which are made inner edge to inner edge. The m-mode cursor is placed perpendicular to the structure being measured. Fig. 2.4 illustrates the proper m-mode technique for measuring the aortic root, aortic valve cusps, and left atrium. The aortic root is measured in end-diastole, just before the onset of the QRS complex. The aortic valve cusp separation is measured in midsystole. The normal appearance of the aortic cusps during systole is that of an “open box,” which reflects holosystolic opening of the valve leaflets. By convention, the left atrium is measured during ventricular systole or atrial diastole, when the left atrium is maximally filled with blood.
Normal M-Mode Examination of the Left Ventricle
The m-mode examination of the left ventricle is also obtained from the parasternal long-axis imaging plane. By convention, left ventricular dimensions are made at end-diastole and end-systole, whereas measurements of left ventricular wall thicknesses, including the interventricular septum and posterior wall of the left ventricle, are usually measured only at end diastole. By convention, the m-mode cursor is placed perpendicular to the long axis of the left ventricle at the level of the mitral valve chordae. Fig. 2.5 illustrates the proper m-mode technique for measuring left ventricular internal dimensions at end systole and end diastole, as well as septal and posterior wall thicknesses in end diastole. In the absence of left ventricular regional wall motion abnormalities, m-mode recordings of the left ventricle have been shown to be an accurate method for calculating left ventricular ejection fraction via the method of Teicholtz. According to this method, the left ventricular dimension in diastole squared minus the left ventricular dimension in systole squared is divided by the left ventricular dimension in diastole squared.
Normal M-Mode Examination of the Mitral Valve
The normal m-mode recording of the mitral valve—like that of the aortic root, left atrium, and left ventricle—is also obtained from the parasternal long-axis imaging plane. The m-mode cursor is placed perpendicular to the long axis of the left ventricle at the level of the tips of the mitral leaflets. The anterior leaflet and posterior leaflet are noted to open fully in diastole and close completely during systole (Fig. 2.6).
Normal M-Mode Examination of the Pulmonic Valve
The normal m-mode recording of the pulmonic valve is usually obtained from the parasternal short-axis view, but it can also be obtained from the right ventricular outflow tract view and main pulmonary artery and bifurcation view (Fig. 2.7). Like the normal aortic valve, the normal pulmonic valve opens throughout systole and has the appearance of “an open box.” Normal m-mode letter designations for the pulmonic valve are as follows: a = atrial contraction, b = onset of ventricular systole, c = ventricular ejection, d = during ventricular ejection, and e = end of ventricular ejection.

FIG. 2.1 This figure provides an overall view of the strengths of m-mode echocardiography as a diagnostic tool, including superior temporal resolution, which allows for more precise measurements, and timing of motion of cardiac structures with respect to the cardiac cycle. AC, Aortic valve closure; AML, anterior mitral leaflet; EDV, end diastolic volume; ESV, end systolic volume; LV, left ventricle; MO, mitral valve opening; PLAX, parasternal long axis; PML, posterior mitral leaflet. Courtesy of Bernard E. Bulwer, MD, FASE.
Normal M-Mode Examination of the Tricuspid Valve
The normal m-mode recording of the tricuspid valve is obtained from the right ventricular inflow view (Fig. 2.8). Usually, only the anterior leaflet of the tricuspid valve is transected by the m-mode cursor. M-mode letter designations for the tricuspid valve are as follows: D = onset of diastole, E = maximal opening of the leaflet, F = most posterior position of the leaflet, E–F slope = closing motion of the leaflet, A = leaflet reopening with atrial contraction, and C = leaflet closure following ventricular systole.
M-Mode Echocardiography in the Identification of Abnormal Cardiac Structure and Function
Bicuspid Aortic Valve
M-mode echocardiography can often be useful in helping establish the diagnosis of a bicuspid aortic valve (Fig. 2.9). The classic appearance of a bicuspid aortic valve on m-mode echocardiography is eccentric closing of the valve leaflets. If present, this is strongly suggestive of a bicuspid aortic valve, although in some cases, bicuspid aortic valves may open symmetrically.
Subaortic Membrane
M-mode echocardiography can also be helpful in confirming the diagnosis of a fixed subaortic membrane (Fig. 2.10). In this case, an m-mode cursor placed through the aortic valve leaflets will demonstrate early closure of the leaflets in systole. In this case, the subaortic membrane decreases the pressure differential between the systemic circulation and left ventricle, causing the aortic valve to close early.
Mitral Valve Prolapse
M-mode echocardiography has also been used to diagnose mitral valve prolapse (Fig. 2.11). An m-mode cursor placed at the tip of the mitral leaflets in the parasternal long-axis view can demonstrate late systolic prolapse of the mitral leaflets into the left atrium. Because of the dependence of the ultrasound beam, however, mitral valve prolapse can be missed or overdiagnosed with m-mode echocardiography alone. For this reason, the diagnosis of mitral valve prolapse be confirmed by two-dimensional methods, which should demonstrate systolic prolapse of greater than 2 mm beyond the plane of the mitral annulus and into the left atrium.
Systolic Anterior Motion of the Mitral Valve
M-mode echocardiography is especially useful for establishing the presence of systolic anterior motion (SAM) of the mitral valve, causing dynamic left ventricular outflow tract obstruction (Fig. 2.12). This is often seen in the setting of hypertrophic obstructive cardiomyopathy; however, it can also occur in the absence of hypertrophic cardiomyopathy. In the parasternal long-axis view, as the left ventricular chamber decreases in systole, the anterior cusp of the mitral valve comes into forceful contact with the protruding interventricular septum. The m-mode recording is especially useful in providing information pertaining to the timing of the SAM of the mitral valve (i.e., early systolic, holosystolic, or late systolic).

FIG. 2.2 This figure illustrates the most common m-mode measurements obtained from the parasternal long-axis view, including measurements of the aortic root, cusp separation of the aortic valve leaflets, mitral valve opening and closure, and left ventricular measurements including internal dimensions in diastole and systole and septal and posterior wall thickness in end-diastole. Courtesy of Bernard E. Bulwer, MD, FASE.
Severe Aortic Insufficiency (Austin Flint Murmur)
M-mode echocardiography can also provide clues with respect to quantifying the severity of aortic insufficiency. In cases of severe aortic insufficiency, the aortic regurgitant jet can impinge on the anterior leaflet of the mitral valve, causing diastolic fluttering as well as early closure of the anterior leaflet of the mitral valve (Figs. 2.13–2.15), or the so-called Austin Flint murmur heard on clinical exam, which can be mistaken for the murmur of mitral stenosis. In cases of severe acute aortic insufficiency, a sudden increase in diastolic volume overload causes increased resistance by the ventricle to diastolic filling, resulting in early diastolic closure of the mitral valve.
Valvular Vegetations
Because of its higher frame rates (i.e., number of times per second the image is updated on ultrasound), m-mode echocardiography can sometimes identify vegetations that may be missed with two-dimensional echocardiography. M-mode echocardiography may demonstrate the presence of a mobile mass on one of the valves with independent motion (Fig. 2.16), which is highly suspicious for vegetation in patients with a strong clinical suspicion of endocarditis.
Rheumatic Mitral Valve Deformity
M-mode imaging can also be helpful in establishing the diagnosis of rheumatic mitral stenosis (Fig. 2.17). In this case there is reduced opening of the mitral leaflets during diastole due to fusion of the commissures. When used in combination with spectral Doppler of the mitral valve to measure gradients, pressure half-time–derived mitral valve areas, and direct planimetry of the mitral valve area, the added information provided by m-mode can often assist in making a more accurate judgment as to the severity of mitral stenosis, particularly when there are discrepant data.
Cardiomyopathy and Elevated Left Ventricular Filling Pressures
The m-mode examination of the mitral valve can also provide insight into hemodynamics in patients with cardiomyopathy. A classic m-mode finding in patients with dilated cardiomyopathy is the “b-notch” on the anterior mitral valve leaflet (Fig. 2.18). Although not always present, the b-notch, when identified, is indicative of a markedly elevated left ventricular end-diastolic pressure.
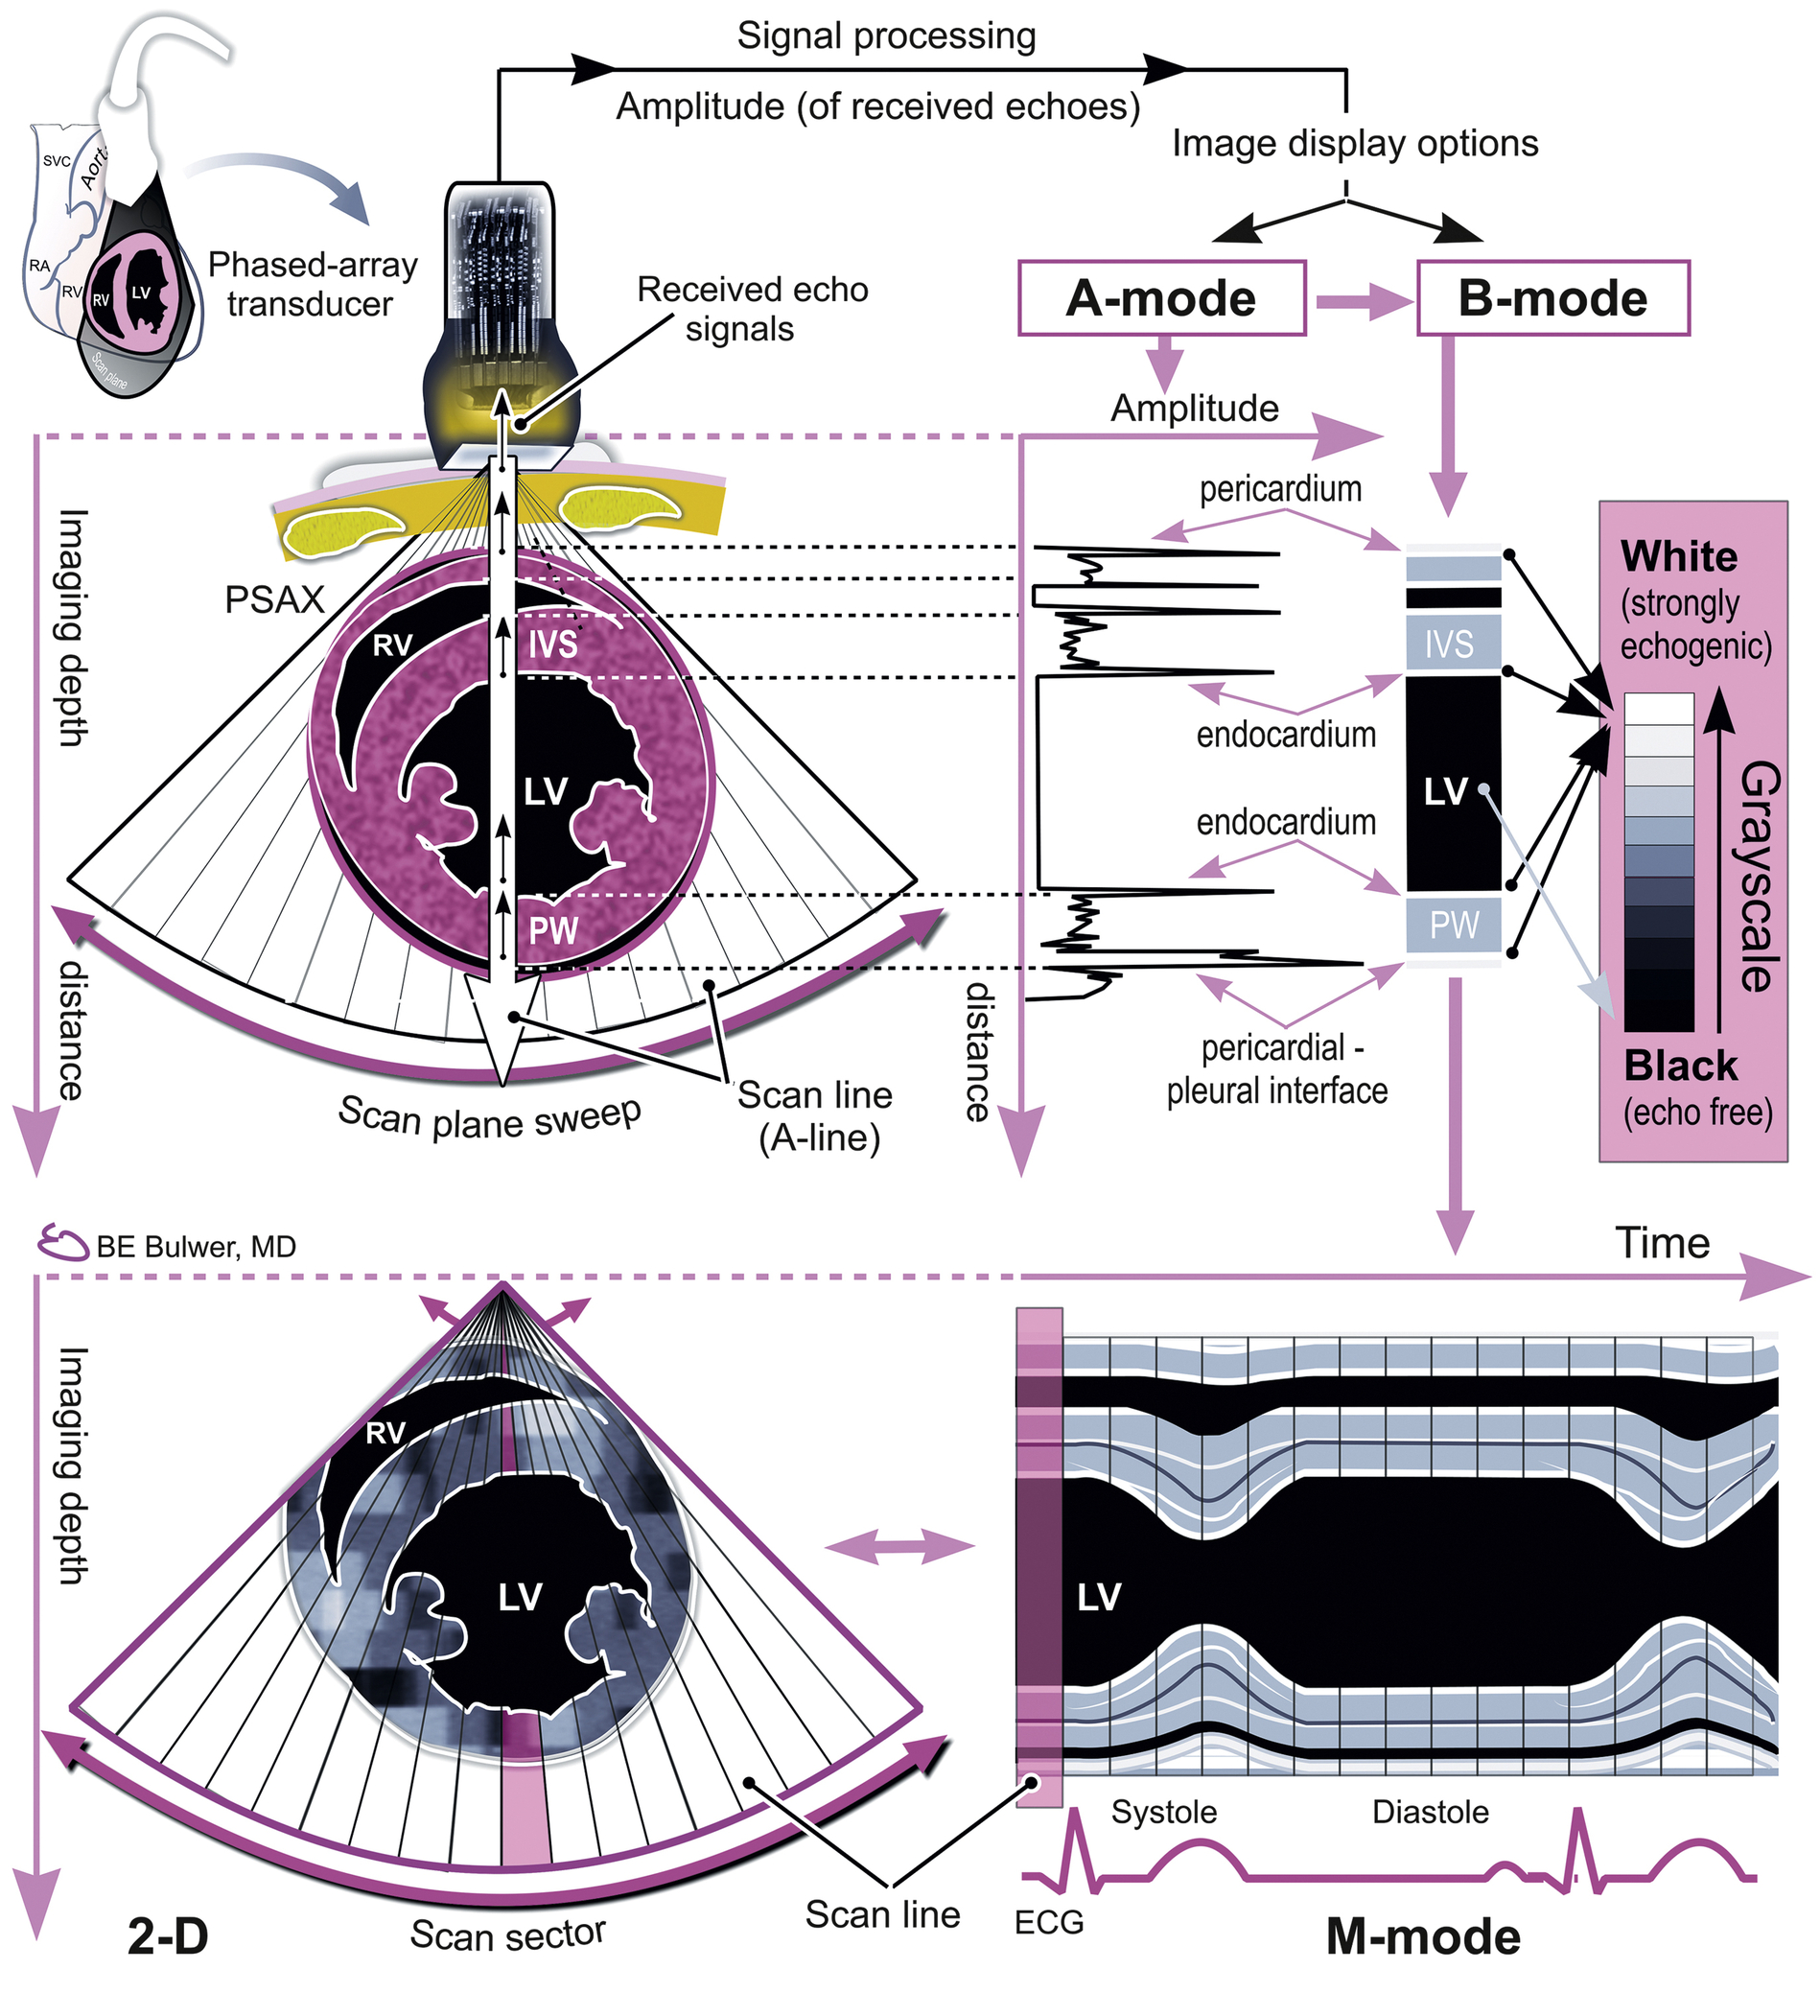
FIG. 2.3 With m-mode echocardiography, the strength of the reflecting echo structure is demonstrated by the brightness of the image on the ultrasound screen. Time is represented in milliseconds; with respect to the cardiac cycle (systole and diastole), it is displayed on the horizontal axis. Distance of the reflecting cardiac structure is displayed on the vertical axis. EDV, End diastolic volume; IVS, interventricular septum; LV, left ventricle; PSAX, parasternal short axis; PW, posterior wall; RV, right ventricle. Courtesy of Bernard E. Bulwer, MD, FASE.

FIG. 2.4 Normal m-mode examination of the aortic root, aortic valve cusps, and left atrium. Measurements are obtained in the parasternal long-axis imaging plane. Note the holosystolic opening of the aortic valve cusps. By convention, m-mode measurements are made leading edge to leading edge, which differs from two-dimensional measurements. The m-mode cursor is placed perpendicular to the aortic valve leaflets. Ao, Aorta; AoR, aortic root; AV, aortic valve; Cusp, aortic leaflet separation; LA, left atrium; Root, aortic root.
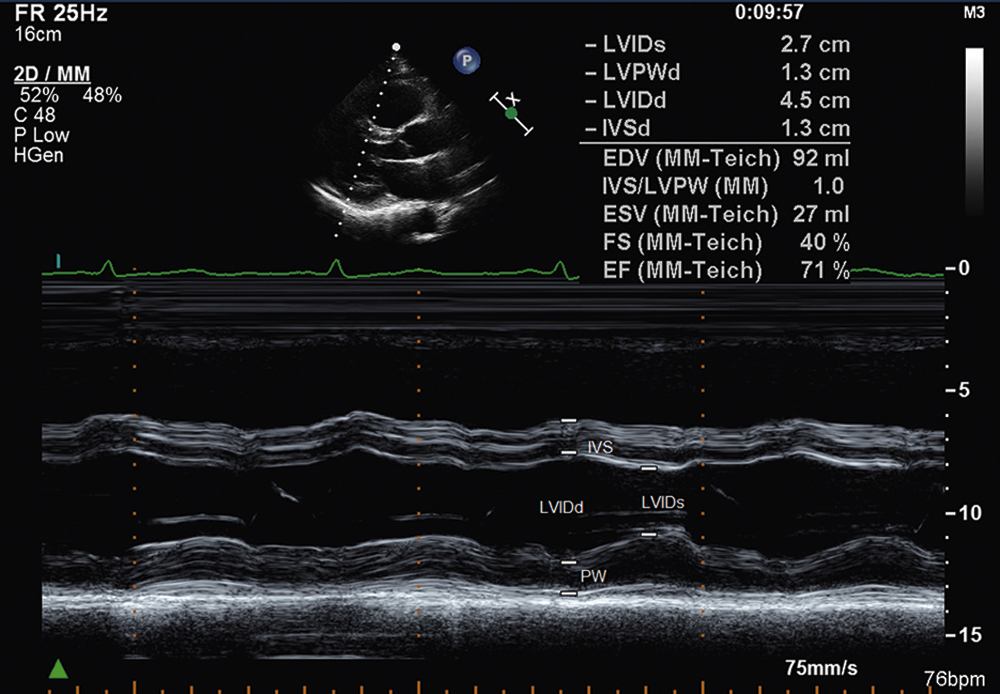
FIG. 2.5 Normal m-mode examination of the left ventricle obtained from the parasternal long-axis imaging plane. Left ventricular dimensions are made at end diastole and end systole, whereas septal and posterior wall thicknesses are usually measured only at end diastole. The m-mode cursor is placed perpendicular to the long axis of the left ventricle at the level of the mitral valve chordae. Ao, Aorta; AV, aortic valve; EDV, end diastolic volume; EF, ejection fraction; ESV, end systolic volume; FS, fractional shortening; IVS, interventricular septum; LVIDd, left ventricular internal dimension in diastole; LVIDs, left ventricular internal dimension in systole; LVPWD, left ventricle posterior wall diastole; PW, posterior wall.
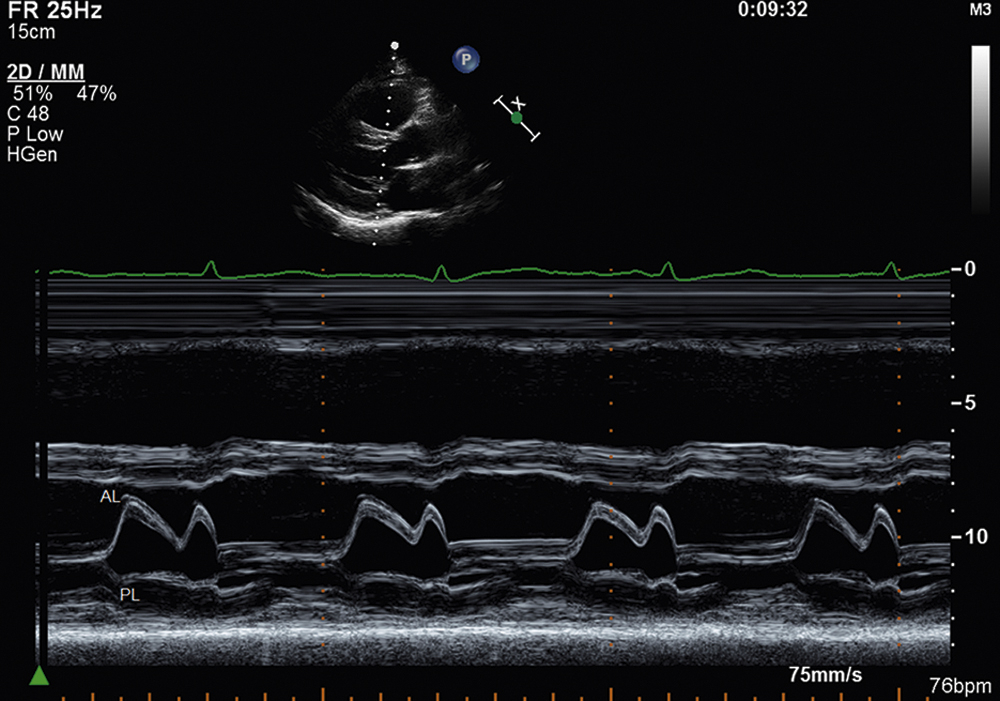
FIG. 2.6 Normal m-mode examination of the mitral valve leaflets from the parasternal long-axis imaging plane. The m-mode cursor is placed perpendicular to the long axis of the left ventricle at the level of the tips of the mitral leaflets. AL, Anterior leaflet; PL, posterior leaflet.
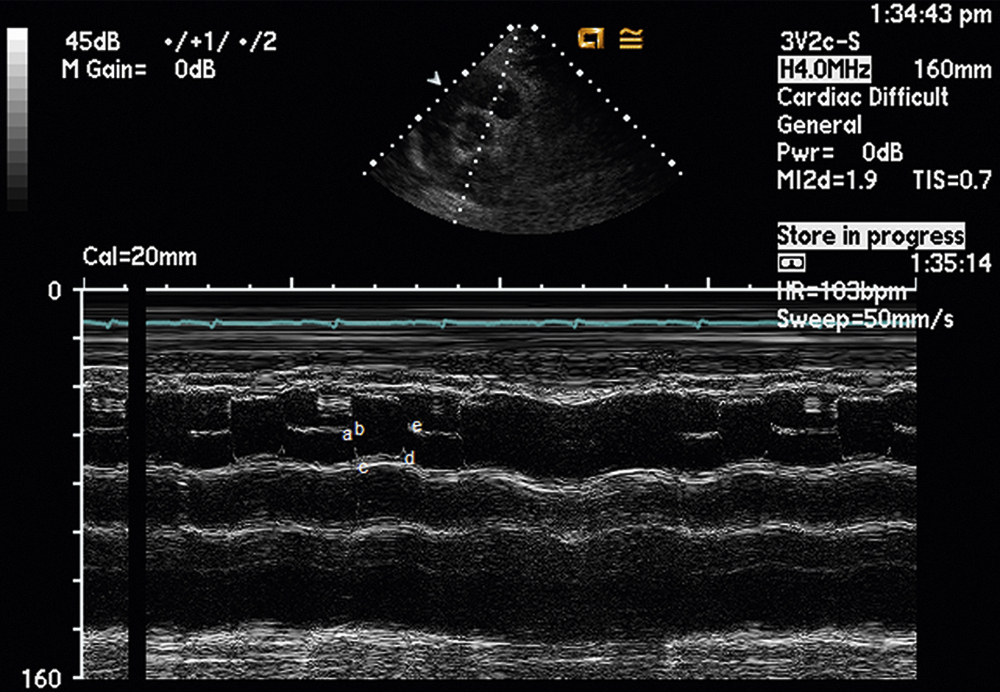
FIG. 2.7 Normal m-mode examination of the pulmonic valve obtained from the parasternal short-axis view. This recording may also be obtained from the parasternal right ventricular outflow view and the main pulmonary artery and bifurcation view. Note the holosystolic opening of the cusps, similar to the aortic valve. Often, m-mode of the pulmonic valve only transects the right posterior leaflet. In this example, both the anterior and right posterior leaflets are transected. The m-mode letter designations for the pulmonic valve are as follows: (a), atrial contraction; (b), onset of ventricular systole; (c), ventricular ejection; (d), during ventricular ejection; (e), end of ventricular ejection.

FIG. 2.8 Normal m-mode examination of the tricuspid valve obtained from the right ventricular inflow view. Usually only the anterior leaflet of the tricuspid valve is transected. RA, Right atrium; RV, right ventricle; TV, tricuspid valve. The m-mode letter designations for the tricuspid valve are as follows: (D), onset of diastole; (E), maximal opening of the leaflet; (F), most posterior position of the leaflet; (E–F slope), closing motion of the leaflet; (A), leaflet reopening with atrial contraction; (C), leaflet closure following ventricular systole.
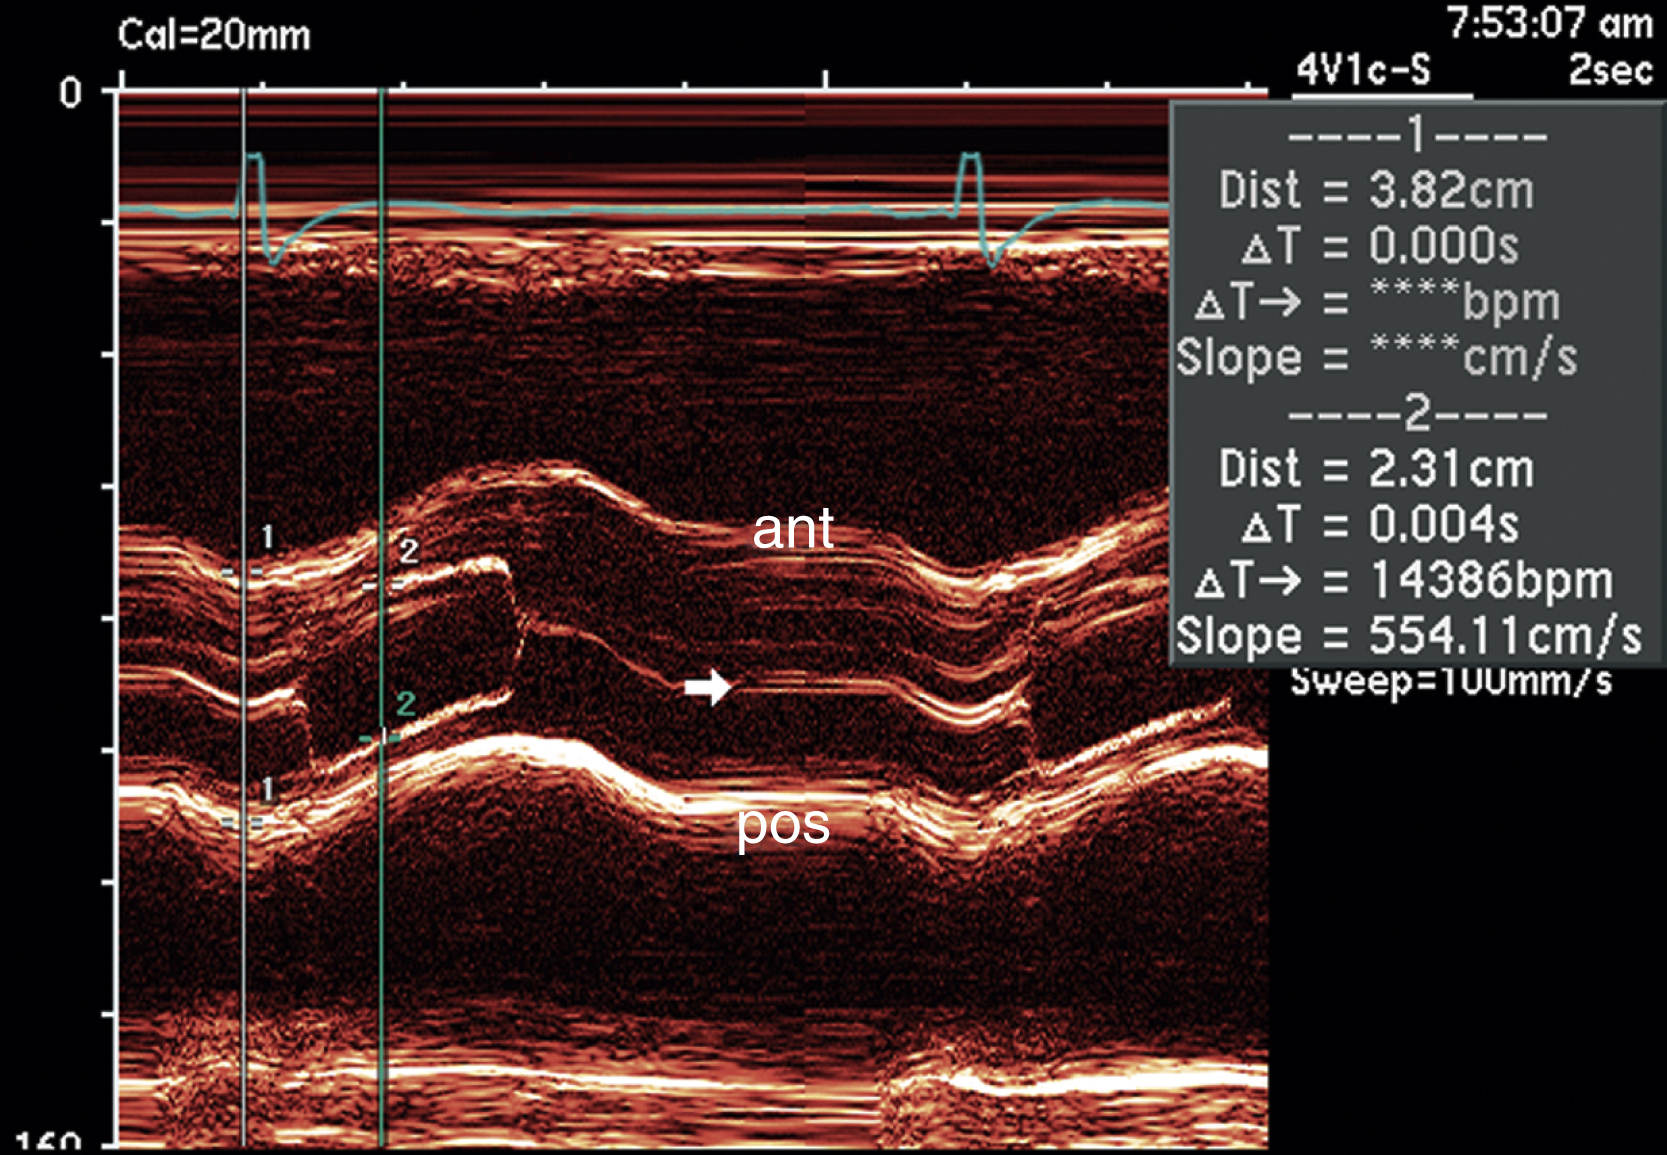
FIG. 2.9 M-mode examination of a bicuspid aortic valve obtained from the parasternal long-axis view. Note that in this case the closing of the valve is asymmetric (arrow). If present, this may be an important clue in establishing the diagnosis of bicuspid aortic valve. In some situations, bicuspid aortic valves may open symmetrically. ant, Anterior; pos, posterior.

FIG. 2.10 M-mode examination of the aortic valve demonstrating early systolic closure of the leaflets (arrows) due to a fixed subaortic membrane. The membrane decreases the pressure differential between the systemic circulation and left ventricle, causing the aortic valve to close early. This image was obtained with a transesophageal probe from a longitudinal view of the aortic valve.

FIG. 2.11 M-mode examination of the mitral valve demonstrating classic late systolic bileaflet mitral valve prolapse (arrows); the image was obtained from the parasternal long-axis view. Because of dependence on the ultrasound beam, prolapse can be missed or overdiagnosed with m-mode echocardiography alone; therefore the diagnosis needs to be confirmed by two-dimensional methods, demonstrating systolic prolapse of greater than 2 mm beyond the plane of the mitral annulus and into the left atrium.
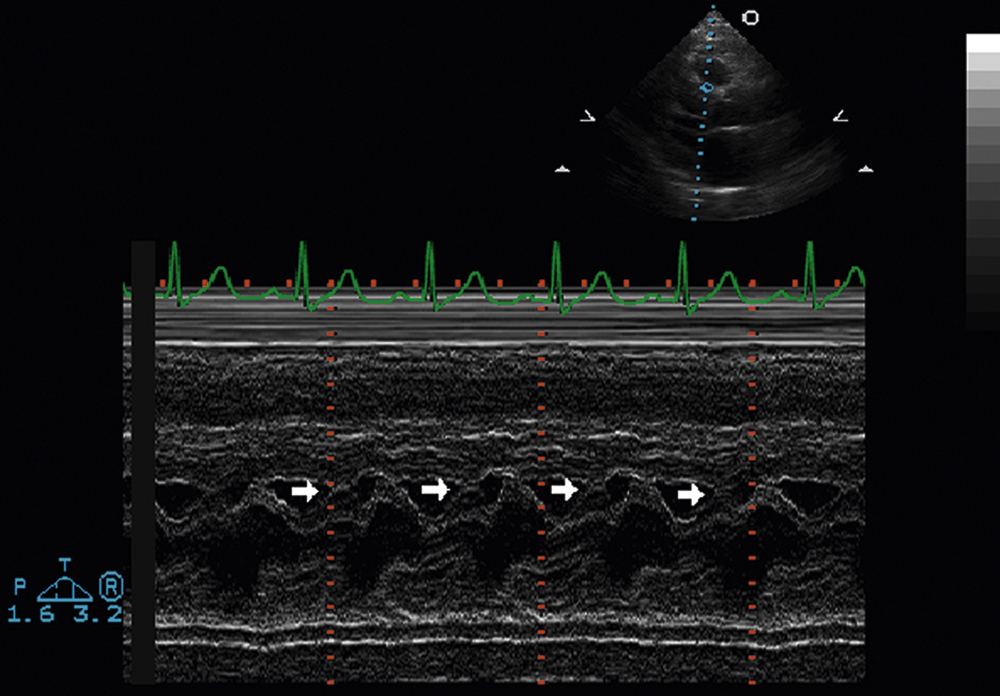
FIG. 2.12 M-mode examination of the mitral valve, parasternal long-axis view, demonstrating systolic anterior motion of the mitral valve (arrows), which is causing dynamic obstruction of the left ventricular outflow tract. This is often observed in the setting of hypertrophic obstructive cardiomyopathy. However, it can also occur in the absence of hypertrophic cardiomyopathy. In the setting of hypertrophic obstructive cardiomyopathy, the anterior cusp of the mitral valve comes into forceful contact with the protruding interventricular septum as the left ventricular chamber decreases in systole. The m-mode recording provides information pertaining to the timing of systolic anterior motion of the mitral valve.

FIG. 2.13 M-mode examination of the mitral valve, parasternal long-axis view, demonstrating high-frequency diastolic fluttering of the anterior mitral leaflet (arrows) due to severe aortic insufficiency. This is the equivalent of the Austin Flint murmur.
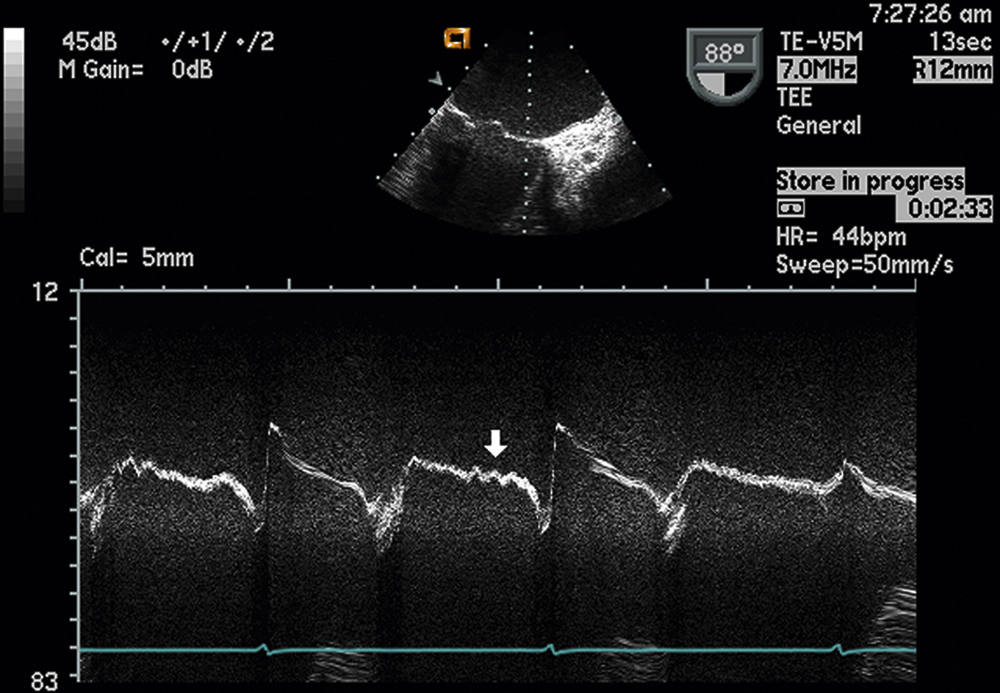
FIG. 2.14 M-mode examination of the mitral valve, midesophageal two-chamber view, also demonstrating high-frequency diastolic fluttering of the anterior mitral valve leaflet (arrow) due to severe aortic insufficiency, impinging on the leaflet.

FIG. 2.15 M-mode examination of the mitral valve, parasternal long-axis view, demonstrating early diastolic closure of the mitral valve (arrows) due to severe acute aortic insufficiency. The sudden increase in diastolic volume overload causes increased resistance by the ventricle to diastolic filling, causing early diastolic closure of the mitral valve.

FIG. 2.16 M-mode examination of the mitral valve demonstrating a large mobile mass with independent motion on the atrial surface of the posterior leaflet in a patient with suspected endocarditis (arrow). Because of its higher frame rates, m-mode echocardiography can sometimes identify vegetations that may be missed with two-dimensional echocardiography.
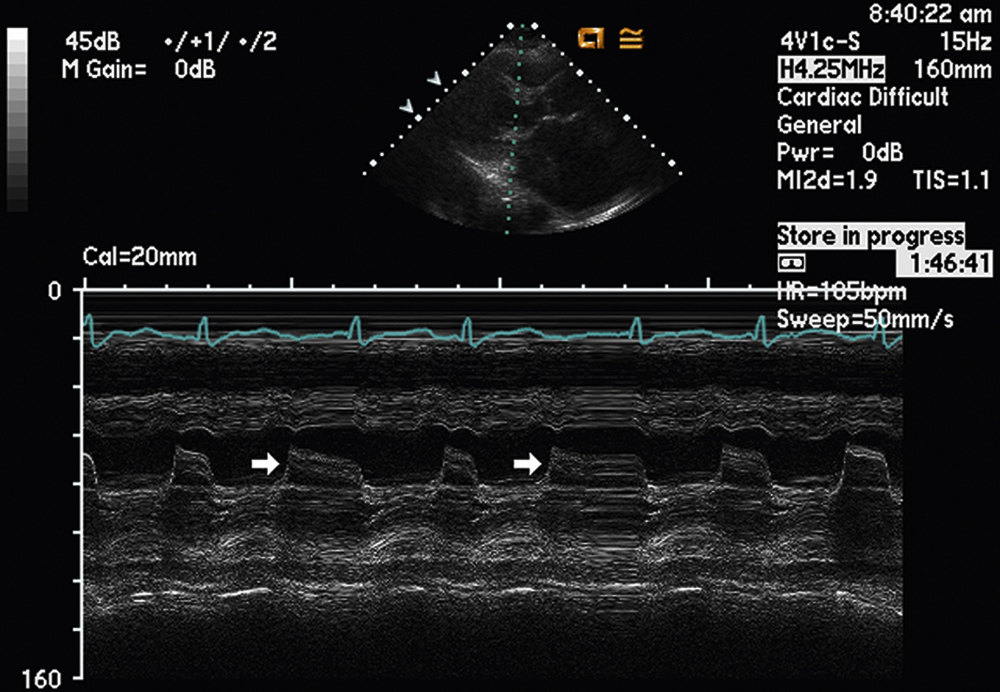
FIG. 2.17 M-mode examination of the mitral valve affected by rheumatic valvular heart disease. There is reduced opening of the mitral valve leaflets during diastole (arrows) due to fusion of the commissures.

FIG. 2.18 M-mode examination of the mitral valve demonstrating a “b-notch” on the anterior mitral valve leaflet (arrows) in a patient with a dilated cardiomyopathy. Although not always present, the b-notch, when identified, is indicative of markedly elevated left ventricular end-diastolic pressure.
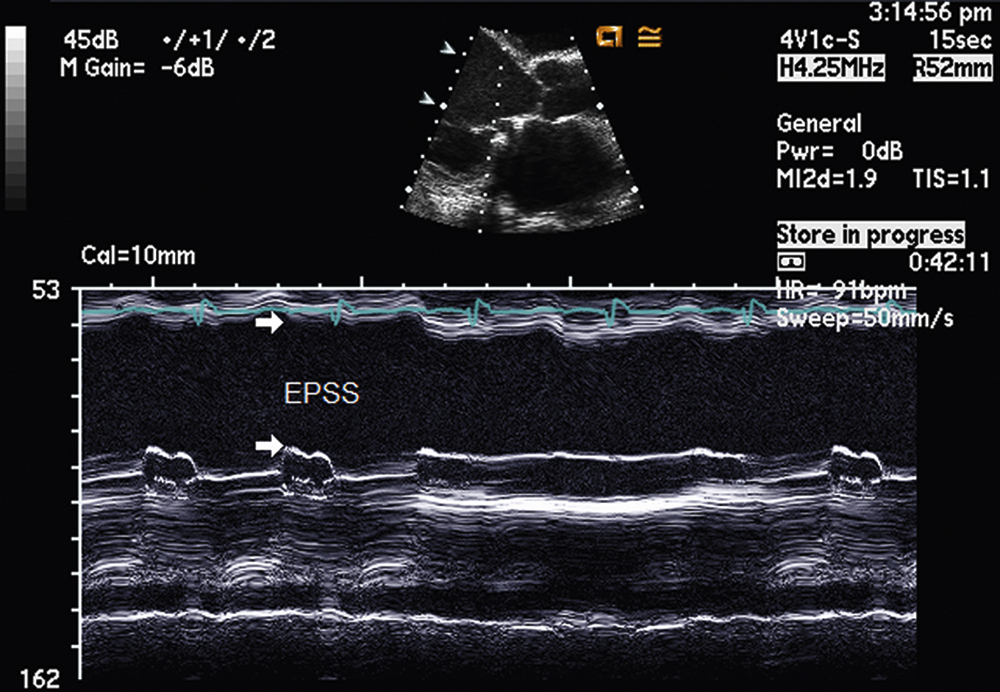
FIG. 2.19 M-mode examination of the mitral valve demonstrating enlarged E-point septal separation (EPSS) (arrows) in a patient with dilated cardiomyopathy due to a reduced stroke volume with poor systolic function. In general, a normal EPSS should be less than 1 cm. EPSS on m-mode can provide a useful marker of overall left ventricular systolic function.
Cardiomyopathy and Reduced Left Ventricular Ejection Fraction
M-mode interrogation of the mitral valve has also been commonly used to estimate left ventricular ejection fraction in patients with global left ventricular systolic dysfunction. The m-mode examination in this case will demonstrate an enlarged E point septal separation (EPSS) (Fig. 2.19). This is due to a reduced stroke volume with poor left ventricular systolic function. In general, a normal EPSS should be less than 1 cm. The greater the EPSS distance on m-mode, the worse the overall left ventricular systolic function.
Left Ventricular Dyssynchrony
M-mode interrogation of the left ventricle has also been used to establish the presence of left ventricular dyssynchrony in patients with heart failure being considered for cardiac resynchronization therapy (CRT). Fig. 2.20 illustrates an m-mode recording of the left ventricle in a patient with left bundle branch block (LBBB). In this patient, there is marked paradoxical septal motion or delayed contraction of the interventricular septum in systole. Measurement of the septal-to-posterior wall motion delay (SPWMD), which is defined as the distance between the timing of septal and posterior wall contraction, has been used to predict a positive response to CRT therapy, with greater than 130 ms being used as the cutoff to predict a positive response to CRT.
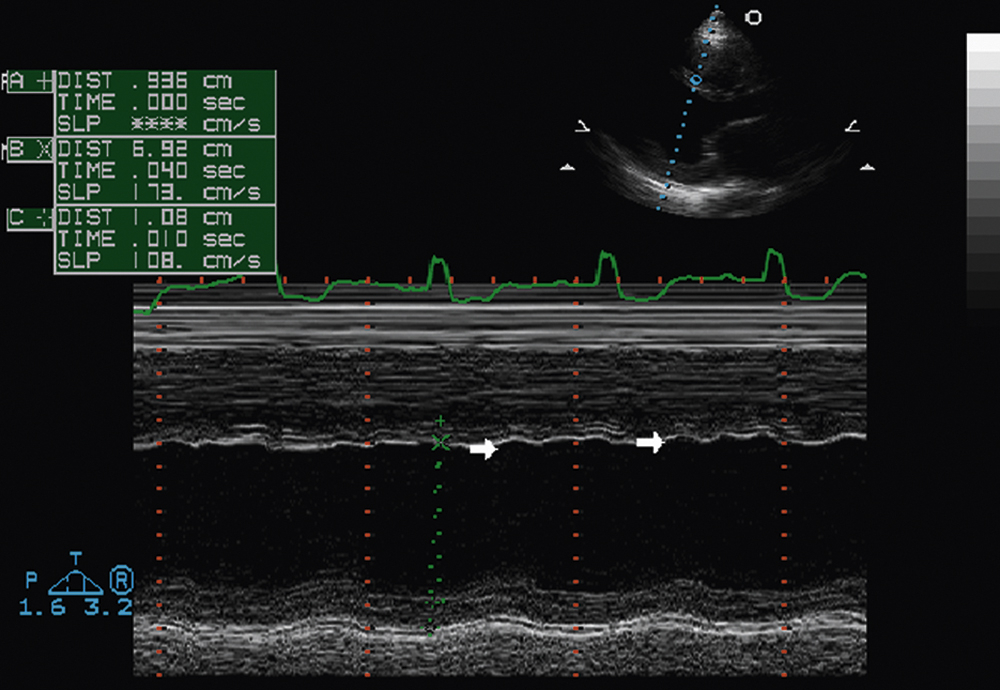
FIG. 2.20 M-mode examination of the left ventricle, parasternal long-axis view, in a patient with left bundle branch block. Note the paradoxical septal motion, or delayed contraction of the interventricular septum in systole (arrows).
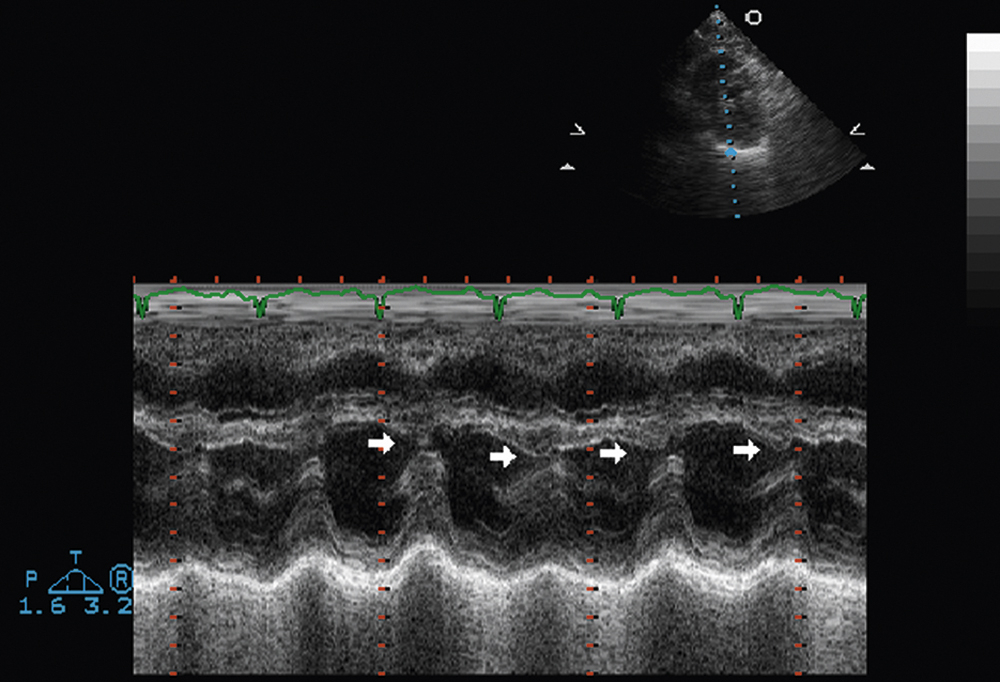
FIG. 2.21 M-mode examination of the left ventricle, parasternal long-axis view, demonstrating exaggerated respiratory variation of the position of the interventricular septum (“septal bounce”) (arrows). This is a nonspecific finding in suspected constrictive pericarditis. If clinical suspicion of cardiac constriction is high, it should warrant additional directed comprehensive two-dimensional and Doppler evaluation.
Constrictive Pericarditis
M-mode interrogation of the left ventricle can also be helpful in detecting an exaggerated respiratory variation of the position of the interventricular septum (“septal bounce”) (Fig. 2.21). Although this is a nonspecific finding in suspected constrictive pericarditis, its identification, along with a strong clinical suspicion of cardiac constriction, should warrant additional directed comprehensive two-dimensional and Doppler evaluation for other markers of cardiac constriction.
Cor Pulmonale
M-mode examination of the left ventricle can also be helpful in identifying echocardiographic evidence of right heart failure or cor pulmonale complicated by evidence of both pressure and volume overload of the right ventricle (Fig. 2.22). M-mode interrogation can readily identify both systolic and diastolic flattening of the interventricular septum (the “D-shaped septum”). Systolic flattening of the septum represents pressure overload of the right ventricle from pulmonary hypertension, whereas diastolic flattening of the septum represents volume overload of the right ventricle, which is often secondary to severe wide-open tricuspid insufficiency.

FIG. 2.22 M-mode examination of the left ventricle, parasternal long-axis view, in a patient with severe cor pulmonale, demonstrating both systolic and diastolic flattening of the interventricular septum (“D-shaped septum”) (arrow). Systolic flattening of the septum represents pressure overload of the right ventricle from pulmonary hypertension, while diastolic flattening of the septum represents volume overload of the right ventricle. Here, this was secondary to severe wide-open tricuspid insufficiency.

FIG. 2.23 M-mode examination of the pulmonic valve, main pulmonary artery view, demonstrating early systolic closure of the pulmonic valve (“flying w”) (arrows) associated with severe pulmonary hypertension and due to the elevated filling pressure of the right ventricle. Often there may also be an absent a wave (atrial wave) of the m-mode tracing.
Severe Pulmonary Hypertension
M-mode examination of the pulmonic valve from the parasternal short-axis or main pulmonary artery view can also assist in identifying the presence of severe pulmonary hypertension (Fig. 2.23). This can be readily identified by demonstrating early systolic closure of the pulmonic valve (“flying w”) associated with severe pulmonary hypertension and due to the elevated filling pressure of the right ventricle. Often there may also be an absent a wave (atrial wave) of the m-mode tracing as well.
Ebstein Anomaly
Ebstein anomaly is a congenital deformity characterized by downward displacement of part or all of the tricuspid valve into the right ventricular cavity. M-mode examination of the tricuspid valve from the right ventricular inflow view can be helpful in establishing the diagnosis of Ebstein anomaly (Fig. 2.24). Typically there is decreased diastolic opening of the anterior leaflet due to deformation (compare with Fig. 2.8, a normal m-mode view of the tricuspid valve).
Increased Right Atrial Pressure
An elevation in right atrial pressure—seen in different cardiac pathologies including cardiac tamponade, cardiac constriction, and both left- and right-sided heart failure—can be confirmed by an m-mode tracing of the inferior vena cava near its communication with the right atrium. Fig. 2.25 illustrates an m-mode examination of the inferior vena cava obtained in the subcostal view in the presence of markedly elevated right atrial pressure. Note the markedly dilated (greater than 2 cm) and plethoric (no inspiratory collapse) inferior vena cava (IVC) (arrows). The m-mode cursor is placed at the junction of the inferior vena cava and right atrium. The estimated right atrial pressure in this scenario is at least 20 mm Hg. In situations of low filling pressures, m-mode recordings of the IVC can confirm greater than 50% inspiratory collapse of the IVC.
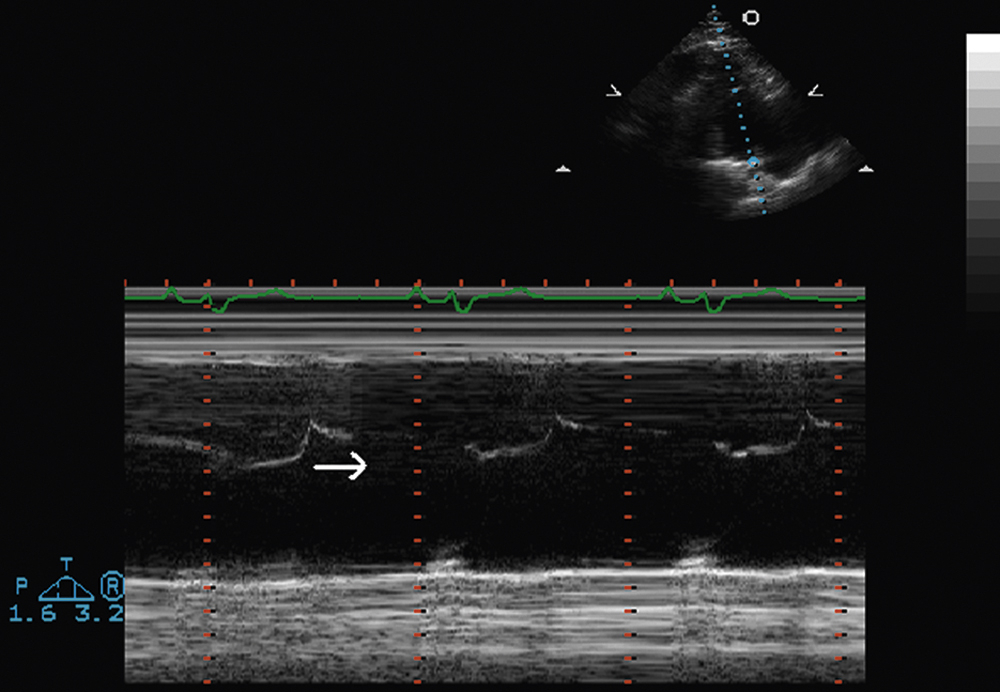
FIG. 2.24 M-mode examination of the tricuspid valve, right ventricular inflow view, in Ebstein anomaly. Note the decreased diastolic opening of the anterior leaflet due to deformation (arrow); compare with Fig. 2.8, showing a normal m-mode view of the tricuspid valve. The Ebstein anomaly is a congenital deformity characterized by downward displacement of part or all of the tricuspid valve into the right ventricular cavity.
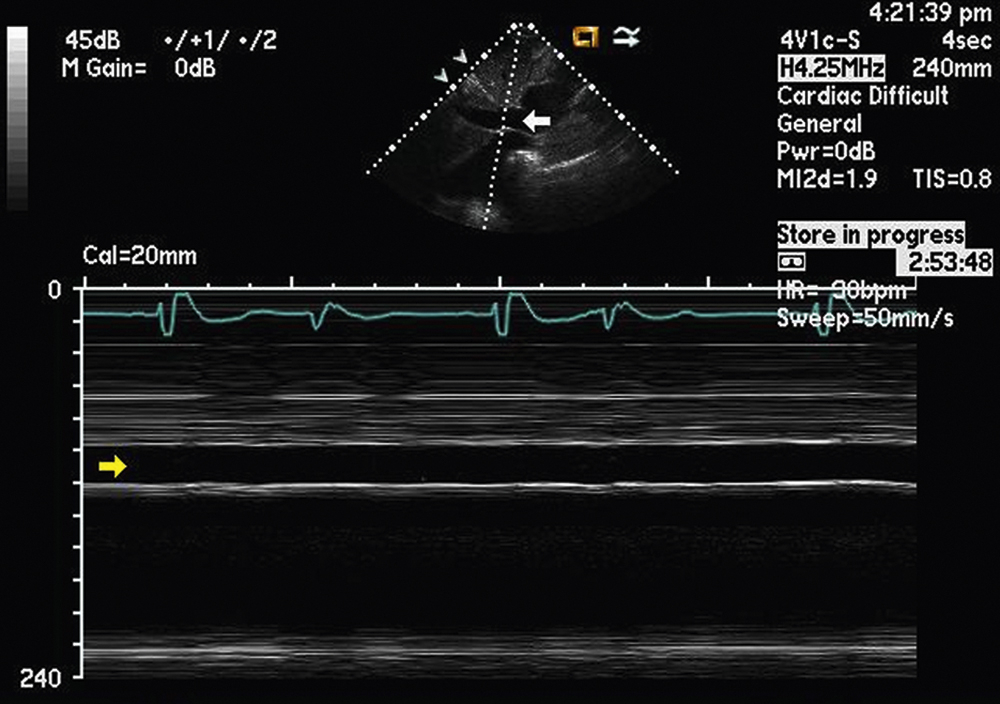
FIG. 2.25 M-mode examination of the inferior vena cava, subcostal view, in the presence of markedly elevated right atrial pressure (such as tamponade, constriction, or cor pulmonale). Note the markedly dilated (greater than 2 cm) and plethoric (no inspiratory collapse) inferior vena cava (arrows). The m-mode cursor is placed at the junction of the inferior vena cava and right atrium. The estimated right atrial pressure in this scenario is at least 20 mm Hg.
M-Mode Examination of Prosthetic Valves
M-mode recordings can also be useful in differentiating various types of prosthetic valves, particularly when patients are unaware of the type of valve they may have. M-mode can differentiate single-disk, bileaflet, and ball-in-cage mechanical valves and bioprosthetic valves. It can also confirm normally functioning prosthetic valves from those with evidence of valve dysfunction. Fig. 2.26 illustrates an m-mode examination of a normally functioning St. Jude bileaflet mechanical aortic valve prosthesis; it was obtained with transesophageal echocardiography from a midesophageal longitudinal view demonstrating opening of both prosthetic valve leaflets in systole (arrows). Fig. 2.27 illustrates a transthoracic m-mode examination of a normally functioning St. Jude bileaflet mechanical mitral valve prosthesis; it was obtained from the parasternal long-axis view, demonstrating opening of both prosthetic valve leaflets in diastole (arrows).

FIG. 2.26 M-mode examination of a normally functioning St. Jude bileaflet mechanical aortic valve prosthesis, longitudinal view, obtained with transesophageal echocardiography. To demonstrate correct motion of both prosthetic valve leaflets in systole (arrows), m-mode echocardiography continues to be an important part of the evaluation of prosthetic valve function.
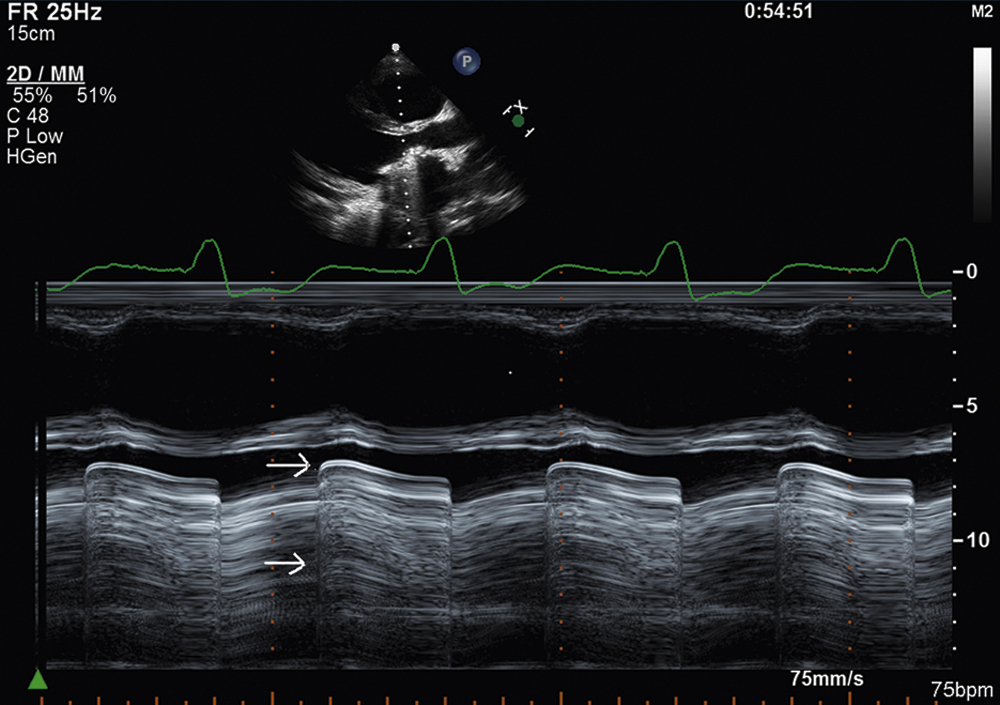
FIG. 2.27 M-mode examination of a normally functioning St. Jude bileaflet mechanical mitral valve prosthesis, parasternal long-axis view. To demonstrate correct motion of both prosthetic valve leaflets in diastole (arrows), m-mode echocardiography continues to be an important part of the evaluation of prosthetic valve function.
Color M-Mode Echocardiography
Color m-mode echocardiography is an ideal modality for confirming the timing of events with respect to the cardiac cycle, which can be especially useful in valvular regurgitant lesions. Color m-mode has also been used in the assessment of left ventricular diastolic function and is thought to be less pre- and afterload-dependent than spectral Doppler. In this situation, the initial propagation velocity (Vp) of blood flow in the left ventricle is measured. Fig. 2.28 illustrates a color m-mode examination of the aortic root and left atrium from the parasternal long-axis view in a patient with mild diastolic mitral regurgitation (arrow) attributable to heart block. Fig. 2.29 illustrates a color m-mode examination of the left ventricle, from the apical four-chamber view, demonstrating a normal Vp of blood flow in the left ventricle of 81.6 cm/s during diastole, which indicates a normal diastolic filling pattern. Normal propagation velocities are measured by the initial slope of the E wave on color m-mode and are always greater than 45 cm/s. To make these color m-mode recordings, the Nyquist color scale is moved up to 39.4 cm/s (arrow), allowing color Doppler flow to be visualized all the way from the base of the mitral annulus to the left ventricular apex. Fig. 2.30 illustrates a color m-mode examination of the left ventricle from the apical four-chamber view, demonstrating a diastolic filling pattern consistent with impaired left ventricular relaxation. In this case, the Vp measures 40.2 cm/s and is mildly reduced. Fig. 2.31 demonstrates a color m-mode examination of the left ventricle from the apical four-chamber view, showing a diastolic filling pattern consistent with markedly delayed propagation or restrictive physiology. In this example, the Vp measured significantly less than 45 cm/s (blue arrow). Note that the accuracy of the measurement of the Vp of early diastolic filling on color m-mode is improved by increasing the sweep speed to 100 mm/s (yellow arrow).
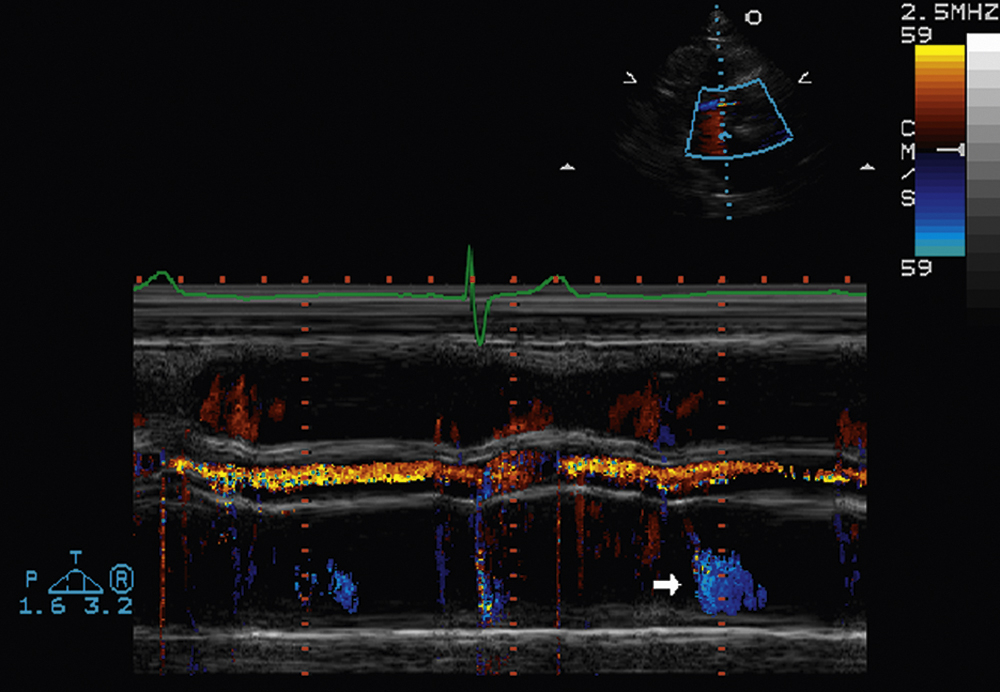
FIG. 2.28 Color m-mode examination of the aortic root and left atrium, parasternal long-axis view, in a patient with mild diastolic mitral regurgitation (arrow) attributable to heart block. This demonstrates that m-mode echocardiography is an ideal modality for confirming the timing of events with respect to the cardiac cycle.
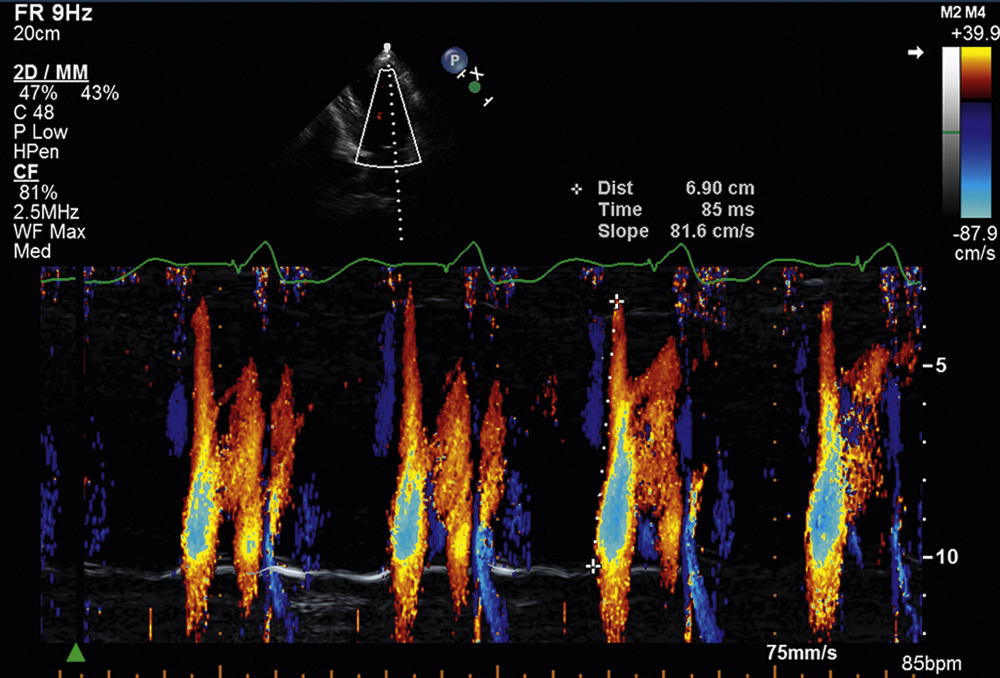
FIG. 2.29 Color m-mode examination of the left ventricle, apical four-chamber view, demonstrating normal propagation velocity of blood flow in the left ventricle of 81.6 cm/s during diastole, which is indicative of a normal diastolic filling pattern. Normal propagation velocities are measured by the initial slope of the E wave on color m-mode and are always greater than 45 cm/s. Note that the Nyquist color scale is moved up to 39.4 cm/s (arrow), allowing color Doppler flow to be visualized all the way from the base of the mitral annulus to the left ventricular apex.
Strain Imaging of the Myocardium (Parametric M-Mode Echocardiography)
Strain imaging represents a load-independent technology, now well validated, for measuring regional myocardial deformation of the ventricular myocardium; this is measured in terms of percent to reflect the relative shortening of the myocyte during systole. Fig. 2.32 illustrates a parametric curved m-mode examination of the left ventricle from the apical four-chamber view demonstrating a normal strain pattern of the left ventricle. In this example, a curved m-mode line is traced along the interventricular septum from apex to base. The wide orange band in systole represents shortening, whereas the wide yellow band in diastole represents lengthening. The four red curves below the parametric image represent four separate strain measurements from apex to base, with the apex (top curve) showing the least amount of strain or deformation during systole (arrow). Different strain patterns have been shown to differentiate various cardiomyopathies, including cardiac amyloidosis as well as hypertrophic and hypertensive cardiomyopathies. This is an exciting and active area of investigation in the field of echocardiography that is likely to significantly improve the diagnostic capabilities of cardiac ultrasound in the future.

FIG. 2.30 Color m-mode examination of the left ventricle, apical four-chamber view, demonstrating a diastolic filling pattern consistent with impaired left ventricular relaxation. In this case, the propagation velocity measures 40.2 cm/s and is mildly reduced. Color m-mode in a useful tool in the assessment of diastolic function of the left ventricle and is thought to be less flow-dependent than pulsed-wave Doppler.

FIG. 2.31 Color m-mode examination of the left ventricle, apical four-chamber view, demonstrating a diastolic filling pattern consistent with markedly delayed propagation or restrictive physiology. In this example the propagation velocity measured significantly less than 45 cm/s (blue arrow). Note that the accuracy of the measurement of the propagation velocity of early diastolic filling on color m-mode is improved by increasing the sweep speed to 100 mm/s (yellow arrow).

FIG. 2.32 Parametric curved m-mode examination of the left ventricle, apical four-chamber view, demonstrating normal strain pattern of the left ventricle. Strain imaging represents load-independent, cutting-edge technology for measuring regional myocardial deformation of the ventricular myocardium and is measured in terms of percent so as to reflect the relative shortening of the myocyte during systole. In this example, a curved m-mode line is traced along the interventricular septum from apex to base. The wide orange band in systole represents shortening, whereas the wide yellow band in diastole represents lengthening. The four red curves below the parametric image represent four separate strain measurements from apex to base, with the apex (top curve) showing the least amount of strain or deformation during systole (arrow).
Summary
M-mode echocardiography, because of its superior temporal resolution, remains important in today’s echo lab because of its ability to time rapidly moving structures within the heart, such as the valves, in relation to the cardiac cycle. It is capable of providing additional clues to answering complex clinical questions, and represents an inexpensive tool, in the vast and widely expanding echocardiography tool box.