Initial Ventilator Settings
1. Calculate tubing compliance.
2. Determine volume loss caused by tubing compliance.
3. Calculate minute ventilation given a patient's respiratory rate and tidal volume.
4. Calculate total cycle time, inspiratory time, expiratory time, flow in L/sec, and inspiratory-to-expiratory ratios given the necessary patient data.
5. Select an appropriate flow rate and pattern.
6. Calculate initial minute ventilation, tidal volume, and rate for a patient placed on VC-CMV based on the patient's sex, height, and ideal body weight.
7. Identify the source of the problem when an inspiratory pause cannot be measured.
8. Choose an appropriate initial mode of mechanical ventilation, and determine  , tidal volume, respiratory frequency, and positive end-expiratory pressure settings based on the patient's lung pathology, body temperature, metabolic rate, altitude, and acid-base balance.
9. Evaluate the response in peak inspiratory pressure and plateau pressure when the flow waveform is changed.
10. Recommend the selection and initial settings for the various modes of pressure ventilation, including bilevel positive airway pressure, pressure support ventilation, pressure control ventilation, and Servo-controlled (dual modes) ventilation.
11. Identify a problem in pressure support ventilation from a pressure–time graph.
12. Measure plateau pressure using pressure–time and flow–time waveforms during pressure-controlled mechanical ventilation.
13. List the possible causes for a change in pressure during pressure-regulated volume control.
14. Identify the mode of ventilation based on the trigger, target, and cycle criteria.
Key Terms
• Compressible volume
• Mechanical dead space
• Overinflation
• System compressibility
• Tubing compliance
The most common reason for instituting mechanical ventilation is to treat respiratory distress in patients who are unable to achieve effective gas exchange.1 This goal can be accomplished by setting an appropriate tidal volume (VT) and respiratory rate or frequency (f) to achieve a desired minute ventilation ( ). This chapter examines how
  and related variables are set during the initiation of volume ventilation, and then focuses on the settings required to initiate positive pressure ventilation.
Determining Initial Ventilator Settings during Volume-Controlled Ventilation
Initiating volume control ventilation for a patient requires an understanding of the interaction of several key variables, including  settings (VT and f), inspiratory gas flow, flow waveform, inspiratory-to-expiratory (I : E) ratio, pressure limit, inflation hold (inspiratory pause), and inspiratory pressure and positive end-expiratory pressure (PEEP).
The design characteristics of mechanical ventilator control panels can vary. For example, many have VT and rate settings, such as the Puritan Bennett 840 (Covidien, Puritan Bennett, Boulder, Colo.), whereas other ventilators, such as the Servo-i (Maquet Inc, Wayne, N.J.), also allow the operator to set  and f. Some ventilator manufacturers provide time cycling and have controls for inspiratory time percentage, and still others control total cycle time (TCT).
It is important for clinicians charged with the responsibility of instituting mechanical ventilation to have a fundamental understanding of the various control variables available on intensive care unit (ICU) ventilators. Then regardless of the ventilator involved, they will possess enough information to make an informed decision about how to proceed. The following discussion begins with the basics:  , VT , and f. A more detailed discussion of initial ventilator setting for patients with specific cardiopulmonary and neuromuscular disorders is provided in Chapter 7.
Initial Settings During Volume-Controlled Ventilation
Setting Minute Ventilation
The primary goal of volume-controlled, continuous mandatory ventilation (VC-CMV) is to achieve a  that matches the patient's metabolic needs. A typical healthy person at rest has a total oxygen consumption (
 ) of about 250 mL/min, and a carbon dioxide production (
 ) of about 200 mL/min. As the patient's metabolic rate increases, ventilation must change to meet the need for increased oxygen uptake and CO2 removal (Box 6-1).
Box 6-1
Determining Pressure, Tidal Volume, Respiratory Frequency, and Minute Ventilation to Establish Initial Ventilator Settings for Volume and Pressure Ventilation
 )
) = 4 × body surface area (BSA)
 = 3.5 × BSA
 / VT
/ VTPressure Ventilation
Pressure Support Ventilation (PSV)
To overcome system resistance in the spontaneous mode (PSV or continuous positive airway pressure [CPAP]) or in the IMV mode, set pressure at peak inspiratory pressure (PIP) – (Pplateau), where Pplateau is measured in a volume breath or at approximately 5 to 10 cm H2O. To provide ventilatory support, set pressure to achieve a target VT as described for VC-CMV.
Pressure Control Ventilation (PC-CMV)
Set pressure to achieve VT as described for VC-CMV. Set frequency to achieve the same  . f =
. f =  . /VT.
Set inspiratory percentage to achieve an inspiratory/expiratory (I : E) ratio of greater than or equal to 1 : 2.
Metabolic rate is directly related to body mass and surface area in humans. Measurements of heat production (i.e., direct calorimetry) provide a reliable method to quantify metabolic rate; however, direct calorimetry requires a considerable amount of space and time commitment and is typically reserved for research purposes. Indirect calorimetry, which uses measurements of inspired and expired O2 and CO2 to estimate energy expenditure, can be accomplished with significantly less time and effort. Indeed advances in computer technology have made it relatively easy to perform indirect calorimetry in the clinical setting. For example, the Engström Carestation by GE (GE Healthcare, UK) has this technology incorporated into the ventilator's design, making it possible for the clinician to monitor continuously the  and
and  at the bedside. (See Chapter 10 for more information about indirect calorimetry.)
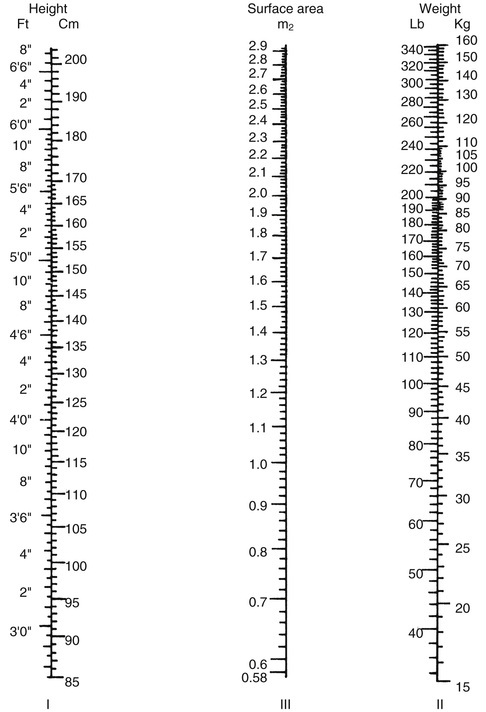
A more commonly used method to estimate metabolic rate and caloric intake involves using equations that were derived from laboratory studies performed in the early part of the twentieth century by scientists like Harris and Benedict. With these equations, metabolic rate is estimated on the basis of an individual's gender and body surface area (BSA).2 BSA can be calculated using the DuBois BSA formula: BSA = 0.007184 × Ht0.725 × W0.425, where BSA = body surface area in square meters, Ht = body height in centimeters, and W = body weight in kilograms. (It can also be determined using a nomogram like the one shown in Fig. 6-1. Notice that this nomogram is based on the aforementioned DuBois BSA formula.)
As shown in Box 6-1,  can also be estimated using a patient's BSA.
  is approximately equal to four times the BSA in men and three and a half times the BSA in women. For example, the estimated
  for an adult male patient with a BSA of 2.1 m2 would be:

Notice that this calculation of  assumes that the individual is a typical healthy adult. The
 must be adjusted for abnormal conditions, such as the presence of hypothermia or hyperthermia, hypermetabolism, and metabolic acidosis. Lung disorders that increase physiological dead space will also require an increase in
  .2 For example, suppose that the patient already mentioned requires an initial
  of 8.4 L/min but has a temperature of 39° C.
  would have to be increased by 10% for each degree above 37°: a total increase of 20% of 8.4 = 1.68; therefore, the new
  would be 8.4 + 1.68 = 10.08 L/min.
Settings for VT and f should therefore be derived from the initial calculation of  (4 × BSA for men and 3.5 × BSA for women) and adjusted if the patient demonstrates a pathologic condition like those mentioned above. VT can be determined by the method described in the discussion that follows. To determine breathing frequency (f), divide the
  by the VT (
 /VT = f) (Case Study 6-1).
 Case Study 6-1
Minute Ventilation ( ) Needs
A physician orders a tidal volume (VT) of 500 mL and a rate of 12 breaths/min for a 25-year-old woman with a body surface area of 2.0 m2. The estimated  will be: 3.5 × 2.0 = 7.0 L/min. What is the ordered
  compared with the estimated
  needed? If you were the respiratory therapist in this situation, how would you address the discrepancy between the physician's order and the actual
  required?
In many cases, physicians order settings for mechanical ventilation that include volume and rate and do not typically specify . The respiratory therapist must keep in mind that the ordered rate and volume must reflect the
  needs of the patient.
Tidal Volume and Rate
The normal spontaneous VT for a healthy adult is about 5 to 7 mL/kg with a spontaneous respiratory rate of 12 to 18 breaths/min.  is about 100 mL/kg of ideal body weight (IBW).3 Box 6-2 provides formulae that can be used to calculate IBW.3
When determining VT for ventilated patients, a range of 6 to 8 mL/kg of IBW is typically used for adults, and 4 to 8 mL/kg IBW for infants and children.4-6 Lower VT rates (e.g., 4 mL/kg IBW) have been successfully used to ventilate the lungs of adult patients with acute respiratory distress syndrome (ARDS). These lower VT rates are described as protective strategies that minimize the damaging effects associated with overdistention of the alveoli.7
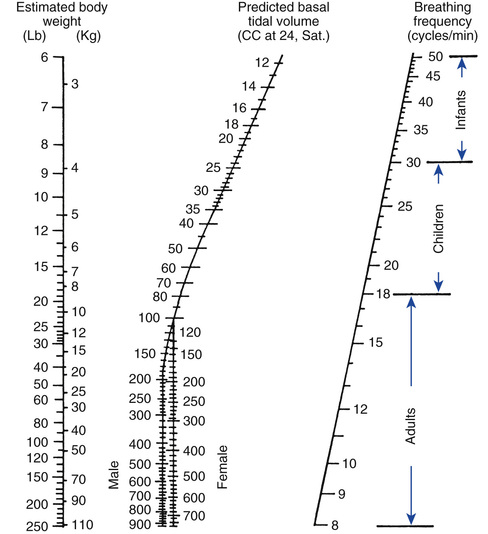
It is important to understand that an adult's lungs do not get larger as he or she gains weight. For example, a 5-foot 6-inch adult male weighing 100 kg would require the same VT as a 5-foot 6-inch adult male weighing 65 kg. Remember, however, that a heavier patient would have a higher metabolic rate and thus a higher  . Critical Care Concept 6-1 provides an example of how to estimate tidal volumes based on IBW (Key Point 6-1). (It is interesting to note that the Radford nomogram [Fig. 6-2], which was used in the past by clinicians to estimate the set VT is based on a VT range of about 5 to 7 mL/kg IBW.8) (See Box 6-3 and Case Study 6-2).
 Critical Care Concept 6-1
Tidal Volume (VT) and Ideal Body Weight (IBW)
What is the lowest and highest estimated VT for a 5-foot 6-inch man (IBW = 65 kg)? What would the lowest and highest estimated tidal volume be for a 5-foot 6-inch woman?
 Key Point 6-1
A person's tidal volume increases linearly with body weight up to that person's ideal body weight.
Case Study 6-2
Minute Ventilation ( ), Tidal Volume (VT), and Respiratory Rate
A 6-foot (72-inch)-tall man weighs 190 lb and has a normal metabolic rate, temperature, and acid–base status. What is his body surface area and ideal body weight? What  , VT, and rate would be appropriate for this patient?
An alternative method for calculating initial VT settings is to use predicted values for body weight rather than calculations of IBW. The predicted body weight of male patients can be calculated using the following equation: 50 + 0.91 (centimeters of height – 152.4). For female patients the predicted body weight can be determined using the following equation: 45.5 + 0.91 (centimeters of height × 152.4).7
Recommended tidal volumes for ventilated patients vary depending on the lung pathology. For patients with normal lungs, such as patients with a drug overdose or patients with the postoperative effects of anesthesia, an initial VT of 6 to 8 mL/kg and a rate of 10 to 20 breaths/min is generally accepted.3 In patients with chronic obstructive pulmonary disease (COPD) and asthma, in which airway obstruction and resistance are high, an initial VT of 6 to 8 mL/kg with a rate of 8 to 12 breaths/min is acceptable.3,12-14 In patients with chronic or acute restrictive disease, such as pulmonary fibrosis or ARDS, an initial VT of 4 to 6 mL/kg with a rate of 15 to 25 breaths/min is indicated.7 As suggested in restrictive disease, lower VT and higher rates are used. However, high rates may not provide sufficient time for exhalation (short TE), and air can be trapped in the lungs at the end of exhalation, resulting in intrinsic PEEP (auto-PEEP).15 The VT should be adjusted to maintain plateau pressure less than 30 cm H2O and rates adjusted to minimize auto-PEEP.
A VT of more than 9 to 10 mL/kg is not recommended because of the risk of high pressures and accompanying overdistention and trauma to the lung, in addition to other complications. Low volume settings (4 to 8 mL/kg) are beneficial in restrictive disease and may help prevent high pressures and alveolar overdistention. It is worth mentioning that using volumes as low as 4 mL/kg may contribute to atelectasis. Using tidal volumes this low may require a recruitment maneuver or sigh breaths to avoid atelectasis. (See Chapters 7 and 13 for additional information.) Use of lower VT may be especially important in patients receiving PEEP therapy to avoid high pressures and overdistention16,17 (Key Point 6-2). Box 6-3 provides some important background on how initial VT settings were selected for this text.3,7,9-14 Chapter 13 provides additional information on managing patients with PEEP.
Key Point 6-2
When setting tidal volume (VT) and rate, the goal is not to focus so much on the exact VT and rate, but to focus on using settings that do not harm the patient. Maintaining plateau pressure lower than 30 cm H2O is very important. In some cases it may even be necessary to let PaCO2 rise and pH fall outside the patient's normal values to avoid lung injury.1
Tubing Compliance
The VT set on the ventilator control panel represents the amount of gas sent to the ventilator circuit; however, not all of this volume reaches the patient. Some of the gas volume will not be delivered to the patient because of leaks and the effects of tubing compliance.
The tubing compliance (CT), or system compressibility, reflects the volume (in milliliters) of gas compressed in the ventilator circuit for every centimeter of water pressure generated by the ventilator during the inspiratory phase: CT = change in volume divided by change in pressure (ΔV/ΔP) in mL/cm H2O.
As pressure builds in the ventilator circuit during inspiration, the circuit expands along with the patient's lungs; therefore, the total volume that goes to the circuit never reaches the patient. As expiration begins, the volume of gas trapped under pressure in the patient circuit flows out the expiratory valve with the air that leaves the patient's lungs. This volume (exhaled volume from the ventilator tubing and the patient's lungs) is often referred to as the exhaled VT .
The volume of gas in the circuit is referred to as the compressible volume, or the volume lost as a result of CT. The compressible volume varies depending on the type of circuit used and is determined for each ventilator system before its use. Calculating compressible volume is especially important in infants, children, or very small patients because of the small VT they require. A slight change in tidal volume may be insignificant for an adult, but it can be critical for an infant during mechanical ventilation. Thus practitioners routinely use small-bore, rigid circuits with infants because these types of circuits are not very compliant. These ventilator circuits typically have low CTs and therefore have low compressible volumes. (NOTE: CT for a patient's circuit changes slightly as the circuit warms, but this amount is usually not significant.)
Current ICU ventilators (e.g., Hamilton G5 [Hamilton Medical, Switzerland], the Servo-i [Maquet, Inc, Wayne, N.J.], Dräger 500 [Dräger Medical Inc, Telford, Pa.], Puritan Bennett (PB) 980 [Covidien, Mansfield, Mass.], and CareFusion AVEA [CareFusion, Yorba Linda, Calif.]) have the capability of measuring and correcting for CT. During start-up tests of the system, these ventilators calculate the compressibility of the ventilator circuit. The operator can choose to use this correction or simply ignore it. If correction for CT is accepted, the ventilator measures the peak pressure during ventilation, calculates the volume lost to the patient circuit, and adds that volume to the set VT. When the data are displayed on the ventilator, the exhaled VT measured again corrects for CT. For example, if the set VT is 500 mL and the loss of volume is 50 mL, the ventilator actually delivers 550 mL, although it displays 500 mL as VT inspired and 500 mL of VT expired. The operator never actually “sees” the correction being made. It is important to recognize that ventilators perform this function in different ways. Therefore, the clinician should understand how this function operates for the ventilator being used.
If a ventilator without this capability is being used, calculation of CT can be determined during initial setup by doing the following procedure prior to connecting the patient to the ventilator:
1. Confirm there are no leaks in the circuit.
2. Set a low VT (100 to 200 mL), set PEEP at 0 cm H2O, and set inspiratory pause at 2 seconds.
3. Place the high-pressure limit on the highest possible setting (e.g., 120 cm H2O) so the breath does not pressure cycle.
4. Manually trigger the ventilator into inspiration while occluding the Y-connector.
5. Record the static or plateau pressure (Pplateau).
6. Measure the volume at the exhalation valve using a respirometer.
7. Calculate CT by dividing measured volume by measured static pressure.
Box 6-4 provides a practice problem for calculating volume lost to CT.
Mechanical Dead Space Considerations
Another consideration when setting the VT is the effects of mechanical dead space. Mechanical dead space (VDmech) is defined as the volume of gas that is rebreathed during ventilation. For example, to add flexibility to the patient-ventilator connection, clinicians sometimes add a 6-inch piece of corrugated tubing between the Y-connector and the endotracheal tube connector. When the patient exhales, some of the exhaled gas will occupy the 6 inches of tubing. As the patient inhales during the next breath, the first part of the breath will contain end-expiratory gas from the previous breath, which has a lower oxygen level and a higher carbon dioxide level.
A number of devices can decrease or increase the amount of VDmech added to the breathing circuit. For example, the use of an endotracheal tube slightly reduces VDmech by about 1 mL/kg IBW because the tube bypasses the upper airway (mouth and nasal passages). In contrast, the addition of a Y-connector between the ventilator and the patient may add about 75 mL of VDmech. Interestingly these two factors tend to balance each other. Heat-moisture exchanger (HME) inserted between the endotracheal tube and Y-connector adds VDmech to the circuit (20 to 90 mL). Fortunately, the low dead space volume associated with these devices (HME of 20 mL) is usually not of clinical significance for adult patients (This is a small dead space volume in relation to an adult VT and usually does not alter PaCO2. However, with a higher-volume HME [90 mL], PaCO2 may increase above previous values.)13
In the past, respiratory therapists added VDmech to increase the PaCO2 of patients who were hyperventilating and developed a respiratory alkalosis that could not be corrected by other methods. The effectiveness of this practice has been questioned by a number of clinicians.
Relationship of Tidal Volume, Flow, Total Cycle Time, and Inspiratory-to-Expiratory Ratio
Each ventilator has specific settings to select for VC-CMV. For example, the Puritan Bennett 840 allows the operator to set VT, f, and flow, and the Servo-i allows the operator to set the rate and inspiratory time, or inspiratory-to-expiratory (I : E) ratio.
An understanding of the interrelation of inspiratory flow, inspiratory time (TI), expiratory time, total cycle time (TCT), and I : E ratio will help the clinician to effectively ventilate a patient regardless of the type of equipment being used. Box 6-5 includes the equations that describe a variety of these interrelations. Fortunately most modern ventilators automatically perform these calculations and display them as measured and calculated values.
Box 6-5
Interrelation of Tidal Volume, Flow Rate, Inspiratory Time, Expiratory Time, Total Cycle Time, and Respiratory Rate
I. Total cycle time (TCT) equals inspiratory time (TI) plus expiratory time:

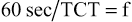
II. Respiratory rate (f) equals 1 min (60 seconds) divided by TCT.


III. Inspiratory to expiratory ratio equals inspiratory time divided by expiratory time.

Remember: TCT = TI + TE and TCT − TI = TE
IV. To calculate TE from f and TI:


V. Reducing the I : E ratio to its simplest form:
Divide the numerator and denominator by TI.

VI. Determine the I : E when inverse ratio ventilation is used:
I : E for inverse ventilation equals the division of both the numerator and the denominator by the expiratory time.

VII. Calculate TI, TE, and TCT from I : E and f.


VIII. Calculate TI from VT and flow ( )
)

IX. Calculate VT from TI and  .
.

 from VT and TI.
Calculating Total Cycle Time and Respiratory Rate
Some ventilators use TI and TE or TCT to determine the respiratory rate (or ventilator frequency). To determine these values, calculate the length of the respiratory cycle or the TCT (TCT = TI + TE) and determine the number of cycles that occur in 1 minute (see Box 6-5, I, II, and IV). For example, if the TI is 2 seconds and the TE is 4 seconds, then:


Calculating Inspiratory-to-Expiratory Ratio
Some ventilators allow the clinician to set either a fixed TI and rate, or a fixed I : E.* For example, the Servo-i ventilator requires the respiratory therapist to set a TI. If the rate is set at 10 breaths/min, the TCT is 6 seconds (60 sec/[10 breaths] = 6 sec/breath). If the TI is set at 2 seconds then the expiratory time is 4 seconds (TE will be TCT – TI = 6 sec – 2 sec = 4 sec). The resultant I : E ratio will therefore be 1 : 2 (TI/TE = 2 sec/4 sec = 2 : 4 or 1 : 2) (see Box 6-5, I through V).
The I : E ratio is typically expressed so that the TI is equal to 1. For example, if the I : E ratio is 2 : 3, then it is expressed as 1 : 1.5. Dividing the numerator and denominator by TI reduces the expression to 1 : X (see Box 6-5, V).
I : E ratios of 2 : 1 or 3 : 1 are called inverse I : E ratios. When I : E ratios are inversed (I greater than E), then TE takes on the value of 1. For example, if the TI is 3 seconds and the TE is 2 seconds, then the I : E ratio is 3 : 2 or 1.5 : 1 (see Box 6-5, VI). (NOTE: In previous generation ventilators (e.g., Puritan Bennett 7200 [Covidien, Nellcor and Puritan Bennett, Boulder Colo.]), the digital display of I : E was expressed as 1 : X; thus inverse ratios will appear, for example, as 1 : 0.5, rather than 2 : 1.)]
Using inverse ratios can cause significant complications, such as increases in mean airway pressure ( ) and physiological dead space, decreases in venous return and cardiac output, and increased air trapping (auto-PEEP). For this reason, I : E ratios are usually set at 1 : 1.5 to 1 : 4, so that expiration is longer than inspiration, and the adverse effects of positive pressure are reduced. (NOTE: Inverse I : E ratios have been successfully used in some circumstances, such as to improve oxygenation in patients with ARDS.)
Inspiratory Time, Tidal Volume, and Flow
TI can be determined if VT and flow are known and the flow pattern is a constant or square waveform. If VT is 0.5 L and flow is 2 L/sec, then TI equals 0.5 L/2 L/sec, or 0.25 seconds. The flow control on adult ventilators is usually calibrated in L/min, so the value for flow needs to be converted to L/sec. For example, a flow of 30 L/min equals 30 L/60s or 0.5 L/sec.†
Conversely, VT can be determined when TI and flow are known and flow is constant: (VT = flow × TI). If TI is 1 second and flow is 0.5 L/sec, VT = (1 second) × (0.5 L/sec) = 0.5 L (see Box 6-5, VII and VIII).
Flow, Tidal Volume, and Inspiratory Time
Flow can be determined if VT and TI are known. For example, if VT is 500 mL and TI is 1 second, the flow equals VT/TI, which is 500 mL/1 sec, or 0.5 L/( of a minute), or 30 L/min (multiply numerator and denominator by 60 to convert to minutes) (see Box 6-5, IX). These examples assume that flow is constant. (See Case Study 6-3 and Critical Care Concept 6-2.)
Case Study 6-3
Inspiratory/Expiratory Ratio (I : E) and Flow
You are asked to ventilate a 63-year-old woman who is diagnosed with severe congestive heart failure. She is 5 foot 8 inches tall and weighs 185 lb. She is orally intubated with a 7.5-mm endotracheal tube. Her arterial blood gases on a nonrebreathing mask are pH = 7.18, PaCO2 = 83 mm Hg, PaO2 = 98 mm Hg, HCO3− = 31 mEq/L. What recommendations would you make regarding her initial ventilator settings of VT, f, I : E, and flow?
Critical Care Concept 6-2
Inspiratory Flow in a Time-Cycled Ventilator
A time-cycled ventilator is set with the following parameters: VT = 500 mL (0.5 L), f = 12 breaths/min, and I : E = 1 : 4. If a constant flow waveform is used, what is the inspiratory gas flow?
Inspiratory Flow and Flow Patterns
During VC-CMV, the clinician may have the option to select a variety of ventilator flows and flow patterns. These selections are reviewed in this section.
Rate of Gas Flow
As previously discussed, the flow setting on a mechanical ventilator determines how fast the inspired gas will be delivered to the patient. During controlled mechanical ventilation (CMV), high flows shorten TI and may result in higher peak pressures and poor gas distribution. Conversely, slower flows may reduce peak pressures, improve gas distribution, and increase  at the expense of increasing TI. Unfortunately shorter TE can lead to air trapping, and using a longer TI may also cause cardiovascular side effects.18 In reality actual normal inspiratory times have never been measured, and much of clinical practice involved in setting appropriate TI requires clinician observation of the patient's response to set values. These may require adjustments.
In general the goal should be to use the shortest TI possible. Achieving a short TI is usually not difficult to attain in patients with normal lungs. As a beginning point, flow is normally set to deliver inspiration in about 1 second (range 0.8 to 1.2 seconds).3,13 An I : E ratio of 1 : 2 or less (usually about 1 : 4) is also recommended. This can be achieved with an initial peak flow setting of about 60 L/min (range 40 to 80 L/min). It is important to remember that the flow must be set to meet a patient's inspiratory demand so the spontaneously breathing patient is not trying to breathe in without the ventilator supplying adequate gas flow (see Fig. 5-4).19
During VC-CMV where patient-triggered breaths are present, the patient's respiratory rate may actually vary depending on flow and TI setting. For example, when VT is constant and the flow setting is increased, TI will be shorter and the patient may actually begin to increase the rate at which he or she triggers the ventilator. Thus TI can affect breath frequency when patient triggering is present.20 The reason this occurs is not known at this time, but clinicians should be aware of this phenomenon.
A long TI (requiring 3 to 4 time constants) has been shown to improve ventilation in nonhomogeneous lungs like those seen in ARDS.21 Fast flows (i.e., requiring fewer time constants to fill the lungs) may benefit patients with increased airway resistance (Raw), as in COPD, providing longer TE, which in turn will reduce or prevent the risk of air trapping (long TE of 3 to 4 time constants). Tobin has reported that using flow rates up to 100 L/min can improve gas exchange in patients with COPD by providing a longer TE.22 Flows that are set too high, however, can result in uneven distribution of inspired air in the lung, and also cause immediate and persistent tachypnea, in addition to increased peak inspiratory pressures23 (Key Point 6-3).
Key Point 6-3
The clinician must carefully adjust the flow and flow pattern to suit the patient's ventilatory needs.
Flow Patterns
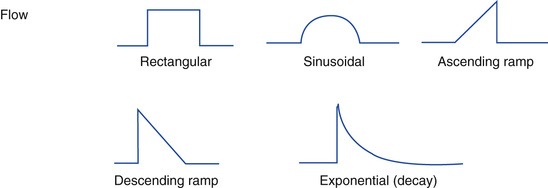
Figure 6-3 shows examples of flow patterns available on ICU ventilators. Selecting the most appropriate flow pattern and ventilator rate depends on the patient's lung condition. For example, postoperative patients recovering from anesthesia may have very modest flow demands, whereas a young adult with pneumonia and a strong hypoxemic drive would have a very strong flow demand. The most common flow patterns used clinically are the constant flow and descending (decelerating) flow waveforms.
Constant flow.
Clinicians often select the constant flow pattern simply because it is most familiar to them, or it is the only one available on the ventilator in use. Constant flow patterns are also called rectangular and square waveform. For initiating ventilation, a rectangular (constant) flow pattern is acceptable.13 Generally a constant flow pattern provides the shortest TI of all the available flow patterns with an equivalent peak flow rate setting.
Descending ramp.
The amount of gas flow delivered at the beginning of the breath is probably the major determinant of patient effort and work of breathing. A descending (decelerating) flow waveform has a distinct advantage compared with other waveform patterns. With a descending pattern, flow is greatest at the beginning of inspiration, when patient flow demand is the highest. The descending waveform occurs naturally in pressure ventilation. Box 6-6 shows an example in which the ventilator automatically sets the flow at a descending ramp and calculates the flow rate based on VT and TI during VC-CMV.
Ascending ramp.
The ascending ramp provides a progressive increase in flow. The ascending ramp is currently not used by most clinicians, and is available only on a few older-generation ventilators. There are no compelling studies that support the use of the ascending flow ramp.6
Sine flow.
The sine flow pattern produces a tapered flow at the end of inspiratory phase. Although it has been suggested that this type of flow pattern may contribute to a more even distribution of gas in the lungs than the flow of the constant flow ventilator, it is not commonly used clinically and additional clinical studies will be required to verify its efficacy.24  and peak pressures are similar to those seen with the sine and square wave patterns although peak pressures are higher with the sine wave than the square flow when airway resistance is increased, such as in acute asthma.25
Comparison of descending ramp and constant flow.
Most clinical studies designed to investigate the effects of using various ventilator waveforms have compared the constant waveform with the descending (decelerating) ramp. As one changes from a constant to a descending ramp, peak pressure is lower, and  is higher.* Studies comparing the descending flow pattern with the constant flow pattern suggest that the descending flow pattern improves the distribution of gas in the lungs, reduces dead space, and increases oxygenation by increasing mean and plateau airway pressures.3,13,21,25-27 It is important to remember that in situations where plateau pressure (Pplateau) is critical, changing to a descending ramp to reduce peak pressures may increase the
  .
.
Concerns about high peak inspiratory pressure and mean airway pressure.
The clinician must decide whether  is more important for the patient than are concerns of high peak inspiratory pressure (PIP) when selecting a particular waveform. When Raw and flows are high, peak pressures will be high if an ascending flow pattern is used. Much of this pressure is dissipated in overcoming the Raw and may not reach the alveolar level.25 Thus high peak pressures do not always increase the risk of damage to lung parenchyma. An example of a patient population in which this can occur involves patients with acute asthma experiencing severe bronchospasm, mucosal edema, and increased secretion production. It is important to recognize, however, there is a risk that some of the high pressures may reach normal lung areas, which could be damaging in this group of patients.14
Effects of changing flow pattern in time- vs. volume-cycled ventilators.
For time-cycled machines (e.g., Hamilton Galileo G5 [Hamilton Medical, Switzerland], Servo-i, Dräger Evita-4), changing from constant flow to another flow pattern does not change the I : E ratio. However, it does change the peak flow required to deliver the volume in the time provided (TI). With any ventilator, changing from one waveform to another can vary the peak flow delivery and the distribution of flow. Table 6-1 shows an example of how peak flow varies between four different flow patterns in a time-cycled situation.
TABLE 6-1
An Example of a Time-Cycled Ventilator*
| Flow Waveform | Peak Flow Value (L/min) | Percentage of Set Flow for Constant Flow Pattern |
| Constant | 60 | 100 |
| Descending ramp | 78 | 133 |
| Sine | 94.2 | 157 |
| Modified sine | 78.9 | 133 |
In volume-cycled ventilators, changing from a constant flow to a descending flow pattern does not change the peak flow selected. It does, however, change the TI and I : E ratio (Fig. 6-4). Consequently the clinician may have to change the peak flow setting to accomplish volume delivery at a better I : E ratio. Table 6-2 shows an example of what occurs with the Puritan Bennett 840 ventilator (Covidien, Nellcor and Puritan Bennett, Boulder, Colo.), which cycles based on volume (i.e., flow/time).
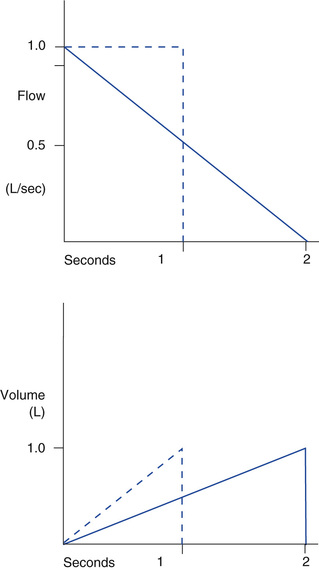
TABLE 6-2
An Example of a Volume-(Flow–Time) Cycled Ventilator: the Puritan Bennett 840
| Flow Waveform Selected | Determination of Inspiratory Time (TI Flow Set at 60 L/min) |
| Constant | TI = (VT)/flow |
| Descending ramp | Begins at 60 L/min; ends at 5 L/min |
| If flow is set too low or volume too high to be achieved, and the inspiratory-to-expiratory (I : E) ratio becomes greater than 1 : 1, the ventilator will give a visual warning and a message to “decrease the rate.” The alarm becomes audible when the I : E is 3 : 1 (displayed as “1 : 0.3”). | |

With the Maquet Servo-i ventilator, there is no flow waveform selector or peak flow control. During VC-CMV the machine provides a constant (rectangular) waveform. The amount of flow delivered is based on the VT selected and the TI. The flow also varies with patient demand regardless of the method of ventilation. When the patient's inspiratory needs exceed the flow provided and pressure begins to drop by 2 cm H2O below the measured airway pressure, the ventilator provides additional flow to the patient. Thus volume delivery is not the set value, but rather is influenced by the patient's flow demands. The volume set by the operator becomes the minimum volume. Other more recently released ventilators also provide this feature.
In summary, clinicians must familiarize themselves with how a ventilator functions when selecting peak flow and waveform pattern. When selecting a flow pattern, it is reasonable to assume that there is not one set prescribed pattern or rate of flow that is best for all patients. It is important to match the pattern and rate of gas flow to the patient's needs. Box 6-7 summarizes basic findings in flow waveform studies. The following points can provide some guidance when selecting a flow waveform:
• In patients with normal lung function, flow pattern selection is not a critical issue; descending and constant flow patterns are effective.
• In patients with hypoxemia and low lung compliance (CL), the descending flow pattern may be beneficial by maintaining low peak pressures and high  , and improving gas distribution.27,28
• In patients with high Raw, the descending pattern is more likely to deliver a set VT at a lower pressure and provide for better distribution of air through the lung than a constant flow.26-29
Setting the Minute Ventilation: Special Considerations
Practical considerations for setting a desired  have been discussed, but a few precautions should be considered before implementing these procedures. An optimum inspiratory flow and flow pattern may exist for every patient. No prescribed formula can be applied to ensure the best possible results for all patients.29,30 The variability in results related to setting these parameters is influenced by the condition of the patient's lungs and conductive airways and the patient's changing metabolic needs.
Consider a situation where a patient's PaO2 falls and his PaCO2 rises, while his  increases. Several reasons could account for this type of situation, including the presence of auto-PEEP, poor ventilation-to-perfusion (
 ) matching in the nonhomogeneous lung, and changes in venous return. Resolution of this situation may require changing gas flow and/or pattern, VT, f, or I : E ratio. Using a mode of ventilation that allows some spontaneous breathing may also benefit the patient in this type of situation by allowing the spontaneously breathing patient to have some control over ventilation. There is no “bottom line” and no easy prescription. Management of the patient on mechanical ventilation is both an art and a science requiring the use of sound judgment.
Inspiratory Pause during Volume Ventilation
The inspiratory pause or inflation hold (also called end-inspiratory pause) is a maneuver that can be performed by preventing the expiratory valve from opening for a short time at the end of inspiration, when the inspiratory valve is also closed. Most ICU ventilators have an inspiratory pause button or control. As mentioned in Chapter 1, the inspiratory pause maneuver is used to obtain measurements of Pplateau, which allows estimation of the alveolar pressure (Palv) for the calculation of static compliance (Key Point 6-4).
Key Point 6-4
Plateau pressure can only be accurately measured if the patient is not actively breathing so that a stable pressure reading can be obtained.
Inspiratory pauses can also be selected for use with each mandatory breath to improve the distribution of air throughout the lungs regardless of the type of flow pattern used. It is believed that an inspiratory pause provides a longer inspiratory time, which in turn provides optimum ventilation/perfusion ( ) matching and reduces dead space to tidal volume ratios (VD/VT ratios).31,32 Note that this maneuver must be used with care, or not at all, in patients with COPD and flow limitation. Inspiratory pause with each breath is not commonly used in clinical practice because it may significantly increase
  and reduce pulmonary blood flow.33
 Clinical Scenario
Ventilatory Support Postmyocardial Infarction
Following admission to a hospital for myocardial infarction, a 55-year-old man is intubated and placed on ventilatory support. The patient's IBW is 70 kg and BSA is 1.5 m2. The physician requests the VC-CMV mode. What  , VT, rate, flow, and flow pattern would be appropriate? A
  of 4 × 1.5 = 6.0 L/min is an appropriate starting point. A VT of 6 mL/kg would equal 420 mL for this patient. A minimum rate setting would be the
  divided by the VT or 6.0 L/0.42 L = 14.2 or 14 breaths/min. Because no changes in body metabolism such as a fever are evident, we assume these initial settings would be appropriate. No chronic pulmonary disease was mentioned, so we assume a moderate rate setting would be adequate. A flow of 40 L/min or 40 L/60 sec or 0.67 L/sec. using a descending flow pattern would provide sufficient time for exhalation to occur. What is the TI in this case? Because the VT is 0.42 L, TI = VT/flow or TI = 0.42 L/(0.67 L/sec) = 0.63 sec. The TCT is 60 sec/(14 breaths/min) = 4.3 sec/breath. TE = TCT − TI = 4.3 sec − 0.63 sec = 3.67 sec. TI is 0.63 seconds and TE is 3.67 seconds, which is an adequate time for exhalation. Note that this is a fairly short TI for an adult patient and may need to be increased.
Clinical Scenario
Ventilator Required?
A 45-year-old male receiving VC-CMV ventilation has a VT of 800 mL and a set rate of 8 breaths/min. The actual total rate is 15 breaths/min because the patient is triggering additional breaths. Flow is set at 40 L/min using a constant flow waveform. Inspiratory pressure actually stays in the negative range (below baseline) during most of inspiration and finally peaks at 60 cm H2O. The respiratory therapist is unable to obtain a pause pressure to determine Pplateau because the patient is actively breathing.
Using the actual rate (15 breaths/min), determine TI. Total cycle time is 60 sec/(15 breaths/min) = 4 sec/breath. Flow is 40 L/min or 40 L/60 sec = 0.67 L/sec. TI = VT/flow or 0.8 L/(0.67 L/sec) = 1.19 sec. TE = TCT − TI = 4 sec − 1.19 sec = 2.81 sec. The I : E ratio is about 1 : 3, which should be an adequate amount of time for exhalation.
The CT is 3 mL/cm H2O and was determined when the ventilator was set up. How much volume is lost to tubing compliance? The peak pressure is 60 cm H2O, so the lost volume is CT × PIP = 3 mL/cm H2O × 60 cm H2O = 180 mL. Of the 800 mL VT, 180 mL is lost in the circuit and is not delivered to the patient. What is the volume of gas delivered to the patient? 800 mL − 180 = 620 mL is delivered to the patient. How can the respiratory therapist correct for this loss of volume delivery to the patient? The respiratory therapist can either set the ventilator to automatically compensate for CT, if it has that feature, or manually adjust the set volume. For example, adding about 200 mL to the set volume would help compensate this loss. It is important to remember that making these adjustments will increase the set VT and also increase the patient's PIP.
In this example, the patient's problem occurs during inspiration. Why does the pressure waveform demonstrate a negative deflection during inspiration? Perhaps the flow is not adequate to meet the patient's demand. The respiratory therapists readjusted the flow to 100 L/min, but this change did not improve the situation, and the therapist reports that occasionally “he seems to trigger two tidal volumes during one inspiratory effort.” What would you suggest?
There are several possible solutions. Switching to PC-CMV and adjusting the pressure to achieve the original VT or even a slightly higher volume might be appropriate. Pressure ventilation modes are more likely to deliver a flow that meets the patient demands because the ventilator can provide all the flow needed to maintain the set pressure. Another option would be to place the patient on continuous positive airway pressure (CPAP) for a trial of spontaneous breathing and see what flow and volume the patient can achieve on his own. (This patient actually achieved a spontaneous volume of 1.2 L.) Other possible solutions are to increase the ventilator rate or VT to meet patient need or to switch to pressure support ventilation (PSV) and possibly VC-IMV or PC-IMV and use PSV for spontaneous breaths. The original ventilator settings did not provide adequate flow or volume to meet the patient ventilatory demands. (NOTE: With spontaneous VT this high, one wonders if the patient needs the ventilator.)
Determining Initial Ventilator Settings During Pressure Ventilation
As previously defined, pressure-targeted ventilation provides a set pressure to the patient during breath delivery, whereas VT can vary from breath to breath (see Chapter 5). There are several methods to provide a pressure breath that should be considered. This discussion begins with baseline pressure and then includes PSV, pressure control ventilation, bilevel positive airway pressure, and dual-control modes (pressure-regulated volume control [PRVC] and volume support [VS]). Each of these modes has specific controls that are set by the operator (Table 6-3). Less frequently used pressure-targeted modes, such as pressure control inverse ratio ventilation, are discussed in Chapter 13, and airway pressure release ventilation is reviewed in Chapter 23.
TABLE 6-3
Required Setting Selection and Variables During Pressure Ventilation
| Name | Trigger | Cycle |
| Pressure support ventilation | Patient | Flow |
| Pressure control continuous mandatory ventilation | Time/patient | Time |
| Bilevel positive airway pressure | Time/patient | Flow |
| Pressure-regulated Volume control | Time/patient | Time |
| Volume support | Patient | Flow |
Volume-targeted ventilation has the advantage of guaranteeing volume delivery; however, it has the disadvantage of increasing PIP as CL decreases or Raw increases. Overinflation is also a risk. Pressure-targeted breaths have the advantages of providing flow on demand and potentially limiting pressures to avoid overinflation. With pressure-targeted breath delivery, rapid initial flows may cause frictional forces (shearing) between adjacent alveoli with differing lung inflation characteristics (time constants). In addition, VT varies as lung characteristics change. There currently are no definitive studies that have demonstrated a clear advantage of one method over the other.34
Setting Baseline Pressure–Physiological Peep
Functional residual capacity (FRC) frequently decreases when a patient is intubated or placed in a supine position.35,36 In most situations it is appropriate to use minimum levels of PEEP (3 to 5 cm H2O) to help preserve a patient's normal FRC.* Because only a modest amount of pressure is applied with this minimum level of PEEP, it is not considered a problem in terms of causing complications. In fact, not using a low level of PEEP may result in atelectasis. Use of low levels of PEEP may also be beneficial in patients with COPD who would normally pursed-lip breathe but cannot do so with an artificial airway in place (Box 6-8).
Box 6-8
Factors Affecting Expiratory Gas Flow
During normal expiration, gas flow from a lung unit (acinus) is the result of the elastic recoil of the alveolus (+2 cm H2O) plus the force (pressure) from recoil of the chest wall (+3 cm H2O) acting on the alveolar gas volume to produce a pressure gradient between the alveoli and the mouth (see Figure below, Part A). Notice that the total pressure (+5 cm H2O) at the alveolar level is greater than that at the mouth, so the air moves out of the lung.
As the exhaled air moves across the conductive airways, some of the driving pressure is lost to airway resistance, Raw (−1 cm H2O). In normal lungs, this pressure loss is small because the intrathoracic forces exert pressure both on the alveoli and the conductive airway. In a patient with normal airways, the resilience of the airway combined with the gas pressure in the airway lumen prevents airway collapse in most regions of the lung during most phases of the respiratory cycle. The pressure in the alveolus minus the pressure drop across the airway equals the pressure in the airway lumen (+5 cm H2O − 1 cm H2O = +4 cm H2O intraluminal).*
The pressure gradient changes in patients with weakened airways caused by loss of supportive connective tissue. (Loss of lung elasticity occurs with aging and in patients with pulmonary emphysema.) Part B of the figure shows an example of an alveolus with lower than normal lung elastic recoil forces (+1 cm H2O). The intrathoracic forces (+3 cm H2O) will not be affected, but the total force providing gas flow out of the lungs is lower (+4 cm H2O). When gas flows through an airway where Raw is increased, the pressure drop is greater than in normal airways (−2 cm H2O). As a result, the intraluminal pressure is lower (+4 cm H2O − 2 cm H2O = +2 cm H2O). Because chest wall elastic recoil pressures are greater than intraluminal pressures in the small airways weakened by loss of elastic recoil forces, these small airways tend to collapse from dynamic compression. Pursed-lip breathing is an effective maneuver that helps prevent airway collapse by resisting expiration, thus raising pressures across the entire length of the airway.
For patients with chronic obstructive pulmonary disease (COPD), it is not possible to pursed-lip breathe with an artificial airway in place and air trapping (auto-positive end-expiratory pressure [auto-PEEP]) is common. Early generation ventilators offered an expiratory retard control, which slowed the rate of exhalation by applying resistance to the expired gas flow. Older expiratory and PEEP valves actually increased resistance to exhalation whether resistance was desired or not. Newer microprocessor ventilators do not provide an expiratory retard option, and resistance through current expiratory valves is very low. Some practitioners consider that using low levels of PEEP (≤5 cm H2O) offers a means to provide a similar effect.

A, Alveolar, thoracic, and airway dynamics during exhalation in a patient with normal lungs (units in centimeters H2O pressure). B, Alveolar, thoracic, and airway dynamics during exhalation in a patient with chronic obstructive pulmonary disease (units in centimeters H2O pressure).
Determining Tidal Volume Delivery in Pressure Ventilation
In any pressure-targeted breath the difference in pressure (ΔP) between baseline (PEEP + auto-PEEP) and PIP determines what is set to establish VT delivery. Volume delivery will also be affected by the patient's lung characteristics and any patient effort that is present.
There are two ways to set the pressure in pressure-targeted breaths to provide the desired VT. One way is to deliver a volume-targeted breath to the patient at the desired VT and measure plateau and baseline pressures. Using the same baseline pressure, the breath can be switched to pressure-targeted breath using a set pressure equal to the Pplateau. The resulting VT will be approximately equal to the VT during the volume breath, as long as inspiratory time is set appropriately. The pressure can then be adjusted as necessary to obtain the desired volume delivery. The VT is continually monitored.
A second method to initiate pressure ventilation is to start at a low pressure (10 to 15 cm H2O) and check the VT before readjusting the pressure to attain the desired volume. (Box 5-5 includes a list of factors that affect volume delivery during pressure-targeted breaths.) Case Study 6-4 offers an exercise to illustrate this concept.
Case Study 6-4
Tidal Volume (Tv) During Pressure Control Continuous Mandatory Ventilation (PC-CMV)
A patient is set on 12 cm H2O of pressure during PC-CMV. If the measured VT is 350 mL and the desired VT is 550 mL, how would you adjust the pressure to achieve the desired VT?
Initial Settings for Pressure Support Ventilation
Usually PSV is started after the patient has been on full ventilatory support and is being changed to partial support to begin the process of discontinuing ventilation. PSV is used to support spontaneous breaths in a patient with an artificial airway when IMV or spontaneous/CPAP modes are used. The pressure is set at a level sufficient to prevent a fatiguing workload on the respiratory muscles.
Some clinicians recommend calculating the level of pressure support based on an estimation of total ventilatory system resistance determined while the patient is receiving VC-CMV. The resistance of the patient and the ventilator circuit during VC-CMV with constant flow can be estimated with the following equation: Raw = (PIP − Pplateau)/flow.36-39 It is probably easier and just as effective to set the initial PSV level to equal the transairway pressure (PIP − Pplateau) after establishing these values with VC-CMV. The level of PSV can then be adjusted once it has been initiated to an adequate level. Sometimes simply asking the patient if he or she feels it is easy to breathe and if he or she is getting enough air helps in adjusting initial PSV. (NOTE: Another way to determine whether an adequate amount of pressure support is being provided involves observing the patient's use of the accessory respiratory muscles [e.g., sternocleidomastoid muscle] during inspiration. Increased use of the accessory muscles of inspiration may indicate that the level of PSV is inadequate.)
Appropriate adjustment of PSV level can be done at the bedside. The goal of adjusting PSV is threefold.
1. To help increase VT (4 to 8 mL/kg)
2. To decrease respiratory rate (to <30 breaths/min)
3. To decrease the WOB associated with breathing through an artificial airway
For patients with lung disease, levels of 8 to 14 cm H2O are typically used to compensate for additional work associated with breathing through a tube and ventilator system. For patients without lung disease, about 5 cm H2O should be adequate to compensate for the additional work of breathing.
When patients, particularly infants, are receiving CPAP through a ventilator, it is recommended that pressure support is added if a high level of CPAP (10 cm H2O) is being used. CPAP by itself may increase WOB, and adding pressure support reduces this workload.40
As previously discussed in this chapter, VT selection varies depending on the patient's lung condition. Low-volume and high-frequency alarms must be set appropriately because a number of factors can change the VT and  . If a backup ventilation mode is available on the ventilator, it is also appropriate to set the backup ventilation parameters for the patient, particularly if PSV is being used by itself.
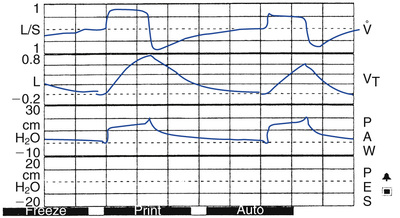
When patients with COPD are ventilated with PSV, it may be prudent to use graphic displays of pressure and flow versus time to monitor their status. These patients are known to have active short inspirations. In addition, if the patient begins to exhale actively during flow delivery from the ventilator, the flow may not drop to the necessary cycling value. Consequently the ventilator breath may not end as normally expected, resulting in a sudden rise in the pressure curve at the end of the breath41 (Fig. 6-5). The breath may actually pressure cycle. The same can occur in other patients when ventilators use a very low flow criterion for ending inspiration. This can also induce expiratory muscle activity.42 The problem can be avoided by using a ventilator with adjustable flow-cycling characteristics for patients demonstrating expiratory muscle activity. A cycle criteria of 40% of peak flow is an appropriate starting point for a patient with COPD. (NOTE: Using a low-flow cycling value [10%] may be appropriate for patients with restrictive disorders [Case Study 6-5].)
Case Study 6-5
Inspiratory Flow Termination in Pressure Support Ventilation (PSV)
Problem 1
During PSV, a patient's peak flow is 50 L/min. At what flow level will inspiration end if the ventilator has a 25% flow cycle criterion?
Problem 2
A patient on PSV has an endotracheal tube cuff that is not inflated, preventing the ventilator from reaching the flow cycle criterion to end inspiration. What will terminate inspiration?
Problem 3
At the end of inspiration, a patient on PSV actively exhales before the ventilator detects the drop in flow required to cycle the breath. How will this affect the pressure/time waveform of the ventilator?
Initial Settings for Pressure Control Ventilation
Rate, inspiratory time, and I : E ratio are set in PC-CMV as they are with VC-CMV. The pressure gradient (PIP − PEEP, including auto-PEEP) is adjusted to establish volume delivery based on patient lung characteristics and effort. Initial pressure is set at the Pplateau value determined during VC-CMV and must be adjusted as necessary to achieve VT. If Pplateau is not available, the peak pressure from VC-CMV minus 5 cm H2O (PIP − 5 cm H2O) can be used as a starting point.43,44
If volume readings are not available, an initial pressure of 10 to 15 cm H2O with simultaneous volume measurement and adjustment is appropriate. The pressure limit must be set, because in some ventilators pressure can be higher than the set pressure control level if the patient actively coughs. Low VT and high f alarms are also necessary.
An important advantage of PC-CMV is that Palv usually will not exceed the applied pressure. Setting a PIP of less than 30 cm H2O can therefore help avoid alveolar overinflation. Because it is not possible to measure Palv in all situations, PIP is maintained less than this set pressure. The patient's Palv can be estimated by observing the flow curve. If the flow drops to zero before inspiration ends, then the applied pressure is reaching the alveolar level by the end of inspiration (see Fig. 5-2). If inspiration ends before the flow reaches zero, then Palv is less than applied pressure, but is not measurable. In this case, TI may need to be adjusted (increased) depending on patient need and VT delivery.
Normally PC-CMV provides a descending ramp waveform. As with PSV, current generation ventilators (e.g., the CareFusion AVEA) are able to adjust the inspiratory rise time, which is the amount of the TI required for the ventilator to reach the set pressure at the beginning of inspiration. The practitioner can adjust the rise to meet patient needs as with PSV (see Fig. 5-9). It is advisable to use graphic monitoring to help make adjustments in pressure, TI, and flow taper. If TI is too long and the patient starts to actively exhale, a slight rise will occur at the end of the breath on the pressure curve.
Compared with similar settings on VC-CMV, PC-CMV has been shown to improve oxygenation and gas exchange, increase  , and facilitate lung healing. PC-CMV also reduces the PIP, the amount of applied PEEP, VE, respiratory work, the need for sedation, and the duration of mechanical ventilation.44-48 Pressure-targeted ventilation is safe and well tolerated as an initial mode of ventilation in patients with acute hypoxemic respiratory failure and may result in greater patient comfort.43,48
Initial Settings for Bilevel Positive Airway Pressure Ventilation
Bilevel positive airway pressure (bilevel PAP) can be used for intubated patients or nonintubated patients, although it is most often used as noninvasive positive pressure ventilation (NIV). Initial settings include an inspiratory positive airway pressure (IPAP) of about 5 to 10 cm H2O. The level of IPAP is increased in increments of 3 to 5 cm H2O until a rate of 25 breaths/min or lower is achieved and the VT is 4 to 8 mL/kg or more, depending on the patient's pathology. Expiratory positive airway pressure (EPAP) or PEEP is initiated at 2 to 5 cm H2O and increased in increments of 3 to 5 cm H2O. The initial FIO2 is set to ensure adequate oxygenation. It is important to recognize that initiating NIV may require a considerable amount of time to achieve patient compliance.
For patients with COPD experiencing air trapping (auto-PEEP), EPAP is typically set at 80% to 90% of the level of auto-PEEP, which is usually a range of 3 to 10 cm H2O. Observing the patient's use of accessory muscles (e.g., sternocleidomastoid muscles) during inspiration can assist in the titration of EPAP when auto-PEEP is present. For patients with hypoxemic respiratory failure, a PEEP/CPAP level greater than 5 cm H2O is often required. (NOTE: The use of PEEP to help a patient trigger the ventilator is also used in other modes of ventilation besides NIV.) If no improvement is seen after about 2 hours of treatment, this mode of ventilation is probably not benefiting the patient and a more aggressive intervention may be necessary. Additional information on noninvasive ventilation can be found in Chapter 19.
Initial Settings for Pressure Ventilation Modes with Volume Targeting
Pressure ventilation with volume targeting, previously called “dual-control” ventilation, provides the benefits of pressure breaths along with targeting a set volume (see Chapter 5). Pressure-limited, volume-targeted modes are available in two forms, one where volume is targeted for each breath and one where volume is targeted over several breaths. (Additional information on dual-control ventilation is available on the Evolve website.)
Initial Settings of Pressure-Regulated Volume Control (PRVC)
Pressure-regulated volume control (PRVC) is a mode of ventilation that provides closed-loop pressure breaths and targets the pressure to achieve the set volume. PRVC is a pressure-limited, time-cycled mode that uses the set VT as a feedback control.49 PRVC was originally available only with the Servo 300 ventilator, but it has now been incorporated into a number of other ventilators. As Table 6-4 shows, the names to describe PRVC vary among manufacturers.
TABLE 6-4
Names for Pressure-Regulated Volume Control (PRVC) and Volume Support on Different Ventilators
| Ventilator Name | PRVC Name |
| Hamilton G5 | Adaptive pressure ventilation |
| CareFusion AVEA | PRVC |
| Dräger 500 | Autoflow |
| Servo-i | PRVC |
| Ventilator Name | VS Name |
| Servo-i | VS |
| Dräger V500 | SPN-CPAP/VS |
| PB 840 | VS |
With PRVC, the operator sets a VT to be delivered that is appropriate for the patient. The baseline pressure and the maximum pressure limit are also set. The ventilator delivers one or more test breaths. For example, in the Servo-i, the test breath is a volume-targeted breath with an inspiratory pause. The test breaths allow the ventilator to calculate static compliance and Raw of the patient and system to determine the pressure required to achieve the set VT. The first pressure level delivered in PRVC equals the plateau pressure measured during the test breath. The ventilator progressively adjusts the pressure level until the set VT is achieved. The operator can evaluate volume and pressure graphics to ensure that these parameters are set appropriately (see Fig. 5-10). (NOTE: The exact maximum level of pressure delivery may differ between ventilators, but the ventilator relies on the upper pressure limit to determine how high to go when increasing pressure delivery to deliver the set VT.)
It is important to set the upper pressure limit for two reasons:
1. It provides the upper limit for the ventilator to use in adjusting the pressure breath. (Pressure will not exceed a fixed amount, usually 5 cm H2O below the upper pressure limit.)
2. If a patient coughs or forcibly exhales during the inspiratory phase, the ventilator will not permit pressure to exceed the upper pressure limit.
Current-generation ventilators with floating exhalation valves can actually release pressure during a forceful cough. This helps maintain the inspiratory pressure without prematurely ending inspiration as a result of pressure cycling when circuit pressures reach the upper pressure limit.
The following example illustrates how the ventilator adjusts pressure during PRVC. Suppose that the tidal volume is set at 600 mL, the baseline pressure is + 5 cm H2O of PEEP, and an upper pressure limit of 35 cm H2O is set. Imagine that the patient begins ventilation with the PRVC mode using a pressure of 20 cm H2O to achieve the 600-mL volume target. Then suppose the patient suddenly develops a pneumothorax. This would reduce the patient's compliance, thus requiring a higher pressure to deliver the desired VT of 600 mL. (The ventilator reaches 30 cm H2O but is unable to deliver the 600 mL.) Circuit pressure is now within 5 cm H2O of the upper pressure limit and the ventilator's alarm will activate. This will be an audible alarm and perhaps a digital message that might say, “Pressure limited, please evaluate.” The clinician must evaluate the patient and determine whether ventilator changes are required (Case Study 6-6).
Case Study 6-6
Pressure-Regulated Volume Control (PRVC)
A patient on PRVC has a set volume of 550 mL. The upper pressure limit is set to 30 cm H2O. Initially, 19 cm H2O is required to deliver the volume. The pressure is now at 13 cm H2O. What should the therapist do in this situation?
Initial Settings of Volume Support
Volume support is a purely spontaneous mode (see Fig. 5-11). In addition to setting the ventilator sensitivity, the operator sets the VT and the upper pressure limit. Again the selection of VT is based on the same criteria that are used in VC-CMV. The advantage of volume support is that spontaneously breathing patients can establish their own respiratory rate and VT. (NOTE: In volume support, the set VT is the minimum VT. A patient can obtain a higher VT if desired.) As lung characteristics improve, less pressure is required from the ventilator to deliver the volume, which automatically drops pressure delivery. At the same time, if the patient becomes apneic, volume support modes provide a “safety net,” usually as a backup mode that can provide a set rate and volume.
 Summary
• The primary goal of VC-CMV is to achieve a  that matches the patient's metabolic needs and ensures adequate gas exchange.
• Initiation of VC-CMV requires several considerations, including  settings (VT and f), inspiratory gas flow, flow waveform, inspiratory to expiratory (I : E) ratio, pressure limit, inflation hold (inspiratory pause), and inspiratory and expiratory pressure (PEEP).
• Settings for VT and f should reflect a  that is derived from the initial calculation based on patient's gender and BSA and pathology.
• Regardless of the method used for selecting the VT for a patient, it is important for clinicians to be aware of potential risks of causing lung injury, such as overdistention of lung tissue, and atelectasis.
• The tubing compliance, or system compressibility, reflects the volume of gas compressed in the ventilator circuit during the inspiratory phase.
• A number of devices can decrease or increase the amount of VDmech added to the breathing circuit.
• An understanding of the interrelation between inspiratory flow, inspiratory time (TI), expiratory time (TE), TCT, and I : E ratio is necessary for the clinician to effectively ventilate a patient.
• During VC-CMV where patient-triggered breaths are present, the patient's respiratory rate may actually vary, depending on flow and TI setting.
• A variety of flow patterns are available on most ventilators, including constant flow, descending ramp, ascending ramp, and sine flow patterns. The most common are constant and descending ramp patterns.
• Clinicians must familiarize themselves with how a ventilator functions when selecting peak flow and waveform pattern.
• A constant flow pattern generally provides the shortest TI of all the available flow patterns with an equivalent peak flow rate setting. Descending flow pattern may improve the distribution of gas in the lungs, reduces dead space, and increases oxygenation by increasing mean and plateau airway pressures.
• PSV is used to support spontaneous breaths in a patient with an artificial airway when the IMV or spontaneous/CPAP modes are used.
• PRVC provides closed-loop pressure breaths and targets the pressure to achieve the set volume.
Review Questions (See Appendix A for answers.)
1. A respiratory therapist is determining the tubing compliance of a ventilator before use. A volume of 100 mL delivers a pressure of 33 cm H2O. What is the compliance of the circuit?
2. Following initiation of ventilation using the circuit described in Question 1, the PIP is 15 cm H2O and the VT set is 250 mL. About how much volume is actually reaching the patient?
3. A patient being ventilated with a CareFusion AVEA has a set VT of 700 mL, and f is at 12 breaths/min on the VC-CMV mode. The patient is initiating another 3 breaths/min so that the total f is 15 breaths/min. What is the patient's actual  ? Also answer the following questions.
A. If the flow is set at 30 L/min using a constant flow pattern, what is the flow in L/sec?
B. What is the TCT based on the set machine f of 12 breaths/min?
C. What is the TCT based on the actual machine f of 15 breaths/min?
D. What is the TI based on the set f, flow, and VT?
E. What is the TE when the f is 12?
F. What is the TE when the f is 15?
4. A therapist wants to select a flow waveform and flow setting for a patient with severe asthma. Which of the following is a good initial setting?
5. A practitioner sets an inspiratory pause of 0.5 seconds to obtain a Pplateau reading and to calculate the patient's static compliance. During the measurement, a stable plateau is not seen on the pressure–time graph. What could be the problem?
6. A post-open heart surgery patient is still intubated and under the effects of anesthesia. He is being transferred from the operating suite to the recovery unit. The surgeon wants to keep ventilating pressures to a minimum and is less concerned about ventilation. The patient's body temperature is 35° C. He is 5 foot 9 inches tall and weighs 210 lb.
C. What is an appropriate initial  ?
?
D. Would you use PC-CMV or VC-CMV, and why?
E. What VT would be an appropriate target?
F. Based on the VT you selected, what would be an appropriate rate?
7. A patient with ARDS is to be changed from a CPAP of +10 cm H2O to VC-CMV. She is 5 foot 4 inches tall and weighs 195 lb. What tidal volume and rate would you set, and why? Would pressure control ventilation be appropriate for this patient?
8. NIV is being initiated on a 54-year-old man with a history of COPD. He has an IBW of 70 kg. The initial settings are IPAP = 8 cm H2O and PEEP = 3 cm H2O. The patient's VT on these settings is 280 mL and f = 27 breaths/min. What change would you recommend?
9. A patient with right lower-lobe pneumonia and a temperature of 100° F must be mechanically ventilated. How should the initial  be adjusted? (HINT: See Box 6-1.)
10. A physician requested that her patient be switched from PC-CMV to VC-CMV to guarantee volume delivery. Ventilator parameters are VC-CMV + PSV; VT = 0.6; f = 20 breaths/min, flow = 60 L/min (using constant flow waveform); PSV = 27 cm H2O; PEEP = +8 cm H2O; PIP = 56 cm H2O; and Pplateau = 43 cm H2O. The physician asked the respiratory therapist to find a way to reduce pressures without changing  . What is a possible solution?
11. A ventilator is set with PRVC with a PEEP = +5 cm H2O, a set VT of 650 mL, and an upper pressure limit of 30 cm H2O. Initially the pressure required to deliver the VT was 20 cm H2O. After a period of 24 hours, the pressure required to deliver the set VT increases to 24 cm H2O. What changes have probably occurred in the patient's lung characteristics?
12. What ventilator mode is patient triggered, pressure targeted, flow cycled, and also targets a set tidal volume?

13. The pressure–time and flow–time curves above are viewed during PC-CMV ventilation with an apneic patient. What is the Pplateau?

14. The pressure–time curve above is observed during PSV. What is causing the curve to appear like this?
B. No sloping in the presence of increased airway resistance