18
Quality Control for Computed Tomography Scanners
On completion of this chapter, you should be able to:
1. explain what is meant by quality control (QC) for CT scanners.
2. state the benefits of a QC program for CT scanners.
3. identify and describe the three essential steps in a QC program.
4. identify the range of QC tests to be done by the technologist as prescribed by the ACR and the IAEA.
5. identify three categories of equipment and phantoms for CT QC tests.
6. describe briefly the features of the ACR phantom.
7. outline the three basic tenets of a QC program for CT.
8. describe briefly each of the following with respect to CT QC:
• exposure technique selection
• testing frequency
• limits of a passing test.
9. outline the visual inspection requirements for CT QC.
10. state the acceptance criteria for the following ACR CT accreditation QC tests using the ACR phantom:
• light accuracy alignment
• high-contrast resolution (spatial resolution)
• low-contrast resolution
• image uniformity
• noise
• CT number accuracy
• slice thickness.
11. identify other CT QC tests not listed in 10 above.
Key Terms to Watch for and Remember
The following key terms/concepts are important to your understanding of this chapter
acceptance testing
acceptance limits
dosimetry phantoms and instrumentation
error correction
generic limits
geometric phantoms
image performance phantoms
quality control (QC)
quantitative phantoms
routine performance
tolerance limits
visual inspection
What is Quality Control?
What is quality control (QC), and how does it relate to computed tomography (CT) scanners? For CT scanners, QC may be defined as a program that periodically tests the performance of a CT scanner and compares its performance with some standard. If the scanner is performing suboptimally, then steps must be initiated to correct the problem. The goal of a QC program is to ensure that every image created by the CT scanner is a quality image, with minimum radiation dose to patients and personnel. High-quality images provide the radiologist maximum information, improve the chances for correct diagnosis, and ultimately contribute to quality patient care.
QC deals with the CT imaging equipment and is an essential component of a radiation protection program. It includes several principles and concepts that ultimately lead to dose optimization as a strategy for radiation protection of patients. Furthermore all CT departments should have a QC program (Nute et al., 2013).
This chapter describes a generic QC program that can be adapted to almost any CT scanner system. As part of the purchase package, CT manufacturers often prescribe a daily QC program for use on their CT systems. Sometimes their QC program includes a specially furnished phantom or test object to be imaged with selected techniques. Descriptions of the testing instruments, an outline of necessary measurements, and hints on interpretation of the results are presented. In some cases, internal software is used to interpret the measurements and to notify the operator of unsatisfactory results.
Essential Steps in a QC Program
Bushong (2013) and others (IAEA, 2012; Papp, 2015) have noted that QC involves three fundamental steps:
1. Acceptance testing
2. Routine performance evaluation
3. Error correction
Acceptance testing basically verifies compliance, that is, whether the CT equipment meets manufacturers’ specifications (usually as outlined in the hospital’s request for proposal to purchase a CT scanner) and ensuring that it operates efficiently in terms of various outputs, such as image-quality requirements and dose output. In general, acceptance testing is usually done by qualified medical physicists or others with a firm knowledge of how CT scanners work. Acceptance testing generally includes that the features ordered are delivered and there is mechanical and electrical integrity, stability, safety of various components (interlocks and power drives, for example), and CT dose and imaging performance. Acceptance tests, for example, may include verification of slice thickness, CT number linearity, uniformity, spatial and contrast resolution, noise, and dose output.
Routine performance evaluation refers to monitoring the components of the CT scanner that affect dose and image quality. Monitoring includes QC tests that are performed on a daily, weekly, monthly, and yearly basis. This is part of an ongoing QC process. In general, technologists are quite active in routine performance testing of the CT scanner. Some tests, however, require the expertise of the medical physicist. Some authorities such as the American College of Radiology (ACR), the International Atomic Energy Agency (IAEA), and Health Canada often prescribe specific tests that should be done by the technologist and those that should be done by the medical physicist. For example, the ACR (2012) suggested that the following tests be done by the CT technologist:
1. CT number for water and standard deviation (noise)
2. Artifact evaluation
3. Display monitor QC
4. Visual inspection of certain components of the scanner
In addition, the IAEA noted that the following tests be conducted by the technologist:
1. CT alignment lights
2. Scanned projection radiography (SPR) accuracy, also referred to as “scout view,” “topogram,” “scanogram,” or “pilot” (CT vendor terminology)
3. CT number, image noise, image uniformity, and image artifacts
4. Image display and printing
5. External CT positioning lasers
6. Couch top alignment and positional accuracy
7. CT number of multiple materials
The IAEA (2012) also suggested that the medical physicist should conduct specific QC tests and provide advice to CT departments on the following:
1. CT image quality and radiation protection considerations not only for the patient, but for personnel and members of the public
2. Acquisition and installations of CT scanners, including shielding considerations
3. Performance of specific QC tests (recommended for the medical physicist) on various components of the CT scanner, including acceptance testing and routine performance QC tests
4. Dose optimization
5. The specific responsibilities of the technologist in conducting the tests as required by the QC program
The CT QC tests that should be specifically conducted by the medical physicist (#3 above) as outlined by the IAEA and coincide with those of other radiology authorities such as the ACR and Radiation Protection Bureau-Health Canada (RPB-HC) are as follows:
1. Visual inspection and review of the QC program
2. CT alignment lights
3. SPR accuracy
4. kV and half-value layer
5. Radiation dose
6. CT number accuracy, image noise, image uniformity, and image artifacts
7. Image display and printing
8. Imaged slice width
9. X-ray beam width
10. Spatial resolution (modulation transfer function or modulation)
11. External CT positioning lasers
12. Couch top alignment and index accuracy
13. Gantry tilt
14. CT number accuracy
Finally error correction deals with the evaluation of the results of the QC tests. If the CT scanner fails to meet the tolerance limits or acceptance limits (to be described later in the chapter) established for the particular QC test, then the scanner must be serviced to ensure that tolerance limits are met. This is the basic tenet of error correction.
Equipment and Phantoms for QC Testing
CT QC testing requires a set of test tools that includes special equipment and phantoms, which are used to conduct the QC tests. These phantoms and equipment have been placed in essentially three categories: image performance phantoms, geometric phantoms, and quantitative/dosimetry phantoms and instrumentation (IAEA, 2012). These phantoms are designed specifically to measure various variables for QC monitoring.
Image performance phantoms are used to verify the performance of the CT scanner on image-quality characteristics such as high- and low-contrast spatial resolution and noise. Geometric accuracy phantoms include tools to measure SPR accuracy and CT laser accuracy. On the other hand, dosimetry phantoms are used to assess the CT dose output such as the computed tomography dose index (CTDI). Finally, quantitative CT phantoms are used to measure the accuracy of CT numbers.
While some phantoms are included with the CT scanner when delivered to the facility, others are available commercially. Two examples of phantoms include the ACR CT accreditation phantom, the Gammex 464 available from Gammex, Middleton, Wisconsin, and the Catphan 700, a commercially available phantom from The Phantom Laboratory in New York.
ACR CT Accreditation Phantom
The ACR accreditation phantom is described in detail by the ACR (2015) for use in their voluntary CT accreditation program, which is intended to demonstrate to patients and personnel operating the CT facility the safety and effectiveness of their CT imaging services.
The phantom is based on Solid Water construction to ensure stability and reproducibility of QC tests conducted over time. An important feature of this phantom is that it consists of the four modules illustrated in Figure 18-1, which are designed to measure positioning accuracy, CT number accuracy, slice thickness, light accuracy alignment, low-contrast resolution, CT number uniformity, and high-contrast resolution. Furthermore, the phantom is marked with the words “HEAD,” “FOOT,” and “TOP” (Fig. 18-1, A) to assist with proper alignment during use. An interesting and comprehensive article on the ACR CT accreditation phantom is one by McCollough et al. (2004). This article outlines practical tips, artfact examples, and pitfalls to avoid. Furthermore the essential criteria (tolerance or acceptance limits) are still the same. Last but certainly not least, the essential specifications and characteristics of the ACR CT accreditation phantom are listed in Table 18-1.
The Catphan 700
There are several CT QC phantoms available for CT QC testing, including those provided by CT manufacturers and included in the purchase of the scanner. It is not within the scope of this chapter to describe details of all of these phantoms; however, essential features of one such commercially available phantom, the Catphan 700, will be highlighted.
The Catphan 700 Phantom (Fig. 18-2, A) was designed for The Phantom Laboratory (2015) with the assistance of Dr. David Goodenough for QC of CT volume scanners. As noted by The Phantom Laboratory, “. . . the phantom retains many of the tests and features offered in the other Catphan® models. . . .” This CT QC phantom includes three solid-cast test modules (Fig. 18-2, B) positioned inside the housing of the phantom such as sensitometry slice geometry module (Fig. 18-3, A), a 30 line pair per centimeter (lp/cm) module (Fig. 18-3, B), and a low-contrast sphere array (Fig. 18-3, C). In addition, the phantom also contains the new wave insert for measuring slice geometry and resolution across the scan area (Fig. 18-3, D). For more complete details of the Catphan 700 Phantom, the interested reader should contact The Phantom Laboratory (2015).

FIGURE 18-1 A, Diagram of the four modules of the ACR CT accreditation phantom. B, Photograph of a properly aligned phantom. C, Centering left to right on both the phantom and the phantom base (optional) substantially simplifies the alignment process. D, Top view of a properly aligned phantom. E, Side view of a properly aligned phantom. The white Teflon rings on the optional phantom base may cause streak artifacts and should be moved away from the central portions of each module, which are indicated by the four white lines circumscribing the phantom. (From McCollough, C. H., Bruesewitz, M. R., McNitt-Gray, M. F., et al. (2004). Medical Physics, 31 (9), 2423-2443. Reproduced by permission of the American Association of Physicists in Medicine [AAPM] and the author.)
TABLE 18-1
Specifications of the ACR CT Accreditation Phantom
| Phantom Construction | |
| Matrix material | Solid Water, 0 ± 5 HU |
| Length | 16 cm (6.30 inches) |
| Diameter | 20 cm (7.88 inches) |
| Weight | 5.3 kg (11.75 pounds) |
| Imbedded Test Objects | |
| Water equivalent linearity rod | Solid Water, 0 HU |
| Bone equivalent linearity rod | 955 HU bone tissue-equivalent material |
| Acrylic linearity rod | Cast acrylic |
| Polyethylene linearity rod | Low-density polyethylene |
| Low-contrast module matrix | Ciba Geigy CB4 epoxy or equivalent |
| Low-contrast rods | Ciba Geigy CB4 epoxy (density adjusted to yield 6 ± 0.5 HU difference) or equivalent |
| Tungsten carbide beads | 0.011 in diameter grade 25 tungsten carbide beads |
| Line pair material | 6061 aluminum and polystyrene |
| Steel beads | 1.00 mm grade 25 chrome steel balls |
| Intramodule homogeneity | The mean ROI values within any module, test objects excluded, can differ by no more than 2 HU |
| Intraphantom homogeneity, modules 1, 3, and 4 | The average CT number of a module must meet the requirements of 0 ± 5 HU |

(Courtesy Gammex Inc., Middleton, Wis.)
Why Quality Control?
The answer to the question, “Is a QC program needed for the CT scanner?” is usually “yes.” Modern hospitals and clinics that operate CT scanners and other complex instruments have long recognized the value of QC programs to maintain high performance standards for their patients. In addition, regulatory agencies increasingly demand that some standard of quality be maintained on x-ray units and other equipment that can potentially harm patients if the units are not performing optimally. These agencies frequently require that institutions using CT scanners verify the scanner’s performance periodically (e.g., daily, weekly, monthly, annually) and often prescribe alternative measures if the performance standards are not met. To meet these regulatory requirements, a QC program must be operational.
In the case of CT scanners, the engineering is exceedingly complex. With so many mechanical and electronic parts involved in the creation of the images, there are many opportunities for the quality of the images to subtly and unnoticeably degrade. The mechanical parts of these complex, heavy instruments can wear slowly. Electronic parts can change characteristics and drift out of optimal adjustment. When this occurs, the CT scanner may no longer yield the same quality images it did when it was in proper adjustment. Often, this wear and drift can be repaired or compensated, but the suboptimal imaging problems must first be recognized. Comparing modern QC data with past data can demonstrate that the scanner is not performing as well as in the past.

FIGURE 18-2 The Catphan 700 housing (A) and three solid-cast test modules are mounted inside the phantom’s housing (B). (Courtesy The Phantom Laboratory, Salem, New York.)

FIGURE 18-3 The Catphan 700 contains three solid-cast test modules positioned inside the housing of the phantom such as sensitometry slice geometry module (A), a 30 lp/cm module (B), and a low-contrast sphere array (C). In addition, the phantom also contains the new wave insert for measuring slice geometry and resolution across the scan area (D). (Courtesy of the Phantom Laboratory, Salem, New York).
A QC program can be an important ally in many aspects of CT scanner service. For example, if the QC data are used to define the problem and its extent, the service person will be better able to correct a subtle image quality problem. If a measurable change can be quantitatively demonstrated to the service person, the necessity of repair will be more apparent, and the degree to which it should be repaired can be specified (i.e., “we want it to perform like new” or “as good as last August”).
Often a QC program can result in reduced downtime. A good QC program may recognize weakened or marginally performing parts before complete failure, and unscheduled service may be avoided.
Three Tenets of Quality Control
Three basic tenets of quality control are as follows:
1. QC must be performed on a regular periodic basis. Ideally, these tests might be performed between each patient examination. At this testing frequency, there would be maximal assurance that the CT scanner was always operating correctly. However, in reality, this very frequent QC attention is too costly in terms of the time taken from patient examinations. Some compromises must be made for the sake of time and effort.
It does seem prudent to perform certain quick tests on a daily basis. Less important or more time-consuming tests might be performed less frequently (e.g., monthly), and the most complex tests might be performed semiannually or yearly. The institution’s philosophy and its willingness to devote time to periodic QC tests often dictate which tests are performed and how often. To an administrator watching the revenues generated by a CT scanner, QC has a double affliction of requiring labor, which must be paid, and reducing the availability of the CT scanner for patients, which reduces revenue. A compromise must be reached that balances the effort and expense of a QC program with the expected benefits, such as better images, consistent images, reduced downtime, and legal and regulatory dose requirements.
2. Prompt interpretation of the measurements. Data usually show that the CT scanner is operating within specified guidelines. But on those occasions when it is not, this fact must be recognized and some remedial action must be taken. This action may be as simple as notifying the physicist, service person, or radiologist, or it may be as aggressive as taking the unit out of service until it is repaired. To institute this facet of the QC program, the person making the test must be able to recognize that the results are outside acceptable limits. Some mechanism should be in place that alerts the QC technologist to errant behavior of the scanner. For example, on the data form for a particular test, acceptable limits of the data may be stated. From an inspection of the measured results, the QC technologist can recognize immediately that the results are out of tolerance. Another method is to enter data into a computer, then instruct the computer to issue an appropriate alert when limits are exceeded. In the latter case, the temptation to sit on data for a few days or weeks before they are entered into the computer must be avoided. If a computer is to be relied on to make the necessary comparisons and if the program is to be effective, the data must be entered promptly.
3. Faithful bookkeeping. If time and effort are to be expended to perform the tests, then the results should be recorded. These results should be maintained in a logbook, data form, or computer for a reasonable period, usually as long as the CT scanner is active (i.e., for its lifetime). Keeping good records is not just a tedious exercise. These results will prove invaluable if the unit appears to be malfunctioning in the future. A comparison of past measurements with current results can easily demonstrate a change in performance (usually degradation). These data can also prove important to defend a lawsuit that might arise because of a reading of a CT image. For example, if litigation arises that is dependent on an interpretation (or misinterpretation) of a CT image and data can be produced from the QC logbook to demonstrate that the CT scanner was functioning satisfactorily at the time of interpretation, then the CT scanner is removed as a source of blame for the interpretation.
Quality Control Tests for CT Scanners
Historically, current QC tests have evolved from those published in the literature (Burkhart et al., 1987; Cacak, 1985; Cacak & Hendee, 1979; McCollough et al., 2004) and described in Report 99 of the National Council on Radiation Protection and Measurement (1988). More complex physics tests are outlined in Report 39 of the American Association of Physics in Medicine (AAPM, 1993). Additionally, Health Canada (2008) outlined CT QC tests for CT facilities in Canada, for the purposes of ensuring that CT scanners meet national guidelines to protect patients, personnel, and members of the public from radiation dose from CT scanners. Additionally, AAPM Report No. 111: Comprehensive Methodology for the Evaluation of Radiation Dose in X-Ray Computed Tomography (2010) outlined “a new measurement paradigm based on a unified theory for axial, helical, fan-beam, and cone-beam scanning with or without longitudinal translation of the patient table.” This report, as noted by the AAPM, is to “make available an accurate approach for specifying CT radiation doses based on a theoretically coherent measurement methodology that can be readily implemented by medical physicists and that can be supported by manufacturers, standards developers, and regulators.”
More recently, Nute et al. (2013) in a study that examined the “evaluation of over 100 scanner-years of computed tomography daily quality control data.” the authors concluded that the
standard deviation of water is the most important quantitative value to collect as part of a daily QC program. Uniformity and linearity tests have relatively low failure rates and, therefore, may not require daily verification. While its failure rates were moderate, daily artefact analysis is suggested due to its potentially high impact on clinical image quality. Weekly or monthly large phantom artifact analysis is encouraged for those sites possessing an appropriate phantom. Although the tests are similar to those described in these references, the types and frequency of the QC tests may vary somewhat to reflect advances in CT scanner technology.
The methods described in the remainder of this chapter provide some details of the testing procedure, the equipment required, interpretation of the results, some suggestions for acceptable limits, and how often the tests should be performed. The tests are listed in approximate order of importance, with some weighting of the tests according to the ability to perform the test quickly and easily.
Choosing a Technique for Quality Control Measurements
The selection of technique for the QC tests depends on the type of CT scanner and the test being performed. Many variables can be selected for each test, including peak kilovoltage (kVp), milliamperage (mA), scan time, slice width, type of algorithm, x-ray filter type, and focal spot size. The number of possible combinations of techniques is usually overwhelming, and the best that can be done is to select one or two representative techniques. In general, the technique should remain the same for a specific test from day to day. However, the technique for one test does not have to be the same as the technique for other tests. A good rule of thumb is to use a technique that matches a frequently used clinical technique. One way to select a QC technique is to choose the most frequently used head or body technique and use it for the tests. As many tests as possible should be performed with this technique, with the understanding that deviations may be required for some tests.
Test Priority and Test Frequency
It is usually necessary to limit the more complex tests to annual surveys, those occasions when the CT scanner is initially tested for acceptance, and subsequent occasions when the deterioration of image quality is suspected. It is good practice to repeat appropriate tests after replacement of a major component such as an x-ray tube or after the performance of extensive service or adjustments. If data from CT scanner images are used quantitatively or if the precision of an image is used for accurately localizing tissue (e.g., to perform biopsies or plan radiation therapy treatment), the frequency of appropriate tests should be increased.
The IAEA, for example, classifies QC tests into two types that define their priority: those that are essential and those that are desirable. While essential tests must be conducted by CT departments, desirable tests are those that should be done, if practical (IAEA, 2012).
Limits of a “Passing” Test
What are acceptable limits? How big should the window of acceptable values be for each test described here before the CT scanner is considered “out of tolerance”? These complex questions depend on the technology of the unit tested, the type of test instrument used, and the imaging technique.
Perhaps more important than the actual value of the measured variable is a change in the variable between measurements. A CT scanner that is operating the same today as it did yesterday should produce nearly the same results when the test is repeated. After acceptable limits are established, a quick inspection of the measurements can identify deviant values. Past history can provide good insight into what the values have been. A range that includes most values when the unit was operating optimally can be easily determined from an inspection of past values. Of course, it is never absolutely certain that the CT scanner was operating optimally in the past when these supposedly “good” readings were taken. But if the readings were taken when the unit was new or believed to be functioning well, then they can be presumed to be “good” readings and used as a standard.
The IAEA (2012) provided two “performance standards” for QC test results. These include acceptable and achievable. While acceptable “indicates that performance must be within certain tolerances, and if it is not, the equipment should not be used,” achievable “indicates the level of performance that should be attained under favorable circumstances, which is the level at which a facility should work if feasible.”
It is important to realize that various authorities such as the ACR, the IAEA, and RPB-HC provide acceptance or tolerance limits that may not exactly be the same as the generic ones mentioned earlier. For example, the acceptable limits for three QC tests (CT number accuracy, CT number uniformity, and radiation dose) from these three organizations are given in Table 18-2.
Quality Control Tests
QC tests described in this section include visual inspection of the various components of the CT scanner and those that address the routine performance of the scanner. For routine performance, the acceptance criteria for the ACR CT Accreditation tests will be outlined, followed by a set of proposed routine performance QC tests. For the routine performance QC tests, suggestions are given regarding the following: phantom or equipment, expected results, acceptance limits, possible causes of failure, and frequency of tests.
TABLE 18-2
Acceptance Criteria or Tolerance Limits for Three CT QC Tests from one International Organization (IAEA) and Two National Organizations (ACR and RPB-HC)
| QC Tests | ACCEPTANCE CRITERIA OR TOLERANCE LIMITS | ||
| ACR | IAEA | RPB-HC | |
| CT numberaccuracy | 0 ± 7 HU (±5 HU preferred) | 0 ± 5 HU | 0 ± 4 HU |
| CT number uniformity | The center CT number must be between ±7 HU (±5 HU preferred) Adult abdomen protocol must be used | ±10 HU | CT number for water must not be greater than ±5 HU from the center of the phantom to the periphery |
| Radiation dose | The CTDIw should not exceed 35 mGy for the adult abdomen protocol and CTDI | ±20% of manufacturer’s specification | CTDIw, which must be within ±20% of the established baseline values and the manufacturer’s specifications; it is highly recommended to strive for an agreement with manufacturers’ specification of ±10% |

Some generic limits are suggested for these QC tests, and CT departments must decide upon the specific tolerance limits for their QC program, based on the requirements of the related national authorities. For example, if a CT facility participates in the ACR CT Accreditation program, then it is clear that the ACR phantom and the associated tolerance limits must be used. A Canadian CT facility must use the acceptance or tolerance limits provided in Safety Code 35: Radiation Protection in Radiology—Large Facilities (Health Canada, 2008).
ACR CT Accreditation QC Tests
These tests are described in detail by the ACR (2012) and by McCollough et al. (2004). As noted earlier in the chapter, the ACR CT Accreditation program requires the use of the ACR phantom and the following QC tests using the four modules that make up the phantom. These tests include CT number accuracy, slice thickness, light accuracy alignment, low-contrast resolution, CT number uniformity, and high-contrast resolution. The essential acceptance criteria for these tests are provided in Table 18-3.
Furthermore, CT number linearity and radiation dose must also be included in these tests. As described in Chapter 9, linearity refers to the relationship of CT numbers to the linear attenuation coefficients of the object to be imaged. The average CT numbers can also be plotted as a function of the attenuation coefficients of the phantom materials. The relationship should be a straight line (see Fig. 9-26) if the scanner is in good working order (Bushong, 2013). For radiation dose the CTDIvol should be measured and should be below the pass/fail criterion of 80 milligray (mGy) for the adult head protocol, 30 mGy for the adult abdomen protocol, and 25 mGy for the pediatric abdomen protocol (ACR, 2012; Papp, 2015; Wolbarst et al., 2013).
TABLE 18-3
Acceptance Criteria for the ACR CT Accreditation QC Tests Using the ACR Phantom

Data from ACR. (2012). 2012 computed tomography manual: radiologic technologists’ section. <http://www.acr.org/Quality-Safety/accreditation/CT> Accessed February 2015.
Visual Inspection
A visual inspection component of a CT QC program ensures that the integrity of radiation protection considerations, including patient safety concerns (ACR 2012; IAEA, 2012), is maintained. In general, a checklist of items should be used since it provides a good tool to record the status of the scanner components. While the ACR assigns this task to the technologist, the IAEA assigns this task to the medical physicist.
The ACR (2012) recommended that visual inspection be performed on a monthly basis and should include items such as the following:
1. Check the functioning of the table height indicator, the table position and angulation indicators, laser localization light, x-ray on indicator, exposure switch, door interlocks, control panel switches, lights and meters, and the intercom system.
2. Check high voltage and other cables for fraying.
3. Check the window width and window level display.
4. Check for the presence of warning labels and availability of all service records.
The IAEA (2012), on the other hand, suggested that the following items be evaluated:
1. Scan protocol book
2. Items (such as QC tests performed and corrective action taken) in the quality control log book are well documented for currency
3. Cleanliness of the scanner room
4. Door of the scanner room operates properly
5. Radiation protection lead shields are available
6. Emergency equipment is available
7. Window between operator’s room and scanner room provides clear view of patient (no clutter on the window)
8. Image headers are correct, including patient identification, date, and time
9. Written radiation safety procedures up to date
10. Staff (including radiologists) understands and follows radiation safety procedures (IAEA, 2012)
Artifact Evaluation
The ACR also requires the CT technologist to be able to identify and correct image artifacts from a water phantom, on a daily basis. These artifacts include both linear streak and ring artifacts (see Chapter 9).
Proposed QC Tests
There are 18 QC tests described below ranging from CT number calibration, standard deviation of CT number in water, high-contrast resolution, low-contrast resolution, accuracy of distance-measuring device, uniformity or flatness of CT number, hard copy output, accuracy of localization device, CT bed indexing and CT bed backlash, and light field accuracy to pitch and slice width (spiral/helical scanner), CT number versus patient position, CT number versus patient size, CT number versus algorithm, CT number versus slice width, noise characteristics, and radiation scatter and leakage. Each of these is described next. It is important to note that since the use of film has become obsolete, computed radiography (CR) cassettes can be used in the tests that mention the use of film.
• TEST 1: Average CT number of the water (CT number calibration)
Phantom or equipment: A simple water-filled cylindrical plastic container approximately 20 cm in diameter. Commercial phantoms are available for this test and are often provided by the CT manufacturer, but some institutions have used 1-gallon plastic containers from liquid laundry bleach. The bleach, of course, is replaced with water.
Measurement: Take an axial scan through the water phantom at the usual technique. Reconstruct the image of the water phantom. Examine the region of interest (ROI) feature available on the imaging monitor of most scanners to verify that the scanner can measure the average of the CT numbers of the pixels inside the ROI. Enlarge the ROI area to include an area of about 2 to 3 cm2 (or about 200 to 300 pixels). Position the ROI near the center of the phantom image and measure the average CT number (Fig. 18-4).
Two media that serve as calibration points for CT numbers are water and air. Occasionally (e.g., once a month), move the ROI outside the phantom into the region of the image that is known to contain air. Check the average CT number of air. It should be −1000 if the CT scanner is calibrated properly.
Expected results: The average CT number of water should be very close to zero.
Possible causes of failure: Miscalibration of the algorithm that generates the CT number. If a recalibration does not help, notify the service person. Usually the manufacturer provides a procedure to recalibrate the CT number scale.
Frequency: This should be performed at the time of installation as part of acceptance test and daily thereafter.
• TEST 2: Standard deviation of computed tomography number in water
Phantom or equipment: A simple water-filled cylindrical plastic container about 20 cm in diameter (the same phantom used in Test 1).
Expected results: Typical values are in the range of two to seven CT numbers. The actual value will depend on the dose at the location of the ROI, which depends on the kVp, mA, scan duration, slice width, and phantom size. The standard deviation of the CT number also depends on the type of reconstruction algorithm (can be higher with sharp algorithm compared with smooth algorithm) and the position of the ROI (slightly smaller at the edge of the phantom compared with the center). Ensure that the technique is the same each day and that the standard deviation is measured at the same place each time (e.g., the center of the phantom).

FIGURE 18-4 CT scanner image of a uniform water phantom. The ROI is placed in the center of the water-filled phantom to measure the average CT number and the standard deviation of the CT numbers inside the ROI. In this case, the average or “mean” CT number measures −36.3, which is not acceptable.
Acceptance limits: Ideally, the standard deviation should be very small. The actual acceptance limits must be determined by examination of past measurements that were presumably performed when the performance of the CT scanner was good. The technique must stay the same for this measurement from day to day. If the standard deviation starts to increase, this indicates a “noisier” image with more variation in pixel-to-pixel CT numbers and poorer low-contrast resolution.
Possible causes of failure: Something is causing a noisier image, such as decreased dose (x-ray tube output) or increased electronic noise of the x-ray detectors, amplifiers, or analog-to-digital (A/D) converters. Notify the service person.
Frequency: This should be performed at the time of installation as part of the acceptance test and daily thereafter.
• TEST 3: High-contrast resolution
Phantom or equipment: High-contrast (contrast difference of 10% or greater) resolution pattern in an imaging phantom. Although a variety of patterns are available to perform high-contrast tests, including patterns for generating modulation transfer function measurements, a quick and easy test pattern is most suitable for QC tests. One such pattern consists of a series of rows of holes drilled in plastic (Fig. 18-5). Each row contains a set of holes (usually five) of constant diameter with the centers of the holes two diameters apart. The holes decrease in size from one row to the next. If the holes are drilled in acrylic and filled with water, the contrast is about 20%. If the holes are filled with air, the contrast is about 100%. Either filling is satisfactory. Another pattern consists of eight aluminum bar patterns (4 to 12 lp/cm) embedded in a tissue equivalent material.

FIGURE 18-5 Hole pattern for a high-contrast phantom test object. The test pattern consists of rows of holes of various sizes drilled in plastic. Each row contains five holes of the same diameter. In a row of constant sizes, the holes are separated by two diameters from center to center.

FIGURE 18-6 CT image of the high-contrast test pattern shown in Figure 18-5. The CT scanner is judged by the smallest row in which all five holes can be seen (arrow).
Measurement: On the axial CT image (Fig. 18-6), determine the smallest row of holes in which all holes can be clearly seen. The smaller the holes that can be clearly seen, the better the performance of the CT scanner. Be certain that all holes can be seen in the image. Sometimes it appears that one fewer hole is seen in the row than is actually in the phantom. This is usually a phase-reversal phenomenon and should not be counted as a complete set of holes. On the other hand, the bar pattern where the bars and spaces are distinctly visualized indicates the level of high-contrast resolution.
Expected results: Most modern CT scanners have a high-contrast resolving power slightly smaller than 1 millimeter (mm) by using a typical head image technique. Therefore, they will be able to visualize a complete set of holes in some of the rows in the range of 0.75 to 1.0 mm. With the highest resolution technique available to a particular scanner, some CT scanner manufacturers claim to be able to visualize holes as small as 0.25 mm.
Acceptance limits: This baseline number should be established at the time of the acceptance test when the CT scanner is working well by scanning the phantom and noting the smallest set of holes that can be seen. This initial measurement becomes the baseline for future tests. Subsequent tests can be compared with this baseline. Alternatively, the manufacturer’s specifications for this test can be used to verify that the performance of the CT scanner is at least as good as the specifications.
Possible causes of failure: Enlarged focal spot in the x-ray tube, excessive mechanical wear in the motion of the gantry, mechanical misalignments or poor registration of electromechanical components, vibrations, or detector failures. If the resolution has degraded from the baseline, inform the service person.
Frequency: This should be performed at the time of installation as part of the acceptance test and biannually thereafter.
• TEST 4: Low-contrast resolution
Phantom or equipment: Low-contrast resolution pattern in imaging phantom. A quick and easy test pattern of low-contrast test objects consists of a series of holes (2 to 8 mm diameter) drilled in polystyrene. The holes are filled with liquid (often water) to which has been added a small amount of some other material (usually methanol or sucrose) to bring the liquid’s CT number close (about 0.5% different) to that of the plastic itself. One such pattern (Fig. 18-7) consists of a series of rows of holes drilled in relatively thick plastic. Each row contains holes of a constant diameter. The holes decrease in size from one row to the next. In a CT image, the holes appear to have a density similar to their surround (i.e., the holes have low contrast).
Another technique is to use partial volume averaging by making the plastic very thin (e.g., a plastic membrane). Low contrast in the image is achieved by a different principle than the solid plastic type of low-contrast phantom. The membrane type of phantom consists of a thin membrane containing a pattern of holes (the same pattern shown in Fig. 18-7). The membrane is stretched across a plane of the phantom and is then immersed in water. The CT x-ray beam, as visualized from its edge (Fig. 18-8), strikes mostly water. But a small fraction of the beam is absorbed by the plastic, forming a faint (low-contrast) image of the hole pattern. By varying the thickness of the plastic relative to the width of the x-ray beam, the contrast can be varied.

FIGURE 18-7 “Solid plastic” type of low-contrast phantom test object that consists of a pattern of holes (face view) drilled in a piece of plastic with the holes filled with liquid. The low-contrast aspect of this test object is achieved by adjusting the absorption characteristics of the water solution to nearly match (about 0.5% difference) the absorption of the plastic.
In both techniques, the contrast of the object is difficult to calculate. In QC testing, it is sufficient that the contrast be constant between tests. The contrast should be selected so that the standard test image shows about 50% of the holes. At that level of hole imaging, a decrease in low-contrast imaging performance will result in the visualization of fewer rows of holes.
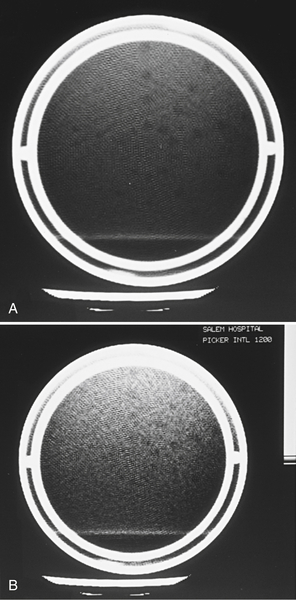
Measurement: On the CT image, determine the smallest row of holes in which all holes can be clearly seen. The smaller the holes that can be seen at a particular technique, the better the performance of the CT scanner. A sample of a “low-noise” (high-dose) image and a “high-noise” (low-dose) image is shown in Figure 18-9. In the low-noise image, more sets of smaller objects can be seen.
Expected results: The smallest holes that can be imaged by modern CT scanners should be 4 to 5 mm in diameter or smaller for 0.5% contrast objects. Perhaps more important, the minimum size of holes visualized should not increase over the life of the scanner.

FIGURE 18-8 Edge view of a membrane of partial-volume type of low-contrast test object. The presence of the thin membrane alters the absorption characteristics very slightly wherever there is membrane. Where the membrane is not present (i.e., in the holes), just water is absorbed. The slight difference in absorption characteristics between the water and the water-plus-membrane combination produce a low-contrast test pattern that appears as the hole pattern in the membrane.
Acceptance limits: The number of holes that can be visualized varies widely between techniques. For example, if a partial volume phantom is used, the apparent contrast of the object depends on the thickness of the membrane and the slice width of the image. In addition, an increase in mA value of the scan technique will usually reduce the noise in the image and will permit smaller holes to be visualized. Therefore a baseline scan at a chosen technique (usually a commonly used head technique) performed when the scanner is functioning well can serve as baseline against which future images can be compared. This technique, once chosen, should not be changed from day to day.
A smoothing algorithm filter can also reduce the apparent statistical fluctuations between pixels. These algorithms produce images with smaller standard deviations and usually permit visualization of smaller low-contrast objects by sacrificing some high-contrast resolution. Therefore it is important to always use the same reconstruction algorithm to compare repeated results from this test.
Possible causes of failure: A higher noise level in the image usually causes reduced low-contrast resolution. Some possible sources of increased noise are decreased dose, decreased mA values, or any other factor that will reduce the x-ray tube output, such as a tungsten coating build-up on the inside of older x-ray tubes. Increased electronic noise is also possible and may arise from noise in the x-ray detectors, amplifiers, or A/D converters. The service person should be informed of decreasing low-contrast resolution and asked to perform further diagnosis.
Frequency: This should be performed at the time of installation as part of the acceptance test and biannually thereafter.
• TEST 5: Accuracy of distance-measuring device
Phantom or equipment: An object with two or more small objects (this is a part of ACR phantom) that have a precisely known spatial relationship (i.e., the distance between them is precisely known). One such object is a large “+” pattern of small holes in a plastic phantom (Fig. 18-10). The holes are precisely 1 cm apart, and the size of the “+” is large enough to fill most of the image.
Some institutions have used an image of a regular square grid that covers most of the field of view. One source of square grids is a type of fluorescent light fixture that uses square grid light diffusers made of plastic with a square spacing of about 0.5 inch (12 mm). With a moderate amount of effort, the grids can be cut to fit inside a phantom or scanned in air (no phantom).
Measurement: With use of the distance-measuring feature available on the video monitors of most scanners, measure the distance between two well-visualized holes near the periphery of the phantom, one near the top and one near the bottom (Fig. 18-11). Repeat the measurement between two holes, moving right to left. If required, a diagonal measurement between two holes can be made and the true distance can be calculated by the Pythagorean Theorem.

FIGURE 18-10 A pattern of holes to measure image distortion. The pattern consists of a series of holes arranged in a “++” pattern that spans the diameter of the phantom. The holes are exactly 1 cm apart.
Expected results: The distance indicated by the CT scanner should agree with the true distance as determined by counting the spaces between the two holes.
Acceptance limits: Disagreement of 1 mm or less is good. Disagreement of greater than 2 mm should be corrected.
Possible causes of failure: Reconstruction algorithm may be improperly calibrated. If the manufacturer has not provided the user with a means to recalibrate the algorithm, a service person should be notified.
Frequency: This should be performed at the time of installation and annually thereafter.
• TEST 6: Uniformity or flatness of CT number
Phantom or equipment: A simple cylindrical plastic container about 20 cm in diameter (the same phantom used for Test 1).
Measurement: Using the ROI feature available on most CT scanners, measure the CT number of water near the top, bottom, right, and left of the phantom (Fig. 18-12). Use an ROI large enough to cover an area of 200 to 300 pixels. Compare with the measurement in Test 1.
Expected results: Ideally, the CT number of water will be zero at all points in the phantom.
Acceptance limits: If the CT number anywhere in the phantom differs by more than five CT numbers from the average CT number collected from all measurements, then the CT image does not have a uniform or flat image. If the CT number is high in the center and low near the perimeter of the phantom, the image exhibits capping. A low value in the center relative to the edges exhibits cupping.

FIGURE 18-11 Testing the distance-measuring device by measuring the distance between two holes separated by a precisely known distance. In this case the measured distance (Dist) between two holes spaced 16 cm apart is 160 mm (perfect).
Possible causes of failure: Often capping and cupping are the result of the hardening of the x-ray beam as it penetrates the phantom. Near the edges of the phantom, the x-ray beam does not penetrate as much phantom material, and the beam is softer (i.e., it has a lower average energy). To arrive at the center, the x rays must penetrate more phantom material and are harder near the center of the phantom. Because the effective energy of the x rays determines the absorption characteristics of the x rays, the absorption characteristics of water change slightly from center to edge in the phantom. Because the CT number is calculated from the number of x rays absorbed, slight differences in CT number may indicate differences of the average energy of the x-ray beam at various points in the phantom. Some CT scanners have software corrections built into the algorithm that compensate for these x-ray beam-hardening effects, and these corrections sometimes overcompensate or undercompensate for the beam hardening. The service person may be able to adjust the algorithm to compensate for an unflat image.

FIGURE 18-12 Use several ROIs to measure flatness. In a homogeneous water phantom, the CT number should measure zero at any location in the phantom. In these images, the CT number at the top measures −16.9 and the rest of the image has values in the range of −37 to −47. This image is unacceptable because it is not “flat.”
• TEST 7: Hard copy output
Phantom or equipment: A stepped grayscale image generated by the computer such as Society of Motion Picture and Television Engineers (SMPTE) pattern and a film densitometer.
Measurement: Display the SMPTE pattern on the display monitor. Adjust the display contrast so that both 95% and 100% patches are clearly separated. The 5% patch should just be visible inside of the 0% patch. The area of the 0% patch should be almost black. The 95% patch should be visible inside the 100% patch. Print the image and display on a viewbox to ensure the visibility of the 5% and 95% patch (McCollough et al., 2004; Fig. 18-13).
Expected results: The same image should be reproduced with a the hard copy device each time the image is recorded.
Acceptance limits: If the hard copy image is unable to display both 5% and 95% patches, examine the display setting and also the printer setting. If the condition still exists, then investigate further with a service person to reset the hard copy printer settings.
Possible causes of failure: Most frequently, drifts in the optical density of films from the camera can be traced to problems in the film processing. However, if the processor has been eliminated as a source of the problem, then the camera must be assumed to be the errant instrument. Sometimes the video monitor, laser, or other light device used to expose the film has changed its output. In this case a service person should be called for repairs.

FIGURE 18-13 SMPTE image for checking hard copy output. A film image of this pattern is processed and visualized to examine the visibility of 5% and 95% squares. (From Carter, C. E., & Veale, B. L. (2008). Digital radiography and PACS. St. Louis, MO: Mosby/Elsevier.)
Frequency: This should be performed at the time of installation as part of the acceptance test and annually thereafter.
• TEST 8: Accuracy of localization device
Phantom or equipment: A test object with a target that can be aimed for in the localization image and a gauge that indicates how far the resulting CT images fall from the target. One example of this phantom is a set of two small holes drilled in plastic that are perpendicular to each other but at 45 degrees to the plane of the image. A cross-sectional drawing of the device is shown in Figure 18-14. The two holes are offset slightly and do not intersect. The localization target is centered on the point where the two holes appear to intersect in the localization image, and a scan is performed. After the CT image is reconstructed, the holes should appear directly opposite each other with perfect alignment between the holes. If there is offset in the holes, the scan is not being performed where the localization image shows it to be.

FIGURE 18-14 Target pattern to test localization device. After this section is imaged with the localization image, the CT image is targeted directly on the spot where the two holes tilted 45 degrees to the scan plane appear to cross. Then a scan is performed and an image at the targeted location is reconstructed. In the image, the relative location of the two slanted holes indicates the position of the scan relative to the target.
Measurement: Image the phantom by using the localization device (sometimes called a scout or targeting image). With this localization image, set up the scanner to make a single scan at a certain thickness so that the center of the scan is directly on the intersection of the holes. Make a scan and reconstruct the image. At the very least, both holes should appear in the CT image. If they do not, then the localization device is so poorly adjusted that the width of the x-ray beam does not intersect the plastic section in which the holes are drilled. If the localization device is working properly, the image of the two holes should appear exactly side by side (Fig. 18-15). If the holes are not aligned, then the center of the slice is off target. The distance that the center of the CT image is located from its targeted position (the intersection of the holes) can be quantified by measuring the amount of offset of the two holes in the image. By using the distance-measuring device on the video monitor (the measurement can be made with a ruler on the video monitor or on the hard copy image if there is no distortion in these devices and if appropriate compensation for the magnification of the image is made), measure the distance from the tip of one hole to the tip of the other hole (Fig. 18-16). The distance that the center of the CT slice is from the targeted location is equal to the length L.

FIGURE 18-15 Example of CT slice centered on the spot where the holes appear to cross. If the two holes are aligned as shown, the localization feature is on target.

FIGURE 18-16 Measurement of L for slice localization accuracy. If the two holes appear offset in the image, the error in the localization feature can be determined by measuring the offset of the lines L.
Repeat the test at other slice widths.
Note that the lengths of the holes on the image, measured from end to end, are a direct measurement of the width of the CT slice. See Test 12 for a more thorough description of why this is so.
Expected results: In the ideal case, the holes should be exactly aligned.
Acceptance limits: If the measured value of L is 3 mm or greater, the localization device is out of adjustment and a service person should be called.
Possible causes of failure: Miscalibration of the patient bed-positioning mechanisms is usually the cause, although a software problem is also possible.
Frequency: This should be performed at the time of installation as part of acceptance test and annually thereafter.
• TEST 9: Bed indexing
Phantom or equipment: A single piece of x-ray film or a Computed Radiography (CR) cassetteA 10 × 12-inch “Ready-pak” film (Kodak) works particularly well.
Measurement: The x-ray film is taped to the patient table; the length of the film is parallel to the length of the bed. The scanner is programmed to perform a series of 10 to 12 scans; each scan is 10 mm from the preceding scan with the slice width set to the smallest width available (less than 5 mm). The bed is loaded with at least 100 pounds (50 kilograms [kg]) of material to simulate the weight of a patient. When the scan is initiated, the x-ray beam exposes a series of narrow bands on the film (Fig. 18-17). With a ruler, measure the distance between the bands to determine how much the film (and bed) has moved between each scan.

FIGURE 18-17 Measurement of bed indexing from an exposed x-ray film. The series of dark lines on the film are produced by several scans through a piece of x-ray film, moving the bed after each scan. The distance between the lines (B) is a measure of the distance that the patient bed has moved between scans.
Expected results: The distance from center to center of the exposed bands on the film is expected to be 10 mm, or whatever the scan spacing was chosen to be.
Acceptance limits: A series of 10 scans (nine interscan spacings) should create a series of exposed bands exactly 90 mm from the first to the last band. If the measured length of this band distance differs by more than 1 mm, the bed movement is not accurate and a service person should be notified.
Possible causes of failure: Excessive slippage in the bed drive mechanism or miscalibration of the bed position indicators. Notify a service person.
Frequency: This should be performed at the time of installation as part of the acceptance test and annually thereafter.
• TEST 10: Bed backlash
Phantom or equipment: Two small lengths of masking tape, a pencil, and a ruler.
Measurement: The patient bed is loaded with at least 100 pounds (50 kg) of material to simulate the weight of a patient. The bed is moved to a convenient location to serve as a zero point. Two strips of masking tape are placed adjacent to each other, one on the edge of the movable part of the bed, the other on a part of the bed that does not move (Fig. 18-18). A pencil mark is placed on each piece of tape so that the two marks are exactly opposite each other. The CT scanner is programmed to move the bed automatically about 150 to 200 mm in 10- or 20-mm increments in one direction (for example, bed into scanner), and then return to its original (zero) starting location. After all the motions, the mark on the moving bed should return to its original position opposite the stationary mark. A measurement of the distance between the two marks indicates if there are mechanical discrepancies (“backlash”) in the patient bed.

FIGURE 18-18 Two strips of tape on the bed to determine bed backlash for both the moveable and stationary parts of the bed. The two pencil marks opposite each other define the starting or zero location of the bed.
This measurement should be repeated driving the bed in the opposite direction as the first test.
If there is a position readout on the bed, the readout should be tested by driving the bed in and out about 200 to 300 mm and then returning the bed to its original position, as determined by the readout. Again, the marks on the tape should align if there is no backlash.
Expected results: The marks on the two pieces of tape should always align when the bed is returned to its starting (zero) location.
Acceptance limits: If the bed does not return to its starting position within 1 mm, then a service person should be notified.
Possible causes of failure: Various types of mechanical backlash in the gears, belts, and pulleys driving the table, or slippage of the sensors that indicate the position of the bed. A service person can usually adjust the bed drive mechanism to eliminate this problem.
Frequency: This should be performed at the time of installation as part of the acceptance test and annually thereafter.
• TEST 11: Light field accuracy
Phantom or equipment: A piece of x-ray film or a CR cassette. The same piece of film used for Test 9 can be used for this test.
Measurement: Tape a sheet of Ready-pak film to the patient bed. Raise the patient bed so that the film is approximately centered (vertically) in the gantry opening. Turn on the external or internal light field (some CT scanners use a laser beam) that indicates the location of the first scan. With a needle or other sharp object (e.g., a penknife), poke two very small holes through the paper wrapper of the film and into the film (Fig. 18-19). The two holes should be exactly on top of the light field, with one hole near the left edge of the film and the other on the right edge. These holes, which will be visible after the film is processed, will indicate the location of the light field.
If an external light field was used, move the bed into position for the first scan. Make a medium-technique scan with the slice width set to the minimal width. The radiation should produce a narrow dark band on the film that indicates where the radiation struck the film. Process the film and examine the location of the dark band relative to the two pinholes.
Expected results: If the light field is correctly centered on the radiation field, which is also the position of the image, the dark exposed band caused by the radiation should be centered on both pinholes.
Acceptance limits: The light field should be coincident with (i.e., on top of) the radiation field to within 2 mm.
Possible causes of failure: Often the optical field light system is out of alignment. Less frequently, the x-ray tube may have been installed off center. Notify your service person.
Frequency: This should be performed at the time of installation as part of the acceptance test and annually thereafter.
• TEST 12: Pitch and slice width (spiral/helical scanner)
Note: A single test may be used to determine both the slice width and pitch of spiral/helical CT scanners. For a CT scanner with a single array of detectors, the pitch is defined as the ratio of bed movement (mm) that occurs during one complete revolution to the slice width (mm). For CT scanners with a single array of detectors, the slice width is determined by collimator spacing.
In the case of CT scanners with multidetector arrays that enable several slices of data to be acquired simultaneously, the definition of pitch must be clarified. In these multidetector cases the IEC definition (Pitch (P) = Distance the table travels per rotation (d)/Total collimation (W)) would apply.

FIGURE 18-19 Marking the light field position on film with a needle. Two small holes are poked into the film at the center of the light field. The film is then scanned (exposed) with a narrow beam slice to produce a darkened stripe of the film where the radiation field hit the beam. The needle marks indicate the location of the light field. The position of the light field and the radiation field should coincide.
Phantom or equipment: A phantom with a small diameter wire, several centimeters long, placed in the center of the scan plane at 45 degrees to the scan plane. This test involves several adjacent scans, which may be either single scans separated by bed indexing between scans or, if the scanner is capable of spiral/helical scanning, several revolutions of the x-ray tube while the bed moves several centimeters.
Do not rely on the measurement of the width of the radiation bands on the film to determine the slice width.
Measurement: For an axial scanner, set up the scanner to perform a series of five or six single scans with a constant bed indexing between the scans. Analysis of this test is easier if the slice width is selected to be the same as the bed indexing (e.g., set the bed indexing = slice width = 10 mm). For spiral/helical scans from a single array CT scanner, set the bed index the same as the slice width (pitch = 1). For a multidetector CT scanner, set the bed indexing equal to the slice width multiplied by the number of detector arrays used. Perform the scans of the wire and reconstruct the images. For spiral/helical scans, make sure that the data from the same 360-degree arc are used to reconstruct each image. To measure the slice width, use the distance-measuring device on the reconstructed image. Measure the length of the wire visible on the image. When the wire is oriented at 45 degrees to the incoming radiation beam, the projection of the wire onto the CT image is the same length as the width of the x-ray beam that strikes the wire (Fig. 18-20, A).
From this same set of images, the slice overlap or gap may be determined. To do this, overlay any two adjacent images, electronically if possible. If the images cannot be added electronically (some scanners do not have this feature), then make a film copy of the two images. Cut the adjacent images from the hard copy film and manually overlay them on a viewbox.
Expected results: First, the beam width measured from the image should agree with the set or nominal beam width by use of a technique similar to that described in Test 12. Next, examine the images for correct pitch by looking at the overlaid images. The image of the wires (inclined at 45 degrees) should appear in different positions in the two images. If the bed indexing is exactly the same as the slice width, the images of the wire segments should just touch at the two ends of the wire that are closest to each other. If the ends of the wire seem to overlap as shown in Figure 18-20, B, this indicates that the adjacent slices also overlap. If the two images of the wires do not touch at the ends as shown at the bottom of Figure 18-20, C, the adjacent slices also have a gap between them. Ideally, the ends of the wires will just touch. Either overlap or a gap indicates that the bed indexing is not the same as the slice width. If the bed-indexing test (Test 9) verifies the bed-indexing accuracy, then the slice width is usually at fault.
Acceptance limits: For slice widths 7 mm and greater, the measured slice width should agree with the nominal slice width to within 2 mm or less. The gap or overlap between adjacent slices should be less than 3 mm. Unfortunately, at narrower slice widths and bed-index settings, the discrepancy between nominal and measured often becomes greater and these values may be relaxed somewhat.
Possible causes of failure: Errors in beam width are usually caused by miscalibration of the mechanism (e.g., shutters or collimators) that collimates the portion of the x-ray beam reaching the detectors. Overlap or gaps in adjacent images or improper pitch settings may be caused by inaccuracies in the bed indexing (see Test 9) or more frequently, inaccuracy in the slice width setting. In either case, notify a service person.
Frequency: This should be performed at the time of installation as part of the acceptance test and annually thereafter.
• TEST 13: CT number versus patient position
Phantom or equipment: A simple cylindrical plastic container about 20 cm in diameter (the same phantom used for Test 1).
Measurement: At least five scans of the same phantom at the same technique are performed. However, the position of the phantom in the gantry should be changed for each scan. Place the phantom near the center of the gantry (use this image as the “standard”), top, bottom, and right and left sides. Set the ROI feature available on the video monitor to about 200 to 300 mm2 (or 200 to 300 pixels) and measure the average CT number of water at the center of the phantom (not the center of the image) in each image.
Expected results: The average CT number of water should always be zero, independent of the position of the phantom in the CT scanner.
Acceptance limits: If the average CT number varies by more than five CT numbers from the CT number at the center of the CT scanner, there may be a problem with the symmetry of the CT scanner.

FIGURE 18-20 A, A several centimeters long (e.g., 10 cm) piece of wire stretched 45 degrees diagonally across a plastic frame serves as an object that projects the beam width directly to the CT scanner image. B, Overlaying the images from adjacent slices allows a comparison of the relative location of the adjacent slices. If adjacent slices overlap, the ends of the wire on the overlaid images will also overlap. C, If the adjacent slices are too far apart, a gap will appear in the overlaid images.

FIGURE 18-21 Water phantoms of several diameters. A selection of water phantom sizes is used to test whether the CT number of water changes as the phantom (patient) size changes.
Frequency: This should be performed at the time of installation as part of the acceptance test and annually thereafter.
• TEST 14: CT number versus patient size
Phantom or equipment: Three or four water-filled phantoms, each of different diameters (Fig. 18-21). Typical diameters are 30 cm (body), 20 cm (adult head), and 15 cm (pediatric head). Figure 18-21 also shows a very small phantom (8 cm in diameter) that models extremities.
Measurement: A scan of each phantom size at the same technique is performed. The size of the phantoms should cover the sizes of the anatomy used clinically. For each CT scan, set the CT scanner field of view just large enough to view the entire phantom. Set the ROI feature available on the video monitor to about 200 to 300 mm2 (or 200 to 300 pixels) and measure the average CT number of water at the center of each phantom image.
Expected results: The average CT number of water should always be zero, independent of the size of the phantom.
Acceptance limits: The average CT number of water should vary no more than 20 CT numbers from the smallest to the largest phantom.
Possible causes of failure: Some CT scanners have electronic circuitry that compensates for the wide range of x-ray intensities that activates the detectors. The intensity of the x-ray signal depends on the amount of tissue that the x rays penetrate before they strike the detector. Improper compensation for the number of x rays that reach the detector may cause the calibration of CT for water and other materials to shift from the ideal value. A service person is usually required to trace the problem.
Frequency: This should be performed at the time of installation as part of the acceptance test and annually thereafter.
• TEST 15: CT number versus algorithm
Phantom or equipment: A simple cylindrical plastic container about 20 cm in diameter (the same phantom used for Test 1).
Measurement: Perform a single scan of the phantom. If possible, use the same raw data to construct the image several times, each time using a different reconstruction algorithm or filter. If it is not possible to use the same data for several reconstructions, rescan the phantom using a different algorithm for each image.
Expected results: The average CT number of water should always be zero, independent of the type of algorithm used to reconstruct the image.
Acceptance limits: The average CT number should vary no more than three CT numbers from one algorithm to the next.
Possible causes of failure: Miscalibration of the algorithm. If a recalibration of the CT scanner does not remedy the problem, a service person should be notified.
Frequency: This should be performed at the time of installation as part of the acceptance test and annually thereafter.
• TEST 16: CT number versus slice width
Phantom or equipment: A simple cylindrical plastic container about 20 cm in diameter (the same phantom used for Test 1).
Measurement: A few scans of the water phantom are performed at the same technique; however, the nominal slice width is changed between each scan. The slice widths used should cover the sizes of slice widths used clinically. Set the ROI feature available on the video monitor to about 200 to 300 mm2 (or 200 to 300 pixels) and measure the average CT number of water at the center of each phantom image.
Expected results: The average CT number of water should always be zero, independent of the slice width.
Possible causes of failure: Miscalibration of the electronic detection circuitry or algorithm, especially the part that compensates for changes in x-ray intensity striking the detectors. Notify the service person.
Frequency: This should be performed at the time of installation as part of the acceptance test and annually thereafter.
• TEST 17: Noise characteristics
Phantom or equipment: A simple cylindrical plastic container about 20 cm in diameter (the same phantom used for Test 1).
Measurement: A few scans of the water phantom are performed at different mAs and different slice widths, with all other parameters constant. The settings should start at the smallest mA value available and fast scans (low mAs) and increase to the highest mA value and slow scans (high mAs). Set the ROI feature available on the video monitor to about 200 to 300 mm2 (or 200 to 300 pixels) and measure the standard deviation (not the average) of the CT number of water at the center of each phantom image.
Expected results: The noise in the image is proportional to the standard deviation of the CT number measured in a homogeneous medium (water). Generally, the standard deviation of the CT numbers in the ROI (σ) should decrease as the mA values and slice width are increased, keeping all other parameters constant (Brooks & Di Chiro, 1976). At lower mA values, the dependence is σ ∞ (mA • Slice width) − 1/2.
The low mA region is called the photon noise region and is statistical in nature. On a sheet of graph paper, plot the standard deviation versus (mAs × Slice width) − 1/2 (Fig. 18-22). As the mA value is increased, the standard deviation will decrease; eventually the image noise will not be limited by the number of photons. At that point, the noise will become more or less constant and characteristic of the inherent electronic noise of the CT scanner.
Acceptance limits: The noise curve that was obtained when the CT scanner was new should not change appreciably with age. Be especially sensitive to increased standard deviation as the CT scanner ages in the high mA portion of the curve, in which the noise is dominated by electronic components.
Possible causes of failure: Anything that can cause the noise of the system to change, such as changed sensitivity of the detectors, increased noise in the detector amplification circuits, or reduced photon output per mA. Notify the service person.

FIGURE 18-22 Standard deviation of CT number (Noise versus mA × slice width) − 1/2. The noise decreases gradually in the photon noise (low-dose) region and assumes an approximately constant value at high-dose levels. In the high-dose region, the noise is mostly inherent electronic noise that cannot be easily reduced.
Frequency: This should be performed at the time of installation as part of the acceptance test and annually thereafter.
• TEST 18: Radiation scatter and leakage
Phantom or equipment: An integrating or total exposure/dose survey meter (Geiger counter) or large volume ion chamber and a head-size water phantom. An integrating exposure meter is essential for these measurements. A simple dose-rate meter is not very satisfactory because of the wide variation in dose received as the CT gantry rotates.
Measurement: Insert the head phantom into the scan plane to provide radiation scatter for the measurements. Put on a lead apron normally used for fluoroscopic procedures. Position the radiation detector at the location where the radiation measurement will be performed, and initiate a scan. It may be helpful to have a colleague initiate the scan during these measurements. Measure the total radiation emitted at that location per one complete scan. Repeat the measurements for several locations, paying particular attention to locations where attending personnel might stand during a scan. To determine an attendant’s total radiation dose, simply multiply the number of attending scans by the dose per scan at the attendant’s location during the scans.
Expected results: The results will vary according to location and distance from the scanner. Usually, the highest exposure rate will be next to the patient and close to the scanner (Fig. 18-23).
Acceptance limits: None.
Possible causes of failure: If the exposure rate is exceedingly high (>25 milliroentgens per scan), there may be a problem with the collimation system or the x-ray tube shielding. In that case, notify the service person.
