Digital Image Characteristics, Receptors, and Image Acquisition
OBJECTIVES
- 1. Define all the key terms in this chapter.
- 2. State all the important relationships in this chapter.
- 3. Compare and contrast the attributes of a digital image.
- 4. Explain the digital characteristics of matrix and pixels.
- 5. Recognize the relationship among pixel size, display field of view, and matrix size.
- 6. State the relationship between spatial frequency and spatial resolution.
- 7. Explain the importance of dynamic range and exposure latitude in exposure technique selection, image quality, and patient exposure.
- 8. Define modulation transfer function and detective quantum efficiency and explain their relationship to digital image quality.
- 9. Define signal-to-noise ratio and explain its importance to digital image quality.
- 10. Define contrast-to-noise ratio and explain its importance to digital image quality.
- 11. Differentiate between computed radiography (CR) and direct radiography image receptors (IRs) in acquiring the digital image.
- 12. Explain the importance of sampling frequency in reproducing a quality digital image.
- 13. Describe how the size of a CR imaging plate can affect spatial resolution.
- 14. Recognize the differences between indirect and direct conversion digital IRs.
- 15. List quality control checks the radiographer can do to evaluate digital equipment performance.
KEY TERMS
air kerma; bit; bit depth; byte; cassette; charge-coupled device (CCD); complementary metal oxide semiconductor (CMOS); contrast resolution; contrast-to-noise ratio (CNR); CR fading; detective quantum efficiency (DQE); dose area product (DAP); dynamic range; exposure latitude; field of view (FOV); fill factor; flat-panel detectors (FPDs); grayscale; imaging plate (IP); kerma-area product (KAP); luminescence; matrix; modulation transfer function (MTF); Nyquist frequency; photostimulable luminescence; photostimulable phosphor (PSP); pixel density; pixel pitch; pixels; quantum noise; sampling frequency; sampling pitch; scintillator; signal-to-noise ratio (SNR); spatial frequency
During radiographic imaging, the radiation exiting a patient is composed of a range of intensities that reflect the absorption and transmission characteristics of the anatomic tissues. The image receptor (IR) receives the exit radiation and creates the latent or invisible image. The latent image is differently acquired depending on the type of IR. This chapter describes the digital image characteristics, common types of digital IRs used in radiography, and how the image is acquired.
DIGITAL IMAGE CHARACTERISTICS
In digital imaging, the latent image is stored as digital data, referred to as an electronic data set, and must be processed by a computer for viewing on a display monitor. Digital imaging can be accomplished using a specialized IR that can produce a computerized radiographic image. Two types of digital radiographic systems are in common use today: computed radiography (CR) and direct radiography (DR). Regardless of whether the imaging system is CR or DR, the computer can manipulate the radiographic image in various ways after the image has been digitally created.
Digital images are composed of numerical data that can be easily manipulated by a computer. When displayed on a computer monitor, there is tremendous flexibility in terms of altering the brightness and contrast of a digital image. The practical advantage of such capability is that regardless of the original exposure technique factors (within reason), any anatomic structure can be independently and well visualized. Computers can also perform various pre- and postprocessing image manipulations to further improve the visibility of the anatomic region.
A digital image is recorded as a matrix or combination of rows and columns (array) of small, usually square, “picture elements” called pixels. The size of a pixel is measured in microns (100 microns = 0.1 mm). Each pixel is recorded as a single numerical value, which is represented as a single brightness level on a display monitor. The location of the pixel within the image matrix corresponds to an area within the patient or volume of tissue (Fig. 4-1).
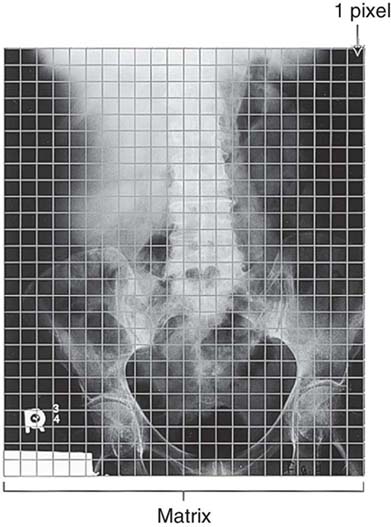
FIG. 4-1 Location of the pixel within the image matrix corresponds to an area within the patient or volume of tissue. Note: Pixel size is not to scale and is used for illustration only.
Given the dimensions of an anatomic area of interest, or field of view (FOV), a matrix size of 1024 × 1024 has 1,048,576 individual pixels; a matrix size of 2048 × 2048 has 4,194,304 pixels. Digital image quality is improved with a larger matrix size that includes a greater number of smaller pixels (Fig. 4-2 and Box 4-1). Although image quality is improved for a larger matrix size and smaller pixels, computer processing time, network transmission time, and digital storage space increase as the matrix size increases.
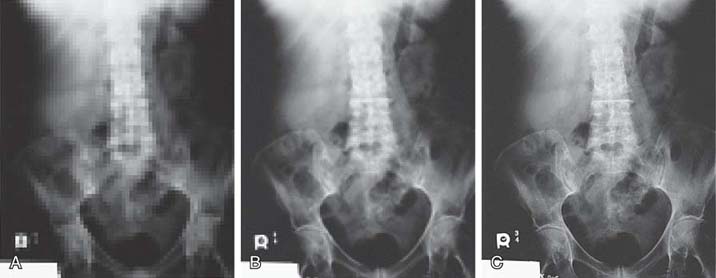
FIG. 4-2 For a given field of view (FOV), the larger the matrix size, the greater the number of smaller individual pixels. Increasing the number of pixels improves the quality of the image. A, Matrix size is 64 × 64. B, Matrix size is 215 × 215. C, Matrix size is 2048 × 2048.
There is a relationship among pixel size, displayed FOV (the dimensions of an anatomic area displayed on the computer monitor), and matrix size, as demonstrated in the following formula:

This relationship demonstrates that if the FOV displayed on the monitor is increased for a fixed matrix size, then the pixel size is also increased (direct relationship). However, if the matrix size is increased for a fixed FOV, then the pixel size is decreased (inverse relationship).
MATHEMATICAL APPLICATION
Pixel Size and FOV
FOV = 17 inches (431.8 mm) and matrix size = 1024:

If the FOV was decreased to 12 inches (304.8 mm) for the same matrix size of 1024:

Decreasing the displayed FOV for a given matrix size will decrease the size of the pixels and increase spatial resolution.
MATHEMATICAL APPLICATION
Pixel Size and Matrix Size
FOV = 17 inches (431.8 mm) and matrix size = 1024:

If the matrix size was increased to 2048 for the same FOV:

Increasing the matrix size for a given FOV displayed will decrease the size of the pixels and increase spatial resolution.
The numerical value assigned to each pixel is determined by the relative attenuation of x-rays passing through the corresponding volume of tissue. Pixels representing highly attenuating tissues (increased absorption) such as bone are assigned a different numerical value for higher brightness than pixels representing tissues of low x-ray attenuation (decreased absorption) (Fig. 4-3). Each pixel also has a bit depth, or number of bits (Box 4-2), that determines the amount of precision in digitizing the analog signal and therefore the number of shades of gray that can be displayed in the image. Bit depth is determined by an analog-to-digital converter (ADC), which is an integral component of every digital imaging system. Because the binary system is used, bit depth is expressed as 2 to the power of n, or the number of bits (2n). A larger bit depth allows a greater number of shades of gray to be displayed on a computer monitor. For example, a 12-bit depth (212) can display 4096 shades of gray, a 14-bit depth can display 16,384 shades of gray, and a 16-bit depth can display 65,536 shades of gray. A system that can digitize and display a greater number of shades of gray has better contrast resolution. An image with increased contrast resolution increases the visibility of anatomic details and the ability to distinguish among small anatomic areas of interest (Fig. 4-4).
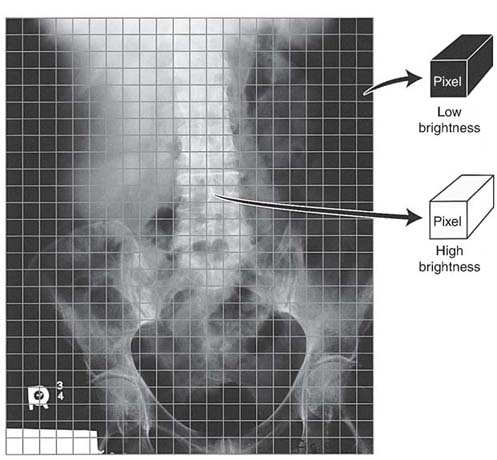
FIG. 4-3 Each pixel value represents a volume of tissue imaged.
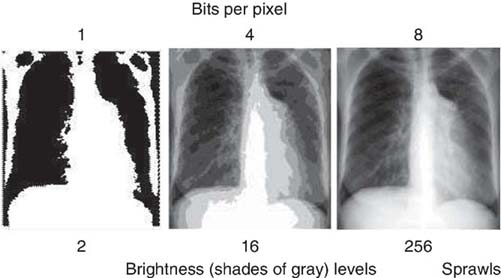
FIG. 4-4 Pixel bit depth determines the shades of gray displayed on the monitor. The greater the pixel bit a digital system can display, the greater is the contrast resolution displayed in the image. (From Sprawls P: The Physical Principles of Medical Imaging Online, ed 2, http://www.sprawls.org/ppmi2.)
A digital image is composed of discrete information in the form of pixels that display various shades of gray. As previously mentioned, the greater the number of pixels in an image matrix, the smaller is their size. An image consisting of a greater number of pixels per unit area, or pixel density, provides improved spatial resolution. In addition to its size, the pixel spacing, or distance measured from the center of a pixel to an adjacent pixel, determines the pixel pitch (Fig. 4-5). Smaller-sized pixels have decreased pixel pitch and improved spatial resolution.
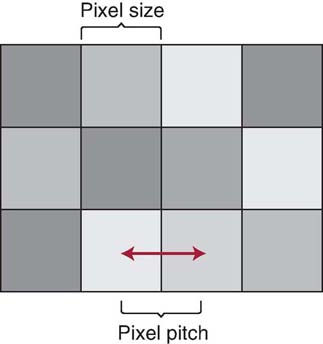
FIG. 4-5 The distance measured from the center of a pixel to an adjacent pixel determines the pixel pitch or spacing. (From Johnston JN, Fauber TL: Essentials of Radiographic Physics and Imaging, ed 3, St. Louis, 2020, Elsevier.)
Spatial Frequency and Spatial Resolution
Spatial resolution in digital imaging is primarily limited to the size of the pixel; however, when measuring an imaging system's ability to resolve small objects, it is important to understand the concept of spatial frequency and its relationship with spatial resolution. Spatial frequency can be defined by the unit of line pairs per millimeter (lp/mm). A resolution test pattern is a device used to record and measure line pairs (Fig. 4-6). Anatomic details are composed of large and small objects, and radiographic images display these details as variations from white to black brightness levels. Small objects have higher spatial frequency, and large objects have lower spatial frequency. It is more difficult to accurately image small anatomic objects (high spatial frequency) than to image large ones (low spatial frequency). An imaging system that can resolve a greater number of lp/mm (higher spatial frequency) has increased spatial resolution (Fig. 4-7). In digital imaging systems, the ability to resolve or demonstrate a specific spatial frequency is directly impacted by the size of the pixel. The images of the wrist (Fig. 4-8) demonstrate the impact that pixel size has on the spatial resolution visualized in an image.
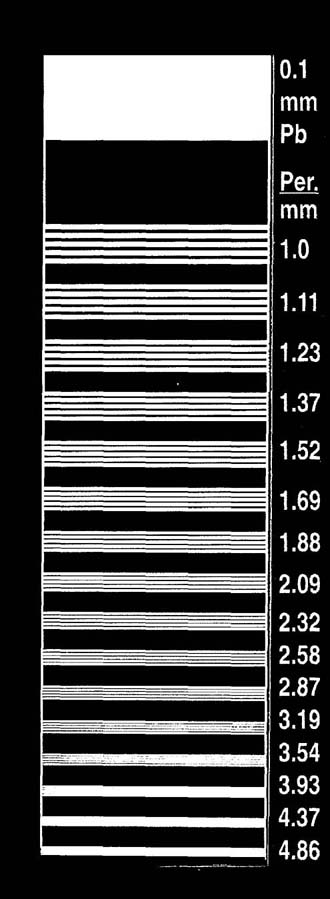
FIG. 4-6 A resolution test pattern will record and measure line pairs per millimeter. (Courtesy of Fluke Biomedical.)
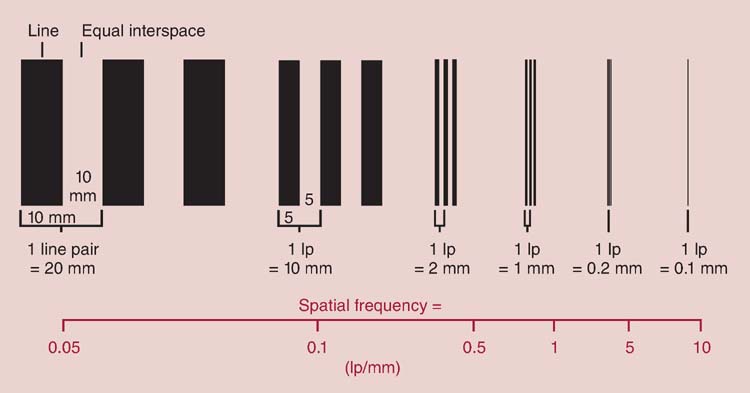
FIG. 4-7 A line pair is a high-contrast line separated by an interspace of equal width. The spatial frequency is shown for each of the line pairs. (From Bushong SC: Radiologic Science for Technologists, ed 10, St. Louis, 2013, Mosby.)
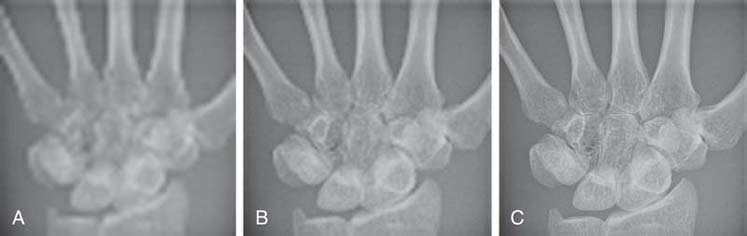
FIG. 4-8 Images showing how pixel size affects spatial resolution. A, Image with 20 pixels/cm; therefore, the pixel size is larger, and the spatial resolution is poor. B, Image with 40 pixels/cm. C, Image with 100 pixels/cm; therefore the pixel size is smaller than that in images A and B, and the spatial resolution is improved. (Courtesy of Andrew Woodward.)
Dynamic Range
The dynamic range of an imaging system refers to the ability of an IR to accurately capture the range of photon intensities that exit the patient. Digital IRs have a wide dynamic range (Fig. 4-9). In practical terms, this wide dynamic range means that a small degree of underexposure or overexposure would still result in diagnostic image quality. This characteristic of digital receptors is advantageous in situations where automatic exposure control (AEC) may not be available, such as in mobile radiography. However, radiographers must make considerable effort to select exposure techniques that produce diagnostic images without insufficient or excessive exposure to the IR. Although digital detectors have a wide dynamic range, exposure latitude refers to the range of exposures that should be used to produce a diagnostic image (see Fig. 4-9) and is likely established by the preferences or needs of the imaging department.
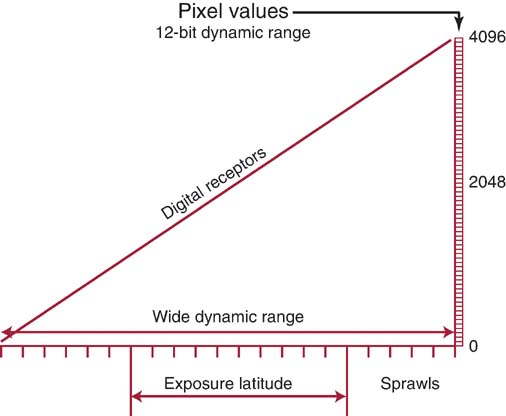
FIG. 4-9 The dynamic range of an imaging system refers to the ability of an image receptor to accurately capture the range of photon intensities exiting the patient. Exposure latitude is the range of exposures to produce a diagnostic image without under- or overexposure. (Modified from Sprawls P: Physical Principles of Medical Imaging Online, http://www.sprawls.org/resources.)
During digitization of the image, a numerical value (bit depth) is assigned to the pixel that represents an x-ray intensity based on the attenuation characteristics of that volume of tissue. A larger pixel bit depth means the image displayed has a wide grayscale, and this illustrates the wide dynamic range of the digital detector. As noted in Fig. 4-9, the digital IR can accurately capture more than 4000 x-ray intensities exiting the patient. To display that range of brightness levels (grayscale), the pixel bit depth is 12. If the digital IR is able to capture over 16,000 x-ray intensities exiting the patient, the bit depth would be 14, and contrast resolution is improved compared with the 12-bit digital system.
Processing the digital data yields a radiographic image that can be viewed on a display monitor and altered in various ways. Even if optimal exposure techniques are not used, the image rescaling that occurs during the processing stage can produce images with the appropriate brightness levels. Digital image processing and display are discussed in detail in Chapter 5.
The ability of the IR to capture a wide range of exit photon intensities does not mean a quality image is always created. Although lower-than-necessary x-ray exposures can be detected and processed, image quality suffers because there is insufficient exposure to the IR, and quantum noise results. The computer can process the data resulting from an IR exposed to higher-than-necessary radiation and produce a quality image but at the expense of patient overexposure. It is the responsibility of the radiographer to select the amount of exposure necessary to produce a diagnostic digital image (exposure latitude).
Dose Monitoring
Air kerma (kinetic energy released in matter) specifies the intensity of x-rays at a given point in air at a known distance from the focal spot or source of x-rays. DR systems use dose-area product (DAP) as an indicator of exposure. DAP is a measure of exposure in air, followed by computation to estimate absorbed dose to the patient. It is measured by a DAP meter embedded in the collimator. The DAP value depends on the exposure factors and field size and reflects both the dose to the patient and the total volume of tissue being irradiated. Kerma-area product (KAP) is the same as DAP and is the product of the total air kerma and the area of the x-ray beam at the entrance of the patient. Units of DAP or KAP are expressed in micro, milli, or centigray per area squared but can vary by manufacturer. DAP and KAP provide indicators of patient radiation risk and may be documented in the patient's record.
Modulation Transfer Function
As previously stated, a radiographic image displays a range of brightness levels (grayscale) based on the variation in radiation intensities exiting the tissue. Anatomic detail is best visualized when the brightness level of the object is different than its surrounding tissue (high contrast). Larger sized objects (low spatial frequency) are more easily visualized. As the size of the object decreases, it attains higher spatial frequency and becomes more difficult to visualize in a radiographic image. Modulation transfer function (MTF) is a measure of the imaging system's ability to display the contrast of anatomic objects varying in size, and the value will be between 0 (no difference in brightness levels) and 1.0 (maximum difference in brightness levels). The formula for MTF is as follows:
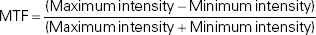
An MTF of 1 (100% difference) would signify the difference between maximum and minimum brightness. An MTF of 1 is easier to achieve with large objects having low spatial frequency. It is more difficult to visualize smaller objects having high spatial frequency, and therefore most digital imaging systems' MTFs measure much lower than 1.0.
Detective Quantum Efficiency
Detective quantum efficiency (DQE) is a measurement of the efficiency of an IR in converting the x-ray exposure it receives to a quality radiographic image. If an IR system can convert x-ray exposure into a quality image with 100% efficiency (meaning no information loss), the DQE would measure 100% or 1.0. However, no imaging system has 100% conversion efficiency. Nevertheless, the higher the DQE of a system, the lower the radiation exposure required to produce a quality image, thereby decreasing patient exposure. The system's DQE value is impacted by the type of material used in the IR to capture the exit radiation (e.g., DQE is higher for DR compared with CR IRs) and the energy of the x-ray beam (e.g., DQE is higher for amorphous selenium coated [a-Se] at higher kilovoltage peak levels compared with cesium iodide [CsI]). The DQE is also impacted by spatial frequency and MTF. Some conversion efficiency is lost when imaging at higher spatial frequencies; therefore, DQE is directly proportional to the MTF of the detector.
Signal-to-Noise Ratio
Signal-to-noise ratio (SNR) is a method of describing the strength of the radiation exposure compared with the amount of noise apparent in a digital image. Noise is a concern with any electronic data set, in this case digital image noise. Because the photon intensities are converted to an electronic signal that is digitized by the ADC, the term signal refers to the strength or amount of radiation exposure captured by the IR to create the image. The varying x-ray intensities exiting the patient are converted to varying signal strengths. Increasing the SNR improves the quality of the digital image; this means that the strength of the signal is high in comparison with the amount of noise, and therefore, image quality is improved. Decreasing the SNR means that there is increased noise compared with the strength of the signal, and therefore, the quality of the radiographic image is degraded. Quantum noise results when there are too few x-ray photons captured by the IR to create a latent image. In addition to quantum noise, sources of noise include the electronics that capture, process, and display the digital image.
The ability to visualize anatomic tissues is affected by the SNR. Noise interferes with the signal strength just as background static would interfere with the clarity of music heard. When the digital image displays increased noise, regardless of the source, anatomic details have decreased visibility.
Contrast-to-Noise Ratio
Contrast-to-noise ratio (CNR) is a method of describing the contrast resolution compared with the amount of noise apparent in a digital image. Just as increased noise affects the SNR and visibility of the anatomic details, it also impacts the contrast displayed within the digital image. Brightness or signal differences in the digital image are a result of varying exit-radiation intensities from the attenuation of the x-ray beam in anatomic tissue (differential absorption). As previously stated, digital imaging systems have high contrast resolution. A system with higher contrast resolution means that anatomic tissues that attenuate the x-ray beam similarly (low subject contrast) can be better visualized. However, if the image has increased noise, the low subject contrast tissues will not be as well visualized. Digital images with a higher CNR increase the visibility of anatomic tissues (Fig. 4-10).
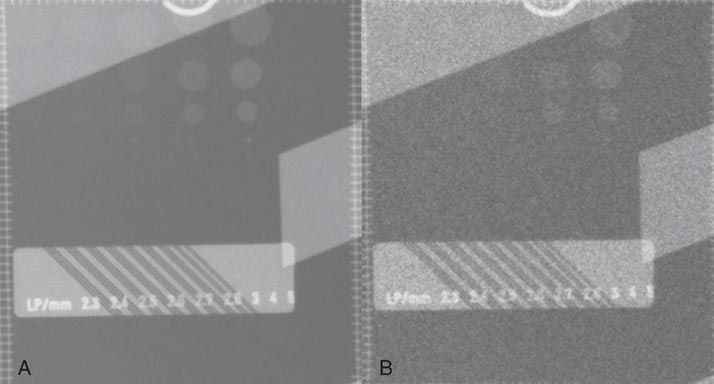
FIG. 4-10 Contrast-to-noise ratio (CNR). A, Image of a contrast detail phantom showing an increased CNR. Phantom objects are more visible. B, Image of contrast detail phantom showing a decreased CNR. Phantom objects are less visible. (Courtesy of Andrew Woodward.)
Different types of digital IRs use various methods of transforming the continuous exit radiation intensities into the array of discrete pixel values for image display. Some digital IRs use a sampling technique, whereas others have fixed detector elements (DELs) that are used to capture the exit radiation intensities. Regardless of the type used, a major determinant of the spatial resolution of digital images is the pixel size and spacing.
DIGITAL IMAGE RECEPTORS AND IMAGE ACQUISITION
Two types of digital IRs are typically used in radiography: CR and DR. These IRs differ in their construction and how they acquire latent images. After the latent image is acquired and the raw data are digitized, image processing and display are essentially the same, regardless of the type of IR.
Computed Radiography
CR IRs come in many sizes and can be portable and used in a table or upright x-ray unit or fixed in a dedicated chest unit. The CR IR includes a cassette that houses the imaging plate (IP) (Fig. 4-11). The radiation exiting the patient interacts with the IP, where the photon intensities are absorbed by the phosphor layer of the IP. Although some of the absorbed energy is released as visible light (luminescence), a sufficient amount of energy is stored in the phosphor to produce a latent image. Luminescence is the emission of light when stimulated by radiation.
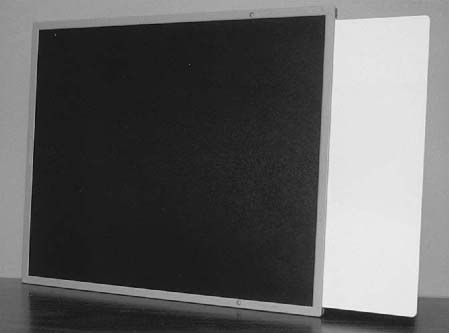
FIG. 4-11 Typical computed radiography (CR) cassette showing the imaging plate (IP) housed within.
The IP primarily consists of support, phosphor, and protective layers (Fig. 4-12). The phosphor layer is composed of barium fluorohalide crystals doped with europium, referred to as the photostimulable phosphor (PSP). This type of phosphor emits visible light when stimulated by a high-intensity laser beam, a phenomenon termed photostimulable luminescence.
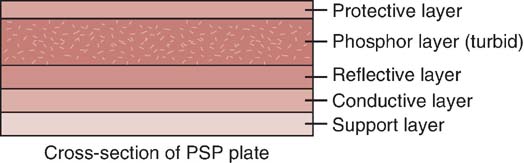
FIG. 4-12 Cross-section of a CR photostimulable phosphor (PSP) plate. (From Johnston JN, Fauber TL: Essentials of Radiographic Physics and Imaging, ed 3, St. Louis, 2020, Elsevier.)
The phosphor (active layer) may be either a turbid or structured phosphor layer. A turbid phosphor has a random distribution of phosphor crystals within the active layer and can be used with both CR and DR IRs (Fig. 4-13). A structured phosphor layer has columnar phosphor crystals within the active layer resembling needles standing on end and packed together (Fig. 4-14). The reflective layer reflects light released during the reading phase toward the photodetector. The conductive layer reduces and conducts away static electricity. The support layer is a sturdy material to give some rigidity to the plate. Finally, the soft backing layer protects the back of the plate and assists in preventing backscatter (x-rays scattered back from the plate) from fogging the phosphor layer during exposure.
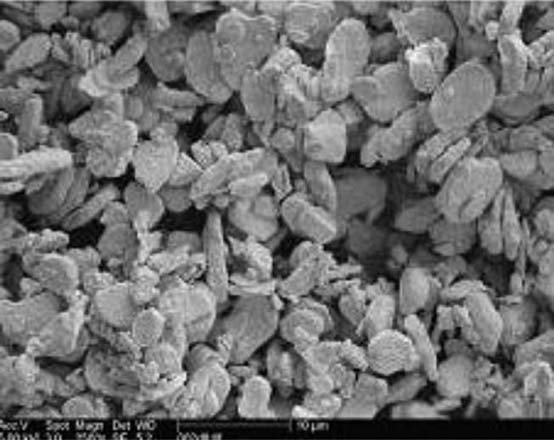
FIG. 4-13 A turbid type phosphor layer. (From Leblans P, Vandenbroucke D, Willems P: Storage Phosphors for Medical Imaging. Materials. 2011; 4(6):1034-1086. https://doi.org/10.3390/ma4061034.)
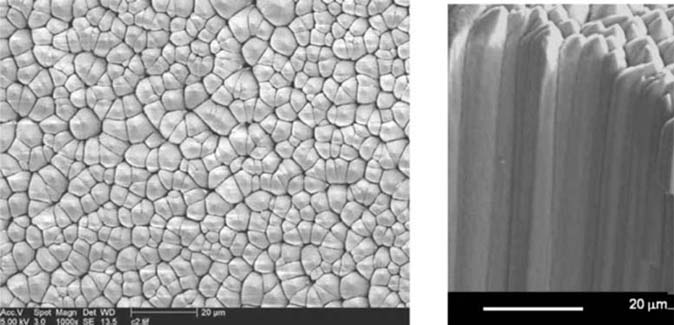
FIG. 4-14 A structured phosphor layer with columnar phosphor crystals. (From Leblans P, Vandenbroucke D, Willems P: Storage Phosphors for Medical Imaging. Materials. 2011; 4(6):1034-1086. https://doi.org/10.3390/ma4061034.)
CR imaging requires a two-step process for image acquisition: image capture in the IP and image readout. The latent image is formed in the PSP when the exit x-ray intensities are absorbed by the phosphor and the europium atoms become ionized by the photoelectric effect. The absorbed energy excites the electrons, elevating them to a higher energy state, where they become stored or trapped in the conduction band (Fig. 4-15). The conduction band is an energy level just beyond the valence band (outermost energy band of an atom). The number and distribution of these trapped electrons (which form the latent image) are proportional to the exit exposure intensity as a result of the tissue's differential x-ray absorption. Some of these excited electrons immediately return to their normal state, and the excess energy is released as visible light. A percentage of electrons remain in this higher-energy state until released during laser beam scanning of the readout stage. The acquired image data (released energy) are extracted from the digital receptor, converted to digital data, and computer processed for image display. Exposed IPs should be processed within a relatively short amount of time (within 1 h) because the latent image dissipates over time (CR fading). CR fading occurs because some of the signal (released energy) captured in the IP is lost.
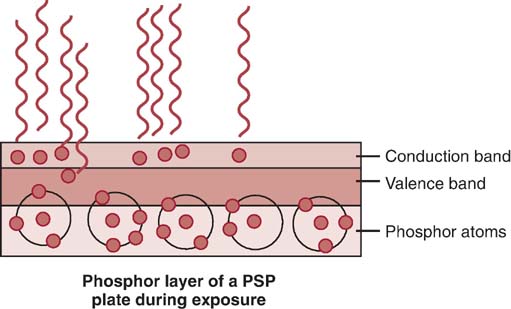
FIG. 4-15 During exposure of the PSP phosphor layer, the higher-energy electrons will become trapped in the conduction band. A percentage of the higher-energy electrons will return to their normal state and release the excess energy as visible light. (From Johnston JN, Fauber TL: Essentials of Radiographic Physics and Imaging, ed 2, St. Louis, 2016, Mosby.)
The exposed IP is placed in or sent to a reader unit that converts the analog data into digital data for computer processing (Fig. 4-16). Reader units are available in single- or multiplate configurations. The major components of a typical reader unit are a drive mechanism to move the IP through the scanning process; an optical system, which includes the laser, beam-shaping optics, collecting optics, and optical filters; a photodetector, such as a photomultiplier tube (PMT); and an ADC. Manufacturers differ in the CR reader mechanics. Some devices move the IP, and some move the optical components. There are three important stages in digitizing the CR latent image: scanning, sampling, and quantization.
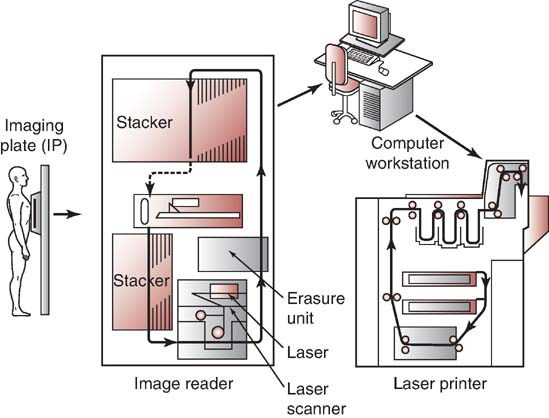
FIG. 4-16 The exposed CR IP is placed in a reader unit to release the stored image, convert the analog image to digital, and send the data to a computer monitor, laser printer for a hard copy, or both. The reader unit also erases the exposed IP in preparation for the next exposure. (Courtesy of Fujifilm Medical Systems, Stamford, CT.)
The purpose of scanning is to convert the latent image (released energy) into an electrical signal (voltage) that can be subsequently digitized and displayed as a manifest digital image. Once in the reader unit, the IP is removed from the cassette and scanned with a helium–neon laser beam or a solid-state laser diode to release the stored energy as visible light (Fig. 4-17). Absorption of the laser beam energy releases the trapped electrons, and they return to a lower energy state. During this process, the excess energy is emitted as visible light (photostimulable luminescence). The scanning of the plate results in a continuous pattern of light intensities being sent to the PMT or photodetector, whose output is directed to the ADC for sampling and quantization.
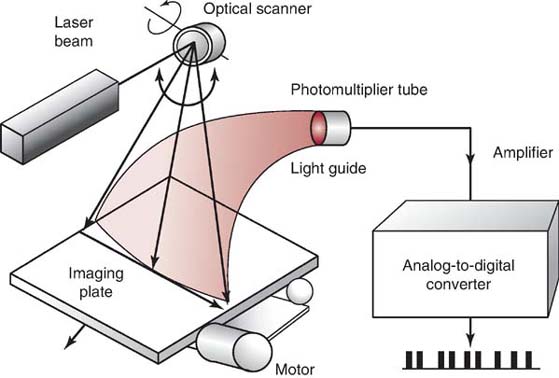
FIG. 4-17 A neon–helium laser beam scans the exposed CR IP to release the stored energy as visible light. The photomultiplier tube collects, amplifies, and converts the light to an electrical signal. The analog-to-digital converter converts the analog data to digital data. (Courtesy of Fujifilm Medical Systems, Stamford, CT.)
A photodetector collects, amplifies, and converts the visible light to an electrical signal proportional to the range of energies stored in the IP. The collected electronic signal values are of low voltage and therefore need to be amplified by the photodetector in order to travel to the ADC. The signal output from the photodetector is digitized by an ADC in order to produce a digital image. To digitize the analog signal from the photodetector, it must first be sampled. An important performance characteristic of an ADC is the sampling frequency, which determines how often the analog signal is reproduced in its discrete digitized form (Fig. 4-18).
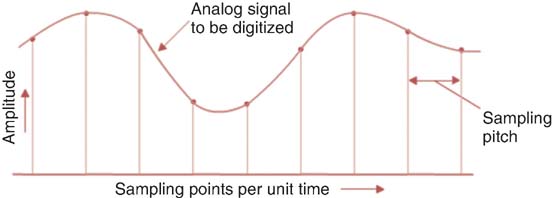
FIG. 4-18 Sampling and pixel pitch. The sampling frequency determines the distance between the midpoint of one pixel and the midpoint of an adjacent pixel.
As mentioned previously, small anatomic details have higher spatial frequency and would therefore need a higher sampling frequency than low spatial frequency anatomic details. The Nyquist frequency is a standard formula for converting analog data into to discreet digital units to accurately represent the analog signal or imaging data in digital radiography. To accurately reproduce an image from the continuous analog signal, the sampling rate must be at least two times the highest spatial frequency in the exit x-ray intensities (signal). If the sampling frequency is too low, an improper waveform (aliasing) may result, which is considered an image artifact and reduces the visibility of small anatomic detail (Fig. 4-19).
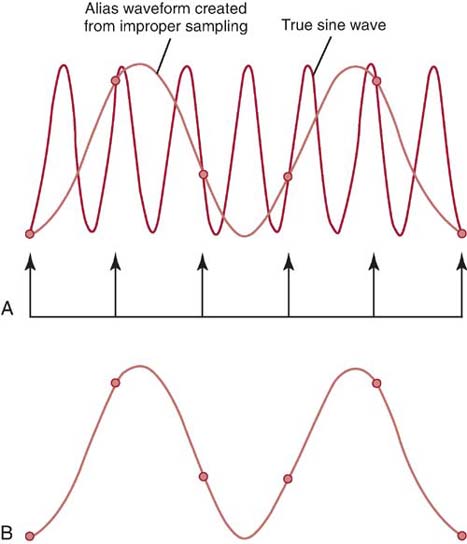
FIG. 4-19 CR sampling and its effect on the digital data. A, The sampling points of the analog waveform. B, The improper digital waveform (alias) that results from low sampling frequency.
Increasing the sampling frequency of the analog signal increases the pixel density of the digital data and improves the spatial resolution of the digital image. The closer the samples are to each other (increased sampling frequency), the smaller the sampling pitch, or distance between the sampling points (Fig. 4-20). Increasing the sampling frequency decreases the sampling pitch and results in smaller-sized pixels. The distance between the midpoint of one pixel to the midpoint of an adjacent pixel describes the pixel pitch. Spatial resolution is improved with an increased number of smaller pixels, resulting in a more faithful digital representation of the acquired analog image.
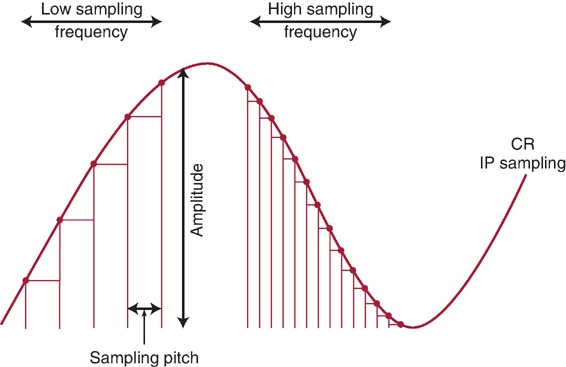
FIG. 4-20 CR sampling frequency and sampling pitch. (Courtesy of Richard Sanders.)
Manufacturers of CR equipment vary in the method of sampling IPs of different sizes. Some manufacturers fix the sampling frequency to maintain a fixed spatial resolution, whereas others vary the sampling frequency to maintain a fixed matrix size. If the spatial resolution is fixed, the image matrix size is simply proportional to the IP size. A larger IP has a larger matrix to maintain spatial resolution (Fig. 4-21). If the matrix size is fixed, changing the size of the IP would affect the spatial resolution of the digital image. For example, under a fixed matrix size system, changing from a 14 × 17 inch (35 × 43 cm) IR size to a 10 × 12 inch (25 × 30 cm) IR would result in improved spatial resolution for the same FOV (Fig. 4-22). Spatial resolution is improved because in order to maintain the same matrix size and number of pixels, the pixels must be smaller in size. It is recommended to use the smallest IR size reasonable for the anatomic area of interest.
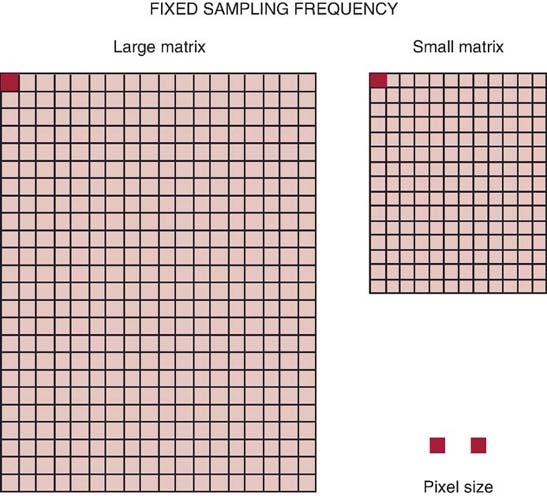
FIG. 4-21 Fixed sampling frequency. A fixed sampling frequency will maintain a fixed spatial resolution. A larger IP size will have a larger matrix to maintain the same pixel size. Note: Pixel size is not to scale and is used for illustration only.
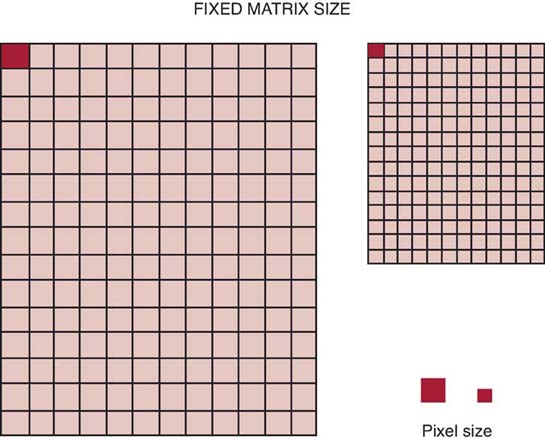
FIG. 4-22 Fixed matrix size. A fixed matrix size will vary the sampling frequency for a different IP size. A larger IP size results in a larger pixel size and decreased spatial resolution. Note: Pixel size is not to scale and is used for illustration only.
Another important ADC performance characteristic is degree of quantization or pixel bit depth, which controls the number of gray shades or contrast resolution of the image. During the process of quantization, each pixel, representing a brightness value, is assigned a numerical value. Quantization reflects the precision with which each sampled point is recorded. As previously discussed, the pixel size and pitch determine the spatial resolution, and the pixel bit depth determines the system's ability to display a range of shades of gray to represent anatomic tissues. Pixel bit depth is fixed by the choice of ADC, and CR systems manufactured with a greater pixel bit depth (i.e., 16-bit [in which 216 bits can display 65,536 shades of gray]) improve the contrast resolution of the digital image.
Before the IP is returned to service, the plate is exposed to an intense white light to release any residual energy that could affect future exposures. PSPs can be reused and are estimated to have a life of 10,000 readings before requiring replacement. Advancements in PSP material, laser beam technology, and dual-sided IP scanning will continue to improve the process of CR image acquisition.
Direct Radiography
DR IRs have a self-scanning readout mechanism that uses an array of x-ray detectors that receive the exit radiation and convert the varying x-ray intensities into proportional electronic signals for digitization (Fig. 4-23). In contrast to CR, which requires a two-step image acquisition process and results in a longer delay between image capture and image readout, DR imaging combines the two processes. As a result, DR images are available almost instantly after exposure. However, DR receptors are more fragile and much more expensive than CR IRs. Several types of electronic detectors are available for DR.
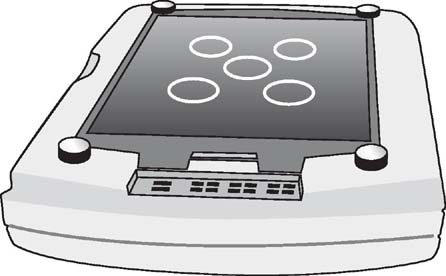
FIG. 4-23 A direct radiography digital detector assembly. (From Johnston JN, Fauber TL: Essentials of Radiographic Physics and Imaging, ed 3, St. Louis, 2020, Elsevier.)
Flat-Panel Detectors
Flat-panel detectors (FPDs) are solid-state IRs that use a large-area active matrix array of electronic components ranging in size from 43 × 35 cm to 43 × 43 cm (17 × 14 inch to 17 × 17 inch). FPDs are constructed with layers to receive x-ray photons and convert them to electrical charges for storage and readout (Fig. 4-24). Signal storage, signal readout, and digitizing electronics are integrated into the flat-panel device. The top layer is composed of an x-ray converter, the second layer houses the thin-film transistor (TFT) array, and the third layer is a glass substrate. The TFT array is divided into square DELs, each having a capacitor to store electrical charges and a switching transistor for readout. Electrical charges are separately read out from each DEL. The electronic signal is then sent to the ADC for digitization.
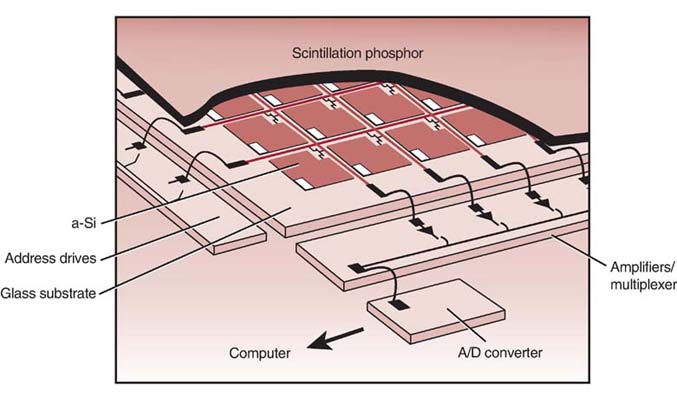
FIG. 4-24 Flat-panel-detector (FPD) array. A/D, analog-to-digital; a-SI, amorphous silicon. (From Johnston JN, Fauber TL: Essentials of Radiographic Physics and Imaging, ed 2, St. Louis, 2016, Mosby.)
Advancements in DEL technology have incorporated the ADC within the DEL. Digitizing the electrical signal within the DEL creates a more accurate signal. Having the analog electrical signal digitized before it leaves the DEL reduces its susceptibility to external disturbances. That is, the digital signal is not impacted by extraneous energy such as magnetic or radiofrequency disturbances in the surroundings. These energy disturbances can distort the original electrical signal.
The DEL has an x-ray-sensitive area representing each pixel in the image matrix. The pixel is therefore smaller than the DEL and can only capture a percentage of the x-rays reaching the detector. This percentage of x-ray capture (~80%–95%) is known as the fill factor. Although FPDs with smaller DELs have smaller pixel sizes represented on the visible image and therefore improved spatial resolution, the fill factor is decreased and becomes a limitation. Efforts to further decrease size of the DEL for improved spatial resolution would require more radiation exposure to reach the IR to create the digital image. However, advancements in FPD technology, such as increasing the fill factor to 95% and improved detector materials, generally require less radiation exposure for optimum image quality. The detector system is usually dedicated to a single room and can be permanently mounted within the table or an upright Bucky system. Flat-panel digital detectors are also available as mobile IRs and can be removed from the Bucky and used on the tabletop or a stretcher. After exposure, the digital image is available within milliseconds on a viewing monitor, and no separate reader unit is involved for image processing (Fig. 4-25). Flat-panel systems are highly dose efficient and provide quicker access to images compared with CR. The spatial resolution of flat-panel receptors is generally superior to that of CR. Because a pixel detector is built into the DR flat-panel IR, the size and pitch of the pixel are determined by the DEL and are fixed. Therefore, spatial resolution for flat-panel-detector IRs is limited to the DEL. A system that uses a smaller DEL size has improved spatial resolution. FPDs are manufactured in two different ways to create electrical charges proportional to the x-ray exposure: indirect and direct conversion methods.
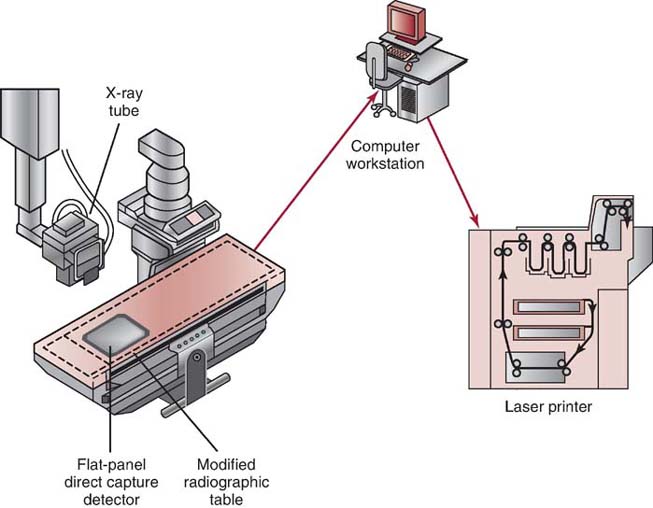
FIG. 4-25 FPD detector fixed in a modified x-ray table.
Indirect Conversion Detectors
Indirect conversion detectors use a scintillator such as CsI or gadolinium oxysulfide (Gd2O2S) to convert the exit radiation into visible light. This phosphor-type material used in a scintillator produces light following the absorption of the x-rays. The visible light, in proportion to the x-ray exposure, is then converted to electrical charges by photodetectors (layer of amorphous silicon in the TFT array). The electrical charges are temporarily stored by capacitors in the TFT array before being digitized by the ADC and processed in the computer (Fig. 4-26).
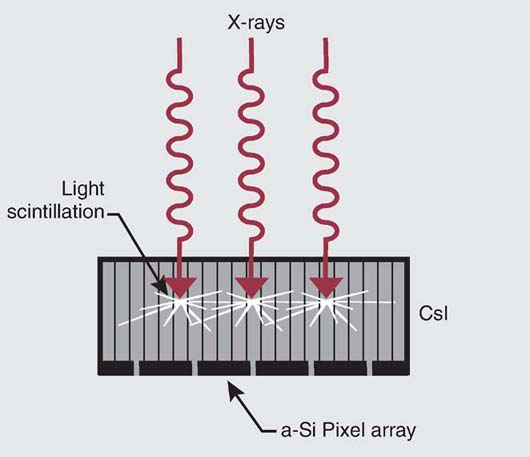
FIG. 4-26 FPD–indirect conversion. (Modified from Bushong SC: Radiologic Science for Technologists, ed 10, St. Louis, 2013, Mosby.)
The design of the scintillator used to convert the x-ray intensities into visible light can be structured or unstructured. Structured scintillator phosphors (in the form of needles or columns), usually crystalline CsI, reduce the spread of visible light, thus yielding images with higher spatial resolution than that of images obtained from unstructured scintillators and requiring less radiation to produce a quality image.
Other types of DR indirect conversion detectors include a charge-coupled device (CCD) and the complementary metal oxide semiconductor (CMOS). The CCD is very light sensitive and can respond to very low light intensities. It also has a wide dynamic range and can respond to a wide range of light intensities. The scintillator for this form of indirect capture is a CsI phosphor plate. A scintillator is a material that absorbs x-ray energy and emits visible light in response. CsI is a hygroscopic material (it readily absorbs moisture) that must be hermetically sealed to avoid water absorption and prevent rapid degradation but is otherwise a high-efficiency scintillation material. The CsI phosphor plate may be coupled to the CCD using either a fiberoptic bundle or an optical lens system (Fig. 4-27). With this form of indirect capture, x-rays are absorbed by the scintillator and converted to light. This light energy is then transmitted to the CCD, where it is converted to an electronic signal and sent to the computer workstation for processing and display. Because there are currently technical limits to how large a single CCD device can be, an x-ray receptor may consist of an array of closely spaced CCDs. One challenge of this design is the seams at which the CCDs are joined (called tiling or tiled). Tiling is a process in which several CCD detectors adjoin to create one larger detector. This process results in seams with unequal response. This is addressed with computer preprocessing correction software that interpolates (averages) the pixel values along the seams (flat-field correction), in effect making the seams disappear.
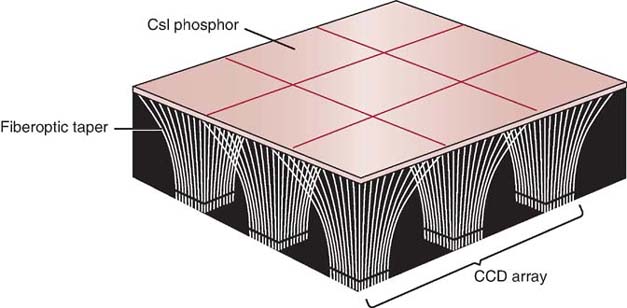
FIG. 4-27 The basic components of a charge-coupled-device (CCD) array. The cesium iodide phosphor plate is coupled to the CCD using fiberoptic bundles. (From Johnston JN, Fauber TL: Essentials of Radiographic Physics and Imaging, ed 3, St. Louis, 2020, Elsevier.)
Serving a similar purpose as the CCD is the CMOS. CMOS devices are scintillators made up of a crystalline silicon matrix. Each DEL has its own amplifier, photodiode, and storage capacitor and is surrounded by transistors (Fig. 4-28). They do not have quite the light sensitivity or resolution of CCDs, but they use a fraction of the power to run, are very inexpensive to manufacture, and are improving. The newest versions have very fast image acquisition times because of their random pixel access capabilities. This feature also makes for AEC functions that are not as easy to achieve with CCDs. Creation of CMOS detectors of large enough size for general radiography have been its limitation, but this is changing. Recent advances in CMOS technology, particularly the creation of crystal light tubes that prevent light spread and methods for increasing their size, make them applicable for radiographic imaging.
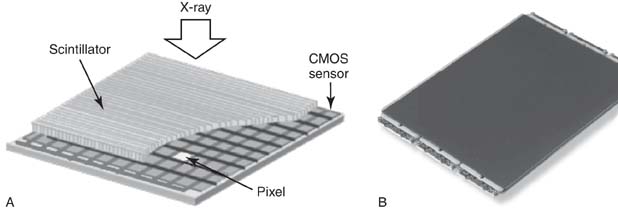
FIG. 4-28 A, Complementary metal oxide semiconductor (CMOS) detector array layers. B, CMOS device. (Part A courtesy of RIKEN and JASRI. Part B courtesy of Teledyne DALSA.)
Indirect conversion detectors are so named because they involve a two-stage process of converting x-ray intensities first to visible light and then to electrical charges during image acquisition. The electrical signals are then directed to amplifiers and the ADC to produce a raw digital image.
Direct Conversion Detectors
Direct conversion detectors use an a-Se detector to directly convert the exit radiation to electrical charges (Fig. 4-29). To compensate for the moderately low atomic number of selenium (Z = 34), the thickness of the amorphous selenium is relatively high (1 mm). An electrical field is applied across the selenium layer to limit the lateral diffusion of electrons as they migrate toward the TFT array. By this means, excellent spatial resolution is maintained. Similar to indirect conversion detectors, the electronic charge is stored in a TFT array before it is amplified, digitized, and processed in the computer.
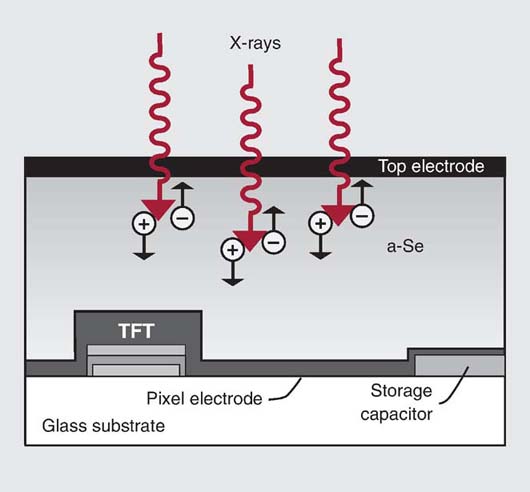
FIG. 4-29 FPD–direct conversion. a-Se, Amorphous selenium coated; TFT, thin-film transistor. (Modified from Bushong SC: Radiologic Science for Technologists, ed 10, St. Louis, 2013, Mosby.)
Regardless of the type of digital imaging system, the varying electrical signals are sent to the ADC for conversion into digital data. The digitized pixel intensities are patterned in the computer to form the image matrix. The image matrix is a digital composite of the varying x-ray intensities exiting the patient. Each pixel has a brightness level representing the attenuation characteristic of the volume of tissue imaged. After the varying x-ray intensities are converted to numeric data, the digital image can be electronically processed, manipulated, transported, or stored.
QUALITY CONTROL
Ensuring the digital equipment is performing as expected is an important goal of a quality control (QC) program. Equipment acceptance testing and routine equipment maintenance are accomplished by qualified medical physicists or vendor service personnel. However, many daily, weekly, and monthly QC activities should be performed by the radiographer. In addition to the routine QC checks on the x-ray equipment discussed in other chapters, visual inspection of IRs for potential image artifacts caused by IP scratches, blood, contrast media, dirt, and damage as a result of daily use are necessary regardless of the type of digital imaging system. Routine cleaning (according to the manufacturer) and inspection of the digital IR by the radiographer can identify potential problems that may impact radiographic quality. Box 4-3 lists common QC activities for digital IRs that can be performed by the radiographer. Most of these QC checks evaluate the performance of the digital imaging system and the display monitor. QC checks specific to the performance of the display monitor will be discussed in Chapter 5.
CHAPTER SUMMARY
- • A digital image with a larger matrix and smaller-sized pixels has improved quality.
- • The pixel size is directly related to the FOV displayed and inversely related to matrix size.
- • A pixel's bit depth determines the available shades of gray to display the digital image or its contrast resolution.
- • Spatial resolution is improved by increasing the pixel density and decreasing the pixel pitch.
- • lp/mm is the unit of measurement for spatial frequency. Increasing the number of resolved lp/mm (higher spatial frequency) increases spatial resolution.
- • Digital IRs have a wide dynamic range, which means that they can accurately capture the wide range of photon energies that exit a patient. However, lower- or higher-than-necessary exposure techniques do not guarantee a quality digital image with reasonable radiation exposure to the patient.
- • Digital imaging systems with a wider dynamic range have higher pixel bit depths to display the range of grayscale. A 12-bit pixel depth system can display 4096 shades of gray, whereas a 14-bit pixel depth system can display 16,384 shades of gray, therefore improving the quality of the displayed image.
- • Radiographers should select exposure techniques within the exposure latitude of the digital imaging system and departmental standards.
- • The MTF is a measure of an imaging system's ability to display contrast of anatomic objects varying in size, and the value ranges between 0 (no difference in brightness levels) and 1.0 (maximum difference in brightness levels).
- • DQE is a measurement of the efficiency of an IR in converting the x-ray exposure it receives to a quality radiographic image. The higher the DQE of a system, the lower the radiation exposure required to produce a quality image, and therefore, patient exposure is decreased.
- • SNR is a method of describing the strength of the radiation exposure compared with the amount of noise apparent in a digital image. When the digital image displays increased noise, regardless of the source, anatomic details will have decreased visibility.
- • CNR is a method of describing the contrast resolution compared with the amount of noise apparent in a digital image. Digital images having a higher CNR will increase the visibility of anatomic tissues.
- • CR and DR IRs differ in their construction and how they acquire latent images. After the latent image is acquired and the raw data are digitized, image processing and display are essentially the same for CR and DR.
- • In CR, the IP has a photostimulable phosphor layer that absorbs the exit radiation and excites electrons, which become elevated to a higher energy state and get trapped.
- • The exposed IP is placed in a reader unit where the trapped electrons are released during the laser beam scanning, and the excess energy is emitted as visible light. A photodetector collects, amplifies, and converts the visible light to an electrical signal proportional to the range of energies stored in the IP.
- • The signal output from the photodetector is digitized by an ADC converter to produce a digital image.
- • The sampling frequency in CR determines how often the analog signal is reproduced in its discrete digitized form. Increasing the sampling frequency increases the pixel density of the digital data and improves the spatial resolution of the digital image.
- • After data extraction, CR IPs must be erased by exposure to an intense white light to release any residual energy before reuse.
- • In contrast to CR, DR IRs combine image capture and readout.
- • Signal storage, signal readout, and digitizing electronics are integrated into a solid-state FPD.
- • FPDs use both indirect and direct conversion methods to create proportional electrical charges that are sent to the ADC for conversion to digital data.
- • Indirect conversion detectors use a scintillator to convert the exit radiation to visible light, and then the visible light is converted to electrical charges for storage in the TFTs.
- • Other indirect conversion detectors include CCDs and CMOS.
- • Direct conversion detectors directly convert the exit radiation into electrical charges for storage in the TFTs.
- • After the varying x-ray energies are converted to numerical data, the digital image can be electronically processed, manipulated, transported, or stored.
- • Routine quality control checks on the digital imaging system should be performed by the radiographer.
REVIEW QUESTIONS
1. Which of the following would improve spatial resolution?
A. Small matrix and large pixel size
B. Decreased pixel density and increased pixel pitch
C. Large matrix and large pixel size
D. Large matrix and increased pixel density
2. The type of image receptor (IR) that uses a photostimulable phosphor to acquire the latent image is ________________.
A. an intensifying screen
B. a flat-panel detector
C. computed radiography
D. direct radiography
3. Which of the following is used to extract the latent image from an imaging plate (IP)?
A. Laser beam
B. Photomultiplier tube
C. Analog-to-digital converter
D. Thin-film transistor
4. Which of the following will improve the spatial resolution of the digital image?
A. Decreased sampling frequency and increased sampling pitch
B. Decreased sampling frequency and decreased sampling pitch
C. Increased sampling frequency and increased sampling pitch
D. Increased sampling frequency and decreased sampling pitch
5. Which of the following would improve the spatial resolution of the digital image for a given field of view (FOV)?
A. A fixed matrix size and larger IP
B. A decreased sampling frequency and larger IP
C. A small matrix size and larger pixel size
D. A fixed matrix size and small IP
6. What is the process of assigning a numerical value to represent a brightness value?
A. Dynamic range
B. Signal-to-noise ratio
C. Quantization
D. Spectral sensitivity
7. Which of the following pixel bit depths would display a greater range of shades of gray to represent anatomic tissues?
A. 8 bit
B. 10 bit
C. 14 bit
D. 16 bit
8. Small anatomic detail has ________________.
A. decreased pixel density
B. increased spatial resolution
C. high spatial frequency
D. low signal to noise ratio
9. Digital imaging systems have a wide dynamic range.
A. True
B. False
10. ________________ refers to the range of exposures that should be used to produce a diagnostic image.
A. Modulation transfer function
B. Bit depth
C. Exposure latitude
D. Dynamic range
11. A lower signal-to-noise ratio (SNR) improves the quality of a digital image.
A. True
B. False
12. Decreasing the displayed FOV for a given matrix size will decrease the size of the pixels and increase spatial resolution.
A. True
B. False
13. Which of the following is a measurement of the efficiency of an IR in converting the x-ray exposure it receives to a quality radiographic image?
A. DAP
B. MTF
C. DQE
D. SNR
14. A higher sampling frequency during CR latent image digitization will
A. increase spatial resolution.
B. decrease pixel density.
C. increase pixel pitch.
D. increase CNR.
15. A 16-bit digital system would have a narrow dynamic range compared to a 12-bit system.
A. True
B. False
16. Which of the following provide an indication of patient radiation risk during a radiographic procedure?
A. DQE
B. DAP
C. KAP
D. B and C only
17. Digital detectors that require a two-stage process to acquire and digitize the latent image include
A. flat-panel detectors indirect conversion.
B. CCD.
C. CMOS.
D. all the above.
18. Image artifacts can be caused by
1. dirty CR IPs.
2. low sampling frequency.
3. increased pixel density.
A. 1 and 2 only
B. 1 and 3 only
C. 2 and 3 only
D. 1, 2, and 3