Exposure Technique Factors
OBJECTIVES
- 1. Define all the key terms in this chapter.
- 2. State all the important relationships in this chapter.
- 3. Explain the relationship between milliamperage (mA) and exposure time with radiation production and image receptor (IR) exposure.
- 4. Calculate changes in milliamperage and exposure time to change or maintain exposure to the IR.
- 5. Describe the effect of changes in mA and exposure time on digital images.
- 6. Recognize how to correct factors for an exposure error.
- 7. Explain how kilovoltage peak (kVp) affects radiation production and IR exposure.
- 8. Calculate changes in kVp to change or maintain exposure to the IR.
- 9. Describe the effects of changes in kVp on digital images.
- 10. Recognize the factors that affect spatial resolution and distortion.
- 11. Calculate changes in mAs for changes in source-to-image-receptor distance.
- 12. Calculate the magnification factor and determine image and object size.
- 13. Describe the use of grids and beam restriction and their effect on IR exposure and image quality.
- 14. Calculate changes in mAs when adding or removing a grid.
- 15. Recognize patient factors that may affect IR exposure.
- 16. Identify exposure factors that can affect patient radiation exposure.
- 17. State exposure technique modifications for the following considerations: body habitus and patient thickness.
KEY TERMS
15% rule; body habitus; direct square law; exposure indicator; exposure maintenance formula; inverse-square law; magnification factor (MF); object-to-image-receptor distance (OID); source-to-image-receptor distance (SID); source-to-object distance (SOD)
In Chapter 2, variables that affect both the quantity and the quality of the x-ray beam are presented. Milliamperage (mA) and exposure time affect the quantity of radiation produced, and kilovoltage affects both the quantity and the quality. Chapter 3 emphasizes that a good-quality radiographic image accurately represents the anatomic area of interest. The characteristics evaluated for image quality are brightness, contrast, spatial resolution, distortion, and noise. This chapter focuses on exposure techniques and the use of accessory devices and their effects on the radiation reaching the patient, image receptor (IR), and the image produced. Radiographers have the responsibility of selecting the combination of exposure factors to produce a good-quality image. Knowledge of how these factors affect the exposure to the IR individually and in combination assists radiographers in producing a radiographic image with the amount of information desired for a diagnosis. In addition, the patient should be exposed to the least amount of radiation reasonable to produce a diagnostic-quality image. This chapter discusses all the primary and secondary factors and their effects on the radiation reaching the patient, IR, and image quality.
PRIMARY FACTORS
The primary exposure technique factors selected by the radiographer on the control panel are mA, exposure time (s), and kilovoltage peak (kVp). Depending on the type of control panel, mA and exposure time may be selected separately or combined as one factor, milliamperage-seconds (mAs). Regardless, it is important to understand how changing each factor separately or in combination affects the radiation reaching the patient, IR, and the radiographic image.
Milliamperage and Exposure Time
The quantity of radiation exiting the x-ray tube and reaching the patient affects the amount of remnant radiation reaching the IR. The product of mA and exposure time is directly proportional to the quantity of x-rays produced (Fig. 6-1). When an anatomic part is adequately penetrated, the exposure to the IR will increase in proportion to increases in the quantity of x-rays (Fig. 6-2). Conversely, when the quantity of x-rays is decreased, the exposure to the IR decreases. Therefore, exposure to the IR can be increased or decreased by adjusting the amount of radiation (mAs).
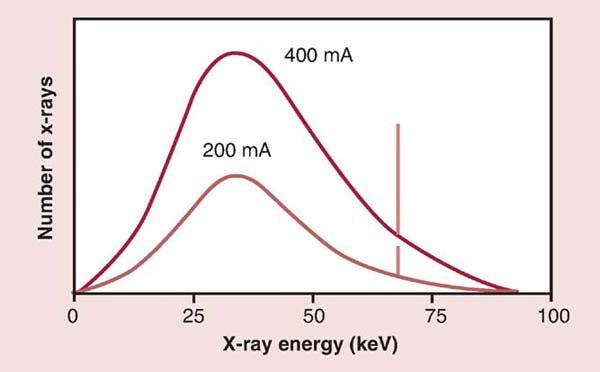
FIG. 6-1 Milliamperage (mA) and radiation quantity. Changing the mA results in a proportional change in the quantity (amplitude) of x-rays produced. (From Johnston JN, Fauber TL: Essentials of Radiographic Physics and Imaging, ed 2, St. Louis, 2016, Mosby.)
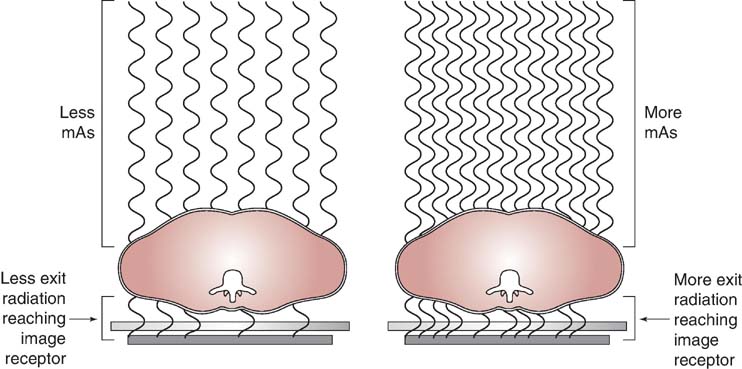
FIG. 6-2 Milliamperage-seconds (mAs) and radiation exposure. As the quantity of x-rays is increased mAs, the exposure to the image receptor (IR) proportionally increases.
Because the mAs is the product of mA and exposure time, increasing either mA or time will increase the amount of radiation exposure to the IR.
MATHEMATICAL APPLICATION
Adjusting mA or Exposure Time

To increase the mAs to 40, one could use the following formulas:


As demonstrated in the previous Mathematical Application, mAs can be doubled by doubling either the mA or the exposure time. A change in either milliamperage (mA) or exposure time (s) proportionally changes the mAs. To maintain the same mAs, the radiographer must increase the mA and proportionally decrease the exposure time or decrease the mA and proportionally increase the exposure time.
MATHEMATICAL APPLICATION
Adjusting mA and Exposure Time to Maintain mAs

To maintain mAs, use the following formulas:


It is important for the radiographer to determine the appropriate mAs level needed to produce a diagnostic image. This is not an easy task because there are so many variables that can affect the required mAs. For example, single-phase generators produce less radiation with the same mAs compared with high-frequency generators. A patient's age, the general condition of the patient, and the thickness of the anatomic part also affect the mAs required for a procedure. In addition, IRs respond differently for a given mAs level. For example, mAs does not control the amount of brightness displayed within a digital image. Digital IRs can detect a wider range of radiation intensities (wider dynamic range) exiting the patient and therefore are not dependent on the mAs. However, exposure errors can adversely affect the quality of a digital image. If the mAs is too low (low exposure to the digital IR), image brightness is adjusted during computer processing to achieve the desired level. Even after adjusting the level of brightness, there may be increased quantum noise visible within an image (Fig. 6-3). If the selected mAs is too high (high exposure to the digital IR), the brightness can also be adjusted; however, the patient will receive more radiation than necessary.
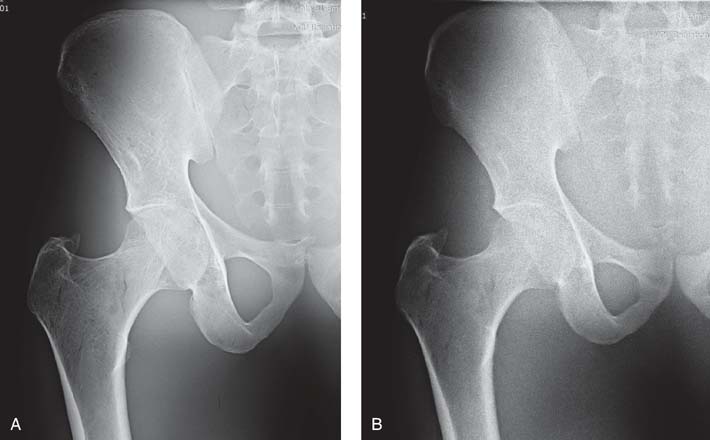
FIG. 6-3 A, Radiographic image obtained with high mAs showing decreased quantum noise. B, Radiographic image obtained with low mAs showing increased quantum noise. (From Johnston JN, Fauber TL: Essentials of Radiographic Physics and Imaging, ed 3, St. Louis, 2020, Elsevier.)
The brightness of a digital image can be altered during image processing; hence, information about the exposure to the IR is important. Manufacturers of each type of digital system specify the expected range of x-ray exposure sufficient to produce a quality image. A numerical value (exposure indicator) is displayed on the processed image to indicate the level of x-ray exposure received (incident exposure) on the digital IR. It is important for the radiographer to consider the indicated value because exposure errors, as previously stated, affect the quality of the digital image and the radiation dose to the patient. Exposure errors are not obvious by simply looking at the digital image because the digital data are normalized to provide images with diagnostic brightness levels (Fig. 6-4). Most manufacturers of digital IRs suggest a range for the exposure indicator on the basis of the radiographic procedure. If the exposure indicator value falls outside this range, exposure to the digital IR, image quality, and patient exposure could be affected.
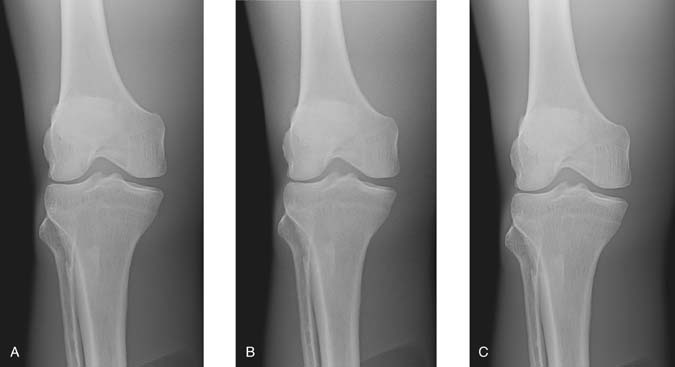
FIG. 6-4 Exposure errors can be computer adjusted to maintain image brightness. A, Image created with sufficient mAs. B, Image created with insufficient mAs, resulting in increased quantum noise visible. C, Image created with excessive mAs, resulting in decreased quantum noise visible. The exposure indicator value reflected the exposure errors to the IR for images B and C. (From Johnston JN, Fauber TL: Essentials of Radiographic Physics and Imaging, ed 3, St. Louis, 2020, Mosby.)
Generally, for repeat images necessitated by exposure errors, the mAs is adjusted by a factor of 2; therefore, a minimum change involves doubling or halving the mAs. If a radiographic image must be repeated because of another error, such as positioning, the radiographer may use the opportunity to make an adjustment in the exposure to the IR to produce an image of diagnostic quality. A radiographic image repeated because of insufficient or excessive exposure requires a change in mAs by a factor of at least 2.
To best visualize the anatomic area of interest, the selected mAs must produce a sufficient amount of radiation that reaches the IR. An excessive or insufficient amount of mAs adversely affects image quality and patient radiation exposure. The radiographer should be diligent in monitoring exposure indicator values to ensure that quality images are obtained with the lowest reasonable radiation dose to the patient.
Kilovoltage Peak
The kVp affects the exposure to the IR because it alters the amount and penetrating ability of the x-ray beam (Fig. 6-5). The area of interest must be adequately penetrated before the mAs can be adjusted to produce a quality radiographic image. When adequate penetration is achieved, increasing the kVp further results in more radiation reaching the IR (Fig. 6-6). In addition to affecting the amount of radiation exposure to the IR, the kVp affects subject contrast.
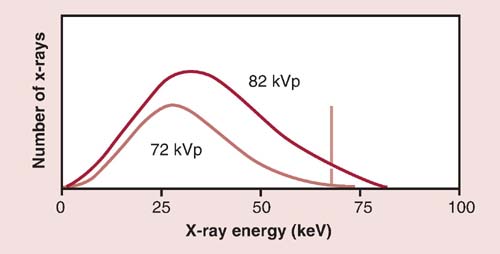
FIG. 6-5 Kilovoltage peak (kVp) and radiation quality and quantity. Increasing the kVp from 72 to 82 shows an increase in the quantity of x-rays (amplitude), and the x-ray emission shifts toward the right, indicating an increase in the energy or quality of the beam. (From Johnston JN, Fauber TL: Essentials of Radiographic Physics and Imaging, ed 2, St. Louis, 2016, Mosby.)
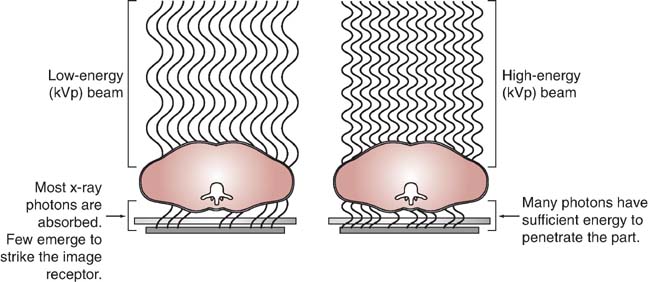
FIG. 6-6 The kVp and radiation exposure. Increasing the kVp increases the penetrating power of the radiation and increases the exposure to the IR.
Kilovoltage Peak and Exposure to the Image Receptor
Because kVp affects the amount of radiation reaching the IR, its effect on the digital image is similar to the effect of mAs. Assuming that the anatomic part has been adequately penetrated, too much radiation reaching the IR (within reason) will still produce a digital image with the appropriate level of brightness as a result of computer adjustment during image processing; however, the patient will be overexposed. Similarly, too little radiation reaching the IR (within reason) will produce a digital image with the appropriate level of brightness, but the increased quantum noise will decrease the image quality.
A diagnostic-quality image (Fig. 6-7A) was produced using 70 kVp at 2 mAs. Fig. 6-7B was produced using 50 kVp at 2 mAs, and Fig. 6-7C was produced using 93 kVp at 2 mAs. Although the brightness was adjusted by the computer, the exposure indicator for each of the images varied greatly and reflected the exposure to the IR. When a kVp that is too low is selected, the brightness is adjusted, but quantum noise may be visible. Additionally, when a kVp that is too high is selected without an appropriate decrease in mAs, the image brightness is adjusted, but patient exposure may be increased because of increased x-ray quantity and scatter within the tissues. Although brightness can be computer adjusted when using a kVp that is too high, increased scatter radiation can also reach the IR and may adversely affect image quality.
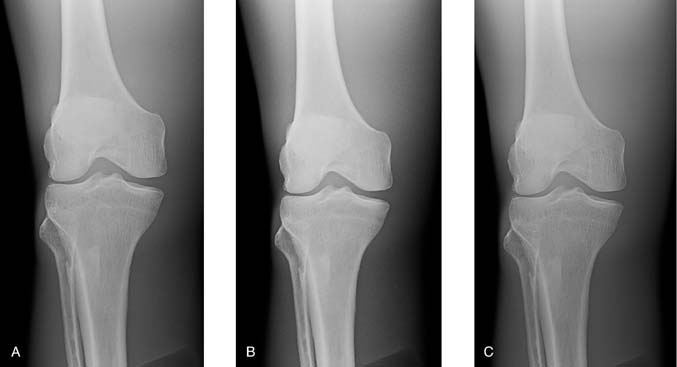
FIG. 6-7 A, Image produced using 70 kVp at 2 mAs. B, Image produced using 50 kVp t 2 mAs, resulting in higher subject contrast and computer adjusted to maintain brightness but increased quantum noise visible. C, Image produced using 93 kVp at 2 mAs, resulting in lower subject contrast and computer adjusted to maintain brightness, but patient exposure is increased. (From Johnston JN, Fauber TL: Essentials of Radiographic Physics and Imaging, ed 3, St. Louis, 2020, Mosby.)
Excessive or insufficient radiation exposure to the digital IR, as a result of the mAs or kVp, should be reflected in the exposure indicator value.
Kilovoltage is not a factor that is typically manipulated to vary the amount of IR exposure because the kVp also affects subject contrast. However, it is sometimes necessary to manipulate the kVp to maintain the required exposure to the IR. For example, using portable or mobile x-ray equipment may limit the choice of mAs settings, and the radiographer must adjust the kVp to maintain sufficient exposure to the IR.
Maintaining or adjusting exposure to the IR can be accomplished with kVp using the 15% rule. The 15% rule states that increasing or decreasing the kVp by 15% has the same effect as doubling or halving the mAs; for example, increasing the kVp from 82 to 94 (15%) produces a similar exposure to the IR as increasing the mAs from 10 to 20.
Increasing the kVp by 15% increases the exposure to the IR unless the mAs is decreased. In addition, decreasing the kVp by 15% decreases the exposure to the IR unless the mAs is increased.
MATHEMATICAL APPLICATION
Using the 15% Rule
To increase exposure to the IR, multiply the kVp by 1.15 (original kVp + 15%):

To decrease exposure to the IR, multiply the kVp by 0.85 (original kVp − 15%):

To maintain exposure to the IR, when increasing the kVp by 15% (kVp × 1.15), divide the original mAs by 2:

When decreasing the kVp by 15% (kVp × 0.85), multiply the mAs by 2:

Kilovoltage Peak and Subject Contrast
Altering the penetrating power of the x-ray beam affects its absorption and transmission through the anatomic tissue being radiographed. Higher kVp increases the penetrating power of the x-ray beam and results in less absorption and more transmission in the anatomic tissues, which results in less variation in the x-ray intensities exiting the patient (lower subject contrast). As a result, images with lower subject contrast (more shades of gray) are produced (Fig. 6-8). When a low kVp is used, the x-ray beam penetration is decreased, resulting in more absorption and less transmission, which results in greater variation in the x-ray intensities exiting the patient. This produces an image with higher subject contrast (Fig. 6-9).
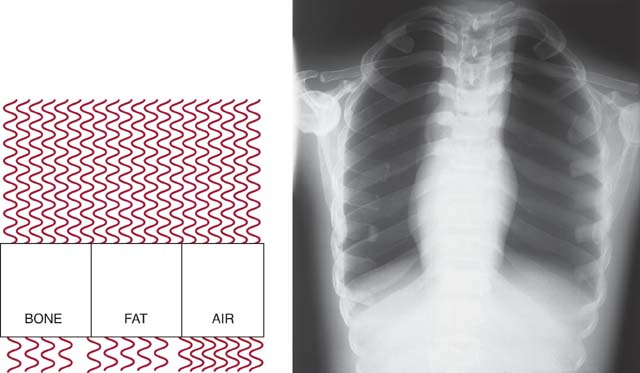
FIG. 6-8 The kVp and exit-beam intensities. Higher kVp increases the penetrating power of the x-ray beam and results in less absorption and more transmission in the anatomic tissues, resulting in less variation in the x-ray intensities exiting the patient. As a result, images with lower subject contrast are produced.
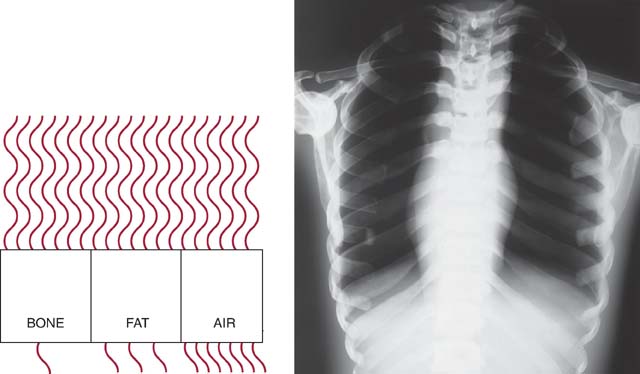
FIG. 6-9 The kVp and exit-beam intensities. Lower kVp decreases the x-ray beam penetration, resulting in more absorption and less transmission, which results in greater variation in the x-ray intensities exiting the patient. As a result, images with higher subject contrast are produced.
Changing the kVp affects the beam's absorption and transmission as it interacts with anatomic tissue; however, using a higher kVp reduces the total number of interactions and increases the amount of x-rays transmitted. In these interactions, Compton scattering increases, photoelectric absorption decreases, and more scatter exits the patient. It is important to understand that in addition to kVp affecting subject contrast, increasing kVp increases the amount of scatter (fog) reaching the IR and consequently, the radiographic contrast.
The level of radiographic contrast desired and the kVp selected depend on the type and composition of the anatomic tissue, the structures that must be visualized, and (to some extent) the diagnostician's preference. For most anatomic regions, an accepted range of kVp provides an appropriate level of subject contrast. As long as the selected kVp is sufficient to penetrate the anatomic part, radiographic contrast can be further adjusted by the computer to display the desired contrast for the anatomic region.
Radiographic images are generally not repeated because of contrast errors. If a repeat radiograph is necessary and kVp is to be adjusted either to increase or decrease the level of subject contrast, the 15% rule provides an acceptable method of adjustment. In addition, whenever a change of 15% is made in the kVp to maintain the exposure to the IR, the radiographer must adjust the mAs by a factor of 2. The selection of kVp alters its absorption and transmission through the anatomic part, regardless of the type of IR used; therefore, kVp must be wisely selected. Exposure techniques using higher kVp with lower mAs settings are recommended in digital imaging because contrast is primarily controlled during computer processing.
SECONDARY FACTORS
Many secondary or influencing factors affect the x-ray beam, amount of radiation reaching the IR, and image quality. It is important for the radiographer to understand their effects individually and in combination.
Focal Spot Size
On the control panel, the radiographer can select whether to use a small or large focal spot size. The physical dimensions of the focal spot on the anode target in x-ray tubes used in standard radiographic applications usually range from 0.5 to 1.2 mm. Small focal spot sizes are usually 0.5 or 0.6 mm, and large focal spot sizes are usually 1 or 1.2 mm. Focal spot size is determined by the filament size. When the radiographer selects a particular focal spot size, he or she is actually selecting a filament size that is energized during x-ray production. Lower mA settings are associated with the small filament, whereas higher mA settings energize the large filament. Focal spot size is an important consideration for the radiographer because it affects spatial resolution (Fig. 6-10).
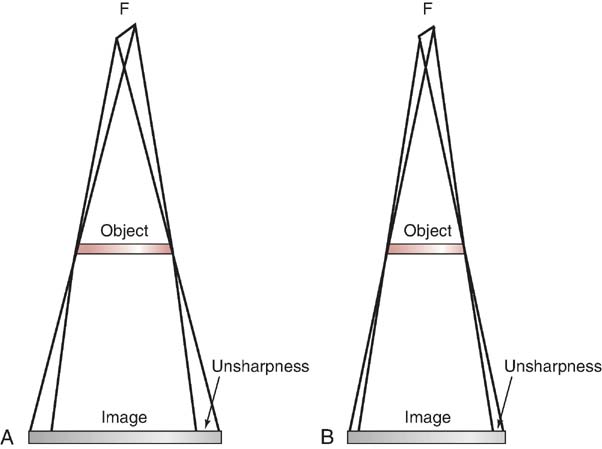
FIG. 6-10 Focal spot size and spatial resolution. Focal spot size influences the amount of unsharpness recorded in the image. As focal spot size changes, so does the amount of unsharpness. A, Larger focal spot. B, Smaller focal spot.
Generally, the smallest available focal spot size should be used for every exposure. However, exposure is limited for a small focal spot size. When a small focal spot is used, the heat created during the x-ray exposure is concentrated into a smaller area and could cause tube damage. The radiographer must weigh the importance of improved spatial resolution for a particular examination or anatomic part against the amount of radiation exposure used. Modern radiographic x-ray generators are equipped with safety circuits that prevent an exposure from being made if the exposure exceeds the tube loading capacity for the selected focal spot size. Repeated exposures made just under the limit over a long period can still jeopardize the life of the x-ray tube.
Source-to-Image-Receptor Distance
The distance between the radiation source and the IR, known as source-to-image-receptor distance (SID), affects the amount of radiation reaching the patient and subsequently the IR. Because of the divergence of the x-ray beam, the intensity of the radiation varies at different distances.
This relationship between distance and x-ray beam intensity is best described by the inverse-square law. This law states that the intensity of an x-ray beam is inversely proportional to the square of the distance from the source. Because beam intensity varies as a function of the square of the distance, SID affects the quantity of radiation reaching the IR. As SID increases, the x-ray intensity becomes spread over a larger area, decreasing the overall intensity of the x-ray beam reaching the IR (Fig. 6-11).
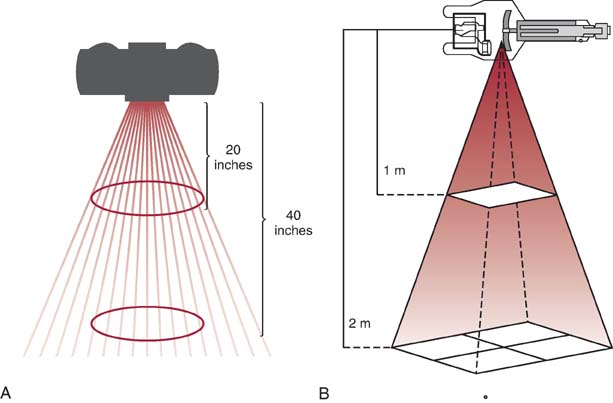
FIG. 6-11 Source-to-image-receptor distance (SID) and radiation intensity. A and B, Changing SID and its effect on the intensity of the x-ray beam reaching the IR (A) and on the divergence of the beam (B).
MATHEMATICAL APPLICATION
Inverse-Square Law Formula

If the intensity of radiation at an SID of 40 inches is equal to 400 mR, what is the intensity of radiation when the distance is increased to 72 inches?

Because increasing the SID decreases x-ray beam intensity, the mAs must be accordingly increased to maintain proper exposure to the IR. When the SID is decreased, the beam intensity increases; therefore, the mAs must be accordingly decreased to maintain proper exposure to the IR.
Maintaining consistent radiation exposure to the IR when the SID is altered requires the mAs to be adjusted to compensate. The direct square law or exposure maintenance formula provides a mathematical calculation for adjusting the mAs when changing the SID.
MATHEMATICAL APPLICATION
Direct Square Law or Exposure Maintenance Formula

Optimal exposure to the IR is achieved at an SID of 40 inches using 25 mAs. The SID must be increased to 72 inches. What adjustment of mAs is needed to maintain exposure to the IR?

Standard distances are used in radiography to provide more consistency in radiographic quality. Most diagnostic radiography is performed at an SID of 40, 48, or 72 inches. Certain circumstances, such as trauma or mobile radiography, do not permit the use of standard distances. In these circumstances, the radiographer must determine the change needed in the mAs to obtain a quality radiograph. When a 72-inch (180-cm) SID cannot be used, adjusting the SID to 56 inches (140 cm) requires half the mAs. When a 40-inch (100-cm) SID cannot be used, adjusting the SID to 56 inches (140 cm) requires twice the mAs. This quick method of calculating mAs changes should produce sufficient exposure to the IR.
In addition to altering the intensity of radiation, SID affects size distortion and spatial resolution. As the distance between the source and the IR increases, the diverging x-rays become more perpendicular to the object being radiographed and thus reduce the size distortion (magnification) produced on the image (Fig. 6-12).
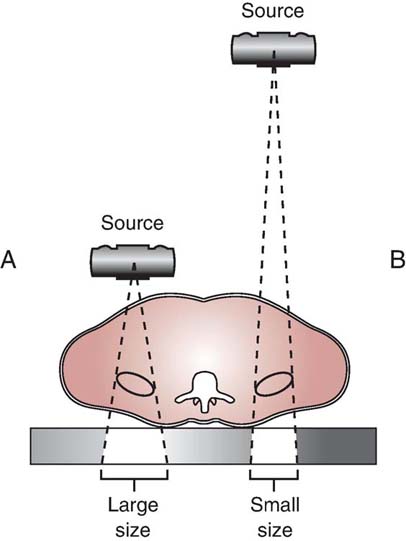
FIG. 6-12 SID and size distortion. A and B, A long SID creates less magnification than a short SID. The image in A is larger than that in B because the object is closer to the source.
Standard distances for SID are used in radiography to accommodate equipment limitations. Except for chest and cervical spine radiography, a 40-inch (100-cm) or 48-inch (120-cm) SID is standard. A greater 72-inch (180-cm) SID, such as that used for chest imaging, decreases the magnification of the heart and records its size more accurately. Increasing the SID from the standard distances may be recommended for positions that result in increased OID. For example, increase the SID when imaging the cervical spine between 60 inches (150 cm) and 72 inches (180 cm) for positions that have an increased OID, such as the lateral and oblique positions. Increasing the SID improves spatial resolution.
Object-to-Image-Receptor Distance
When distance is created between the object being radiographed and the IR, known as object-to-image-receptor distance (OID), a decrease in beam intensity may result. As the exit radiation continues to diverge, less overall intensity of the x-ray beam reaches the IR. Decreasing the exposure to the IR may require an increase in the mAs to compensate.
When sufficient distance between the object and IR exists, an air gap is created, also reducing the amount of scatter radiation from striking the IR (Fig. 6-13). Whenever the amount of scatter radiation reaching the IR is reduced, the radiographic contrast is increased. The amount of OID required to increase image contrast depends in part on the percentage of scatter radiation exiting the patient. For anatomic areas that produce a high percentage of scatter radiation, more OID is needed to increase image contrast than for anatomic areas that produce less scatter.
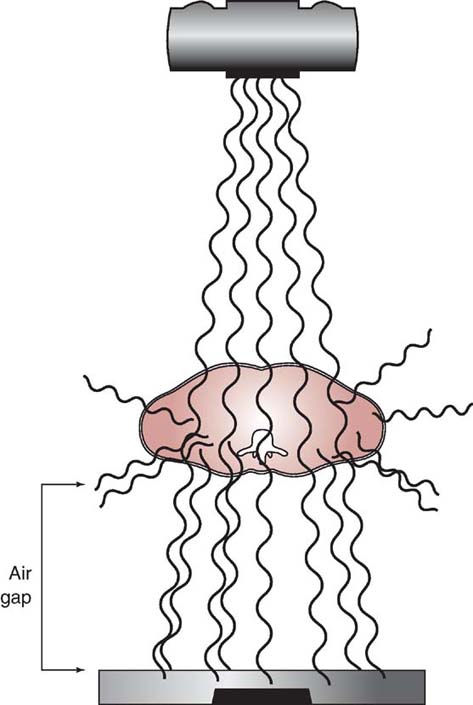
FIG. 6-13 Object-to-image-receptor distance (OID) and air gap. The distance created between the object and the IR reduces the amount of scattered radiation reaching the IR.
In addition to affecting the intensity of radiation reaching the IR, the OID affects the amount of size distortion (magnification) and spatial resolution. Optimal spatial resolution is achieved when the OID is zero. However, this OID cannot realistically be achieved in radiographic imaging because there is always some distance created between the area of interest and the IR. As the exit beam leaves the patient, it continues to diverge. When distance is created between the area of interest (within the body) and the IR, the diverging exit beam records the anatomic part with increased size distortion or magnification (Fig. 6-14).
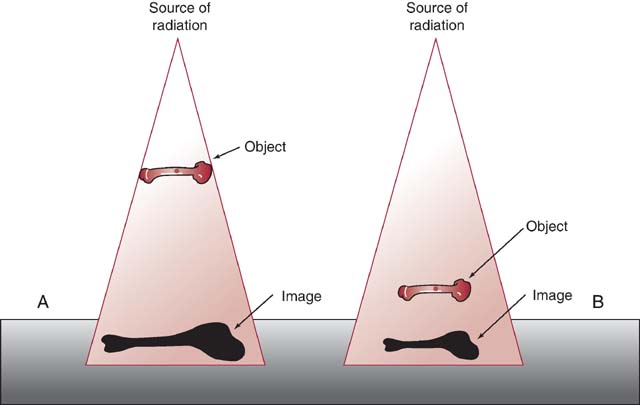
FIG. 6-14 OID and size distortion. A and B, A long OID creates more magnification than a short OID. The image in A is larger than that in B because the object is farther from the IR.
OID is a factor that affects the intensity of radiation reaching the IR, image contrast, magnification, and spatial resolution. The distance between the area of interest and the IR has the greatest effect on the amount of size distortion. The radiographer must position the area of interest as close to the IR as possible to minimize the distortion. Although the OID necessary to adversely affect image quality has not been standardized, the radiographer should minimize the OID whenever possible. In certain situations, it is difficult to minimize OID because of factors or conditions beyond the radiographer's control. In these situations, size distortion can still be reduced by increasing the SID.
Calculating Magnification
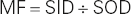
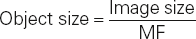
To observe the effect of distance (SID and OID) on size distortion, it is necessary to consider the magnification factor (MF). This factor indicates how much size distortion or magnification is demonstrated on a radiographic image. The MF can be mathematically expressed by the following formula:
Source-to-object distance (SOD) refers to the distance from the x-ray source (focal spot) to the object being imaged. SOD can be mathematically expressed as follows:

SOD is demonstrated in Fig. 6-15.
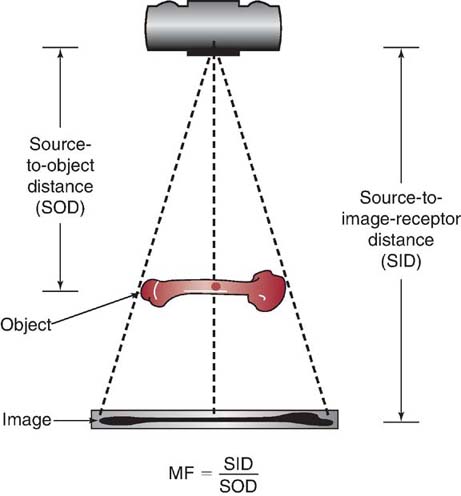
FIG. 6-15 Source-to-object distance (SOD). The SOD is the distance between the source of the x-ray and the object being radiographed.
An MF of 1 indicates no magnification, meaning that the image size matches the true object size. True object size on an image is impossible to achieve because some magnification exists on every image. MF values greater than 1 can be expressed as percentages of magnification. For example, an MF of 1.15 indicates that the image size is 15% larger than the object size.
MATHEMATICAL APPLICATION
Magnification Factor
An anteroposterior projection (AP) of the knee is produced with an SID of 40 inches and an OID of 3 inches (SOD is equal to 37 inches). What is the MF?

In the case of the Mathematical Application for MF, an MF of 1.081 means that the image size is 8.1% larger than the true object size. It should be noted that the MF computed here is a minimum. A 3-inch OID implies that the posterior surface of a patient's knee was 3 inches away from the IR for an AP projection. Anatomy that is anterior to the posterior surface of the knee, such as the patella, is farther away from the IR and is magnified even more.
It may be helpful to know the measurement of the true object size in comparison with its size on a radiographic image. After the MF is known, the object size can be determined. This requires the use of another formula:
MATHEMATICAL APPLICATION
Determining Object Size
On an AP image of a knee taken with an SID of 40 inches and an OID of 3 inches (SOD = 37 inches), the size of a lesion measures 0.5 inches in diameter on the radiographic image. The MF has been determined to be 1.081. What is the object size of this lesion?

The object size is 0.463 inches.
If the sizes of both the object and the image are known, then the percentage of magnification of the object can be calculated by the following formula:

MATHEMATICAL APPLICATION
Determining Object % of Magnification
A lesion on the radiographic image measures 1.16 cm and the lesion's (object's) true size measures 1.06 cm. What is the object % of magnification?


Perhaps the most practical use of these formulas is to observe how changing the SID and OID affects the image size. Size distortion or magnification can be increased by decreasing the SID or increasing the OID. This increase in magnification can be mathematically demonstrated using the MF and then calculating the change in the size of the object on the radiographic image. Any time magnification is increased, spatial resolution decreases.
Central Ray Alignment
Shape distortion of the anatomic area of interest can occur from inaccurate central ray (CR) alignment of the x-ray tube, the part being radiographed, or the IR. Any misalignment of the CR among these three factors alters the shape of the part recorded on the image.
For example, Fig. 6-16 demonstrates shape distortion when the anatomic part and the IR are misaligned. In addition, shape distortion can occur if the CR of the primary beam is not directed to enter or exit the anatomy as required for the particular projection or position (off centering). This shape distortion occurs because the path of individual photons in the primary beam becomes more divergent as the distance increases from the CR. The radiographer must properly control alignment of the x-ray tube, part, and IR, and he or she must properly direct the CR to minimize shape distortion. In addition to creating shape distortion, CR angulation and misalignment of the tube, part, and IR could affect the exposure to the IR. For example, when the CR is angled, the distance between the source of the radiation and the IR is increased. Generally, when the CR is angled, the SID is accordingly decreased to maintain exposure to the IR. If misalignment occurs among the tube, part, or IR, the distance between the source of radiation and the IR or the part, and the IR could be increased or decreased. This change could affect the amount of exposure to the IR, and the mAs may need adjustment.
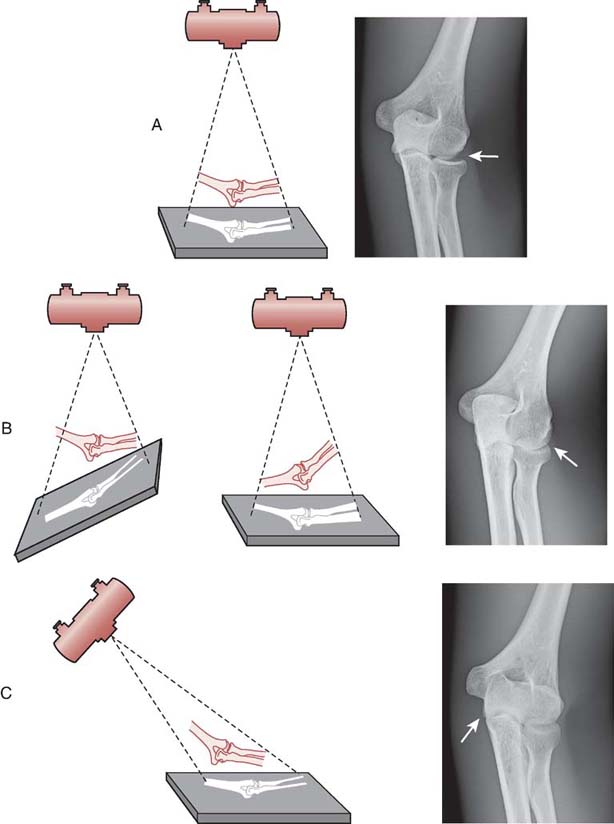
FIG. 6-16 A, Proper alignment among the x-ray tube, part, and IR. This is a quality image with minimal distortion. Note the proper alignment of the radial head with the capitulum in the image. B, Improper alignment among the x-ray tube, part, and IR. The illustration on the left shows the IR misaligned to the part, and the one on the right shows the part not parallel to the IR. This image has a distorted shape because of misalignment of the part and IR. Note the improper alignment of the radial head with the capitulum in the image. C, Improper alignment among the x-ray tube, part, and IR. This image has shape distortion because of the central ray not being perpendicular to the part. Note the elongation of the olecranon process. (From Johnston JN, Fauber TL: Essentials of Radiographic Physics and Imaging, ed 2, St. Louis, 2016, Mosby.)
Grids
A radiographic grid is a device that is placed between the part of interest and the IR to absorb scatter radiation exiting the patient. Limiting the amount of scatter radiation that reaches the IR improves the quality of the image. Much of the scatter radiation exiting the patient does not reach the IR when absorbed by a grid (Fig. 6-17). The effect of less scatter, or unwanted exposure, on the image is to increase the radiographic contrast. Grids are typically used only when the anatomic part is 10 cm (4 inches) or greater in thickness, and more than 60 kVp is needed for the exam.
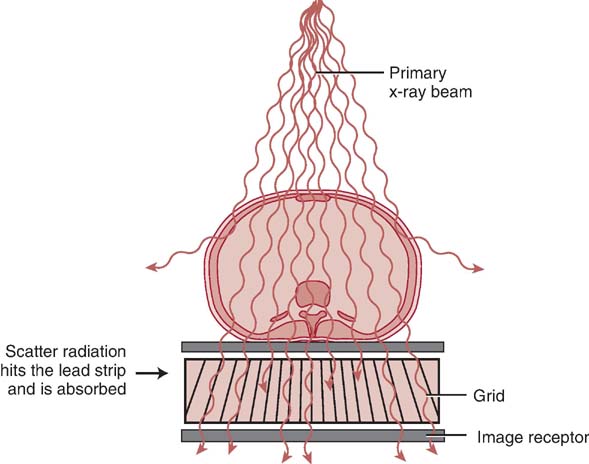
FIG. 6-17 Grids and scatter absorption. When a grid is used, much of the scatter radiation toward the IR is absorbed. (From Johnston JN, Fauber TL: Essentials of Radiographic Physics and Imaging, ed 3, St. Louis, 2020, Mosby.)
The more efficient a grid is in absorbing scatter, the greater is its effect on radiographic contrast. Grids also absorb a certain amount of the transmitted radiation exiting the patient and therefore reduce the amount of radiation reaching the IR.
When grids are used, the mAs must be adjusted to maintain exposure to the IR. In addition, the more efficient a grid is in absorbing scatter, the greater is the increase in mAs. The grid conversion formula is a mathematical formula for adjusting the mAs for changes in the type of grid.
When a grid is added, the radiographer must multiply the mAs by the correct grid conversion factor (Table 6.1) to compensate for the decrease in exposure. When a grid is removed, the mAs must be divided by the correct conversion grid factor to compensate for the increase in exposure. When the grid ratio is changed, the following formula should be used to adjust the exposure:
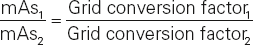
Table 6-1
| Grid Ratios | Grid Conversion Factor (GCF) |
|---|---|
| No grid | 1 |
| 5:1 | 2 |
| 6:1 | 3 |
| 8:1 | 4 |
| 12:1 | 5 |
| 16:1 | 6 |
MATHEMATICAL APPLICATION
Adjusting mAs for Changes in the Grid
A quality radiographic image is obtained using 5 mAs at 70 kVp without using a grid. What new mAs is needed when adding a 12:1 grid to maintain the same exposure to the IR?

The new mAs produces an exposure comparable to the IR without the grid.
It is important to note that brightness can be computer adjusted when the mAs is not properly adjusted for adding or changing a grid (Fig. 6-18). However, without proper mAs adjustment when adding or changing a grid, increased quantum noise or unnecessary patient radiation exposure could be the result.
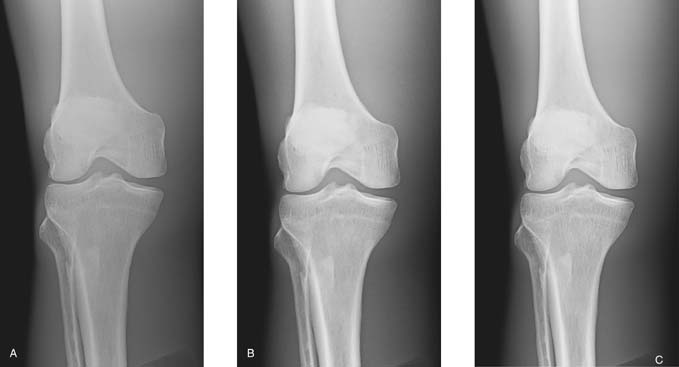
FIG. 6-18 A, A quality image created without a grid. B, An image created with a grid but no adjustment in mAs. This image has higher contrast but increased quantum noise visible. C, Image created with a grid and appropriate mAs adjustment. This image has higher contrast than image A and less quantum noise visible than image B. (From Johnston JN, Fauber TL: Essentials of Radiographic Physics and Imaging, ed 3, St. Louis, 2020, Elsevier.)
Grid construction and efficiency are discussed in greater detail in Chapter 7.
Beam Restriction
Any change in the size of the x-ray field alters the amount of tissue irradiated. A larger field size (decreasing collimation) increases the amount of tissue irradiated, causing more scatter radiation to be produced, thus increasing the amount of radiation reaching the IR. The increased amount of scatter (fog) reaching the IR results in less radiographic contrast. Conversely, a smaller field size (increasing collimation) reduces the amount of tissue irradiated, the amount of scatter radiation produced, and the amount of radiation reaching the IR. The decreased amount of scatter radiation reaching the IR results in higher radiographic contrast but requires an increase in the mAs. The effect of collimation is greater when imaging large anatomic areas, performing examinations without a grid, and using a high kVp.
Generator Output
Exposure techniques and radiation output depend on the type of generator used. Generators with more efficient output, such as three-phase or high-frequency units, require lower exposure technique settings to produce an image comparable with single-phase units (Fig. 6-19). The radiographer must be aware of the generator output when using different types of equipment, especially when performing examinations in different departments. For example, imaging a knee using a single-phase generator requires more mAs than imaging a knee using a three-phase generator. In addition, x-ray generators must be periodically calibrated to ensure that they are producing consistent radiation output.
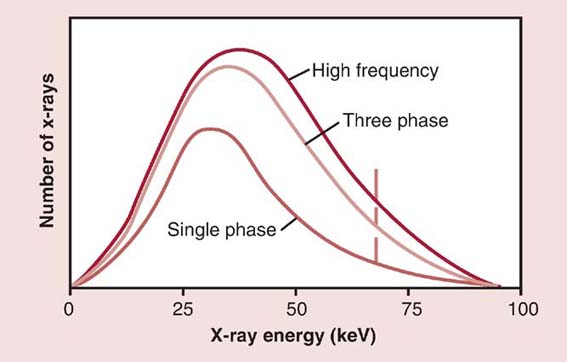
FIG. 6-19 Generators and radiation output. The quantity (amplitude) and the quality (shift to the right) of the x-ray beam are increased when using high-frequency and three-phase generators because they are more efficient in x-ray production. (From Johnston JN, Fauber TL: Essentials of Radiographic Physics and Imaging, ed 2, St. Louis, 2016, Mosby.)
Tube Filtration
Small variations in the amount of tube filtration should not have any effect on radiographic quality. Variability of the x-ray tube filtration should be checked as a part of routine quality control checks on the radiographic equipment. X-ray tubes with excessive or insufficient filtration may affect image quality. Increasing the amount of tube filtration increases the ratio of higher-penetrating x-rays to lower-penetrating x-rays. As a result, the average energy of the x-ray beam has been increased and can increase the amount of scatter radiation reaching the IR. The increased x-ray energy (kVp) and scatter production decrease radiographic contrast. In addition, increasing the tube filtration decreases the quantity of radiation reaching the patient (Fig. 6-20). Insufficient tube filtration increases the quantity of radiation and decreases the ratio of higher-penetrating x-rays to lower-penetrating x-rays. As a result, the average energy of the x-ray beam has been decreased, which can decrease the amount of scattered radiation reaching the IR. The decreased x-ray energy (kVp) and scatter production increase radiographic contrast. The amount of tube filtration should not vary greatly, and therefore, small changes would not have a visible effect on radiographic contrast.
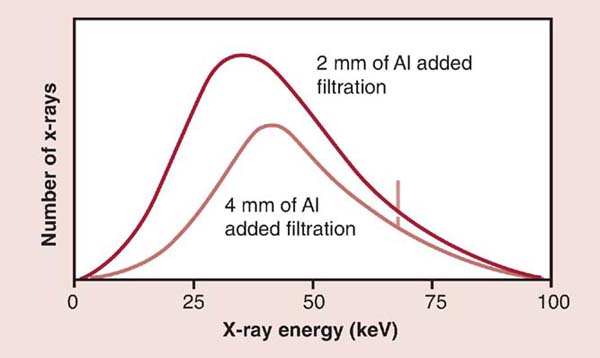
FIG. 6-20 Tube filtration and radiation output. Increasing beam filtration decreases the quantity (amplitude) and increases the quality (shift to the right) of the x-ray beam. Al, Aluminum. (From Johnston JN, Fauber TL: Essentials of Radiographic Physics and Imaging, ed 2, St. Louis, 2016, Mosby.)
Compensating Filters
When imaging an anatomic area that varies greatly in tissue thickness, a compensating filter (discussed in Chapter 2) can be placed in the primary beam to produce a more uniform exposure to the IR. The use of compensating filters requires an increase in the mAs to maintain the overall exposure to the IR. The amount of increase in the mAs depends on the thickness and type of compensating filter. In addition, the use of a compensating filter increases the exposure to the patient and is not typically used in routine radiography.
PATIENT FACTORS
Body Habitus
Body habitus refers to the general form or build of the body, including its size. It is important for the radiographer to consider body habitus when establishing exposure techniques. There are generally four types of body habitus: sthenic, hyposthenic, hypersthenic, and asthenic (Fig. 6-21).
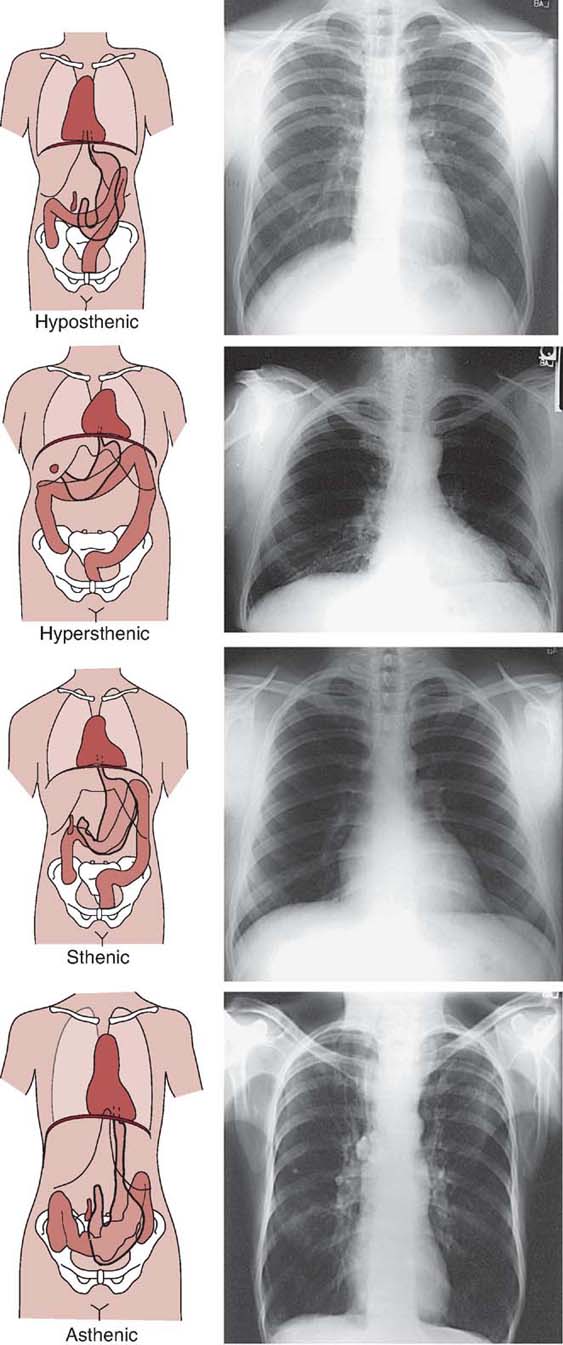
FIG. 6-21 Four types of body habitus. (From Johnston JN, Fauber TL: Essentials of Radiographic Physics and Imaging, ed 2, St. Louis, 2016, Mosby.)
The sthenic body habitus is commonly called a normal or average build. The hyposthenic type refers to a similar type of body habitus as sthenic but with a tendency toward a more slender and taller build. Together, the sthenic and hyposthenic types of body habitus are, in terms of establishing radiographic techniques, classified as normal or average for the adult population.
Hypersthenic and asthenic body habitus types are more extreme. The hypersthenic body habitus refers to a large, stocky build. These individuals have thicker part sizes compared with sthenic or hyposthenic individuals, so the exposure factors for their radiographic examinations are higher.
Asthenic refers to a very slender body habitus, and exposure factors for asthenic individuals are at the low end of technique charts because their respective part sizes are thinner than those of sthenic and hyposthenic individuals.
Part Thickness
The thickness of the anatomic part being imaged affects the amount of x-ray beam attenuation that occurs. A thick part absorbs more radiation, whereas a thin part transmits more radiation. Maintaining the exposure to the IR when imaging a thicker part requires the mAs to be accordingly increased (Fig. 6-22). In addition, when a thinner anatomic part is being radiographed, the mAs must be accordingly decreased.
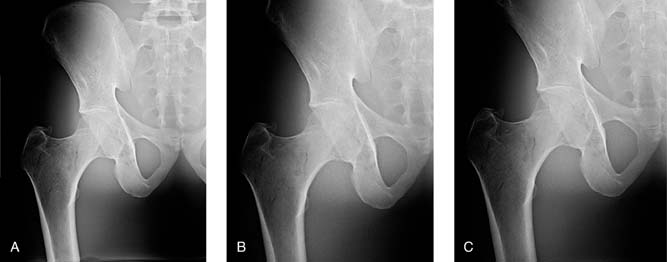
FIG. 6-22 A, A quality image. B, Image created with added thickness and no mAs adjustment, which results in increased quantum noise visible. C, Image created with added patient thickness and appropriate mAs adjustment, which results in decreased quantum noise visible. (From Johnston JN, Fauber TL: Essentials of Radiographic Physics and Imaging, ed 3, St. Louis, 2020, Elsevier, Inc.)
Because x-rays are exponentially attenuated, a general guideline is that for every change in part thickness of 4 to 5 cm (1.6–2 inches), the radiographer should adjust the mAs by a factor of 2 (Fig. 6-23). For example, an optimal image is obtained using 20 mAs on an anatomic part measuring 18 cm (7 inches). The same anatomic part is radiographed in another similar patient and it measures 23 cm (9 inches). What new mAs is needed to expose the IR? Because the part thickness increased by 5 cm (2 inches), the original mAs is multiplied by 2, yielding 40 mAs. If the same part in another patient measures 28 cm (11 inches), what new mAs is needed? Because the part thickness increased by another 5 cm (2 inches), the mAs is multiplied by 2, yielding 80 mAs. This mAs is four times greater than that for the original patient's anatomic part, which measured 10 cm (4 inches) less.
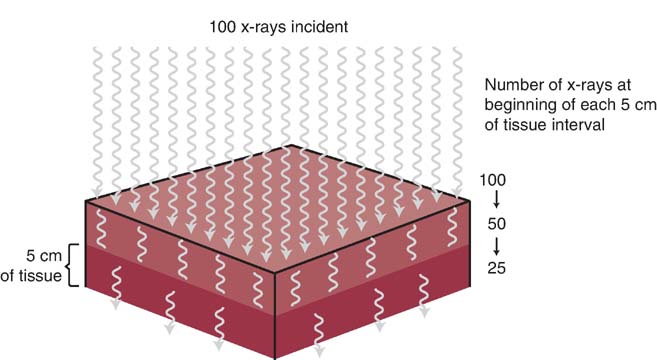
FIG. 6-23 X-rays are exponentially attenuated and generally reduced by approximately 50% for each 4 to 5 cm (1.6–2 inches) of tissue thickness. (From Johnston JN, Fauber TL: Essentials of Radiographic Physics and Imaging, ed 2, St. Louis, 2016, Mosby.)
As the thickness of a given type of anatomic tissue increases, the amount of scattered radiation increases, and radiographic contrast decreases. Using a higher kVp for a thicker part only adds to the increase in scatter radiation. Increased scatter radiation would continue degrading the quality of the image because it creates fog, which decreases the contrast.
The amount of radiographic contrast achieved is also influenced by the composition of the anatomic part to be radiographed. As mentioned in Chapter 3, subject contrast is a category of radiographic contrast. The thickness of the tissue, effective atomic number, and cell compactness (tissue density) affect its absorption characteristics. The absorption characteristics of the anatomic tissue create the brightness levels produced on a radiographic image. Tissues that have a higher effective atomic number absorb more radiation than tissues with a lower effective atomic number.
Anatomic structures having a wide range of tissue compositions, varying in parameters such as effective atomic number and tissue density, demonstrate high subject contrast (Fig. 6-24). Anatomic structures consisting of a similar type of tissue demonstrate low subject contrast (Fig. 6-25). The radiographer cannot control the composition of the anatomic part to be radiographed. Changing the kVp alters its absorption and transmission within anatomic tissues. Knowledge about the absorption characteristics of anatomic tissues and the effect of kVp helps the radiographer produce a desired level of radiographic contrast.
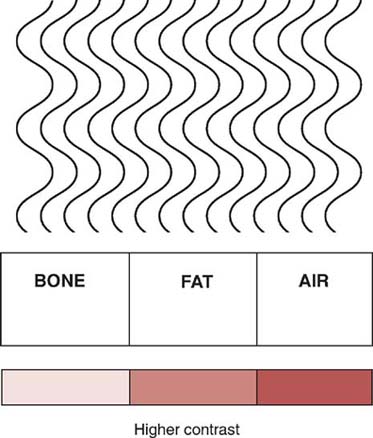
FIG. 6-24 Higher subject contrast resulting from great differences in radiation absorption between tissues that vary greatly in composition.
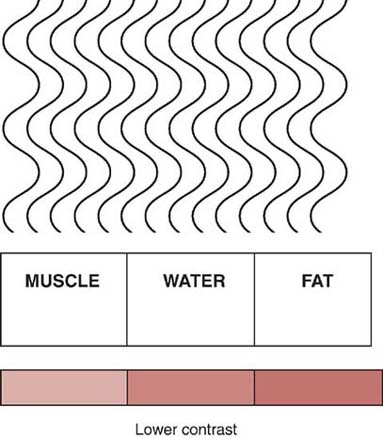
FIG. 6-25 Lower subject contrast resulting from fewer differences in radiation absorption between tissues that are more similarly composed.
The quality of a radiographic image depends on a multitude of variables. Knowledge of these variables and their radiographic effect assists the radiographer in producing quality radiographs. Table 6.2 summarizes common exposure technique mathematical calculations. Table 6.3 is a chart demonstrating how the variables discussed in this chapter affect the primary beam and IR exposure, and Table 6.4 is a chart demonstrating how the variables discussed in this chapter affect image quality.
Table 6-2
| Exposure Technique Factor | Relationship to Maintain Exposure to Image Receptor | Formula |
|---|---|---|
| mAs | ↑ mA and ↓ second | mA × second = mAs |
| kVp: 15% rule | ↑ kVp and ↓ mAs | kVp × 1.15 and mAs/2 kVp × .85 and mAs × 2 |
| Direct square law or exposure maintenance formula | ↑ SID and ↑ mAs |
|
| Grid conversion factor (GCF): No grid = 1 5:1 = 2 6:1 = 3 8:1 = 4 12:1 = 5 16:1 = 6 |
↑ Grid ratio and ↑ mAs |
|
| Magnification factor (MF) | ↑ OID and ↓ SID will ↑ magnification |
Image size = Object size × MF |
| Patient thickness | ↑ Thickness and ↑ mAs | Every 4- to 5-cm change in thickness change mAs by a factor of 2 |


kVP, Kilovoltage peak; mAs, milliamperage-seconds; OID, object-to-image-receptor distance; SID, source-to-image-receptor distance; SOD, source-to-object distance.
Table 6-3
| Primary Beam Reaching the Patient | Remnant Beam Reaching the Image Receptor | |
|---|---|---|
| mAs | ||
| Increasing mAs | ↑ Quantity | ↑ Quantity |
| Decreasing mAs | ↓ Quantity | ↓ Quantity |
| kVp | ||
| Increasing kVp | ↑ Quantity and quality | ↑ Quantity and quality |
| Decreasing kVp | ↓ Quantity and quality | ↓ Quantity and quality |
| Focal Spot Size | ||
| Smaller focal spot size | No effect | No effect |
| Larger focal spot size | No effect | No effect |
| SID | ||
| Increasing SID | ↓ Quantity | ↓ Quantity |
| Decreasing SID | ↑ Quantity | ↑ Quantity |
| OID | ||
| Increasing OID | No effect | ↓ Quantity and scatter |
| Decreasing OID | No effect | ↑ Quantity and scatter |
| CR Angle | ||
| Increase CR Anglea | ↓ Quantity | ↓ Quantity |
| Grid | ||
| Increasing grid ratio | No effect | ↓ Quantity and scatter |
| Decreasing grid ratio | No effect | ↑ Quantity and scatter |
| Beam Restriction | ||
| Increasing collimation | ↓ Quantity | ↓ Quantity and scatter |
| Decreasing collimation | ↑ Quantity | ↑ Quantity and scatter |
| Generator Output | ||
| Single-phase generator | ↓ Quantity and quality | ↓ Quantity and quality |
| High-frequency generator | ↑ Quantity and quality | ↑ Quantity and quality |
| Tube Filtration | ||
| Adding Filtration | ↓ Quantity and ↑ average energy | ↓ Quantity and ↑ average energy |
| Removing Filtration | ↑ Quantity and ↓ average energy | ↑ Quantity and ↓ average energy |
| Compensating Filter | ||
| Adding a compensating filter | ↓ Quantity | ↓ Quantity |
| Part Thickness | ||
| Increasing part thickness | No effect | ↓ Quantity |
| Decreasing part thickness | No effect | ↑ Quantity |
aWithout a decrease in source-to-image-receptor distance (SID).
CR, Central ray; kVP, kilovoltage peak; mA, milliamperage; mAs, milliamperage-seconds; OID, object-to-image-receptor distance; SID, source-to-image-receptor distance.
Table 6-4
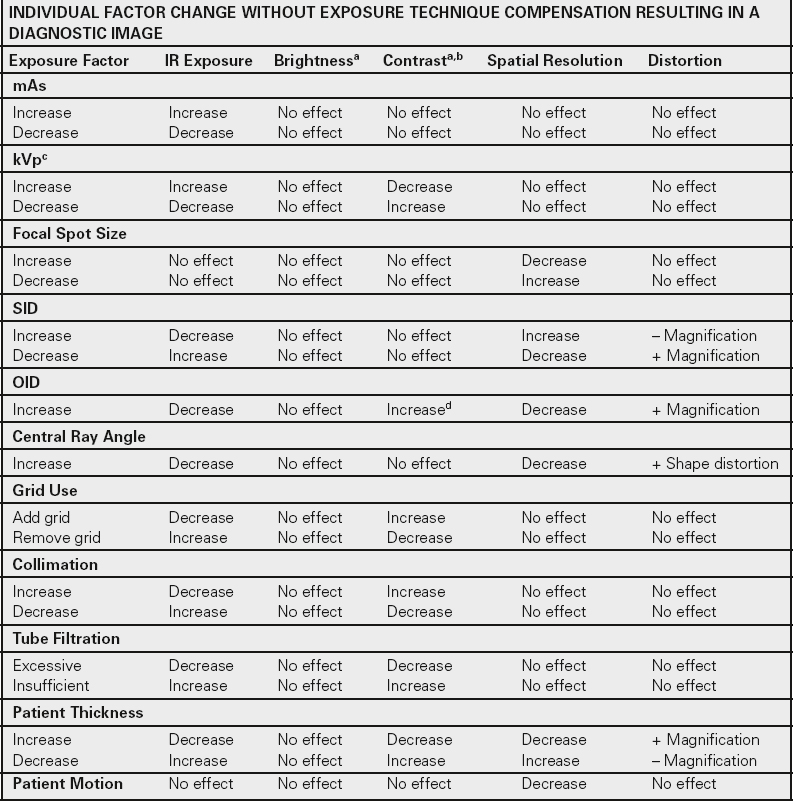
| INDIVIDUAL FACTOR CHANGE WITHOUT EXPOSURE TECHNIQUE COMPENSATION RESULTING IN A DIAGNOSTIC IMAGE | |||||
|---|---|---|---|---|---|
| Exposure Factor | IR Exposure | Brightnessa | Contrasta,b | Spatial Resolution | Distortion |
| mAs | |||||
| Increase Decrease |
Increase Decrease |
No effect No effect |
No effect No effect |
No effect No effect |
No effect No effect |
| kVpc | |||||
| Increase Decrease |
Increase Decrease |
No effect No effect |
Decrease Increase |
No effect No effect |
No effect No effect |
| Focal Spot Size | |||||
| Increase Decrease |
No effect No effect |
No effect No effect |
No effect No effect |
Decrease Increase |
No effect No effect |
| SID | |||||
| Increase Decrease |
Decrease Increase |
No effect No effect |
No effect No effect |
Increase Decrease |
– Magnification + Magnification |
| OID | |||||
| Increase | Decrease | No effect | Increased | Decrease | + Magnification |
| Central Ray Angle | |||||
| Increase | Decrease | No effect | No effect | Decrease | + Shape distortion |
| Grid Use | |||||
| Add grid Remove grid |
Decrease Increase |
No effect No effect |
Increase Decrease |
No effect No effect |
No effect No effect |
| Collimation | |||||
| Increase Decrease |
Decrease Increase |
No effect No effect |
Increase Decrease |
No effect No effect |
No effect No effect |
| Tube Filtration | |||||
| Excessive Insufficient |
Decrease Increase |
No effect No effect |
Decrease Increase |
No effect No effect |
No effect No effect |
| Patient Thickness | |||||
| Increase Decrease |
Decrease Increase |
No effect No effect |
Decrease Increase |
Decrease Increase |
+ Magnification – Magnification |
| Patient Motion | No effect | No effect | No effect | Decrease | No effect |
a Brightness and contrast can be adjusted by the computer.
b Increase is higher contrast, and decrease is lower contrast.
c Kilovoltage peak (kVp) affects subject contrast.
d Increase (higher) contrast because of less scatter reaching image rector; effect dependent on anatomic region, thickness, and amount of object-to-image-receptor distance (OID).
IR, Image receptor; mAs, milliamperage-seconds; SID, source-to-image-receptor distance.
CHAPTER SUMMARY
- • The product of mA and exposure time (mAs) is directly proportional to the quantity of x-rays produced and exposure to the IR.
- • The mA and exposure time have an inverse relationship to maintain exposure to the IR.
- • The kVp changes the penetrating power of the x-ray beam and has a direct effect on exposure to the IR.
- • Changing the kVp by 15% has the same effect on exposure to the IR as changing the mAs by a factor of 2.
- • A numerical value or exposure indicator is displayed on the processed digital image that indicates the level of x-ray exposure received (incident exposure) on the IR.
- • The kVp has an inverse relationship with subject contrast: a high kVp creates an image with low subject contrast, and a low kVp creates an image with high subject contrast.
- • Brightness and contrast are primarily controlled by computer processing in digital imaging.
- • Focal spot size affects only spatial resolution. A smaller focal spot size increases spatial resolution.
- • SID has an inverse squared relationship with the intensity of radiation reaching the patient and the IR.
- • Increasing OID decreases exposure to the IR.
- • Decreasing SID and increasing OID increases size distortion (magnification) and decreases spatial resolution.
- • Grids absorb the scatter radiation exiting the patient and increase radiographic contrast.
- • Beam restriction affects the amount of tissue irradiated, scatter produced, and exposure to the IR.
- • Changes in SID, grids, and patient thickness require a change in mAs to maintain the exposure to the IR.
- • Generators with more efficient output, such as three-phase or high-frequency generators, require lower exposure techniques to produce the same exposure to the IR as a single-phase generator.
- • Excessive or insufficient tube filtration affects the exposure to the IR and contrast.
- • Exposure factors may need to be modified for body habitus and part thickness.
REVIEW QUESTIONS
1. Which of the following is accurate regarding the relationship between milliamperage (mA) and exposure time to maintain the exposure to the image receptor (IR)?
A. Direct proportional
B. Direct
C. Inverse
D. Inverse proportional
2. The exposure indicator value reflects excessive exposure to the IR. Which of the following is the best for correcting the exposure error?
A. Decrease kVp by 50%
B. Increase mAs by 15%
C. Decrease mAs by 50%
D. Decrease mAs by 15%
3. What exposure factor affects both the quality and the quantity of the x-ray beam?
A. kVp
B. SID
C. mA
D. Focal spot size
4. Which of the following is not affected by kilovoltage?
A. Compton interactions
B. Spatial resolution
C. Subject contrast
D. Radiation quantity
5. Increasing the mAs has __________ effect on brightness displayed in digital imaging.
A. a direct
B. a proportional
C. an inverse
D. no
6. Which of the following would maintain radiation exposure to the IR when the kilovoltage is decreased by 15%?
A. Increase mAs by 15%.
B. Increase mAs by 50%.
C. Double the mAs.
D. Halve the mAs.
7. A quality image is produced using 70 kVp and 25 mAs at a 40-inch SID. What calculated change in the exposure technique is necessary to maintain radiation exposure to the IR when the SID is increased to 56 inches?
A. 60 kVp at 25 mAs
B. 70 kVp at 12.5 mAs
C. 70 kVp at 50 mAs
D. 60 kVp at 50 mAs
8. Without exposure technique compensation, increasing the OID by 4 for a knee film image would
1. increase magnification.
2. decrease exposure to IR.
3. increase contrast.
A. 1 and 2 only
B. 1 and 3 only
C. 2 and 3 only
D. 1, 2, and 3
9. A quality image is produced using 80 kVp at 10 mAs with a 6:1 ratio grid. Calculate the change in exposure technique to maintain radiation exposure to the IR when changing to a 12:1 ratio grid.
A. 80 kVp at 17 mAs
B. 68 kVp at 20 mAs
C. 80 kVp at 6 mAs
D. 92 kVp at 5 mAs
10. Which of the following factors does not affect spatial resolution?
A. Focal spot size
B. SID
C. OID
D. Grid
11. Which of the following factors does not affect the radiation exposure to the IR?
A. Collimation
B. Focal spot size
C. Compensating filters
D. Body habitus
12. What exposure factor change is recommended to maintain radiation exposure to the IR when increasing the patient thickness by 5 cm?
A. Double the kVp
B. Double the mAs
C. Decrease kVp by 15%
D. Increase mAs by 15%