Chapter 708 Reference Intervals for Laboratory Tests and Procedures
In Tables 708-1 through 708-6 (found on the Nelson Textbook of Pediatrics website at www.expertconsult.com  ), the reference intervals apply to infants, children, and adolescents when possible. For many analyses, however, separate reference intervals for children and adolescents are not well delineated. When interpreting a test result, the reference interval supplied by the laboratory performing the test should always be used as these intervals are instrument and/or method dependent. See Figures 708-1 to 708-3 (also located on the Nelson Textbook of Pediatrics website at www.expertconsult.com ) for estimations related to dosages.
Table 708-1 PREFIXES DENOTING DECIMAL FACTORS
| PREFIX | SYMBOL | FACTOR |
|---|---|---|
| Mega- | M | 106 |
| Kilo- | k | 103 |
| Hecto- | h | 102 |
| Deka- | da | 101 |
| Deci- | d | 10−1 |
| Centi- | c | 10−2 |
| Milli- | m | 10−3 |
| Micro- | µ | 10−6 |
| Nano- | n | 10−9 |
| Pico- | p | 10−12 |
| Femto- | f | 10−15 |
| Ab | Absorbance |
| AU | Arbitrary unit |
| BB | Brain isoenzyme of creatine kinase |
| cap | Capillary |
| CH50 | Dilution required to lyse 50% of indicator red blood cells; indicates complement activity |
| Cr | Creatinine |
| CSF | Cerebrospinal fluid |
| F | Female |
| g | Gram |
| hr | Hour, hours |
| Hb | Hemoglobin |
| HbCO | Carboxyhemoglobin |
| hpf | High-power field |
| IU | International unit of hormone activity |
| L | Liter |
| M | Male |
| MB | Heart isoenzyme of creatine kinase |
| mEq/L | Milliequivalents per liter |
| min | Minute, minutes |
| mm3 | Cubic millimeter, microliter (µL) |
| mm Hg | Millimeters of mercury |
| mo | Month, months |
| mol | Mole |
| mmol | Millimole |
| mOsm | Milliosmole |
| MW | Relative molecular weight |
| ND | Not detected |
| nm | Nanometer (wavelength) |
| Pa | Pascal |
| pc | Postprandial |
| RBC | Red blood cell(s), erythrocyte(s) |
| RT | Room temperature |
| sec | Second, seconds |
| SD | Standard deviation |
| Tr | Trace |
| U | International unit of enzyme activity |
| V | Volume |
| WBC | White blood cell(s) |
| WHO | World Health Organization |
| wk | Week, weeks |
| yr | Year, years |
| > | Greater than |
| ≥ | Greater than or equal to |
| < | Less than |
| ≤ | Less than or equal to |
| ± | Plus or minus |
| ≈ | Approximately equal to |
Table 708-4 ABBREVIATIONS FOR SPECIMENS
| S | Serum |
| P | Plasma |
| (H) | Heparin |
| (LiH) | Lithium heparin |
| (E) | Ethylenediaminetetraacetic acid (EDTA) |
| (C) | Citrate |
| (O) | Oxalate |
| W | Whole blood |
| U | Urine |
| F | Feces |
| CSF | Cerebrospinal fluid |
| AF | Amniotic fluid |
| (NaC) | Sodium citrate |
| (NH4H) | Ammonium heparinate |
| 30°C, 37°C | Temperature of enzymatic analysis (Celsius) |
| a | Values obtained are significantly method-dependent |
| b | Values in older males are higher than those in older females |
| c | Values in older females are higher than those in older males |
| d | Atomic absorption |
| e | Borate affinity chromatography |
| f | Cation-exchange chromatography |
| g | Vitros, a proprietary analytic system of Ortho Clinical Diagnostics, Inc. |
| i | Electrophoresis |
| j | Enzymatic assay |
| k | Enzyme-amplified immunoassay |
| l | Fluorometric method |
| m | Fluorescence-activated cell sorting (FACS) |
| n | Fluorescence polarization |
| o | Gas chromatography |
| p | High-performance liquid chromatography (HPLC) |
| q | Indirect fluorescence antibody (IFA) assay |
| r | Ion-selective electrode |
| s | Nephelometry |
| t | Optical density |
| u | Radial immunodiffusion (RID) |
| v | Radioimmunoassay (RIA) |
| w | Spectrophotometry |
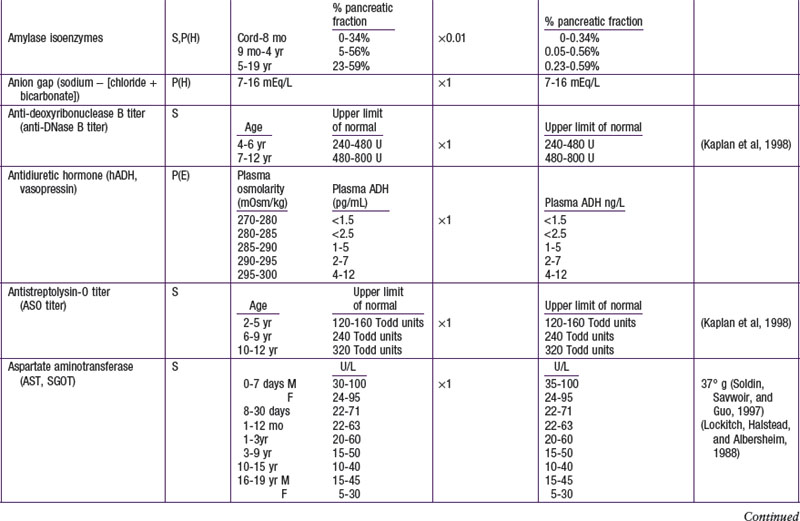
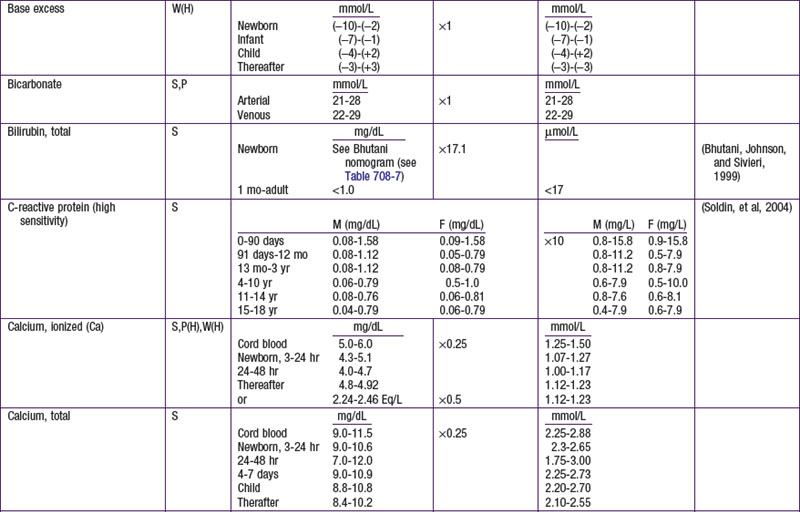
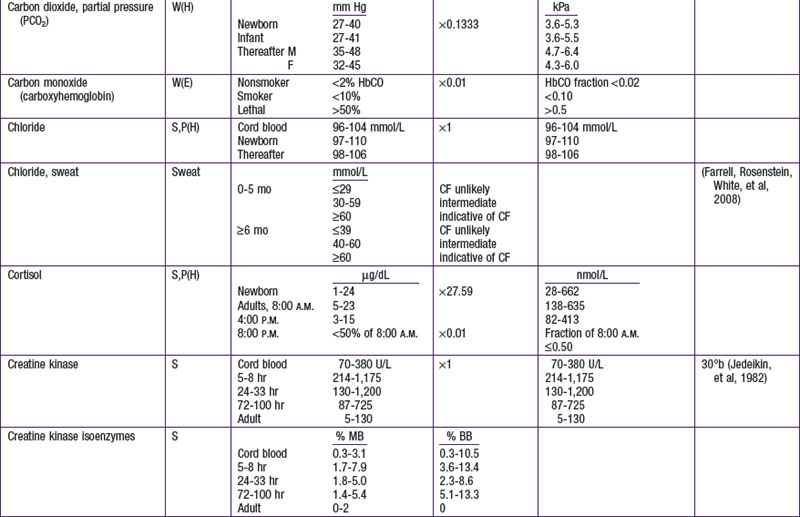
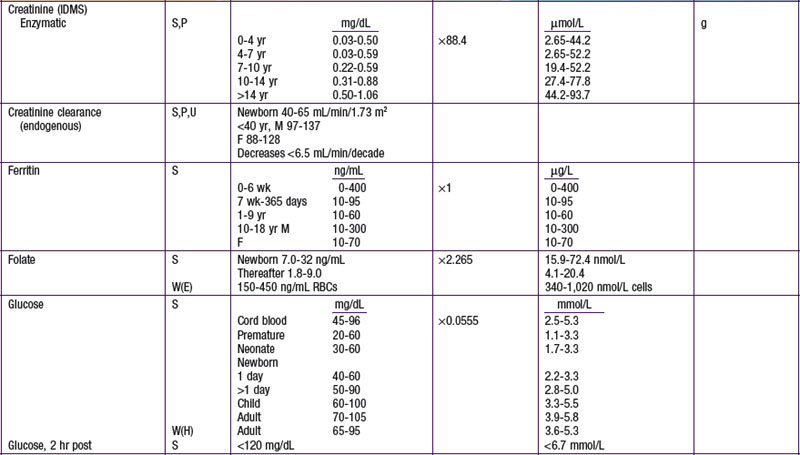
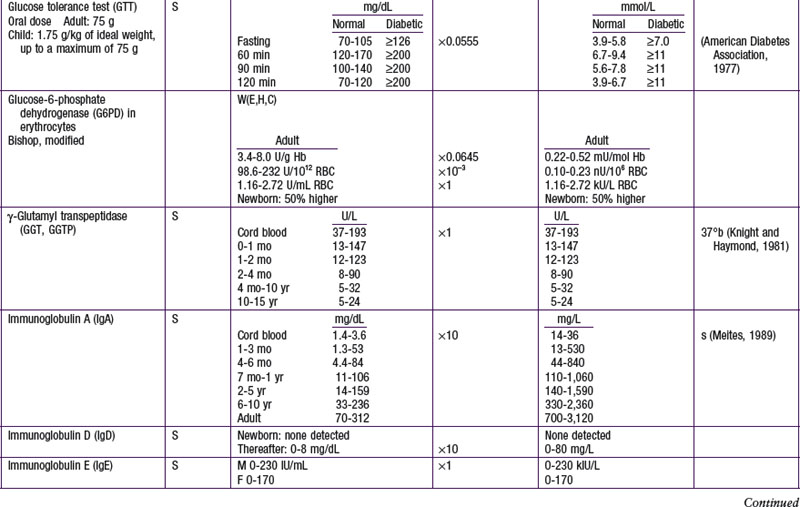
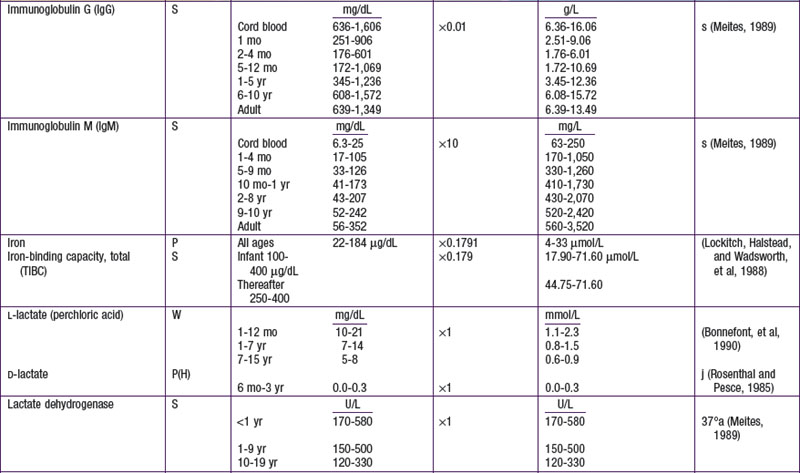
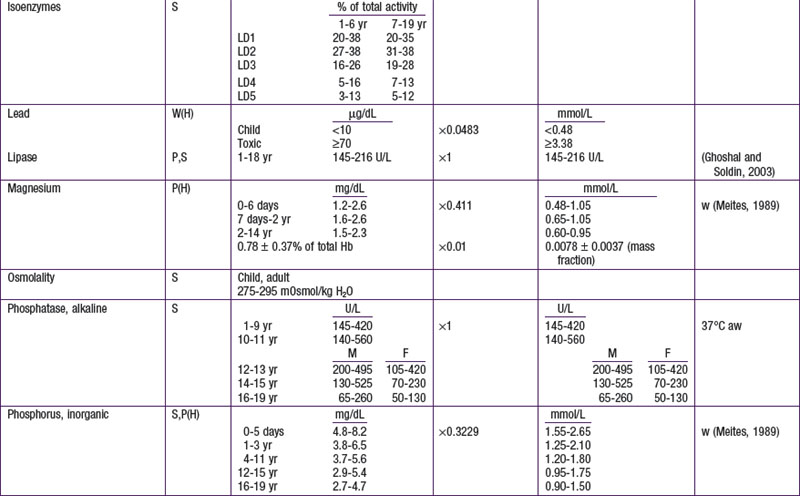
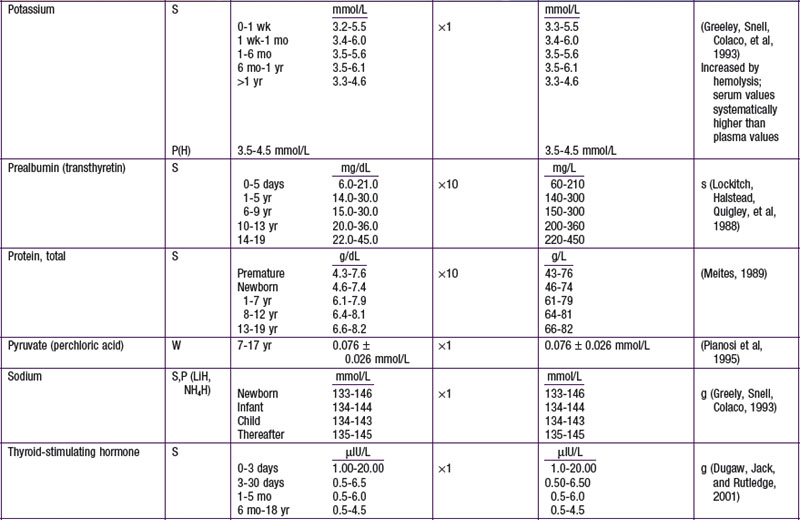
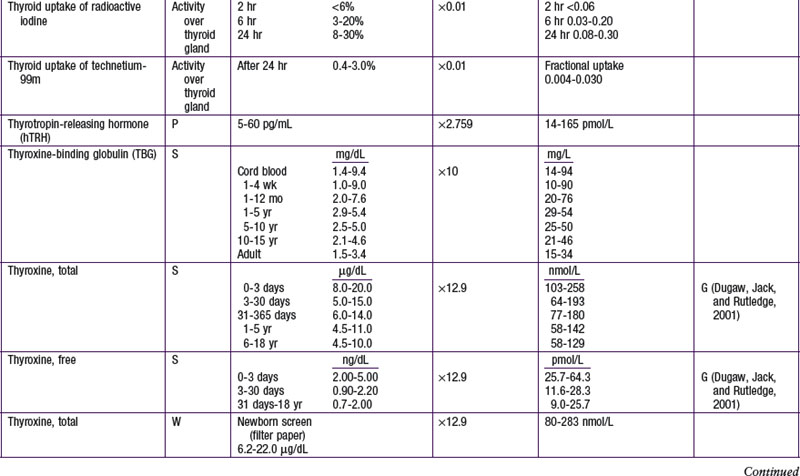
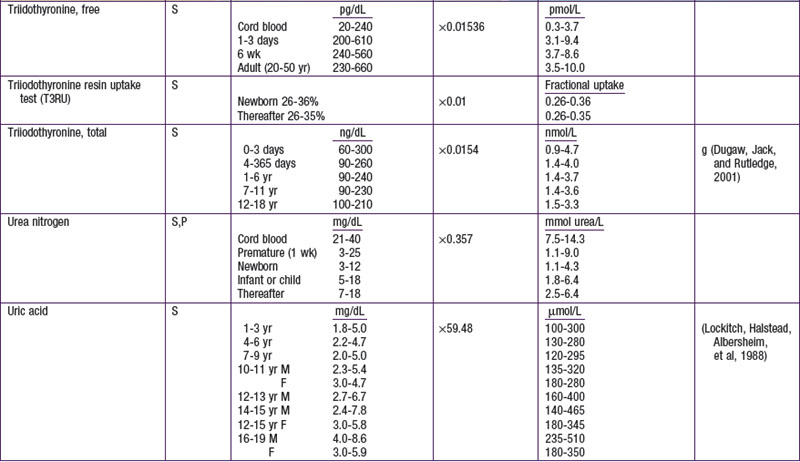
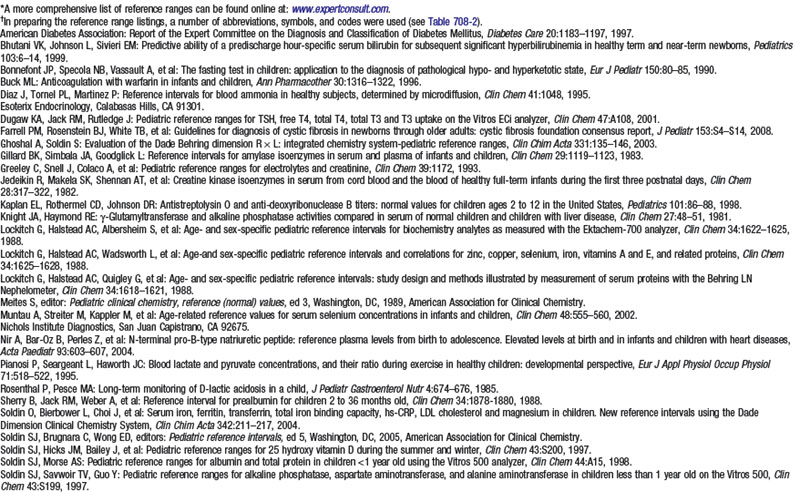
Table 708-7 COMPOSITION OF COMMONLY USED ORAL AND PARENTERAL SOLUTIONS (RAYMOND ADELMAN AND MICHAEL SOLHAUG) [SEE RELATED CONVERSION TABLES 708-8 TO 708-10]
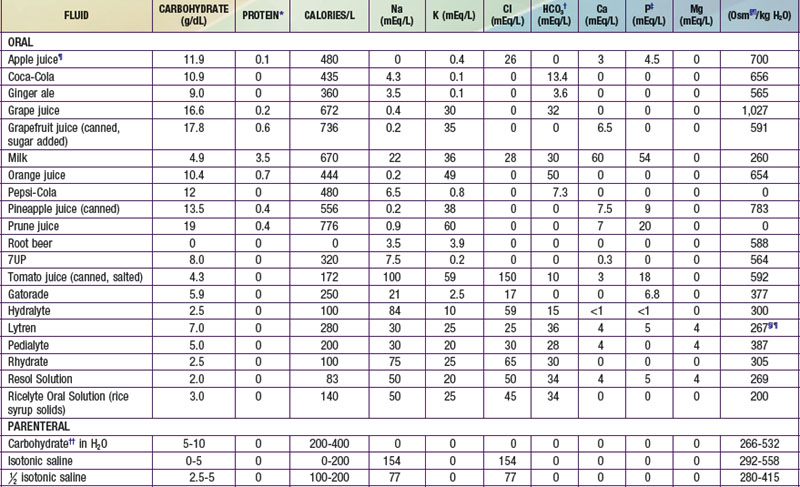
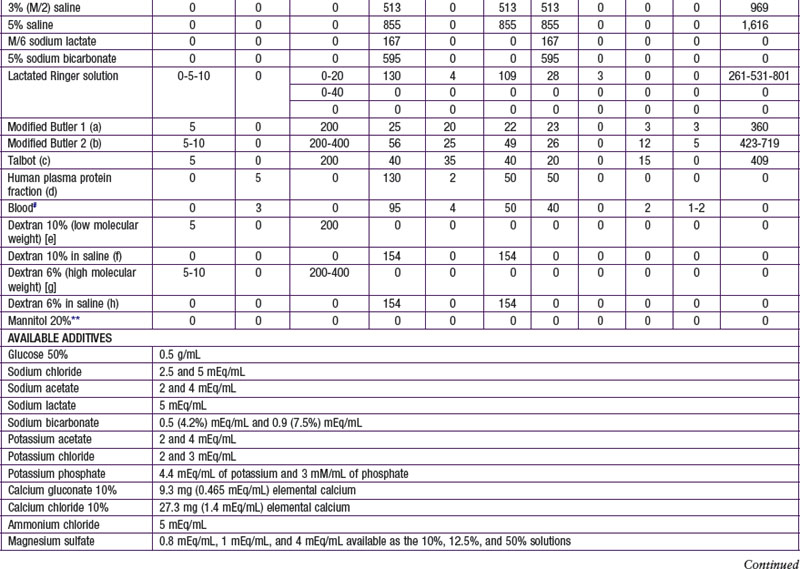
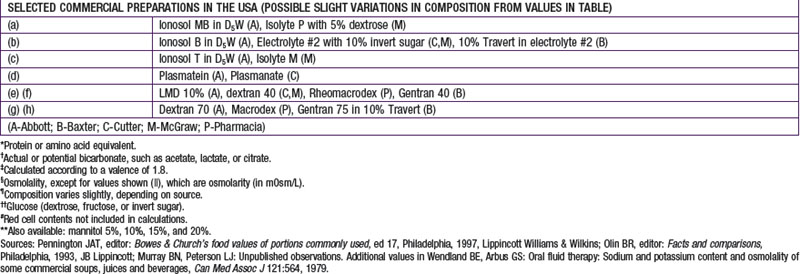
Table 708-8 METHOD FOR CONVERSION OF MILLIGRAMS TO MILLIEQUIVALENTS PER LITER (OR TO MILLIMOLES PER LITER)
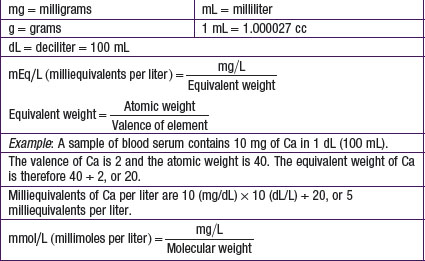
Table 708-9 FACTORS OF CONVERSION OF CONCENTRATION EXPRESSED IN MILLIEQUIVALENTS PER LITER TO MILLIGRAMS PER DECILITER (100 L), AND VICE VERSA, FOR COMMON IONS THAT OCCUR IN PHYSIOLOGIC SOLUTIONS
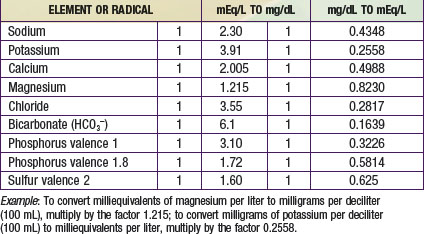
Table 708-10 MILLIEQUIVALENTS AND MILLIGRAMS OF CATIONS AND ANIONS PRESENT IN 1 MILLIMOLE OF SALTS COMMONLY USED IN PHYSIOLOGIC SOLUTIONS
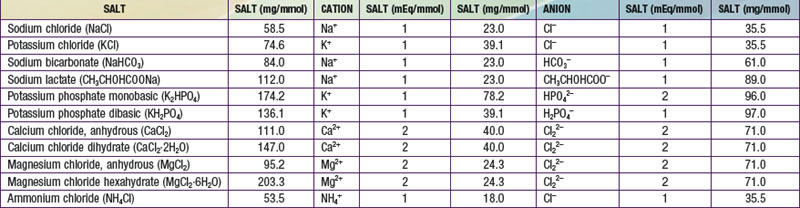
Table 708-11 FOOD COMPOSITION FOR SHORT METHOD OF DIETARY ANALYSIS (LEWIS A. BARNESS AND JOHN S. CURRAN)*
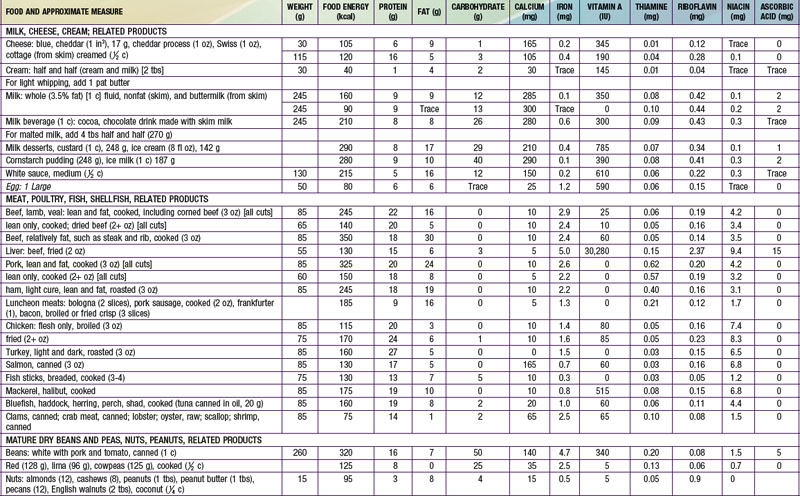
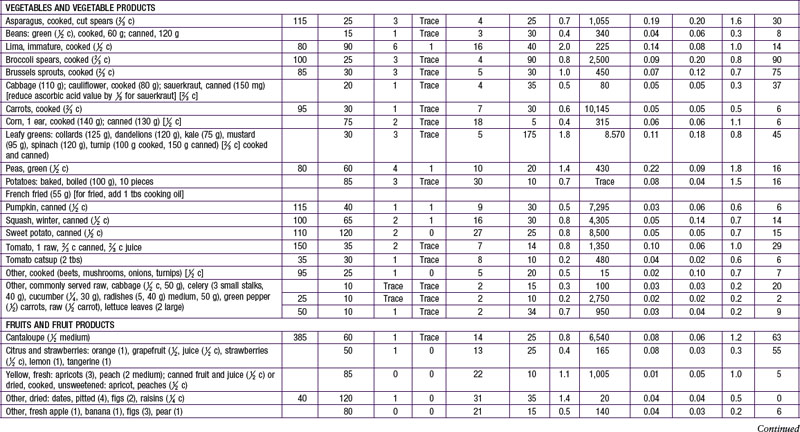
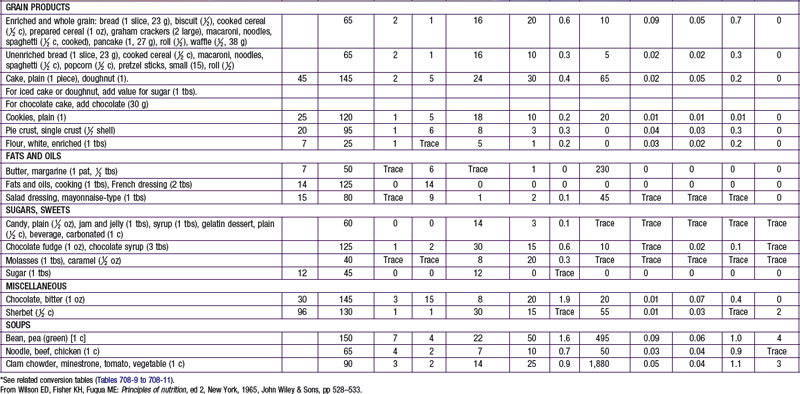
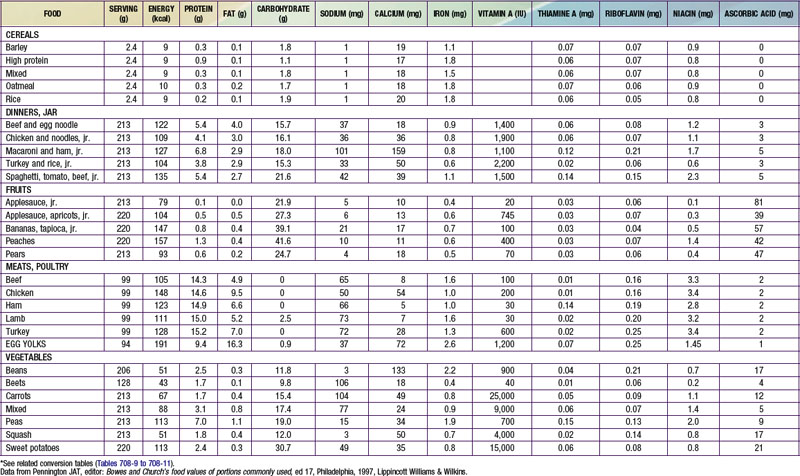
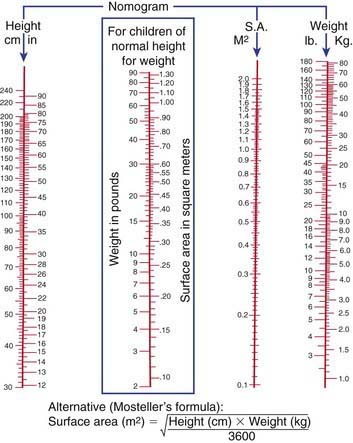
Figure 708-1 Nomogram for the estimation of surface area. The surface area is indicated where a straight line that connects the height and weight levels intersects the surface area column, or if the patient is roughly of average size, from the weight alone (enclosed area).
(Nomogram modified from the data of E. Boyd by C.D. West. See also Briars GL, Bailey BJ: Surface area estimation: pocket calculator v nomogram, Arch Dis Child 70:246–247, 1994.)
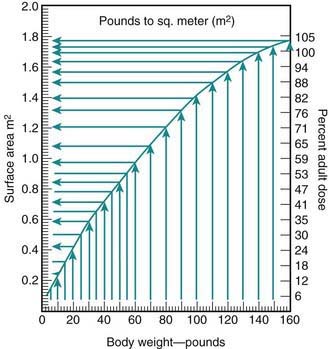
Figure 708-2 Relationships among body weight (lb), body surface area, and adult dosage. The surface area values correspond with those set forth by Crawford JD, Terry ME, Rourke GM: Simplification of drug dosage calculation by application of the surface area principle, Pediatrics 5:783–790, 1950. Note that the 100% adult dose is for a patient weighing approximately 140 lb and having a surface area of approximately 1.7 m2.
(From Talbot NB, Richie RH, Crawford JH: Metabolic homeostasis: a syllabus for those concerned with the care of patients, Cambridge, MA, 1959, Harvard University Press.)