Applied Epidemiology for the Infectious Diseases Physician
Sarah-Blythe Ballard, David L. Blazes
What Is Epidemiology?
The word epidemiology originates from the Greek epi- (meaning “surrounding”), demos (meaning “people”), and logos (meaning “the study of”). Thus epidemiology literally refers to the study of population occurrences. We now define epidemiology as the study of the distribution and determinants of health-related states or events in specified populations, and the application of this study to the control of health problems.1 Historically, the discipline of epidemiology reaches back in time over 2500 years and includes contributions from thinkers such as Hippocrates, John Graunt, James Lind, and William Farr. However, John Snow, an English anesthesiologist, is widely considered the “father of field epidemiology.” His famous study identified a single water pump on Broad Street as the cause of a cholera epidemic in the Golden Square of London. In 1854, twenty years before the invention of the microscope, Snow mapped the distribution of households with cholera cases during the epidemic and recognized that the cases were clustered around a particular water pump, the Broad Street pump. To confirm his suspicion that contaminated water from this pump was causing the cholera epidemic, Snow removed the handle of the pump, and the outbreak ended.2
The field of epidemiology has expanded from the investigation of infectious disease outbreaks, to the study of injuries and violence, and to the examination of any exposure that influences health outcomes, including molecular and genetic factors.2 Epidemiology is used in many ways, such as for evaluating a population's health, informing individual decisions, and establishing causality.2 Using rigorous statistical methods, epidemiology can answer complex questions, such as whether risk patterns correlate with exogenous factors or whether a public health program modifies risk.2 For infectious diseases clinicians, the epidemiologic factors associated with a case or cluster of cases can be used to great benefit, potentially decreasing the time to diagnosis, limiting the need for extensive testing, and tailoring the use of broad-spectrum antibiotics. Epidemiologic data may also be used to inform policies or guidelines that affect groups or individuals, such as choosing which populations to vaccinate, setting speed limits on a highway, or determining how many times a week to exercise.2
What Can Epidemiology Tell the Infectious Disease Clinician?
Epidemiology asks the clinician to think of the patient's community and exposures, as well as the individual patient. Is my patient's respiratory infection part of an outbreak of influenza in the community and, if so, what can be done to identify and control it? Interaction with the local health department or hospital infection control staff in this instance might have a broader impact than treating a single patient but will also require understanding how epidemiologic questions are formulated and answered.
The Epidemiologic Triad Model: Agent, Host, and Environment
To better inform clinical and public health decisions, epidemiologists (and clinicians) try to find causal links between exposures and health outcomes. If this is an influenza outbreak, how is it being spread, and how severe are the illnesses? The epidemiologic triad, or triangle, is one of the simplest models used to describe disease causation.2 In this model disease arises from the interaction between three components: an external “agent,” a susceptible “host,” and an “environment” that supports the transmission of the agent from its source to the host (Fig. 13.1).2 By tradition the agent represents an infectious microbe, such as a virus, bacterium, or parasite. However, this component of the model does not sufficiently describe all diseases; some can be chronic processes with multiple contributing causal factors. Host susceptibility can depend on an individual's genetic makeup, immune status, and host defenses, such as skin integrity, gastric acidity, ciliary function, and other factors. Host immunity, acquired immunodeficiency, and principles of immunization are discussed in Chapters 4 to 6, 118, and 316. Environmental factors that promote agent transmission to a susceptible host include the presence of animals and other reservoirs of infectious agents, vector populations, crowding, poor sanitation, climate, and geography.2 A detailed understanding of the epidemiology, pathogenesis, and ecology of a disease is required to construct optimal epidemiologic triads (agent, host, and environment).

The Sufficient-Component Cause Model of Epidemiology
A second causation model that considers the multiple factors that contribute to disease is called the “sufficient-component cause model.”3 In this model each disease pathway has “component causes” or factors that contribute to disease. Different combinations of component causes are considered “sufficient causes” of disease when they complete the causal pathway. A component cause that is present in every combination of factors in the causal pathway is considered a “necessary cause” because the pathway cannot be complete without it. For example, human papilloma virus (HPV) infection is a necessary cause of cervical cancer because persons must be infected with this virus to develop HPV-associated cervical cancer. However, HPV infection is not a sufficient cause of cervical cancer because not all individuals infected with HPV develop cervical cancer.
Other Methods to Characterize Infection Transmission
Multiple classifications exist to describe modes of disease transmission or the ways in which an agent leaves its natural environmental reservoir to infect a susceptible host. One classification distinguishes “direct” from “indirect” transmission.2 Direct transmission includes direct contact and droplet spread (short-range aerosols produced by sneezing, coughing, or talking), whereas indirect transmission includes airborne, vehicle-borne, and vector-borne (mechanical or biologic) spread.2
Descriptive Epidemiology
Descriptive epidemiology is used to characterize events in terms of person, place, and time and might answer the following questions: What health risks exist for this population? Who is getting influenza this winter? Who are the population members at risk? Is the influenza strain circulating in nursing homes, hospitals, or schools? Which geographic locations are associated with increased risk? How has the level of risk changed over time? Case reports and case series are types of descriptive studies conducted in clinical settings.4 Case reports describe the clinical features of a disease, along with demographic and historical details relevant to its presentation. Case series include the presentation, clinical features, and other significant facts pertaining to multiple patients with similar health conditions. Case reports (and series) often represent the first or novel presentations of a condition and can be very valuable from both a clinical and an epidemiologic perspective. For example, ribavirin was recently shown to be effective in a series of patients with chronic hepatitis E, not an original indication.5 Descriptive epidemiology may also assist in recognition of an emerging disease or in generating hypotheses about causal factors and factors that increase the risk of disease.2
Analytic Epidemiology
When one would like to more definitely establish a relationship between an exposure and a disease, analytic epidemiology is required. Hypotheses about the relationship are normally formulated, and a study design is selected based on the available data, the research question, ethical considerations, feasibility, and issues of validity and efficiency. Analytic epidemiologic studies fall into two categories: experimental and observational2 (Table 13.1). An observational study has no intervention but attempts to link the exposure to the disease passively. In an experimental study the exposure is actively managed and the outcome measured prospectively. Precision, validity, and bias should all be considered when designing an epidemiologic study but are covered elsewhere.2
TABLE 13.1

Experimental Studies
In an experimental study an investigator assigns similar groups of individuals (clinical trial) or communities (community trial) to different exposures or interventions and then follows the groups over time to ascertain the effects of the exposure.2 A classic example of a clinical trial is a vaccine trial, where one group of individuals is assigned to receive an immunization to prevent a particular disease and another group of individuals to receive a placebo. There are numerous examples of vaccine trials, including the definitive demonstration of the effectiveness of influenza immunization in children.6 After a defined period of time, the investigator monitors each participant to diagnose any occurrence of the disease in question, the investigator compares the rates of infection between the vaccine and placebo groups to determine if the vaccine successfully protected recipients from the disease. In a community trial, groups of individuals undergo randomization to receive an intervention, and investigators ascertain community health outcomes after a period of time relevant to the intervention and health outcome under investigation. Community trials are ideal for evaluating broad-based interventions, such as case management algorithms and health-related policies. An example of a community trial is testing the utility of long-lasting insecticide-treated bed net distribution on malaria incidence in endemic areas.7
Observational Studies
Cohort Studies
The most common types of observational study designs are cohort and case-control studies. Cohort studies are conceptually similar to experimental studies. The investigator evaluates the exposure status of participants and then follows them over time to evaluate the incidence of one or more health outcomes in each exposure group. If a health outcome is significantly greater in the exposed group relative to the unexposed group, then the exposure is considered to be associated with the disease. Cohort studies differ from experimental studies in that the investigator does not assign individuals to an exposure group; rather, the exposure group is determined passively. Cohort studies can be performed prospectively or retrospectively. In a prospective study the exposure status is established in advance, and the participant is followed over time to determine the occurrence of the outcome of interest. In a retrospective study both the exposures and the outcomes have already occurred at different points in time. The investigator collects the retrospective data and compares the rates of the outcome in the exposed and unexposed groups. A recent example of a well-designed cohort study described the frequency and distribution of pregnancy outcomes after Zika virus infection.8
Case-Control Studies
In contrast, case-control studies evaluate a single health outcome in relation to one or more exposures. For a case-control study, subjects with the health outcome of interest (e.g., became infected) are enrolled as well as control subjects without the health outcome of interest (e.g., did not become infected). The exposure histories of both sets of subjects are then compared, with the control group providing an estimated baseline or expected amount of exposure for the population of interest. If exposures are high among subjects with the health outcome of interest relative to the exposures expected based on evaluation of the control group, then the outcome is determined to be associated with that exposure. A recent case-control study from Peru demonstrated a link between latent tuberculosis infection and acute myocardial infarction.9
Cross-Sectional and Ecologic Studies
Cross-sectional and ecologic studies are also observational study designs. Cross-sectional studies examine the relationship between an exposure and an outcome among individuals in a defined population at a single point in time, like a snapshot. An example is determining the prevalence of syphilis in a population of prisoners in Brazil to decide if an intervention is required.10 Ecologic studies evaluate associations using population-level exposures and outcome rates, rather than using individuals as the unit of analysis. Both cross-sectional and ecologic study designs have important limitations that make them less scientifically rigorous than other study designs.11,12 Most important, they do not establish temporal sequences between exposures and outcomes, which limits the ability to determine causal inferences. In ecologic studies the lack of individual-level information contributes to what is known as the “ecologic fallacy,” meaning that individual-level relationships between exposures and outcomes cannot be inferred from population-level associations.12,13 In other words, the individuals with the exposure may not be the same individuals who developed the disease, even though a particular population has high rates of the exposure and outcome.12
Determining the Appropriate Epidemiologic Study Design
When determining which study design is most appropriate, it is important to consider the strengths and weaknesses of each (see Table 13.1). Experimental studies are ideal for evaluating an intervention for a particular outcome with a high degree of validity, such as when an intervention is expected to have a small effect or when a highly controlled setting with randomized participants is needed to minimize bias and confounding.12 Only randomization, preferably blinded, can reduce the effect of unidentified factors or confounders that can potentially bias the outcome. The disadvantages of experimental studies include high cost and ethical considerations related to exposing participants to certain risks. Observational studies can be used to evaluate a wider range of exposures, including preventions, treatments, and causes of disease. The primary limitation of observational studies is the inability to control for confounding factors. Cohort studies are useful for investigating rare exposures, multiple outcomes, and outcomes for which little is known about exposure. Compared with other study designs, case-control studies generally take less time, require fewer resources, and can provide information about multiple exposures when little is known about the etiology of a particular health outcome.12 In addition, case-control studies are more efficient than cohort studies for studying rare diseases and diseases with long incubation or latency times because they do not require long-term prospective follow-up.12 Case-control studies are also more efficient when the population of interest is dynamic or when the study requires expensive or hard-to-obtain exposure data.12 Although caution must be exercised with temporal inference, cross-sectional studies are useful because they can be performed in a short time period and yield highly generalizable results when based on large samples from the general population. Likewise, ecologic studies are rapid, inexpensive, and simple, and they can provide useful information about the context in which populations live.13
Basic Biostatistics
A basic understanding of biostatistics is required to interpret medical literature or to plan appropriate epidemiologic studies. This section will cover measures of disease frequency, measures of association, and significance of association only. For more extensive reading on biostatistics, please refer to the classic references 2, 12, and 14. For the use of biostatistics in clinical trials see Chapter 52.
Measures of Disease Frequency
Measuring the frequency of disease in a population is the first step in characterizing the distribution and determinants of disease in populations.12 To conceptualize disease occurrence, it is important to consider the size of the underlying population, the number of persons affected, and the length of time that the population is observed.
Ratios, Proportions, and Rates
These are the three types of calculations used to describe disease occurrence. A ratio is one number divided by another number. For example, the maternal mortality ratio is a ratio of two unrelated numbers, the number of maternal deaths per 100,000 live births. Proportions, known as fractions or percentages, also consist of one number divided by another, but the numerator must always be a subset of the denominator. Measures of disease occurrence are often written as rates. A rate also consists of one number divided by another number, but the denominator always includes time. The attack rate of a disease represents the proportion of individuals who developed illness divided by the total number of individuals exposed to a pathogen. For example, annual incidence rates for Lyme disease are calculated by state per 100,000 persons.15
Incidence
The two most basic measures of disease frequency are incidence and prevalence. Incidence is the number of new cases of disease that occur in an “at-risk” population over a specified period of time. Incidence takes into account how many persons are at risk in a particular population. For example, women are not at risk for prostatitis. Thus the incidence of prostatitis in a population would not include women in the denominator. The time period during which a population is followed is also important for incidence calculations. Incidence rate refers to the number of new cases of disease that occur during person-time observation, where time is included in the denominator. Incidence rate calculations include the amount of time that each individual contributes to the denominator before being diagnosed with the disease of interest. Cumulative incidence refers to the number of at risk individuals who become diseased during a specified period of time. It can be expressed as a proportion of the at-risk population and therefore ranges from 0% to 100%, or 0 to 1.12
Prevalence
Although incidence measures the frequency of the development of new disease, prevalence measures the frequency of existing disease in a population. Prevalence is defined as the number of persons with disease in a population divided by the total number of persons in that population. Unlike incidence, the prevalence numerator includes all persons with the disease, regardless of when it developed, and the prevalence denominator includes everyone in the population, whether or not the individuals are at risk. There are two different prevalence measures: point prevalence and period prevalence. Point prevalence refers to the proportion of the population with the disease at a specific point in time, such as a particular date. Period prevalence refers to the proportion of the population with the disease over a specified period of time, such as a calendar year. Period prevalence includes the number of persons with disease present at the start of the time period, in addition to the number of persons who developed the disease during the specified period.2 Prevalence depends on the rate at which new cases of disease develop (incidence rate), in addition to the duration of illness. The duration of disease begins when a person acquires the disease, and it ends when a person is cured or dies.
Measures of Association
Measures of association, or measures of effect, quantify the strength of the statistical association between exposures and health outcomes of interest. The respective measures of association for each type of study are shown in Table 13.1.
Two-by-Two Tables
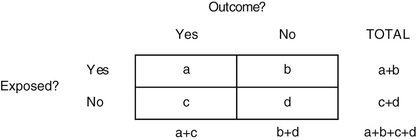
To understand how to calculate measures of association, it is important to understand the basic construct of a two-by-two table. In many epidemiologic studies exposure and outcome data are dichotomous (e.g., “yes” or “no”). Thus the relationship between exposure and outcome can be cross-tabulated in a two-by-two table, which has two categories of exposure and two categories of outcome (Fig. 13.214). By convention, outcome status is placed in columns, and exposure status is placed in rows. The four cells of the two-by-two table are labeled a, b, c, and d, and each letter refers to the number of persons with the outcome indicated by the column heading and the exposure status indicated by the row heading.
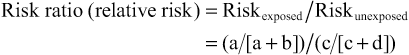
Risk ratio (RR) describes the excess risk of a health outcome in exposed persons compared with unexposed persons, who represent the background or expected risk. Mathematically, the RR is expressed as the risk in the exposed group divided by the risk in the unexposed group. A risk ratio greater than 1.0 indicates that risk is greater in the exposed group when compared with the unexposed group, whereas RR less than 1.0 indicates that the risk in the exposed group is less than in the unexposed group. This happens when the exposure protects against a health outcome, such as an immunization that protects against an infectious disease.2

Odds ratios (ORs) are measures of association used in case-control studies to approximate RR. The OR is also called the “cross-product ratio” because it is obtained by calculating the cross products of the cells in a two-by-two table, with “a” × “d” in the numerator and “b” × “c” in the denominator. In case-control studies, epidemiologists enroll a group of “cases” with the outcome and a comparable group of “controls” without the outcome. The number of individuals in each group is determined a priori, and the size of the populations from which the cases and controls arise is often unknown. This lack of population denominator data prevents direct calculation of the RR. However, the OR approximates the RR when the outcome of interest is rare.
Prevalence Ratio and Prevalence Odds Ratio
Cross-sectional studies usually measure the prevalence of a health outcome, rather than its incidence. Because prevalence is a function of both incidence and duration of illness, measures of association based on prevalent cases reflect the effect of the exposure on both incidence and duration, or survival. The prevalence ratio and the prevalence OR, respectively, are the measures of association that correspond to the RR and the OR in a cross-sectional study. These ratios are calculated using the same formulas but recognizing that the data in the two-by-two table is prevalence data.2
Statistical Significance
P Values
To make hypotheses about causal relationships between exposures and outcomes, three alternative explanations for study results should be considered: bias, confounding, and random error. Bias is a systematic error in study design, measurement, or analysis that leads to a false association between the exposure and outcome. Confounding is a systematic mixing of effects between the exposure, outcome, and a third variable called a confounder, unmeasured or unrecognized, which distorts the measure of association between the exposure and outcome. Random error arises from chance and leads to a false association between the exposure and outcome that is uncontrollable and appears not to have an assignable cause. Random error can occur from mistakes in measurement or sampling variability that occurs by randomly selecting an unrepresentative population sample purely by chance.
Hypothesis testing is a method of evaluating random error in an epidemiologic study. The default assumption, or “null hypothesis,” is that there is no relationship between exposure and the outcome. For example, eating raspberries this July did not increase the chances of getting cyclosporiasis. The compatibility between the data observed in the study with the null hypothesis is evaluated using a statistical test. Computing the test statistic yields a P value, which represents the probability of obtaining the observed or more extreme results by chance alone. The P value ranges from 0.0 to 1.0, with a small value indicating that the null hypothesis may need to be rejected. By convention, a P value cutoff of 0.05 is traditionally used to determine whether to reject the null hypothesis, which assumes that a 5% or lower chance of random error is acceptable when asserting that there is a true relationship between exposure and outcome. This cutoff is also called the alpha or significance level.
Confidence Intervals
Another way to quantify random error in studies is to estimate the confidence interval (CI). CIs quantify the variability around a point estimate. The width is determined by random error, in addition to an arbitrary certainty factor, usually set at 95%, although some studies use 90% or 99%. Using a 95% CI as an example, the strict interpretation is that 95 of 100 CIs would contain the true measure of association if a study were repeated 100 times to obtain 100 point estimates with 100 CIs. Wider CIs mean that there is a larger amount of random error relative to narrower CIs. In general, sample size affects CI width, and wider CIs indicate that a relatively smaller sample created the point estimate, whereas narrower CIs generally indicate point estimates created by larger samples. CIs can also be used to determine statistical significance. For example, if the null value for a measure of association (example: RR of 1.0) falls within the 95% CI, then the result is by convention not statistically significant. Some epidemiologists prefer using CIs to P values when determining statistical significance because CIs are expressed in the same units as the measure of association and contain the point estimate, whereas the point estimate cannot be estimated by examining a P value. Nevertheless, similar to P values, CIs do not account for bias and confounding, nor can they confirm that a given correlation is causal.
Disease Surveillance
Surveillance for infectious diseases is one of the most critical functions of a public health system, from the clinic or hospital level all the way to the national and global level. Surveillance can take many forms but generally entails the continuous and systematic collection and analysis of data, and the subsequent reporting of any significant findings to effect change. There are many valid indications for implementing surveillance, including measuring baseline levels of disease, identifying hypotheses to conduct further research, monitoring the effectiveness of interventions, and detecting outbreaks. Perhaps most relevant for infectious diseases clinicians are the recognition and initial management of outbreaks, because it is often physicians who first recognize an increase in cases. A brief discussion on outbreak management is included in the following text.
Classification of Surveillance
Surveillance can be either active or passive and may collect data on incident cases, prevalent cases, or both. Active surveillance is usually more sensitive for discovering an outbreak but is more costly and labor intensive. Passive surveillance is often less sensitive but is also less costly and thus can be deployed on a broader scale.
Surveillance systems in the United States often follow a hierarchical reporting scheme, with local clinics, hospitals, or laboratories tabulating cases and reporting them to the local public health authorities. The collated data is then passed to the state-level public health officials, who in turn report to the Centers for Disease Control and Prevention (CDC). The CDC reports to World Health Organization (WHO) through the US government focal point, if necessary, about outbreaks of potential global significance. Reports of outbreaks are updated by the CDC on the Epidemic Information Exchange (Epi-X), a secure web-based reporting system (https://emergency.cdc.gov/epix/index.asp) limited to public health officials, as well as in the Morbidity and Mortality Weekly Report (MMWR), which is available to the public electronically at http://www.cdc.gov/mmwr/ and in hard copy. An international treaty, the International Health Regulations (IHR [2005]) governs what type of outbreak is reportable and to whom and under what time requirements it must be reported.16 Each signatory country is responsible for controlling disease within its own borders. The IHR (2005) is designed to allow less-developed countries to request assistance from WHO and its response mechanism, the Global Outbreak Alert and Response Network (GOARN). The GOARN and WHO Outbreak News websites provide public information about current outbreaks of potential global concern.17
Some sentinel surveillance systems attempt to identify specific diseases using representative sites. For example, FoodNet is part of CDC's Emerging Infections Program and conducts surveillance for enteric pathogens in 10 state health departments in collaboration with the US Department of Agriculture–Food Safety and Inspection Service (USDA-FSIS) and the US Food and Drug Administration (FDA).18 The 10 sites cover approximately 48 million persons (≈15% of the US population) and include Connecticut, Georgia, Maryland, Minnesota, New Mexico, Oregon, and Tennessee, and selected counties in California, Colorado, and New York.18 This system has identified many outbreaks of gastrointestinal infections, such as the multistate outbreak of Salmonella Virchow in 2015–16.19
Disease surveillance is also conducted on a global scale. Perhaps the best example of this is the Global Influenza Surveillance and Response System (GISRS), which is a unique, laboratory-based global surveillance network to monitor seasonal and emerging influenza viruses to mitigate pandemic influenza spread.20 The GISRS network, established in 1952, consists of 142 National Influenza Centers, 6 WHO Collaborating Centers, and 4 Essential Regulatory Laboratories. Influenza isolates are systematically collected throughout the year and compared with previously circulating strains to predict which strain is likely to be predominant in the following season. Different compositions of influenza vaccine (containing influenza A H3N2, A H1N1, and B components) can be selected for Northern and Southern Hemisphere seasons.21
Technology is revolutionizing disease surveillance, especially in the field of infectious diseases. Classic tools, such as the outbreak line list and population serosurveys, remain important for understanding and controlling disease, but increasingly the power of “big data” is being leveraged to more rapidly and precisely address the challenges posed by infectious diseases. Syndromic surveillance aims to identify unusual or novel diseases by monitoring for general clinical syndromes, such as febrile pneumonia. In response to the intentional anthrax outbreak of 2001, electronic disease (syndromic) surveillance was intensified in the United States with the goal of rapidly identifying any clusters of illness that were compatible with a biowarfare attack. The Electronic Surveillance System for the Early Notification of Community-Based Epidemics (ESSENCE) is used by federal (CDC, the National Syndromic Surveillance platform), state, and local public health entities to monitor novel and emerging infectious diseases, chronic illnesses, and other public health conditions of interest, such as mental and behavioral health disorders and environmental exposures.22
Novel methods of disease surveillance are continuously being developed and refined. Some reporting systems, such as ProMED mail, have been functioning since the 1990s and rely on a network of health care professionals and other interested parties (more than 70,000 subscribers in 185 countries) to report outbreaks around the world.23 This email- and web-based system covers outbreaks affecting humans, animals, and plants, and it is moderated by a panel of public health experts who screen each report before release. Digital disease detection or surveillance is a new technology that relies on collating and analyzing diverse streams of data that are increasingly available in machine-readable format. The prototypical digital disease detection platform is HealthMap (http://www.healthmap.org/en), which harnesses the broad reach of the Internet by searching “online” news outlets and applying automated logic to sort “real” outbreaks from rumor.24 The CDC and the Infectious Diseases Society of America collaborate on the Emerging Infections Network (https://ein.idsociety.org/), an email-based list-serv that connects practicing infectious diseases physicians from the United States and some other areas around the world to conduct surveillance for emerging infectious diseases.25 The GeoSentinel Surveillance System (http://www.istm.org/geosentinel) is likewise a worldwide network of travel medicine clinics that reports illnesses among travelers.26
Machine learning and related deep-learning computer algorithms are synthesizing and analyzing unapproachably large data sets that surveillance systems can collect. This allows aberration detection within surveillance data streams and may even lead to improved prediction of epidemiologic trends or forecasting of disease events.27 Better-quality data also allow more precise geospatial representation of disease, increasing the efficiency of identification, response, and control of outbreaks.28
The astute and vigilant clinician arguably remains the most important factor in outbreak surveillance. The first case of severe acute respiratory syndrome (SARS) was identified by a physician in Hanoi, Vietnam, who noticed an unusually severe, atypical pneumonia.29 The first cases of acquired immunodeficiency syndrome (AIDS) were identified by a clinician who noted rare infections among a group of homosexual men.30 Also, West Nile virus was discovered by an observant clinician in New York City, following an independent veterinary investigation reporting a die-off of birds.31 It is important for clinicians to understand that as individual providers they may be seeing the proverbial “tip of the iceberg.” Only by reporting these cases can an outbreak be appreciated as cases are examined in aggregate.
Disease Prevention
Prevention includes a wide array of interventions aimed at promoting health by reducing risks that lead to poor health outcomes or disease. Primary, secondary, and tertiary prevention are three terms that describe the points in the disease process targeted by an intervention.2 Primary prevention aims to prevent the occurrence of disease. This is done by preventing exposure to hazards that cause poor health outcomes, that is, changing unhealthy or unsafe behaviors that lead to poor health outcomes and increasing resistance to poor health outcomes if exposure occurs. Examples of primary prevention include legislative measures that control health hazards, education about healthy behaviors, and immunization against diseases.2 Secondary prevention aims to minimize the impact of a poor health outcome that has already occurred. This can be done by identifying and treating a health condition as soon as possible to prevent its progression, implementing strategies to prevent recurrence, and modifying activities to help persons return to their original state of health. Examples of secondary prevention include screening tests that identify diseases during their earliest stages, such as hepatitis C screening. Tertiary prevention aims to lessen the impact of a poor health outcome with lasting effects, such as chronic disease or injury leading to disability. This can be done by managing long-term ailments to lessen disability, improve quality of life, and lengthen life expectancy. Early antiretroviral therapy for human immunodeficiency virus (HIV) infection is an example of tertiary prevention.
Disease Control: Quarantine and Isolation
There are many strategies to mitigate the spread of infections, and those relevant to hospital infection control are given in Chapter 298. Some strategies targeting public health intervention, namely quarantine and isolation, and a short primer on outbreak investigation are discussed as follows.
Quarantine (separating and restricting movement of individuals exposed to a communicable disease) and isolation (separating and restricting movement of individuals suspected or confirmed to be infected with communicable disease) are public health strategies used to prevent exposure of the public to individuals or populations infected with a communicable disease. In an increasingly connected world, public health officials must interact with multiple entities and many levels of government to balance public health and humanitarian efforts with economic priorities, such as international travel and trade. In the 2014 West African Ebola epidemic, for example, the CDC partnered with WHO, the International Organization for Migration, nongovernmental organizations, and domestic entities, such as the US Department of Homeland Security and state and local health departments, to prevent international transmission of Ebola while minimizing disruption of economic activities.32 Domestically, in addition to communicating with travelers via travel notices and airport messaging, CDC teams provided training and equipped US entry-point personnel to conduct screening using body-heat sensing devices and questionnaires to identify symptomatic and potentially exposed travelers arriving in the United States. If a potentially exposed individual was identified through screening, the domestic quarantine strategy relied on measures such as active self-monitoring, controlled movement, and daily communication with public health officials (for high-risk individuals, such as health care workers) during the 21-day Ebola incubation period, with the aim of applying the least restrictive measures necessary to prevent potential transmission.32
Outbreak Investigation Primer
Outbreaks of infectious disease can arise anywhere in the world and pose a threat to local and global populations without respect for political borders, geographic separation, or cultural differences. Many current conditions facilitate this potential for rapid spread of infectious diseases, such as the globalization of the food supply, overuse of antibiotics, the growth of megacities with severe crowding, our increasing proximity to animals and vectors of disease, and even climate change.33
There have been numerous recent outbreaks that have seized the public's attention. The SARS epidemic of 2003 and the recent resurgence of measles in North America and Europe were watershed events and hastened the strengthening of the IHR. These were followed by multiple outbreaks of imported foodborne gastroenteritis caused by Cyclospora and Salmonella, as well as by MERS, Nipah virus, pandemic H1N1 influenza, and, most recently, Ebola virus disease and Zika virus syndrome.33,34 The scope and impact of these outbreaks underscore the importance of maintaining an informed network of clinicians who understand the dynamics of an outbreak and how to investigate one. This section describes the key concepts involved in an outbreak investigation, discusses basic transmission dynamics, and provides a simple guide for conducting an outbreak investigation.
An outbreak is an increase beyond expectation in the number of cases of a disease or condition, occurring in a specific population in a defined geographic location and period of time.14 The cases are epidemiologically related, although this linkage is often not initially evident and may only be discovered after thorough investigation. For example, in the 1981 multistate outbreak of Salmonella muenchen, the epidemiologic link was discovered only when case patients reported smoking marijuana more frequently than control patients. This rare Salmonella species was then isolated from marijuana samples found in the homes of patients with the illness.35
Outbreaks very often have an infectious origin, although some can be due to noninfectious agents, such as food intoxication or even hysteria. It is often difficult to define how many cases beyond expectation constitutes an outbreak, but even one case can indicate an outbreak if the disease has been eradicated (smallpox), eliminated (poliomyelitis in Europe), or is novel to humans (highly pathogenic H5N1 avian influenza in the Americas).
In the absence of timely control measures, outbreaks can spread and lead to epidemics or even pandemics. Epidemics are conceptually identical to outbreaks but are more widely disseminated in time and space, such as the cholera epidemic in London during the mid-1800s and SARS in Southeast Asia in 2003. Pandemics spread globally and may persist through months, years, or decades. Examples of pandemics include such historic scourges as bubonic plague in medieval days and influenza in 1918-19, as well as AIDS or the influenza A/H1N1 pandemic of 2009 more recently.
Many infectious diseases are endemic in certain settings and occur routinely. Malaria, dengue and enteropathogens that cause diarrheal disease in the tropics are all examples. Endemnicity does not preclude the occurrence of outbreaks, however, that may occur during point-source foodborne outbreaks when large pools of susceptible individuals are exposed at a single time. Vibrio parahemolyticus and Norovirus, for example, are endemic causes of sporadic gastroenteritis but can also lead to outbreaks when contaminated seafood is eaten raw.36,37 Often, all that is required for an outbreak to occur is a sufficiently large, naïve population that is exposed to an infectious inoculum of the agent.
Outbreak Epidemiology
General
The methodology for conducting outbreak investigations and the study designs and methods used have been well described in the literature.2,14,38–41 Reviews of published outbreaks suggest that foodborne transmission accounts for nearly half of all reported outbreaks. Most efforts to improve the standardized reporting of outbreaks have been focused on either foodborne disease or nosocomial infections.42,43 The CDC collects and collates data on outbreaks in the United States and maintains a dashboard that includes visualizations and statistics through 2016. Outbreak data can be explored at the National Outbreak Reporting System, which is found at https://wwwn.cdc.gov/norsdashboard/.44 A current list of ongoing outbreaks, both domestic and significant international, can be found at https://www.cdc.gov/outbreaks/index.html.
Key Outbreak Principles
Incubation Period
Incubation period is the time elapsed from exposure to a certain infectious agent until the development of symptoms and is often expressed as a range. In an outbreak investigation the incubation period is a key parameter that may help to discern between multiple potential etiologic causes. For example, symptoms of foodborne staphylococcal intoxication often appear 30 minutes to 6 hours after exposure, whereas the incubation period for salmonellosis is 6 to 72 hours. So, abrupt gastroenteric illness in multiple subjects who recently shared a common meal is less likely to be caused by an agent with a longer incubation period like Salmonella. However, it should not be mistakenly assumed that infectious agents with lengthy incubation periods cannot cause outbreaks because transmission of Mycobacterium tuberculosis during air travel has been demonstrated on several occasions.45 Cases from outbreaks caused by agents with long incubation periods will typically appear over extended time periods, making their common origin less obvious. The routine application of genetic sequencing of pathogens may assist in defining the relatedness of cases that are separated by time and space.46
Epidemic Curves
Epidemic curves are histograms depicting the number of cases of a disease during the duration of an outbreak or epidemic.14 When properly prepared, epidemic curves are key epidemiologic tools in the outbreak investigation that may aid in determining the transmission mode of the outbreak, the incubation period and possible period of exposure. The main mode of transmission can often be identified from epidemic curves (point source, person-to-person, or continued common source), although on occasion two of these modes are seen at different stages during a single outbreak. The crucial step in preparing an epidemic curve is choosing a time interval unit that corresponds to a fraction of the median incubation period of the suspected agent (usually between  to
to  of the incubation period) so that the epidemic curve demonstrates the details of the outbreak and clearly identifies the onset, peak, and tail of the outbreak.2,14
Transmission Modes
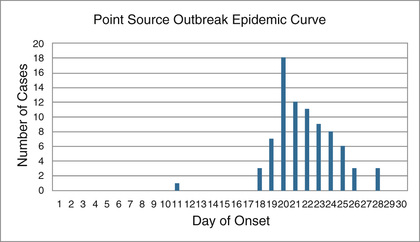
Point source outbreaks can occur after the exposure of a group of people to an agent during a single, short period of time. Cases often present in a single group during a short time period, corresponding to the range of the incubation period, unless there is secondary transmission. The epidemic curve demonstrates an abrupt onset and gradual descent with a single peak. Food and beverages are common point sources, and single-source outbreaks very often present as gastroenteric illness (Fig. 13.3).47
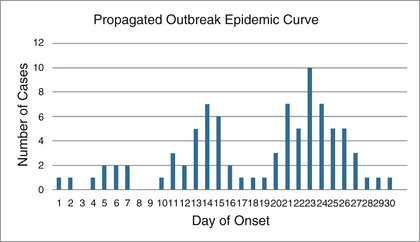
Person-to-person, or propagated, outbreaks are characterized by the presence of two or more clusters of cases in time separated by approximately one median of the incubation period, thus suggesting secondary transmission. The distance between clusters of cases usually becomes less clear as the outbreak progresses because the ranges of the incubation periods tend to blend into each other. Respiratory transmission is the most efficient mechanism of person-to-person transmission, the most classic example being the influenza virus. Measles, adenovirus, and pneumonic plague may also be transmitted in this manner. (Fig. 13.4)48
In continuous-source outbreaks, exposure to the agent can occur over an extended period. Therefore cases appear over longer periods of time, often substantially beyond the range of the incubation period. Cases sometimes present in several clusters, but the timing between clusters does not necessarily correspond closely to the median incubation period. Vector-borne and zoonotic infections are typical of this transmission pattern, but waterborne, respiratory, and nosocomial outbreaks have occasionally been described as continuous-source outbreaks as well. (Fig. 13.5)49

Chains of Transmission
Exploring the connection between initial waves of cases and those occurring later often reveals important interactions that can occur during propagated outbreaks with person-to-person transmission or a continuous common source. Clearly identified transmission waves can be observed, such as those related to cultural practices such as burial traditions in Africa49 or the transmission of Nipah virus in a Bangladeshi community (Fig. 13.6).48 Transmission chains can also provide hints about the incubation period of the agent, although these may be difficult to tease out of the data.

New molecular diagnostic tools are revolutionizing the study of outbreaks, especially in elucidating chains of transmission where the cases are separated by time and distance. Whole-genome sequencing of pathogens requires less time, money, and equipment than ever before in the United States and in many high-income settings.46 Next-generation sequencing platforms are increasingly available in the field, as is the ability to interpret the massive volumes of data inherent to this technology. Genetic sequencing can be used to precisely determine transmission chains, relatedness of pathogens to known standards, and even characteristics such as antimicrobial resistance and virulence, and are extremely valuable tools for outbreak management.46
Types of Outbreaks
Foodborne Outbreaks
Surveillance of foodborne outbreaks is routinely conducted in the United States and Europe but in fewer low-income countries where one might expect more frequent foodborne illness. The most recent comprehensive data are published by the CDC from 1998 through 2016. In the United States there were 19,991 outbreaks affecting 388,238 persons that led to 15,631 hospitalizations and 365 deaths.50 For reference, this represents almost half of the total outbreaks41 throughout this period in the United States. An etiologic agent is identified in approximately half of the foodborne outbreaks, and 91% of them were caused by an infectious agent, mainly viruses (54%) or bacteria (36%). Nearly all outbreak-causing foodborne viruses were Norovirus, and 52% of the bacterial causes were Salmonella spp.51
The primary factor leading to foodborne outbreaks is temperature mismanagement while preparing, cooking, or storing food. If food workers were involved in the food preparation, the outbreak was often associated with a single, nongloved worker who handled the implicated food or fecally contaminated foods that were improperly refrigerated.52
Nosocomial Outbreaks
Outbreaks in hospital settings often benefit from better infrastructure for diagnosis and investigation. There are a wide variety of pathogens that can lead to outbreaks in hospitals, from respiratory pathogens such as influenza or coronoviruses, to diarrheal pathogens such as Clostridioides difficile (formerly Clostridium difficile), to bloodstream infections such as multidrug-resistant gram-negative bacilli. Extensive work on infection control has led to the publication of the Outbreak Reports and Intervention Studies of Nosocomial Infection (ORION) guidelines for reporting nosocomial outbreaks.44 An analysis of an open-access database of nosocomial outbreaks (www.outbreak-database.com) demonstrated that outbreaks occurred mainly in hospitals (83%) and more often in intensive care units (47%).53 Surgical, neonatology, and internal medicine services accounted for similar proportions of the outbreaks. A source was identified in only 63% of outbreaks, often an index patient (40%), contaminated equipment or devices (21%), or the environment (19%). The mode of transmission was unidentified in 28% of outbreaks, and in the remainder it was primarily contact (60%). The three most frequent pathogens were Staphylococci (15%), Pseudomonas (8%), and Klebsiella (7%). Most of the staphylococci outbreaks (71%) were caused by methicillin-resistant S. aureus, and 24% of the Klebsiella outbreaks were due to extended spectrum β-lactamase–producing bacteria. Many smaller nosocomial outbreaks are likely excluded from this database due to publication bias in the literature, and most of the published cases come from high-income countries.53
Respiratory and Other Person-to-Person Outbreaks
The most typical outbreaks of respiratory illness are those caused by respiratory viruses with short incubation periods and potential for rapid dissemination in a population, such as influenza or adenovirus.54 Viruses transmitted by droplet nuclei, such as measles and mumps, follow similar transmission patterns, although their incubation periods are often somewhat longer. Tuberculosis, on the other hand, is less frequently observed in outbreaks, probably because of its very lengthy incubation period and the consequent difficulty in establishing a clear epidemiologic link between index and secondary cases. On occasion, this link can be established, such as when there is a common airline flight or workplace.51 Coronoviruses (CoV) such as SARS-CoV and, more recently, Middle East respiratory syndrome (MERS-CoV) have recently emerged as respiratory pathogens with epidemic potential. They are originally zoonotic in nature but can be transmitted person-person and in health care settings.55
Sexually Transmitted Outbreaks
Sexually transmitted diseases are typically less efficiently transmitted because an intimate relationship must be established. HIV has taught us that sexual transmission may be inefficient but was certainly sufficient to establish a global pandemic. The Internet and enhanced connectivity through virtual social networks has been cited as one mechanism that increases the probability of contact between cases and naïve, susceptible individuals.56
Zoonotic and Vector-Borne Outbreaks
Increased interaction between humans, animals, and their environment have led to a relentless surge of emerging and reemerging infections, most of them zoonotic or vector-borne in nature (see Chapter 317). No single common transmission pattern can describe these outbreaks because of their diversity. Point source exposures are often observed, such as in an outbreak of leptospirosis after a freshwater exposure during a military exercise in Guam.57 Continuous common source exposures are also observed, especially for vector-borne diseases, such as dengue, malaria, or Zika virus.58 Finally, the Ebola epidemic in West Africa in 2015–16 contributed much to the understanding of outbreak management, from the science of transmission, to the many social implications of infection control, to the mundane challenges of waste management.59
Outbreak Investigation and Response
Conducting an investigation may help us to understand the mode of transmission of the disease, identify the etiologic agent and who may be at risk of infection, and ultimately prevent additional cases and reduce the overall morbidity and/or mortality rates. Conducting an outbreak investigation may also allow us to evaluate the sensitivity and specificity of a surveillance system, evaluate or implement intervention strategies (i.e., vaccination, social distancing, or removal of a point source) and contribute to the epidemiology and scientific knowledge of the disease.
A systematic, step-by-step approach to conducting an outbreak investigation is imperative for identifying the source of the outbreak and for controlling and preventing additional cases. This systematic approach can be divided into 13 distinct steps (Table 13.2), but these are not rigid in their order, and several steps are often accomplished simultaneously.2,14
TABLE 13.2
- 1. Preparation for an outbreak should involve prestaging of standardized sample collection materials, personal protective equipment, and most important, the presence of trained personnel. It is also important to think about permissions for conducting the study, whether it is the Institutional Review Board (IRB) of the hospital or CDC, or jurisdictional approval if you are traveling to another state or country.
- 2. Conducting an outbreak investigation can be resource intensive. Before initiating the investigation, it is imperative to first determine whether or not an outbreak (or pandemic) is actually occurring. Several data sources may be available to help determine if the number of observed cases exceeds that of the expected baseline number (i.e., notifiable disease registries, death registries, hospital discharge summaries, etc.). It is important to recognize that new or improved diagnostic tests, a new or enhanced surveillance system, or simply increased awareness of a disease may artificially indicate that an outbreak is occurring.
- 3. Verifying the diagnosis often goes hand-in-hand with confirming the existence of an outbreak. It may be necessary to collect additional biologic samples and, if possible, request specialized diagnostic procedures or have the results confirmed at a secondary reference laboratory. However, in the event of an outbreak of a new pathogen, it may be necessary to rely on clinical diagnosis alone, as was the case in the early stages of the SARS epidemic. Furthermore, it is highly recommended to interview patients to gather additional clinical and epidemiologic features.
- 4. Enumerating the number of cases during an outbreak is only possible once a standard case definition has been established. This can be one of the most difficult and contentious components of an outbreak investigation. The case definition is generally based on clinical features, such as sudden onset of fever higher than 38°C, cough or sore throat, difficulty breathing, and so forth. The case definition is almost always restricted by person (i.e., children younger than years, no history of yellow fever vaccine), place (i.e., patients in a specific wing of a hospital, attendees of a county fair), and time (i.e., persons with illness onset within the previous 24 hours). The initial case definition is often quite broad, to capture all possible cases; however, as the investigation proceeds it generally becomes more refined and divided into subcategories, such as suspect (i.e., fever only), probable (i.e., fever with cough and shortness of breath, death with history of fever and cough), and confirmed (i.e., fever and cough with laboratory confirmation of influenza virus H5N1 infection).
- 5. Counting and tracking cases is most easily achieved by constructing a line listing of cases. Data in the line listing should include information such as symptom onset date, patient identification data, clinical data, demographic data, laboratory data, and some risk factor or epidemiologic data. (Fig. 13.7)
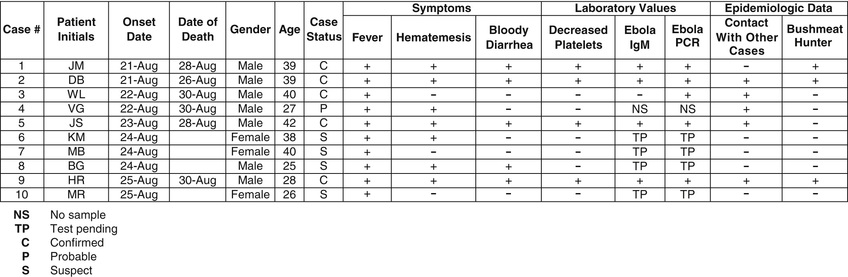 FIG. 13.7 Example line list.
 - 6. The next step, and often most revealing, is descriptive analysis of the epidemiologic data. The line listing is converted to visual depiction of the data, referred to as the epidemic curve (as described earlier), which is graphed with time on the x-axis (typically symptom onset data) and number of cases on the y-axis (Figs. 13.3 to 13.5). The epidemic curve can give clues about trend (i.e., person-to-person transmission or point/common source exposure), size of outbreak, and incubation period. The data can also be displayed in map form, revealing potential information such as common source exposure or clustering of cases. Global Positioning System (GPS)/Global Information Systems (GIS) are tools now commonly used in modern epidemiologic outbreak investigations.
- 7. The next step, albeit a process that likely begins from notification of the first case, is to begin to develop hypotheses about the cause of illness and/or source of infection. In general, conducting the initial descriptive epidemiologic analysis of the data will give us clues to better refine our hypotheses. Furthermore, it is important that the investigator speaks with an adequate representative sample of the initial patients to understand potential links between cases. It is important to remember that the working hypotheses must be testable with statistical methods (i.e., chi-square analysis, logistic regression, etc.).
- 8. After careful consideration and development of our initial hypotheses, we must evaluate these hypotheses with analytic methods. Two methodologies are typically used for outbreak investigations: cohort studies or case-control studies. These are described earlier under the “Analytic Epidemiology” section.
- 9. Once the hypotheses have been tested using conventional analytic epidemiologic methods, it may be necessary to refine the hypotheses by conducting additional studies (i.e., laboratory or environmental testing) to further support the conclusions. For example, identifying Cyclospora cayetanensis in the raspberry filling of a wedding cake would greatly increase your epidemiologic evidence that eating cake at the wedding was significantly associated with developing diarrheal illness.60 If no conclusive results were initially revealed, a new hypothesis may be proposed.
- 10. The CDC recommends an explicit step to reconcile epidemiologic findings with the available laboratory and environmental data that have been collected. This is an important step but is often done in parallel with the hypothesis testing.
- 11. The primary purpose of conducting an outbreak investigation is to not only determine the source of the infection but also simultaneously control the spread of the outbreak and prevent additional cases. For example, during an outbreak of yellow fever it may be necessary to vaccinate any at-risk populations, apply insecticide, and educate the community regarding ways to reduce mosquito breeding sites. Planning for this step is often done in an empirical manner at first and refined as better data are accumulated.
- 12. As noted earlier, disease surveillance is one of the key components of a public health system and often is responsible for identification of an outbreak. It is important to remember to continue or even enhance surveillance during an outbreak, to assure that cases are not missed and the control measures that have been implemented are effective.
- 13. Finally, it is imperative to communicate all findings. Unfortunately, this last step is often overlooked. The results of the study should be presented to the stakeholders (i.e., hospital staff, local health authorities, scientific community) so that others can learn from the investigation and recommendations.
Although infectious diseases do not necessarily respect or recognize boundaries and jurisdictions of cities, states, and countries, it is important to remember that local and state health departments, as well as national and international authorities have specific roles and responsibilities. An investigation of a nosocomial outbreak limited to an individual hospital or a diarrheal disease outbreak at a single daycare center would require coordination at the local health department level only. However, if it is determined in the course of the outbreak investigation that the source of the nosocomial outbreak was in multiple states (e.g., from contaminated blood products), the investigation would require coordination with other states and likely national authorities (i.e., CDC) to coordinate the investigation and response across borders. Similarly, if an outbreak was occurring in multiple countries (a pandemic such as SARS or influenza), then coordination would need to occur via WHO and the GOARN.16,17
Consequences of an Outbreak
Outbreaks of infectious disease have the potential to be sensational and may at times lead to significant public relations difficulties. The economic, social, or political disruptions that can result when the public learns about an outbreak may be a significant disincentive to reporting it in a timely fashion and may even lead, in some cases, to lack of cooperation with the outbreak investigation. This may occur at a local level, such as when a restaurant does not desire to be associated with an outbreak of foodborne disease for fear of losing customers, or on an international level, when a country does not report an epidemic for fear of decreased tourism or limited exportation of goods.61 These sensitivities must be considered when investigating an outbreak, dealing with the media, and releasing public statements, with an effort to minimize sensationalism, but impart the correct information and secure the public's health.
The primary goal of any outbreak investigation is to control the disease within the affected population and to prevent the disease from spreading to other individuals or populations. Outbreak investigations are one of the most exciting aspects of epidemiology and are rewarding when they result in a tangible, positive outcome. Outbreak investigations can also be extremely stressful, such as when they are conducted under severe political and/or economic pressure and results are demanded on a short timeline. In these days of frequent pandemic threats, and with the reemergence of numerous diseases, careful preparation and a clear understanding of disease outbreaks is more essential than ever for timely and adequate disease control.