1: Computed tomography: An overview
Learning objectives
On completion of this chapter, you should be able to:
- 1. state the meaning of the terms
- • “transverse axial tomography”
- • “image reconstruction from projections.”
- 2. state terms synonymous with CT.
- 3. outline three steps that constitute the CT process.
- 4. identify major components of a CT scanner and briefly explain how a CT scanner works.
- 5. trace the significant developments in the history of CT, including the contributions of Hounsfield and Cormack.
- 6. identify the essential elements of a digital imaging system.
- 7. identify several applications of volume CT scanning.
- 8. identify what is meant by cinematic rendering.
- 9. identify how artificial intelligence in used in CT image reconstruction.
- 10. identify several features of CT Product Data.
- 11. state the meaning of digital image processing.
Medical imaging has experienced significant changes in both the technological and clinical areas. Innovations are commonplace in the radiology department, and today the introduction of new ideas, methods, and refinements in existing techniques is clearly apparent. The goal of these developments is to optimize the technical parameters of the examination to provide the acceptable image quality at the reduced radiation doses needed for diagnostic interpretation and, more importantly, to provide improved patient care management. One such development, computed tomography (CT), is a revolutionary tool of medicine, particularly in medical imaging. This chapter explores the meaning of CT through a brief description of its fundamental principles and historical perspectives. Furthermore, it summarizes the growth of CT from its introduction in the 1970s to today’s technology, with an emphasis on the physical and technical aspects of CT imaging.
Meaning
The word “tomography” is not new. It can be traced back to the early 1920s, when a number of investigators were developing methods to image a specific layer or section of the body. At that time, terms such as “body section radiography” and “stratigraphy” (from stratum, meaning “layer”) were used to describe the technique. In 1935, Grossman refined the technique and labeled it tomography (from the Greek tomos, meaning “section”). A conventional tomogram is an image of a section of the patient that is oriented parallel to the film.
In 1937, Watson developed another tomographic technique in which the sections were transverse (cross sections); this technique was referred to as transverse axial tomography. However, these images lacked enough detail and clarity to be useful in diagnostic radiology, preventing the technique from becoming fully realized as a clinical tool.
Image reconstruction from projections
CT overcomes limitations in detail and clarity by using the mathematical construct of image reconstruction from projections to produce sharp, clear images of cross-sectional anatomy. Image reconstruction from projections had its theoretic roots in 1917 when the Austrian mathematician Radon proved it possible to reconstruct or build up an image of a two-dimensional (2D) or three-dimensional (3D) object from a large number of its projections from different directions. This procedure has been used in a number of fields, ranging from astronomy to electron microscopy; for example, in astronomy images of the sun have been reconstructed, and in microscopy images of the molecular structure of bacteria can be reconstructed.
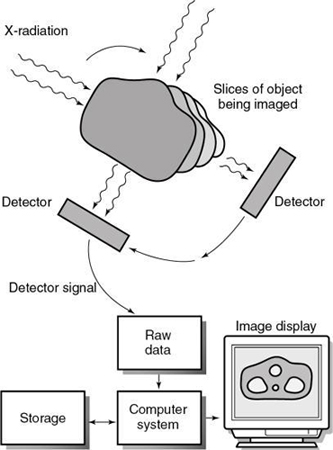
Similarly, images of the human body can be reconstructed by using a large number of projections from different locations (Fig. 1.1). In simplified terms, radiation passes through each cross section in a specific way and is projected onto a detector that sends signals to a computer for processing. The computer produces clear, sharp images of the internal structure of the object.
A more complete definition of this technique has been given by Herman (1980), who stated: “Image reconstruction from projections is the process of producing an image of a two-dimensional distribution (usually some physical property) from estimates of its line integrals along a finite number of lines of known locations.” The CT scanner uses this process to produce a variety of images ranging from cross-sectional 2D and 3D images to virtual reality images of the anatomy or organ system under study.
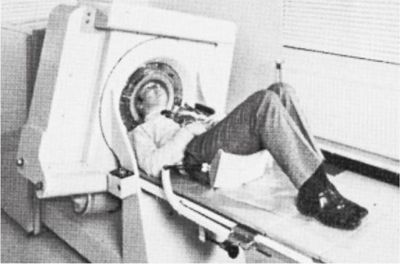
Image reconstruction from projections finally found practical application in medicine in the 1960s through the work of investigators such as Oldendorf, Kuhl, and Edwards, who studied problems in nuclear medicine. In 1963, Cormack also applied reconstruction techniques to nuclear medicine, and in 1967, Hounsfield finally applied reconstruction techniques to produce the world’s first clinically useful CT scanner for imaging the brain (Fig. 1.2).
These studies resulted in two types of CT systems: emission CT, in which the radiation source is inside the patient (e.g., nuclear medicine); and transmission CT, in which the radiation source is outside the patient (e.g., x-ray imaging). Both involve image reconstruction. Image reconstruction has also been used in diagnostic medical sonography and magnetic resonance imaging (MRI). This book discusses only the fundamental principles and technology of x-ray transmission CT.
Evolution of terms
Hounsfield’s work produced a technique that revolutionized medicine and diagnostic radiology. He called the technique computerized transverse axial scanning (tomography) in his description of the system, which was first published in the British Journal of Radiology in 1973. Since then, a number of other terms have appeared in the literature. Terms such as “computerized transverse axial tomography,” “computer-assisted tomography or computerized axial tomography,” “computerized transaxial transmission reconstructive tomography,” “computerized tomography,” and “reconstructive tomography” are not uncommon. The term “computed tomography” was established by the Radiological Society of North America (RSNA) in its major journal Radiology. In addition, the American Journal of Roentgenology accepted this term, which has now gained widespread acceptance within the radiologic community. Throughout the remainder of this book the term computed tomography and its acronym, CT, are used.
Process
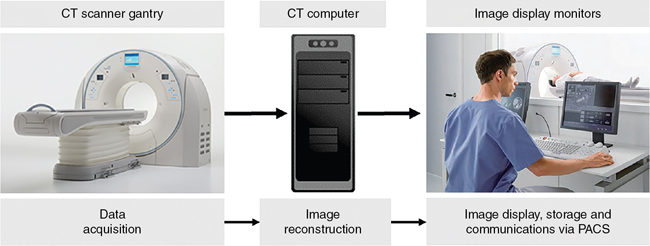
The formation of CT images by a CT scanner involves three steps: data acquisition; image reconstruction; and image display, image postprocessing, image storage, and communication (Fig. 1.3). Image communication and storage of CT images are functions of the Picture Archiving and Communication System (PACS).
Data acquisition
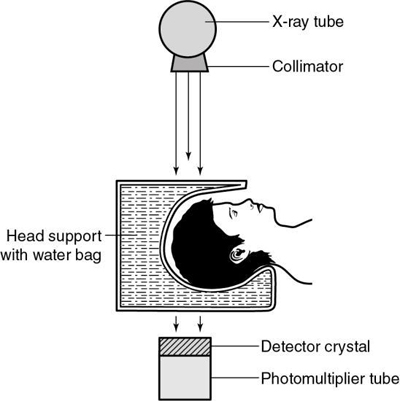
The term “data acquisition” refers to the collection of x-ray transmission measurements from the patient. Once x-rays have passed through the patient, they fall onto special electronic detectors that measure the transmission values, or attenuation values. Enough transmission measurements or data must be recorded to meet the requirements of the reconstruction process. The first brain CT scanner used a data acquisition scheme where the x-ray tube and detectors moved in a straight line, or translated, across the patient’s head, collecting a number of transmission measurements as they moved from left to right (Fig. 1.4). Then the x-ray tube and detector rotated 1 degree and started again to move across the patient’s head, this time from right to left. This process of translate-rotate-stop-rotate, referred to as scanning, is repeated over 180 degrees.
The fundamental problem with this method of data collection was the length of time required to obtain enough data for image reconstruction. Later, more efficient schemes for scanning the patient were introduced (see Chapter 4). These schemes involve rotating the x-ray tube and detectors continuously as the patient moves through the scanner simultaneously. This process results in scanning a volume of tissue rather than a single slice of tissue, which was characteristic of the early CT scanners. Acquiring a volume of tissue during the scanning is now referred to as volume scanning. The continuous rotation of the x-ray tube and detectors and the simultaneous movement of the patient result in a spiral/helical path traced by the x-ray beam. The goal of volume scanning is not only to improve the volume coverage speed but to provide new tools for clinical applications.
Data acquisition also involves the conversion of the electrical signals obtained from the electronic detectors to digital data, which the computer can use to process the image.
Image reconstruction
After enough transmission measurements have been collected by the detectors, they are sent to the computer for processing. The computer uses special mathematical techniques to reconstruct the CT image in a finite number of steps called image reconstruction algorithms (see Chapters 5 and 6). For example, the image reconstruction algorithm used by Hounsfield to develop the first CT scanner was called the algebraic reconstruction technique, belonging to a class of algorithms referred to as iterative reconstruction algorithms.
Analytical reconstruction algorithms have also been developed for spiral/helical volume CT scanners. These include fan-beam–filtered back-projection algorithms and interpolation algorithms, as well as cone-beam image reconstruction algorithms. Today, all new CT scanners use iterative reconstruction algorithms. These algorithms will be described in Chapter 6.
A computer is central to the CT process. In general, this involves a minicomputer and associated microprocessors for performing a number of specific functions. In some CT scanners, array processors perform high-speed calculations, and specific microprocessors perform image-processing operations. Therefore, in this regard, computers are described briefly in Chapter 7.
Image display, processing, storage, recording, and communications
After the computer has performed the image reconstruction process, the reconstructed image can be displayed and recorded for subsequent viewing and stored for later analysis. The image is usually displayed on a cathode ray tube, although other display technologies are now available; for example, touch screen technology is used for scan setup and control in some scanners. However, the cathode ray tube remains the best device for the display of grayscale imagery, although Liquid Crystal Displays (LCDs) are now used. Display monitors are mounted onto control consoles that allow the technologist (operator’s console) and radiologist (physician’s console) to manipulate, store, and record images.
Image manipulation or digital image processing (see Chapter 2), as it is often referred to by some authors, has become popular in CT, and many computer software packages are now available. Images can be modified through image postprocessing to make them more useful to the observer for diagnostic interpretation; for example, transverse axial images can be reformatted into coronal, sagittal, and paraxial sections. In addition, images can also be subjected to other image-processing operations such as image smoothing, edge enhancement, grayscale manipulation, and 3D image processing.
Images can be recorded and subsequently stored in some form of archive. In the past, images were recorded on x-ray film because of its wider grayscale compared with that of instant film. Such recording is accomplished by multiformat video cameras, although laser cameras are now common in radiology departments. It is important to note, however, that film-based recording has become obsolete.
CT images can be stored on magnetic tapes and magnetic disks. More recently, optical storage technology has added a new dimension to the storage of information from CT scanners. In optical storage the stored data are read by optical means such as a laser beam. In this case, storage is referred to as laser storage. Optical storage media include at least three formats: disk, tape, and card (see Chapter 7).
In CT, communications refer to the electronic transmission of text data and images from the CT scanner to other devices such as laser printers; diagnostic workstations; display monitors in the radiology department, intensive care unit, and operating and trauma rooms in the hospital; and computers outside the hospital. Electronic communications in CT require a standard protocol that facilitates connectivity (networking) among multimodalities (CT, MRI, digital radiography, and fluoroscopy) and multivendor equipment. The standard used for this purpose is the Digital Imaging and Communication in Medicine standard established by the American College of Radiology (ACR) and the National Electrical Manufacturers Association. CT departments now operate in a PACS environment that allows the flow of CT data and images among devices and people not only in the radiology department but throughout the hospital. Additionally, the PACS is connected to a Radiology Information System, which in turn is connected to the Hospital Information System. (Networking and PACS are described in Chapter 7.)
How CT scanners work
To enhance understanding of the early experiments and current technology, the technologist must be familiar with the way a CT scanner works (Fig. 1.5). The technologist first turns on the scanner’s power and performs a quick test to ensure that the scanner is in good working order. The patient is in place in the scanner opening, with appropriate positioning for the particular examination. The technologist sets up the technical factors at the control console. Scanning can now begin.
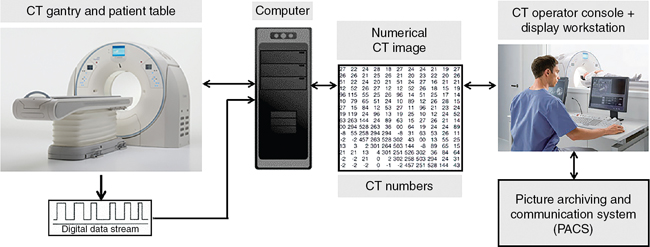
When x-rays pass through the patient, they are attenuated and subsequently measured by the detectors. The x-ray tube and detectors are inside the gantry of the scanner and rotate around the patient during scanning. The detectors convert the x-ray photons (attenuation data) into electrical signals, or analog signals, which in turn must be converted into digital (numerical) data for input into the computer. The computer then performs the image reconstruction process. The reconstructed image is in numerical form and must be converted into electrical signals for the technologist to view on a television monitor. The images and related data are then sent to the PACS, where a radiologist will be able to retrieve and interpret them. Finally, the image can be stored on optical disks.
Historical perspectives
Early experiments
The invention of the CT scanner has revolutionized the practice of radiology. CT is so remarkable that in many cases it generates a dramatic increase in diagnostic information compared with that obtained by conventional x-ray techniques. This extraordinary invention was made possible through the work of several individuals, most notably Godfrey Newbold Hounsfield and Allan MacLeod Cormack (Bates et al., 2012; Beckmann, 2006).
Godfrey newbold hounsfield
Godfrey Newbold Hounsfield (Fig. 1.6) was born in 1919 in Nottinghamshire, England. He studied electronics and electrical and mechanical engineering. In 1951, Hounsfield joined the staff at EMI Limited (now Thorn EMI; manufacturer of records and electronics, and recorded The Beatles under the EMI Label) in Middlesex, where he began work on radar systems and later on computer technology. His research on computers led to the development of the EMIDEC 1100, the first solid-state business computer in Great Britain. For an interesting short commentary on the relationship between EMI and The Beatles, the reader should refer to a book titled X-Ray Vision—The Evolution of Medical Imaging and Its Human Significance by Gunderman (2013).

In 1967, Hounsfield was investigating pattern recognition and reconstruction techniques by using the computer. (In image processing, pattern recognition involves techniques for the observer to identify, describe, and classify various features represented in an image or a signal.) From this work he deduced that if an x-ray beam was passed through an object from all directions and measurements were made of all the x-ray transmission, information about the internal structures of that body could be obtained. This information would be presented to the radiologist in the form of pictures that would show 3D representations.
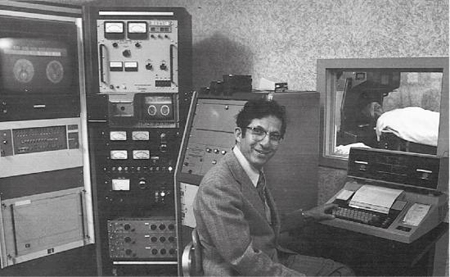
With encouragement from the British Department of Health and Social Security, an experimental apparatus was constructed to investigate the clinical feasibility of the technique (Fig. 1.7). The radiation used was from an americium gamma source coupled with a crystal detector. Because of the low radiation output, the apparatus took about 9 days to scan the object. The computer needed 2.5 hours to process the 28,000 measurements collected by the detector. Because this procedure was too long, various modifications were made and the gamma radiation source was replaced by a powerful x-ray tube. The results of these experiments were more accurate, but it took 1 day to produce a picture (Hounsfield, 1980).

To evaluate the usefulness of this machine, Dr. James Ambrose, a consultant radiologist at Atkinson-Morley’s Hospital, joined the study. Together, Hounsfield and Ambrose obtained readings from a specimen of human brain. The findings were encouraging in that tumor tissue was clearly differentiated from gray and white matter, and controlled experiments with fresh brains from bullocks showed details such as the ventricles and pineal gland. Experiments were also done with kidney sections from pigs.
In 1971, the first clinical prototype CT brain scanner (EMI Mark 1) was installed at Atkinson-Morley’s Hospital and clinical studies were conducted under the direction of Dr. Ambrose. The processing time for the picture was reduced to about 20 minutes. Later, with the introduction of minicomputers, the processing time was reduced further to 4.5 minutes.
In 1972, the first patient was scanned by this machine. The patient was a woman with a suspected brain lesion, and the picture showed clearly in detail a dark circular cyst in the brain. From this moment on, and as more patients were scanned, the machine’s ability to distinguish the difference between normal and diseased tissue was evident (Hounsfield, 1980).
Dr. Hounsfield’s research resulted in the development of a clinically useful CT scanner for imaging the brain. For this work, Hounsfield received the McRobert Award (akin to a Nobel Prize in engineering) in 1972. During the same year, he became a Fellow of the Royal Society and subsequently was awarded the Lasker Prize in the United States and, in 1977, Dr. Hounsfield was appointed Commander of the British Empire. In 1979, Hounsfield shared the Nobel Prize in medicine and physiology with Allan MacLeod Cormack, a physics professor at Tufts University in Medford, Massachusetts, for their contributions to the development of CT. Fig. 1.8 shows a note sent to the author (Euclid Seeram) from Dr. Hounsfield in response to several questions. After receiving this prestigious prize, he was knighted by her majesty Queen Elizabeth and became an Honorary Fellow of the Royal Academy of Engineering. Dr. Hounsfield died on August 12, 2004, at age 84 (Isherwood, 2004). By developing the first practical CT scanner, Dr. Hounsfield opened up a new domain for technologists, radiologists, medical physicists, engineers, and other related scientists.

For a more detailed account of Hounsfield’s pioneering work, the interested reader should refer to the book Godfrey Hounsfield: Intuitive Genius of CT by Stephen Bates, Liz Beckmann, Adrian Thomas, and Richard Waltham (2012), who were friends of Hounsfield and worked with him at EMI. This book includes a description of Hounsfield’s life, work, awards, and publications.
Allan Macleod Cormack
Allan MacLeod Cormack (Fig. 1.9) was born in Johannesburg, South Africa, in 1924. He attended the University of Cape Town where he obtained a Bachelor of Science in Physics in 1944 and earned a Master of Science in Crystallography in 1945. He subsequently studied nuclear physics at Cambridge University before returning to the University of Cape Town as a physics lecturer. He later moved to the United States and was on sabbatical at Harvard University before joining the physics department at Tufts University in 1958.

Professor Cormack developed solutions to the mathematical problems in CT. Later, in 1963 and 1964, he published two papers in the Journal of Applied Physics on the subject, but they received little interest in the scientific community at that time. It was not until Hounsfield began work on the development of the first practical CT scanner that Cormack’s work was viewed as the solution to the mathematical problem in CT (Cormack, 1980). Cormack died at age 74, in Massachusetts on May 7, 1998. Additionally, back in South Africa, Dr. Cormack was granted the Order of Mapungubwe, South Africa’s highest honor, in December 2002, for his contribution to the invention of the CT scanner.
Growth
The first 10 years
Between 1973 and 1983, the number of CT units installed worldwide increased dramatically. Perhaps the first significant technical development came in 1974 when Dr. Robert Ledley (Fig. 1.10), a professor of radiology, physiology, and biophysics at Georgetown University, developed the first whole-body CT scanner. (Hounsfield’s EMI scanner scanned only the head.)
Dr. Ledley graduated with a doctorate in dental surgery from New York University in 1948, and in 1949 he earned a master’s degree in theoretical physics from Columbia University. He holds more than 60 patents on medical instrumentation and has written several books on the use of computers in biology and medicine. In 1990, he was inducted into the National Inventors’ Hall of Fame for the invention of the automatic computed transverse axial CT scanner. In 1997, Dr. Ledley won the National Medal of Technology, an honor awarded by the President of the United States for outstanding contributions to science and technology (Sittig et al., 2006). He also served as president of the National Biomedical Research Foundation at Georgetown University Medical Center, and passed away in 2012.
These pioneering works were followed by the introduction of several generations (a term used to refer to the x-ray beam geometry and method of scanning) of CT scanners. In 1974, a fourth-generation CT system was developed, but it later became obsolete (see Chapter 4). Fig. 1.11 shows the major differences among three different beam geometries (see Fig. 1-11A). The third-generation geometry, however, became the most useful method of acquiring data from the patient, especially in present-day multislice spiral/helical CT scanners (see Fig. 1-11B).

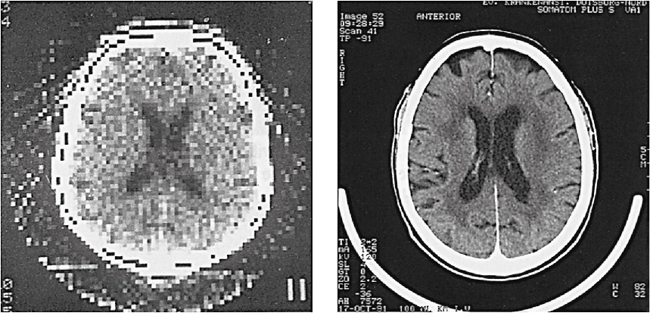
A computer capable of performing multiple functions is central to the CT system. The CT computer has undergone several changes over time (see Chapter 7). Image quality is another significant development as a result of technological changes. Although earlier images appeared “blocky” (pixelated), images acquired with modern-day CT scanners are remarkably improved (Fig. 1.12). Improvements in image quality included improved spatial resolution, decreased scan time, increased density resolution, and changes to the x-ray tube to facilitate the increased loadability required of whole-body scanners. For example, the matrix size in 1972 was 80 × 80; in 1993, it was 1024 × 1024. In addition, the spatial resolution and scan time in 1972 were reported to be three line pairs per centimeter (lp/cm) and 5 minutes, respectively, compared with 15 lp/cm and 1 second, respectively, in 1993 (Kalender, 1995). Increased loadability resulted in scanners capable of dynamic CT examinations that took a series of scans in rapid succession. Later-model CT scanners could operate in several modes such as the prescan localization mode, which produced a survey scan of the region of interest. Rapid reformatting of the axial scans into coronal, sagittal, and oblique sections also became possible.
High-speed CT scanners
In 1975, the first high-speed CT scanner, the dynamic spatial reconstructor (DSR), was installed in the biodynamics unit at the Mayo Clinic. The goal of the DSR was to perform dynamic volume scanning to accommodate imaging of the dynamics of organ systems and the functional aspects of the cardiovascular and pulmonary systems with high temporal resolution as well as imaging anatomic details (Ritman et al., 1991; Robb & Morin, 1991). Research on this unit has since been discontinued.
In the mid-1980s, another high-speed CT scanner was introduced that used electron beam technology, a result of work by Dr. Douglas Boyd and colleagues during the late 1970s at the University of California at San Francisco. The scanner was invented to image the cardiovascular system without artifacts caused by motion. At that time the scanner was called the cardiovascular CT scanner. Later, this scanner was acquired and marketed by Siemens Medical Systems under the name Evolution and was subsequently referred to as the electron beam CT (EBCT) scanner. The most conspicuous difference between the EBCT scanner and conventional CT is the absence of moving parts. At that time, the EBCT scanner was capable of acquiring multislice images in as little as 50 and 100 ms.
The US Food and Drug Administration (FDA) cleared the EBCT scanner in 1983. As of 2007, the EBCT scanner is marketed by General Electric (GE) Healthcare under the name e-Speed and it now features proprietary technologies that play a significant role in imaging the heart. In October 2002, the e-Speed CT scanner received FDA clearance and it is now capable of 33-ms, 50-ms, and 100-ms true temporal resolution to produce images at up to 30 frames per second (GE Healthcare, personal communication, 2007).
Because nearly 20 manufacturers made CT scanners between 1973 and 1983, a number of developments unique to particular manufacturers were also introduced. The evolution of CT continued after 1983, with nearly 10 manufacturers competing for the CT market.
Spiral/Helical CT scanners: Volume scanning
Fig. 1.13 illustrates the difference between two types of data acquisition methods, namely slice-by-slice data acquisition (see Fig. 1-13A) and volume data acquisition (see Fig. 1-13B). In the former approach known as conventional CT, the patient is scanned one slice at a time. The x-ray tube and detectors rotate for 360 degrees or less to scan one slice while the table and patient remain stationary. This slice-by-slice scanning is time-consuming; therefore, efforts were made to increase the scanning of larger volumes in less time. This notion led to the development of a technique in which a volume of tissue is scanned by moving the patient continuously through the gantry of the scanner while the x-ray tube and detectors rotate continuously for several rotations. As a result, the x-ray beam traces a path around the patient to scan a volume of tissue during a single breath hold. This has been referred to a volume data acquisition (see Fig. 1-13B) and it generates several slices compared to the slice-by-slice data acquisition characteristic of the early CT scanners (see Fig. 1-13A). Although some manufacturers call this beam geometry spiral CT (the beam tracing a spiral path around the patient), others refer to it as helical CT (the beam tracing a helical path around the patient). This book uses both terms synonymously.

The idea of this approach to scanning can be traced to three sources (Kalender, 1995). In 1989, the first report of a practical spiral CT scanner was presented at the RSNA meeting in Chicago by Dr. Willi Kalender (Fig. 1.14). Dr. Kalender has made significant contributions to the technical development and practical implementation of this approach to CT scanning. His main research interests are in the areas of diagnostic imaging, particularly the development and introduction of volumetric spiral CT. His work is documented in more than 900 scientific papers, more than 300 original publications among these, and more than 30 patents (Kalender, personal communications, 1999, 2006, 2014).

Dr. Kalender was born in 1949 and studied medical physics in Germany. Subsequently, he continued his studies at the University of Wisconsin in the United States. He later worked with Siemens Medical Solutions in the area of CT, and in 1995 he became professor and chairman of the Institute of Medical Physics, which is associated with the University of Erlanger, Nürnberg, Germany. Dr. Kalender has several awards including the prestigious Cross of the Order of Merit of the Federal Republic of Germany (Kalender, 2014) by the President of the Federal Republic of Germany, 2004.
The spiral/helical CT scanners developed after 1989 were referred to as single-slice spiral/helical or volume CT scanners. In 1992, a dual-slice spiral/helical CT scanner (volume CT scanner) was introduced to scan two slices per 360-degree rotation, thus increasing the volume coverage speed compared with single-slice volume CT scanners.
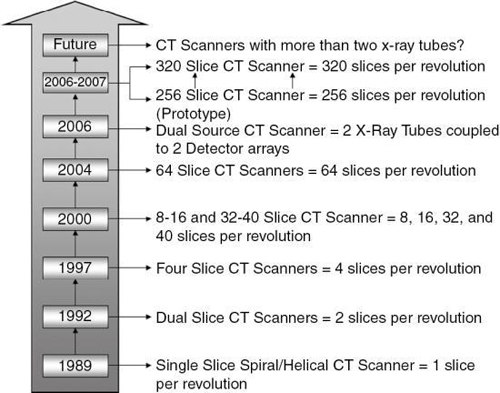
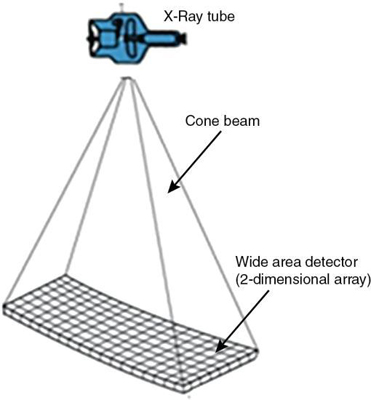
In 1998, a new generation of CT scanners was introduced at the RSNA meeting in Chicago. These scanners are called multislice CT (MSCT) scanners because they are based on the use of multidetector technology to scan four or more slices per revolution of the x-ray tube and detectors, thus increasing the volume coverage speed of single-slice and dual-slice volume CT scanners. The number of slices per revolution has been increasing at a steady pace, as outlined in Fig. 1.15. In 2004, a wide-area detector of a 256-slice prototype CT scanner was undergoing clinical tests (Mori et al., 2006). A characteristic feature of this scanner was its cone-beam geometry (Fig. 1.16).
In addition to the improvements in the performance characteristics—such as minimum scan time, data per 360-degree scan, image matrix, slice thickness, and spatial and contrast resolution—from 1972 to 2004, MSCT scanners are now based on new technologies. These include new x-ray tube and detector technologies to accommodate high-speed imaging, large-bore gantry apertures to facilitate ease of patient positioning and patient access, improved z-axis resolution, radiation dose optimization with dose modulation techniques, integrated software featuring multiple software platforms, and intuitive interfacing and software for data management such as workflow optimization and image processing. Two notable new concepts for MSCT, particularly for scanners that have 16 or greater detector rows, are the reconstruction algorithm and the definition of an important parameter called the pitch. These scanners now use cone-beam image reconstruction algorithms to address the cone-beam geometry as the detector width increases to accommodate 16 to 320 detector rows. The pitch for volume scanners has now been defined by the International Electrotechnical Commission (IEC), after much debate in the literature as to what the exact definition should be. The IEC states that the pitch for MSCT scanners is the ratio of the table feed per revolution of the x-ray tube to the total width of the collimated beam. Pitch is described in Chapter 12.
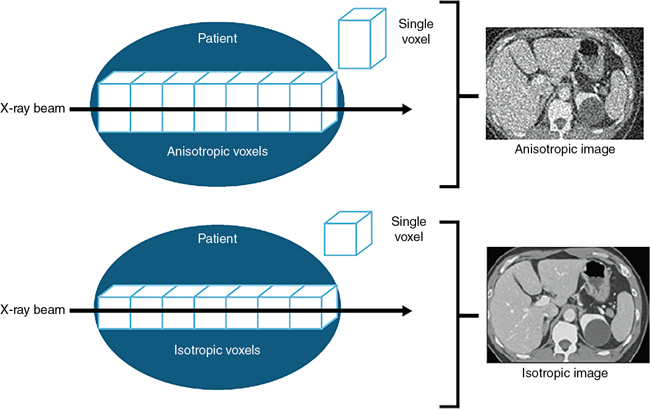
One of the central goals in the development of the CT scanner is to achieve isotropic resolution, where the voxel is a perfect cube (equal length, width, and height) as opposed to nonisotropic resolution, where the voxel is not a perfect cube, as is clearly illustrated in Fig. 1.17. The impact of isotropic resolution on CT images has improved image quality in all three dimensions; hence, 3D images are sharp in appearance and do not exhibit the stair-step artifacts seen in nonisotropic resolution 3D images. Scanners can now achieve isotropic resolution of less than 0.4 mm.
Dual-source CT/dual energy CT: Spectral CT
Dual-source CT (DSCT) is also referred to as dual-energy CT (DECT). As the principle of this scanner is based on the use of two different x-ray photon energy spectra (two x-ray tubes operating at two different kV values), it is also referred to as Spectral CT. The use of these two different x-ray beam spectra provides an examination of materials that have different x-ray beam spectra attenuation properties at different energies. Single-source CT (SSCT) produces images using single energy; DSCT produces images that feature dual-energy data. This data set allows for reconstruction of different types of images.
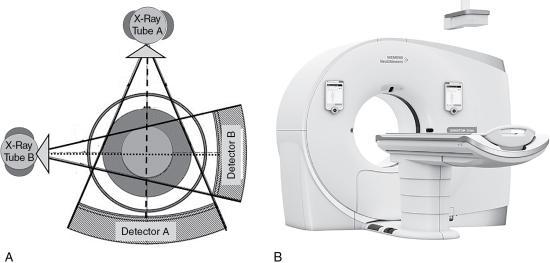
In 2005, Siemens Medical Solutions announced a new type of CT scanner at the RSNA, called the SOMATOM Definition. This is a DSCT scanner that features two x-ray tubes and two detectors (Fig. 1.18) specifically intended for imaging cardiac patients in a very short time. The performance of the DSCT scanner compared with the SSCT scanner in imaging the beating heart at a low and stable heart rate (60 beats/min) is improved because of the higher temporal resolution of the DSCT scanner. Furthermore, as the heart rate increases to 100 beats/min, the DSCT scanner offers much better image quality (sharpness) in both systolic and diastolic phases compared with the SSCT scanner. DECT is discussed in detail in Chapter 9.
Other technical applications of volume CT
Volume CT scanning has resulted in a wide range of applications such as CT fluoroscopy, CT angiography, 3D imaging, virtual reality imaging, and, more recently, improved cardiac CT imaging. CT has found applications in radiation therapy and nuclear medicine technologies as well. In radiation therapy, for example, the CT scanner is now used in CT simulation processes (Fig. 1.19). As noted, the CT simulator includes the CT scanner, which is specially equipped with a flat table top and lasers that facilitate accurate positioning of the patient and is coupled to the radiation treatment planning virtual simulator. As noted by Mutic et al. (2003), “the scanner is accompanied by specialized software which allows treatment planning on volumetric patient CT scans in a manner consistent with conventional radiation therapy simulators.” This scanner can either be installed in the radiology department or in the radiation therapy department. In nuclear medicine, the CT scanner is combined with a positron emission tomography (PET) scanner (Ell, 2006) and single-photon emission tomography (SPECT) to form single units referred to as a PET/CT scanner and a SPECT/CT scanner (Jones et al., 2013). SPECT/CT and PET/CT are described in detail in Chapter 15.

Portable CT
A unique event in the evolution of CT technology was the development of a mobile CT scanner to image patients who are too ill or physically traumatized to be transported to a fixed CT. Philips Medical Systems introduced this type of scanner specifically for use in the operating room, intensive care unit, and emergency trauma unit. The portable CT scanner is compact and mounted on wheels to facilitate transportation of the unit to remote locations in the hospital by technologists. Other portable CT scanners are commercially available from Siemens Healthineers and NeuroLogica, a subsidiary of Samsung Electronics. Portable CT will be described further in Chapter 13.
Clinical efficacy studies
The term “efficacy” is synonymous with effectiveness, efficiency, and performance. A number of investigators designed efficacy studies to test the clinical usefulness of this new diagnostic technique. Studies reported the results of scanning the brain, spinal cord, neck, thorax, abdomen, retroperitoneum, pelvis, and extremities.
CT became well established in the diagnosis of diseases of the central nervous system, and in some cases it eliminated the need for examinations such as pneumoencephalography and reduced the frequency of cerebral angiography. Disorders such as gliomas, metastases, intracranial lesions, aneurysms, infarctions, hemorrhage, and atrophy have been successfully detected by CT. Later, whole-body clinical applications (see later chapters) became effective. In addition, CT proved useful in radiation treatment planning to provide accurate isodose curves and in other areas, such as determination of the mineral salt content in bones, or quantitative CT. Studies using MSCT scanners clearly demonstrated their usefulness in a wide range of clinical applications, including playing a central role in cardiac imaging in applications such as coronary angiography, assessment of ventricular function and pulmonary veins, and calcium scoring (DeRoos, 2006).
Radiation dose studies
A fundamental goal of any new imaging technique is to provide maximum information content with the minimum radiation dose to the patient. Perry and Bridges (1973) measured both the cranial radiation dose and the gonadal radiation dose for a series of scans. Their results provided a foundation for future studies. Initially, the radiation dose to the patient was thought to be negligible because the beam in CT was tightly collimated, but the patient exposure for a series of CT scans usually exceeds that of film radiography of the same area.
Radiation dose is an integral topic in CT technology, because the CT beam geometry and method of acquiring images differ from those of conventional radiography. Several imaging parameters in CT affect dose, including slice thickness, noise, resolution detector efficiency, reconstruction algorithm, collimation, and filtration. Various dose studies have explored the ways in which these factors influence the dose.
These studies have also led to the development of special ways to measure and describe the dose (Kalender, 2005; McNitt-Gray, 2002; Seeram, 1999, 2014). Ionization chambers or thermoluminescent dosimeters are used to measure the dose. Dose descriptors include the single-scan dose profile, multiscan dose profile, CT dose index, multiscan average dose, and isodose curves.
Additionally, manufacturers have developed various schemes to reduce the dose in CT. One scheme uses three elements to keep the patient dose to a minimum during data acquisition: (1) combined applications to reduce exposure, a prepatient filtering technique that reduces the dose by about 15% compared with conventional CT; (2) new ultrafast ceramic detectors that reduce the dose by another 25%; and (3) online dose modulation, whereby the milliamperage (mA) is optimized to the patient characteristics (diameter and absorption) to reduce the dose. This particular development in CT dose reduction is referred to as automatic tube current modulation technique (Iball et al., 2006; Rizzo et al., 2006). Different manufacturers use different methods to do automatic exposure control in CT.
Current approaches to dose control make use of a methodology referred to as dose optimization, which requires not only dose reduction but also using a dose that is within the radiation protection philosophy of the International Commission on Radiological Protection, referred to as “as low as reasonably achievable (ALARA).” This means that the use of lower doses does not compromise the image quality. Image quality must be maintained to meet the diagnostic interpretation requirements of the examination (Seeram, 2019).
Quality control
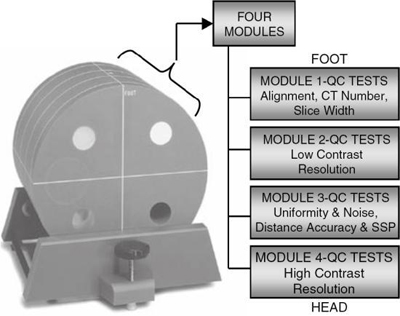
As with any medical imaging system, CT scanners are subject to quality control procedures and tests. These quality control (QC) tests must meet both quantitative and qualitative criteria, which indicate that the scanner is in perfect working condition. Testing system performance is vital to maintain optimal image quality and minimize the production of image artifacts. Because the CT system consists of several mechanical and electronic components, many quality control tests are currently available. These range from simple tests, which the technologist can perform by using various phantoms provided by the manufacturers, to more complex tests that may require the expertise of the radiologic physicist or biomedical engineer. More recently, the ACR has introduced a CT phantom referred to as the ACR phantom, as illustrated in Fig. 1.20, to be used for any CT QC program. The phantom basically consists of four sections that can be imaged simultaneously to generate several test results. Quality control for CT scanners will be described in detail in Chapter 21.
Other uses
CT is useful in areas other than medicine. For example, CT can be used to study internal log defects. Funt and Bryan (1987) investigated the use of CT technology in a sawmill. They developed and tested algorithms that automatically interpreted CT images of logs, and stated, “The computer program uses the high density and elliptical shape of knots to distinguish them from good wood, and the low density and rough texture of rotten areas to separate rotten wood from sound wood.” Habermehl and Ridder (1997) detailed the use of a portable CT scanner to take images of trees to determine wood rots; locate knots, hollows, and other defects; and determine water distribution inside the tree trunk (Fig. 1.21). These portable tree CT scanners use a cesium 137 gamma radiation source with a fan beam falling on an array of about 30 sodium iodide detectors.

CT has also been used in paleoanthropology. Zonneveld et al. (1989) found that CT can visualize the internal anatomy of completely preserved Egyptian mummies (Fig. 1.22; Yasuda et al., 1992). Additionally, Hoffman et al. (2002) reported the use of CT in what they refer to as paleoradiology. Recently, a CT system for dedicated imaging of mummies has become available and will be used in a major research project planned by the Egyptian Supreme Council of Antiquities in conjunction with Siemens Medical Solutions (who donated an MSCT scanner) and the National Geographic Society.

Several cases report the use of CT in paleo-ornithology, oil exploration, fat stock breeding, and other animal investigations (Fig. 1.23). In fat stock breeding, pigs are scanned to determine the meat quality defined as the best combination of water, protein, and fat, thus eliminating the need to kill the pigs for this determination (Fig. 1.24).


Sirr and Waddle (1999) used CT to evaluate bowed stringed instruments such as violins. The scans demonstrated varying degrees of internal damage (e.g., wormholes, air gaps, and plastic deformities of wood) or those resulting from repair (e.g., glue lines, filler substances, and wooden cleats and patches) not seen when the instruments are examined visually. The researchers also concluded that CT facilitated verification of authenticity and proof of ownership.
Another interesting and unique nonmedical use of CT is one that used a multidetector 64-slice CT scanner (Aquilion 64) to find out the combination of a bicycle lock. The lock belonged to the son of Dr. Henning Meyer, MD (one of the authors of the published paper). The little boy had forgotten the combination of the lock. Fortunately, the lock was not on the bicycle.
The lock was scanned using 0.5-mm detector collimation and 350 mA, 120 kV, pitch of 0.33, and 0.4-second rotation time. Additionally, the CT images were reconstructed using a smooth abdominal kernel, and the reconstruction was performed with 0.5-mm section thickness in 0.4-mm increments. The authors indicated that “Orthogonal multiplanar reformations were viewed with the scanner’s workstation to identify the correct code combination.” The authors reported that they used “an unorthodox method to tackle this problem. As conventional radiographs deliver only a superimposed image of the complete lock, we here describe for the first time how multidetector CT helped in identifying the combination of a German-made high-quality bicycle lock” (Meyer et al, 2007). A set of four CT images showed the notches of the lock (dark blotches on the each of four images) and clearly revealed that the combination was 1789. This result made the little boy very happy.
CT scanners are now used at major airports for automated explosives detection. As baggage is scanned, the CT data (numbers) of the contents obtained as a result of the scanning are compared with CT numbers of known explosives or contraband. If the two sets of CT numbers correspond, an alarm is sounded.
The CT scanner is also used in the heavy oil and oil sands industry in Alberta, Canada, to obtain quantitative data on carbonates and oil sands when investigating sites for oil extraction from tar sands. Furthermore, the CT scanner is being used to study permafrost in arctic regions of the world. Quantitative measurements are used to determine the percentage of ice in permafrost cores (Cameron, 2014). In addition, the CT scanner has been used in veterinary medicine at Charles Sturt University in Australia since 2012. In particular, the scanner is useful in providing images of injured horses, birds, reptiles, and mammals. Furthermore, 3D imaging is used to assist in surgical planning, as well as providing diagnoses and managing the treatment of injured animals (Davies, 2014).
Last but not least, CT is now playing a significant role in planetary science, and has found applications in 3D imaging of planetary samples (Hanna and Ketcham, 2017). For example, CT has been used in 3D petrography. Whereas petrography is the systematic description of geological materials, their composition, and organization in hand specimens and thin sections, petrology is the study of the origin, structure, and composition of rocks as defined in the Encyclopedia of Geoarchaeology (Gilbert et al., 2017). CT is also being used in the study of petrofabrics (within geological materials, petrofabrics provide textural information that can be used to infer deformational history and geologic setting); porosity and chemical composition; and ultra-small particles of planetary materials.
Applications of volume scanning
Volume scanning from either single-slice spiral/helical or multislice spiral/helical CT generates vast amounts of data compared with slice-by-slice conventional CT scanning. Several new applications provide radiologists and other physicians with additional tools for taking images of patients with CT and enhancing their own diagnostic effectiveness. These new applications include continuous imaging or CT fluoroscopy, 3D imaging and visualization, CT angiography, CT perfusion, cinematic rendering, cardiac CT imaging, and virtual reality imaging.
CT fluoroscopy
CT fluoroscopy, or continuous imaging, depends on spiral/helical data acquisition methods, high-speed processing, and a fast image-processing algorithm for image reconstruction. In conventional CT, the time lag between data acquisition and image reconstruction makes real-time display of images impossible. CT fluoroscopy allows for the reconstruction and display of images in real time with variable frame rates. In 1996, the US FDA approved real-time CT fluoroscopy as a clinical tool for use in radiology (Katada et al., 1996).
CT fluoroscopy is based on three advances in CT technology: (1) fast, continuous scanning made possible by spiral/helical scanning principles; (2) fast image reconstruction made possible by special hardware performing quick calculations and a new image reconstruction algorithm; and (3) continuous image display by use of cine mode at frame rates of two to eight images per second (Daly & Templeton, 1999).
Other support tools were developed to facilitate interventional procedures in CT fluoroscopy. One such tool, the Fluoro Assisted Computed Tomography System, uses a unique flat-panel amorphous silicon digital detector coupled with an x-ray tube by a C-arm, which is a part of the CT gantry.
CT perfusion
The physical basis of CT prefusion (CTP) was described in an early paper by Konstas et al. (2009), in which the authors explain that CTP is “a functional imaging technique that provides important information about capillary-level hemodynamics of the brain parenchyma and is a natural complement to the strengths of unenhanced CT and CT angiography in the evaluation of acute stroke, vasospasm, and other neurovascular disorders. CTP is critical in determining the extent of irreversibly infarcted brain tissue (infarct “core”) and the severely ischemic but potentially salvageable tissue (“penumbra”). This is achieved by generating parametric maps of cerebral blood flow, cerebral blood volume, and mean transit time.”
Through the years CTP has evolved into two types, namely CTP-static and CTP-dynamic. Whereas the CTP-static approach involves “the assessment of myocardial enhancement acquired at a single time point of the first-pass of contrast material bolus,” in the CTP-dynamic approach “myocardial perfusion is assessed based on myocardial enhancement at multiple timing points of first-pass of the contrast material, which is robust in terms of bolus timing and allows for fully quantitative analysis of myocardial perfusion” (Kitagawa et al, 2018). More recently, dynamic CTP has recently been evaluated using a third-generation DSCT scanner with respect to myocardial coverage and radiation dose (Takafuji et al, 2020).
3D imaging and volume visualization
3D imaging is a popular technique in CT because of the availability of large amounts of digital data. It is now possible on CT scanners, and the results have been promising (Fishman et al., 1991). 3D CT is already used in radiation treatment planning, craniofacial imaging, surgical planning, and orthopedics.
3D images can be obtained by a hardware-based or a software-based approach. The hardware-based approach uses specialized equipment such as electronic computer display units to execute algorithms for 3D imaging, and the software-based approach uses computer programs or software-coded algorithms. These algorithms, or rendering techniques, transform the transaxial CT data into simulated 3D images. In general, two classes of techniques are available for the transformation: surface and volume based. Each technique consists of three steps: volume formation, classification, and image projection. Although volume formation involves stacking images to form a volume with some preprocessing, classification refers to determining the tissue types in the slices. According to Fishman et al. (1991), image projection consists of “projecting the classified volume data in such a manner that a two-dimensional (2D) representation or simulation of the 3D volume is formed.” Additionally, Fishman (2004) reviewed the essentials of 3D rendering, describing the evolution and progress through the years.
Computer graphics has played a role in the evolution and refinement of 3D imaging (Rhodes, 1991). Computer graphics involves the creation, manipulation, and display of pictures or images with the computer. It allows the user to express ideas and information in a visual format and includes various ways to represent data to create and display images by use of graphics programming languages and image-processing techniques.
3D CT has created a new area of interest for technologists (Seeram, 2004, Seeram, 2018) who have the opportunity to participate in its development. Today, 3D articles are appearing more often in the literature to support the increasing 3D applications that can make full use of the large datasets generated by the new MSCT scanners (Bolan, 2013; Dalrymple et al., 2005).
Volume visualization is a term used in the discussion of the display of images in CT. It involves the use of computer programs, or visualization tools, that provide the observer-diagnostician with additional information from the image to facilitate diagnosis. These tools can be simple (e.g., image contrast and brightness [windowing] tools) or advanced (e.g., 3D imaging, interactive, and cine visualization tools). A comprehensive review article on volume visualization is written by Zhang et al. (2011).
Cinematic rendering
Cinematic rendering (CR) was introduced in 2016, and was labeled as a new technique for 3D visualization of cross-sectional image data. CR is “a physically based volume-rendering method that works with random sampling computational algorithms. Different light maps and transfer functions are used to generate a realistic depiction of medical imaging data. This enhanced simulation of the paths of light rays enables CR to provide images with higher quality compared with conventional volume-rendering techniques” (Elshafei et al., 2019). Fundamentally, CR is based on similar steps in volume rendering “that simulates the propagation and interaction of light rays as they pass through the volumetric data, showing a more photorealistic representation of 3D images than achieved with standard volume rendering” (Eid et al., 2017). CR will be described in a little more detail in Chapter 14.
CT angiography
CT angiography is defined as CT imaging of blood vessels opacified by contrast media (Kalender, 1995). During contrast injection, the entire area of interest is scanned with spiral/helical CT and images are recorded when vessels are fully opacified to show arterial or venous phases of enhancement.
CT angiography uses 3D imaging principles to display images of the vasculature through intravenous injection of contrast media compared with those of intraarterial angiograms. Four essential elements are patient preparation; selection of acquisition parameters (total spiral/helical scan time, slice thickness, table speed) to optimize the imaging process; contrast media injection; and postprocessing techniques and visualization tools such as algorithms to display 3D images in interactive cine modes, multiplanar reconstruction, maximum intensity projection, shaded surface display, and VR (Zhang et al., 2011).
CT endoscopy: Virtual reality imaging
Virtual reality is a branch of computer science that immerses users in a computer-generated environment and allows them to interact with 3D scenes. The application of virtual reality concepts to the creation of inner views of tubular structures is called virtual endoscopy (DeWever at al., 2005; Vining, 1999). Volume CT scanners produce large datasets (2D axial images) compared with their conventional slice-by-slice counterparts. Subsequently, volume CT scanners have improved 3D imaging, CT fluoroscopy, CT angiography, and CT virtual endoscopy.
Cardiac CT imaging
To image the beating heart with the goal of reducing motion artifacts and a loss of both spatial and contrast resolution, fast CT scanners such as the EBCT scanner were introduced to overcome these problems and produce good diagnostic images of the heart. Alternatively, the patient’s electrocardiogram (ECG) is used to provide prospective imaging, after it is recorded at the same time as the scanning with stop and go scanners. Subsequently, retrospective imaging has been developed where the ECG is correlated with image reconstruction in spiral/helical CT scanning.
The recent technical developments in MSCT scanners and the introduction of the DSCT scanner open up a whole new avenue for successful imaging of the heart with excellent image quality based on meeting several technical requirements. These include low-contrast resolution to visualize small differences in tissue contrast, high-contrast resolution (spatial resolution) to visualize small structures in the anatomy scanned, and temporal resolution to image fast-moving objects to reduce motion artifacts. These have all been made possible by fast data acquisition and dedicated reconstruction algorithms, such as the segmented (multiple) algorithms that “allow for merging synchronized transmission data from successive heart cycles. The more heart cycles that can be included in the reconstruction, the better the temporal resolution” (DeRoos et al., 2006). In addition, a low pitch factor (to be discussed later) is needed “to record at least two heart cycles and to achieve a temporal resolution in the order of magnitude of 100 ms for typical heart rates between 60-80 beats per minute (BPM)” (DeRoos et al., 2006).
Finally, scan times in cardiac CT may vary from less than 30 s “but preferably below 20 s.” Current 64-slice MSCT scanners are capable of shorter than 20-second scan times. For example, imaging for calcium scoring and coronary angiography use scan times of 2.5 and 10 seconds, respectively (DeRoos et al., 2006). Cardiac CT applications include quantitative assessment of coronary artery calcifications, ventricular function assessment, and coronary angiography assessment of pulmonary veins.
Artificial intelligence applications in CT
Artificial intelligence (AI) is gaining widespread attention in healthcare and especially in medical imaging. Chollet (2018) defines AI as the “effort to automate intellectual tasks normally performed by humans.”
One AI technique that has gained widespread attention in CT is deep learning, and because it is applied to image reconstruction, the technique has been referred to as deep learning reconstruction (DLR). The ultimate goal of developing DLR is to provide improved image quality, dose performance, and reconstruction speed compared with previous image reconstruction algorithms, especially in low-dose CT scanning.
At the time of writing this article, only three examples of DLR algorithms were found. Two are currently available from CT vendors, Canon Medical Systems45 and General Electric (GE) Healthcare29, and were approved by the FDA in 2019. Additionally, another DLR algorithm was developed by the Rensselaer Polytechnic Institute (RPI) and Massachusetts General Hospital (MGH)46. The performance of DL image reconstruction has been evaluated both on phantom and clinical images on noise reduction, noise texture, contrast-to-noise-ratio, and low contrast detectability. The results to date indicate that DL image reconstruction algorithms outperform IR algorithms on these parameters, including fast reconstruction speed to meet the needs of clinical CT examinations. The use of AI in CT will be discussed further in Chapters 6 and 20.
CT scanner product data: Characteristic features
The product data are usually obtained from the manufacturers and usually used during the purchase of a scanner. The essential features of the product include the following:
Of these characteristics, three important ones serve to provide the user with a generalized overview of the scanner in terms of components related to the practical aspects of scanning a patient. These include the performance specifications, image quality considerations, and the operating features. Identifying these characteristics in this chapter emphasizes the important topics from an educational perspective that require a good understanding to ensure a successful examination.
Performance specifications
Examples of these specifications generally include topics such as x-ray generation (generator, x-ray tube), x-ray detection, data processing, data storage, image display, image processing, system and dose management, clinical applications, and data transfer.
Image quality consideration
Examples include the following image quality descriptors: noise, spatial resolution, high-contrast resolution, and high- and low-contrast detectability.
Operating features
The important features relate to patient handling and positioning, scanning, data processing, image display and processing, and patient throughput. The previous characteristics illustrate topics that must be included in a CT course of studies.
Digital image processing
CT is an excellent example of digital image processing (Fig. 1.25). The x-ray beam passes through the patient and falls onto special detectors that convert the x-ray photons into electrical signals (analog signals) converted into numerical data (digital data) for input into a digital computer.
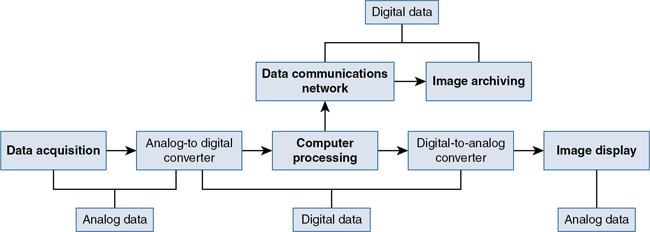
Digital image processing involves the use of a digital computer to process and manipulate digital images. The computer receives an input of a digital image and performs specific operations on the data to produce an output image different from and more useful than the input image. The procedure had its origins at the National Aeronautics and Space Administration Jet Propulsion Laboratory at the California Institute of Technology, where it was used to enhance and restore images from space. Today, the space program generates and uses the largest amount of digital data.
The digital image processing of medical images dates back to the 1970s, about the time CT was introduced to the medical community. Today, digital radiography, digital fluoroscopy, digital subtraction angiography, CT, and MRI use digital image-processing techniques. Digital image processing in radiology allows the observer to process images with use of a wide variety of algorithms to manipulate images to enhance diagnostic interpretation (Seeram, 2004; Seeram & Seeram, 2008; Seeram, 2019). Such postprocessing can generate 3D images by using the stack of sectional images or the volume datasets. Various 3D images such as surface-shaded display and VR images are now commonplace (Bolan, 2013; Dalrymple et al., 2005; Zhang et al., 2011). As noted by expert CT researcher Dr. Kalender, “CT is fully 3D these days” (Kalender, 2005). The essentials of digital image processing are described further in Chapter 2.
Patient care and safety: Impact of CT technical innovations
The above overview of CT provided a glance into the physical aspects including the evolution of technical developments and innovations. This evolution of the CT scanner from 1972 to present day has been marked by solutions to practical problems experienced when scanning the patient.
The developments of the technologies related to CT, such as, for example, the technical evolution of the x-ray tube and detectors, image reconstruction algorithms, computer data processing, dose reduction technologies, and, more importantly, dose optimization strategies, are all intended to improve and enhance the care and management of the patient in CT. It is important therefore that operators have a thorough understanding of not only the basic physics but the technical aspects of CT including instrumentation, image reconstruction algorithms, image quality, radiation dose optimization, and quality control, as these play vital roles in the development and implementation of CT protocols, all for the benefit of the patient while undergoing examinations in the CT department.
Review questions
Answer the following questions to check your understanding of the materials studied.
- 1. Which of the following does not produce a transverse axial sectional image?
- 2. The acronym of choice for use in articles published in the RSNA journal, Radiology, is:
- 3. Who developed the first clinically useful CT scanner?
- 4. Which company pioneered the development of the first useful CT scanner for imaging the head?
- 5. Who shared the Nobel Prize in Medicine and Physiology for his contribution to the development of CT?
- 6. Who played a significant role in the development of spiral CT?
- 7. Which of the following is true?
- 8. The primary goal of spiral/helical CT scanning is to:
- 9. Which of the following applications of volume CT is based on volume formulation, classification, and image projection?
- 10. Which of the following is based on virtual reality principles?
References
Bates S, Beckman L, Thomas A. & Waltham R. Godfrey Hounsfield: intuitive genius of CT British Journal of Radiology 1019, 2012;85: e1165.
Beckmann E.C. CT scanning in the early days British Journal of Radiology 2006;79: 5-8.
Bolan C. Routine 3D imaging becomes a reality Applied Radiology 2013;42: 27-31.
Cameron S. The usefulness of a 320-row CT scanner in the oil industry Visions 2014;23: 17-19.
Chollet F. Deep learning with python 2018; Manning Publications Shelter Island NY.
Cormack A.M. Early two-dimensional reconstruction and recent topics stemming from it, Nobel Award address Medical Physics 1980;7: 277-282.
Dalrymple N.C, Prasad S.R, Freckleton M.W., et al. Introduction to the language of three-dimensional imaging with multidetector CT Radiographics 2005;25: 1409-1428.
Daly B. & Templeton P.A. Real-time CT fluoroscopy: Evaluation of an interventional tool Radiology 1999;211: 309-315.
Davies E. Veterinary CT with the Alexion Visions 2014;24: 14-17.
DeRoos A, Kroft L.J.M, Bax J.J, Lamb H.J. & Gelejins J. Cardiac applications of multislice computed tomography British Journal of Radiology 2006;79: 9-16.
DeWever W, Bogaert J. & Verschakelen J.A. Virtual bronchoscopy: Accuracy and usefulness—An overview Seminars in Ultrasound CT and MRI 2005;26: 364-373.
Eid M, De Cecco C.N, Nance J.W. & Jret al. Cinematic rendering in CT: A novel, lifelike 3D visualization technique AJR 2017;209: 370-379.
Ell P.J. The contribution of PET/CT to improved patient management British Journal of Radiology 2006;79: 23-36.
Elshafei M, Binder J, Baecker J., et al. Comparison of cinematic rendering and computed tomography for speed and comprehension of surgical anatomy JAMA Surgery 8, 2019;154: 738-744 doi:10.1001/jamasurg.2019.1168.
Fishman E.K. 3D rendering: Principles and techniques E.K. Fishman & R.B. Jeffrey. Multidetector CT: Principles, techniques, and clinical applications 2004; Lippincott Williams & Wilkins Philadelphia, PA.
Fishman E.K, Magid D, Ney D.R., et al. Three-dimensional imaging Radiology 1991;181: 321-337.
Funt F. & Bryant E.C. Detection of internal log defects by automatic interpretation of computer tomography images Forest Products Journal 1987;37: 56-62.
Gilbert A.S, Goldberg P, Holliday V.T, Mandel R.D. & Sternberg R.S. Encyclopedia of geoarchaeology 2017; Springer Science+Business Media Dordrecht, Netherlands.
Gunderman R.B. X-ray vision-The evolution of medical imaging and its human significance 2013; Oxford University Press Oxford, UK.
Habermehl A. & Ridder H.W. γ-Ray tomography in forest and tree sciences U. Bonse. Developments in x-ray tomography: Proceedings of the SPIE 1997; SPIE Germany 234-243.
Hanna R.D. & Ketcham R.A. X-ray computed tomography of planetary materials: A primer and review of recent studies Chemie der Erde 2017;77: 547-572.
Herman G.T. Image reconstruction from projections: The fundamentals of computerized tomography 1980; Academic Press New York.
Hoffman H, Torres W.E. & Ernst R.D. Paleoradiology: Advanced CT in the evaluation of nine Egyptian mummies Radiographics 2002;22: 377-385.
Hounsfield G.N. Computed medical imaging, Nobel Award address Medical Physics 1980;7: 283-290.
Iball G.R, Brettle D.S. & Moore A.C. Assessment of tube current modulation in pelvic CT British Journal of Radiology 2006;79: 62-70.
Isherwood I. Sir Godfrey Newbold Hounsfield–In memoriam European Radiology 2004;14: 2152-2153.
Jones D.W, Hogg P. & Seeram E. Practical SPECT/CT in nuclear medicine 2013; Springer London.
Kalender W. Spiral CT angiography L.W. Goldman & J.B. Fowlkes. Medical CT and ultrasound: Current technology and applications 1995; American Association of Physicists in Medicine New London, CT.
Kalender W. Computed tomography–Fundamentals, system technology, image quality, applications 2005; Publicis Corporate Publishing Erlangen, Germany.
Katada K, Kato R, Anno H., et al. Guidance with real-time CT fluoroscopy: Early clinical experience Radiology 1996;200: 851-856.
Kitagawa K, Goto Y, Nakamura S., et al. Dynamic CT perfusion imaging: State of the art CVIA 2, 2018;2: 38-48.
Konstas A.A, Goldmakher G.V, Lee T.Y. & Lev M.H. Theoretic basis and technical implementations of CT perfusion in acute ischemic stroke, part 1: Theoretic basis American Journal of Neuroradiology 2009;30: 662-668.
McNitt-Gray M.F. Radiation dose in CT Radiographics 2002;22: 1541-1553.
Meyer H, Dewey M, Issever A.S. & Rogalla P. How multidetector CT can help open bike locks Radiology 2007;245: 921.
Mori S, Endo M, Nishizawa K, Murase K, Fujiwara H. & Tanada S. Comparison of patient doses in 256-slice CT and 16-slice CT scanners British Journal of Radiology 2006;79: 56-61.
Mutic S, Palta J.R, Butker E.K., et al. Quality assurance for computed tomography simulators and computed tomography simulation process: Report of the AAPM Radiation Therapy Committee Task Group No 66 Medical Physics 2003;30: 2762-2792.
Perry B.J. & Bridges C. Computerized transverse axial scanning (tomography), part 3 British Journal of Radiology 1973;46: 1048-1051.
Rhodes M.L. Computer graphics in medicine: The past decade IEEE Computer Graphics and Applications 1991;4: 52-54.
Ritman E.L, Robb R.A. & Wood E.H. Synchronous volumetric imaging of noninvasive vivisection of cardiovascular and respiratory dynamics: Evolution of current perspectives E.R. Giuliani. Cardiology: Fundamentals and practice 1991; Mosby St. Louis, MO.
Rizzo S, Kalra M, Schmidt B., et al. Comparison of angular and combined automatic tube current modulation techniques with constant tube current CT of the abdomen and pelvis American Journal of Roentgenology 2006;186: 673-679.
Robb R.A. & Morin R.L. Principles and instrumentation for dynamic X-ray computed tomography M.L. Marcus, H.R. Schelbert, D.J. Skorton & G.L. Wolf. Cardiac imaging: A comparison to Braunwald’s heart disease 1991; WB Saunders Philadelphia, PA.
Seeram E. Radiation dose in CT Radiologic Technology 1999;70: 534-556.
Seeram E. Digital image processing Radiologic Technology 2004;75: 435-452.
Seeram E. Computed tomography dose optimization Radiologic Technology 2014;85: 655-671.
Seeram E. CT at a Glance 2018; John Wiley and Sons Hoboken, NJ.
Seeram E. An overview of correlational research Radiologic Technology 2, 2019;91: 176-179.
Seeram E. & Seeram D. Image postprocessing in digital radiology: A primer for technologists Journal of Medical Imaging and Radiation Sciences 2008;39: 23-41.
Siemens Medical Solutions. (2005) Archaeology—High tech meets history. SOMATOM Sessions No. 16 33–34.
Sirr S.A. & Waddle J.R. Use of CT in detection of internal damage and repair and determination of authenticity in high-quality bowed stringed instruments Radiographics 1999;19: 639-646.
Sittig D.F, Ash J.S. & Ledley R.S. The Story Behind the Development of the First Whole-body Computerized Tomography Scanner as Told by Robert S. Ledley Journal of the American Medical Informatics Association 5, 2006;13: 465-469.
Takafuji M, Kitagawa K, Ishida M., et al. Myocardial coverage and radiation dose in dynamic myocardial perfusion imaging using third-generation dual-source CT Korean Journal of Radiology 1, 2020;21: 58-67.
Vining D.J. Virtual colonoscopy Seminars in Ultrasound CT and MRI 1999;20: 56-60.
Yasuda T, Ohsihita H. & Toriwaki J. 3D visualization of an ancient Egyptian mummy IEEE Computer Graphics and Applications 1992;2: 13-17.
Zhang Q, Eagleson R. & Peters T.M. Volume visualization: A technical overview with a focus on medical applications Journal of Digit Imaging 4, 2011;24: 640-664.
Zonneveld F, Spoor F. & Wind J. The use of the CT in the study of the internal morphology of hominid fossils Medicamundi 1989;34: 117-127.
Bibliography
Dümmling K. 10 years’ computed tomography: A retrospective view Electromedica 1984;52: 13-28.
Hounsfield G.N. Computed medical imaging, Nobel Award address Medical Physics 1980;7: 283-290.
Klingenbeck-Regn K. & Oppelt A. Dose in CT scanning-physical relationships and potentials for dose saving Electromedica 1998;66: 26-30.
Schwierz G. & Kirchgeorg M. The continuous evolution of medical X-ray imaging, I: The technically driven stage of development Electromedica 1995;63: 2-7.
Wender R, Fontham E.T, Barrera E. & Jret al. American Cancer Society lung cancer screening guidelines CA: A Cancer Journal for Clinicians 2013;63: 107-117.