Chapter 4: Lung Volumes, Airway Resistance, and Gas Distribution Tests
After studying the chapter and reviewing the figures, tables, and case studies, you should be able to do the following:
Entry-level
- 1. Describe the measurement of lung volumes using gas-dilution/washout methods.
- 2. Explain two advantages of measuring lung volumes using the body plethysmograph.
- 3. Calculate residual volume and total lung capacity from functional residual capacity (FRC) and the subdivisions of vital capacity (VC).
- 4. Identify a restricted disease process from measured lung volumes.
- 5. Describe the measurement of airway resistance using the body plethysmograph.
Advanced
- 1. Calculate FRC using helium-dilution and nitrogen-washout methods.
- 2. Describe the correct technique for measuring thoracic gas volume using body plethysmography.
- 3. Identify air trapping and hyperinflation using measured lung volumes.
- 4. Describe the differences between Raw, sGaw, and sRaw.
- 5. Identify uneven distribution of gas in the lungs by either single- or multiple-breath techniques.
Key Terms
closed-circuit, multiple-breath helium dilution (FRCHe)
FRCpleth (FRC measured with the body plethysmograph)
functional residual capacity (FRC)
lung volume reduction surgery (LVRS)
open-circuit, multiple-breath nitrogen-washout technique (FRCN2)
single-breath nitrogen-washout test (SBN2)
specific airway conductance (sGaw)
Jeffrey M. Haynes, RRT, RPFT, FAARC
The chapter introduces the measurement of absolute lung volumes beyond the inspired and expired lung volumes measured by spirometry. The gas volume remaining in the lungs after the vital capacity (VC) has been exhaled must be measured indirectly. Several methods can accomplish this. Each method has its own advantages and disadvantages. Two methods—helium (He) dilution and nitrogen (N2) washout—involve having the patient breathe gases or gas concentrations not normally present in the lungs: He or 100% oxygen (O2). These techniques are sometimes referred to as dilutional lung volumes. The gas-dilution techniques can also provide information about the distribution of gas in the lungs.
A third method uses the body plethysmograph to measure the thoracic gas volume (VTG). The use of the body plethysmograph also allows the measurement of airway resistance (Raw) and the volume-associated parameters of specific airway conductance (sGaw) and specific airway resistance (sRaw). Conventional radiographs, nuclear medicine imaging of the lungs, computerized tomography (CT), and magnetic resonance imaging (MRI) may also provide an estimate of lung volumes, especially in patients with a limited ability to cooperate. However, these methods are more complex, may involve radiation, can be quite costly, and at present are not used routinely in clinical care.
Lung Volumes: Functional Residual Capacity, Residual Volume, Total Lung Capacity, And Residual Volume/Total Lung Capacity Ratio
Description
Functional residual capacity (FRC) is the volume of gas remaining in the lungs at the end of a quiet breath. On a simple spirogram, this point is termed the end-expiratory level (see Fig. 2.1). Residual volume (RV) is the volume of gas remaining in the lungs at the end of a maximal expiration, regardless of the lung volume at which exhalation was started (see Fig. 2.1). Total lung capacity (TLC) is the volume of gas contained in the lungs after maximal inspiration. FRC, TLC, and RV are reported in liters (L) or milliliters (mL) corrected to body temperature, pressure, and saturation (BTPS). The RV/TLC ratio defines the fraction of TLC that cannot be exhaled (RV), expressed as a percentage.
Thoracic gas volume (VTG) is the absolute volume of gas in the thorax at any point in time and any level of alveolar pressure. VTG is only measured when using a body plethysmograph to measure lung volumes. VTG is usually measured at the end-expiratory level and is therefore usually close to the FRC. VTG is not a physiologic measure like FRC; it is simply the lung volume where closed-shutter breathing is performed to calculate FRC. The VTG is reported in liters or milliliters, BTPS.
Technique
There are a variety of methods for measuring absolute lung volumes (Table 4.1). FRC is measured directly with the open-circuit multiple-breath N2-washout, closed-circuit multiple-breath He-dilution, and body plethysmographic techniques. Once FRC and VC have been measured, RV and TLC can be calculated. TLC can be estimated directly with the single-breath N2 washout and single-breath He dilution as part of the diffusing capacity (Dlco) test and by chest imaging techniques. RV can only be measured indirectly once FRC or TLC has been determined.
Table 4.1
| Method | Lung Volume | Advantages/Disadvantages |
|---|---|---|
| Multiple-breath He dilution | FRC | Simple, relatively inexpensive; affected by distribution of ventilation in moderate or severe obstruction; multiple-breath; requires IC and ERV to calculate other lung volumes. Requires more time to repeat measurements. |
| Multiple-breath N2 washout | FRC | Simple, relatively inexpensive; affected by distribution of ventilation in moderate or severe obstruction; multiple-breath; requires IC and ERV to calculate other lung volumes. Requires more time to repeat measurements. |
| Single-breath N2 washout | TLC | Calculated from single-breath N2 distribution test; may underestimate lung volume in the presence of obstruction. |
| Single-breath He (or other inert gas; e.g., neon) dilution | TLC | Calculated as part of Dlco (VA); may underestimate lung volume in the presence of obstruction. |
| Plethysmography | VTG (FRCpleth) | Plethysmographic method more complex but very fast; tends to be more accurate in the presence of airway obstruction than gas dilution techniques. |
| Chest radiograph | TLC | Requires posterior-anterior and lateral chest x-ray films; must breath hold at TLC; not accurate in the presence of diffuse, space-occupying diseases. |
| Chest computerized tomography (CT) | TLC | Involves radiation exposure and increased cost; must breath hold at TLC. Must be performed in the supine position which may affect lung volumes. Underestimates lung volumes in the presence of airway obstruction. |
| Magnetic resonance imaging (MRI) | TLC | No radiation exposure; very costly; research tool only. Must be performed in the supine position which may affect lung volumes. |
Dlco, Diffusing capacity; ERV, expiratory reserve volume; FRC, functional reserve capacity; IC, inspiratory capacity; N2, nitrogen; TLC, total lung capacity; VA, alveolar volume; VTG, thoracic gas volume.
Open-Circuit, Multiple-Breath Nitrogen Washout
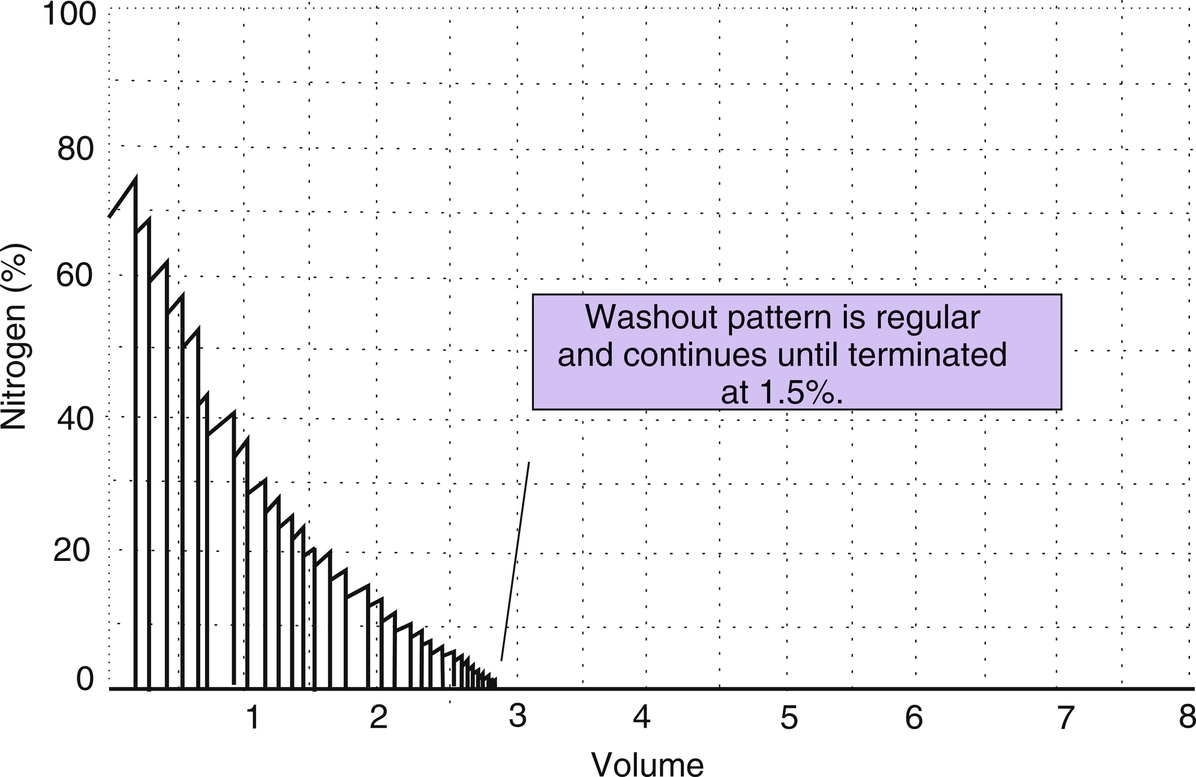
Determination of FRC with the open-circuit multiple-breath nitrogen-washout technique (FRCN2) is based on washing out the N2 from the lungs while the patient breathes 100% O2 for several minutes. At the start of the test, the N2 concentration in the lungs is approximately 75% to 80%. As the patient breathes 100% O2, the N2 in the lungs is gradually washed out, and the total expired volume is measured. At the end of the test, the N2 concentration in the lungs is approximately 1.5%. The initial N2 concentration, amount of N2 washed out, and final N2 concentration are measured and can then be used to calculate the volume of air in the lungs at the start of the test (FRC) using the following formula:

where:
- FEN2final = fraction of N2 in volume expired
- FAN2alveolar1 = fraction of N2 in alveolar gas initially
- FAN2alveolar2 = fraction of N2 in alveolar gas at end (from an alveolar sample)
- N2tissue = volume of N2 washed out of blood/tissues
A correction must be made for N2 washed out of the blood and tissue. For each minute of O2 breathing, approximately 30 to 40 mL of N2 is removed from blood and tissue. N2tissue = 0.04 times T (where T is the time of the test). This value is subtracted from the total volume of N2 washed out.
The original N2-washout technique lasted 7 minutes. However, not all the N2 in the lungs may be washed out even after 7 minutes of 100% O2 breathing. The FAN2alveolar2 is measured at the end of the test and subtracted from the initial N2 concentration. Correction for the “switch-in” error should also be made (see Correcting for the Switch-in Error section later in this chapter). The final FRC is then corrected to BTPS, and the volume of the equipment dead space (including filters) must be subtracted (see the Sample Calculations on the Evolve website, http://evolve.elsevier.com/Mottram/Ruppel/).
To obtain RV, the expiratory reserve volume (ERV) measured immediately after the acquisition of FRC as a “linked” maneuver (i.e., without the patient coming off the mouthpiece) is subtracted from the FRC:

To obtain TLC, the calculated value for RV is added to the “linked” inspiratory vital capacity (IVC):

Some available commercial systems use a rapid N2 analyzer in combination with a spirometer to provide a “breath-by-breath” analysis of expired N2 (Fig. 4.1A). An alternative approach is to use fast-response O2 and carbon dioxide (CO2) analyzers to calculate the concentration of N2 in expired gas during the washout:

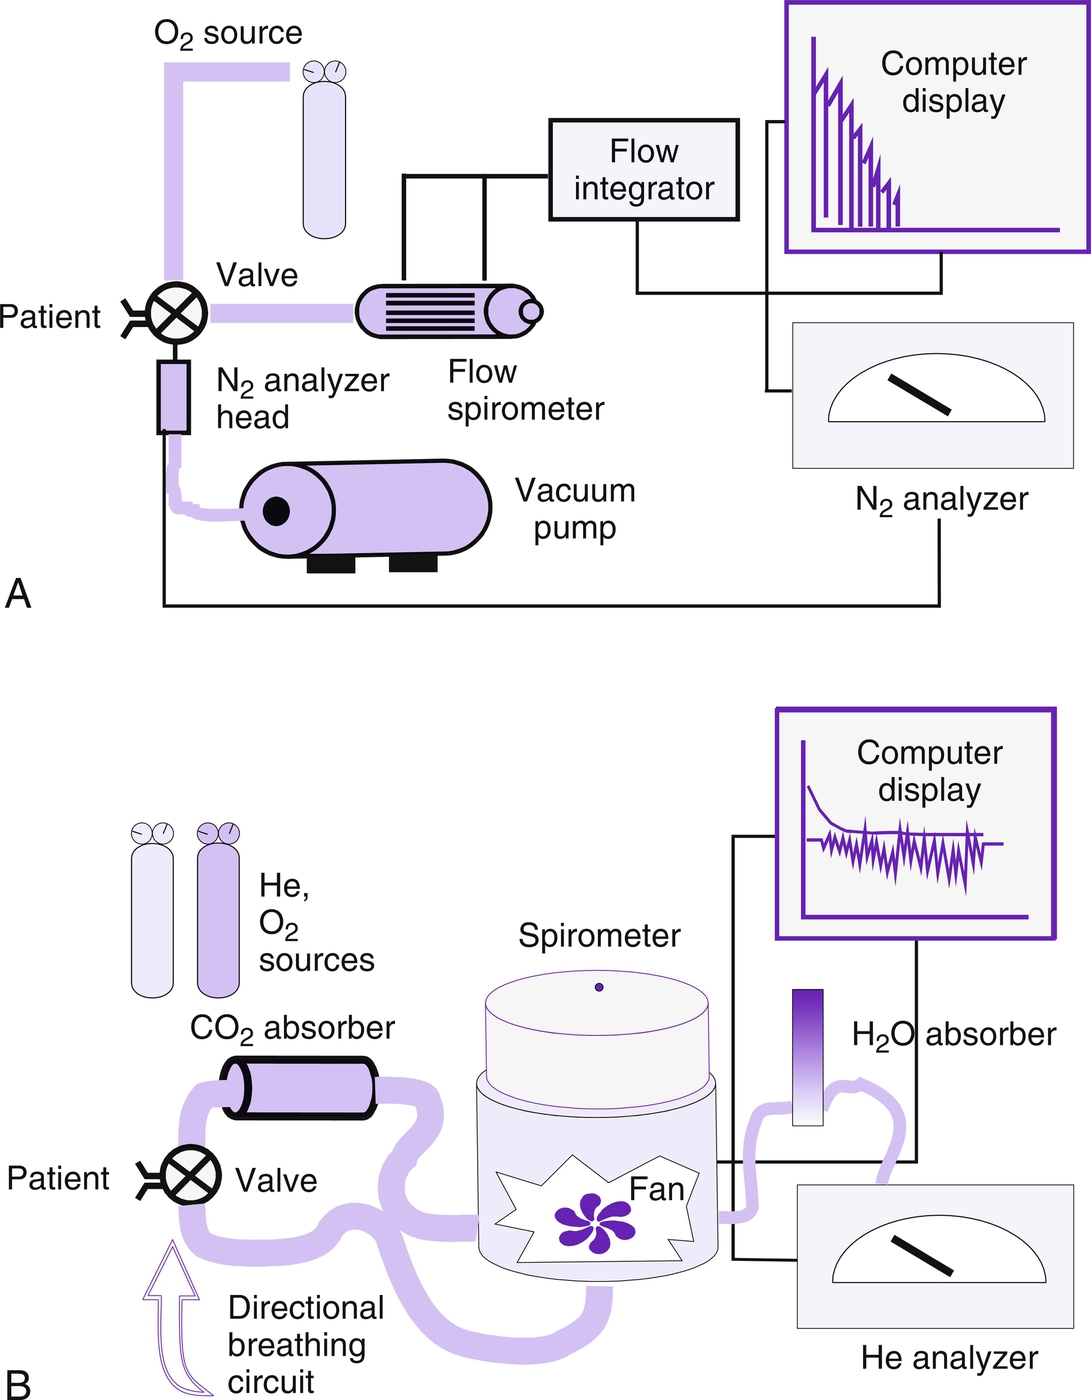
(A) Open-circuit equipment used for N2-washout determination of FRC. The patient inspires O2 from a regulated source and exhales past a rapidly responding N2 analyzer into a pneumotachometer. FRC is calculated from the total volume of N2 exhaled and the change in alveolar N2 from the beginning to the end of the test (Fig. 4.2 and open-circuit method). (B) Closed-circuit equipment used for He-dilution FRC determination includes a directional breathing circuit with a volume-based spirometer, He analyzer, CO2 absorber, O2 source, and water absorber. A breathing valve near the mouth allows the patient to be “switched in” to the system after He has been added and the system volume determined. Tidal breathing and the He-dilution curve are displayed on the computer.
where:
- FEo2 = fraction of O2 in expired gas (dry)
- FEco2 = fraction of CO2 in expired gas (dry)
In these fast methods, the patient, wearing a nose clip, breathes through a mouthpiece-valve system. Precisely at end expiration, a valve is opened to allow 100% O2 breathing to begin. Each breath of 100% O2 washes out some of the residual N2 in the lungs. Analog signals proportional to N2 concentration and volume (or flow) are integrated to derive the volume of N2 exhaled for each breath. Values for each breath are summed to provide a total volume of N2 washed out (Fig. 4.2). The test is continued until the N2 in alveolar gas has been reduced to approximately 1.5% (Criteria for Acceptability 4.1). Some older systems terminate the test at 7 minutes. However, the O2 breathing should be continued until alveolar N2 falls to less than 1.5% for at least three consecutive breaths. A change in inspired N2 concentration of greater than 1% or sudden large increases in expiratory N2 concentrations indicate a leak, in which case the test should be stopped and repeated.
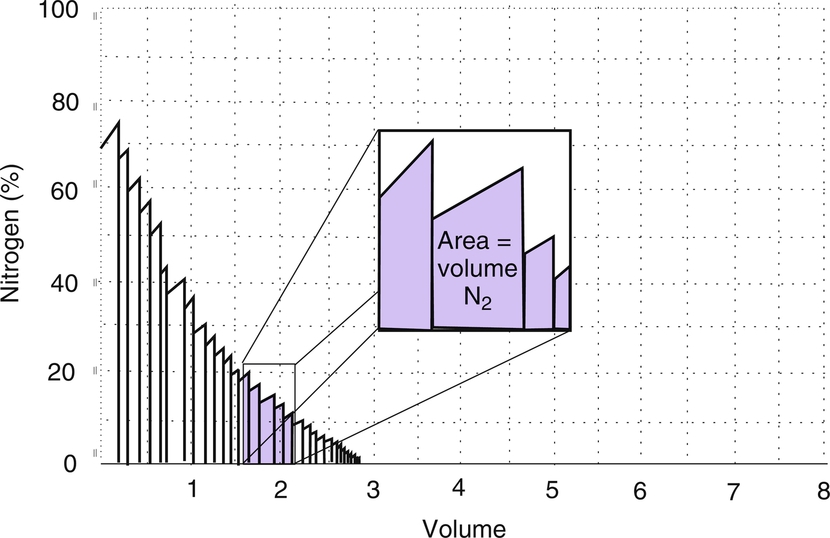
The concentration (or log concentration) of N2 is plotted against time or against the volume expired as the patient breathes through a circuit (Fig. 4.1A). The volume of N2 expired with each breath is measured by integrating flow and N2 concentration to determine the area under each curve (see inset). FRC is determined by dividing the volume of N2 expired by the change in alveolar N2 from the beginning to the end of the test, with corrections, as described in the text.
At least one technically satisfactory FRCN2 determination should be made. If additional washouts are performed, a waiting period of at least 15 minutes is recommended to allow normal concentrations of N2 to be reestablished in the lungs, blood, and tissues. If more than one FRC measurement is obtained, the mean of the technically acceptable results that agree within 10% should be reported.
Some pulmonary function systems use pneumotachometers that may be sensitive to the composition of expired gas. These devices correct for changes in the viscosity of the gas as O2 replaces N2 in the expirate. Such corrections are easily accomplished by software or electronic correction of the analyzer output.
Closed-Circuit, Multiple-Breath Helium Dilution
FRC can also be determined by equilibrating the gas in the lungs with a known volume of gas containing He (closed-circuit, multiple-breath helium dilution [FRCHe]). A spirometer is filled with a known volume of air, and then a volume of He is added so that a concentration of approximately 10% is achieved (see Fig. 4.1B). The exact concentration of He and spirometer volume are measured and recorded before the test is begun. The patient breathes through a valve that allows a connection to a rebreathing system. The valve is opened at the end of a quiet breath (i.e., the end-expiratory level). Then the patient rebreathes the gas in the spirometer with a CO2 absorber and desiccant (absorbs H2O produced from CO2 absorption) in place until the concentration of He falls to a stable level (Fig. 4.3). A fan or blower mixes the gas within the spirometer system. O2 is added to the spirometer system to maintain the Fio2 near or above 0.21 and to keep the system volume relatively constant.
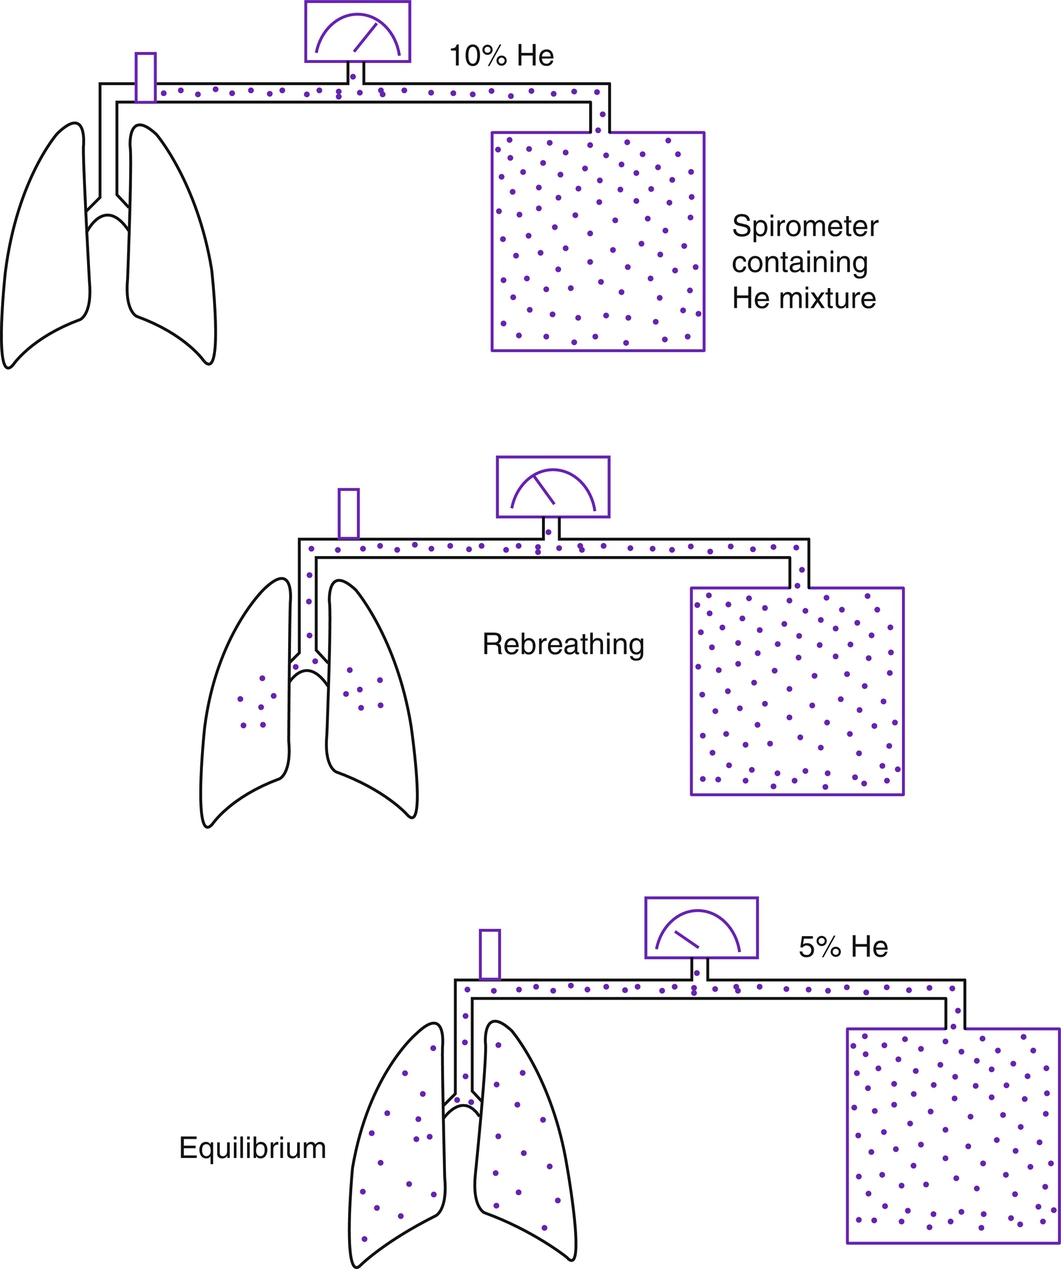
At the beginning of the test, the patient’s lungs contain no He. The spirometer contains a known concentration of He in a known volume (see text). The patient then rebreathes the He mixture from this system (Fig. 4.1B). He is diluted until equilibrium is reached. At the end of the test, the known volume of He has been diluted in the rebreathing system and the lungs. FRC is calculated from the change in He concentration and the known system volume. The patient must be switched from breathing air to the He mixture at the end-expiratory level for accurate measurement of FRC. RV is derived by subtracting the ERV. (Modified from Comroe, J. H. Jr., Forster, R. E., Dubois, A. B., et al. [1962]. The lung: Clinical physiology and pulmonary function tests [2nd ed.]. St. Louis, MO: Mosby.)
An older method (i.e., the bolus method) added a large volume of O2 to the spirometer at the beginning of the test. The patient then rebreathed and gradually consumed the O2. Because of the possibility of equilibrium not being attained before the added O2 was depleted, this method is no longer used.
Equilibration between normal lungs and the rebreathing system takes place in approximately 3 minutes when a 10% He mixture in a system volume of 6 to 8 L is used (Fig. 4.4). The final concentration of He is then recorded. The system volume is computed first. System volume is the volume of the spirometer, breathing circuitry, and valves before the patient is connected. It can be calculated as follows:

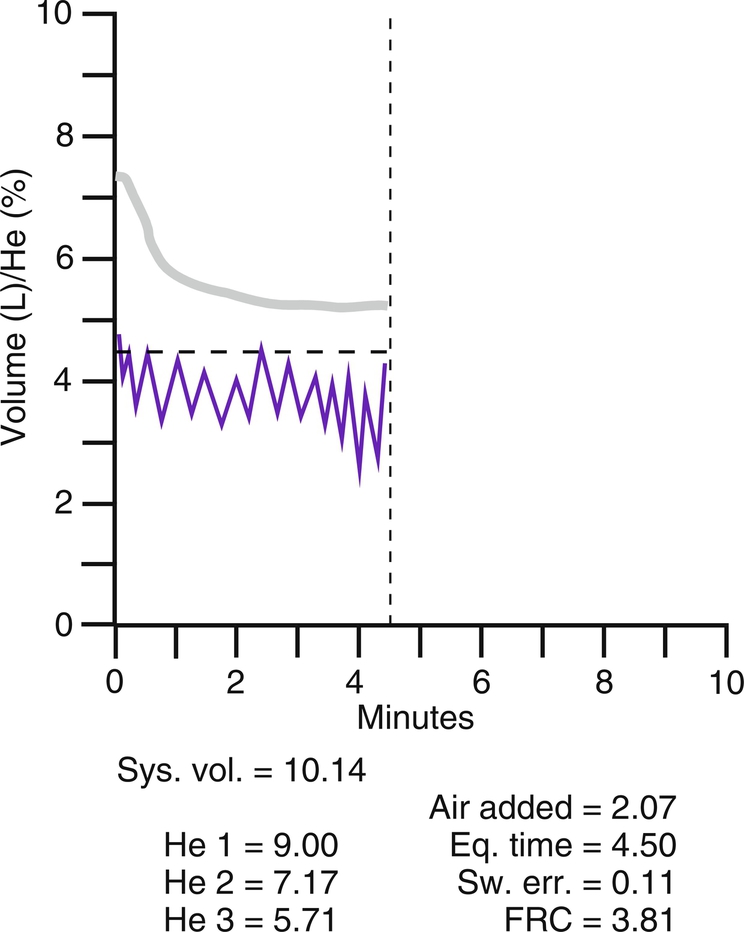
Graph shows He concentration from the beginning of rebreathing until equilibrium is achieved (upper line). The system volume of the spirometer and the patient’s tidal breathing is also shown (lower line). A CO2 absorber removes carbon dioxide produced by the patient. A computerized valve system replaces O2 to keep the system volume constant. Measurements of He concentrations and system variables are also displayed.
where:
- Headded = volume of He placed in the spirometer in liters (L)
- Fhe initial = % He converted to a fraction (%He/100)
When the system volume is known, FRC can be computed as follows:

Either percent or fractional concentration of He may be used because the FRC calculation is based on a ratio.
Some automated systems use a similar method to calculate the system volume; a small amount of He is added to the closed system, followed by a known volume of air. The change in He concentration after the addition of the air is used to determine the system volume. Rebreathing is continued until the He concentration changes by no more than 0.02% in 30 seconds (Criteria for Acceptability 4.2).
At least one technically satisfactory measurement should be obtained. If additional dilutions are performed, a waiting period of at least 5 minutes is recommended between repeated tests. If more than one measurement of FRCHe is obtained, it is recommended that the mean of the technically acceptable results that agree within 10% be reported.
Although a small volume of He dissolves in the blood during the test, it results in a negligible increase in FRC, and it is recommended that no correction be made. The volume of the equipment dead space (including filters) must also be subtracted from the measured FRC.
Correcting for the “Switch-In” Error
Most manufacturers provide “switch-in” error correction when the patient begins the test at a point either above or below the actual end-expiratory level (FRC). Depending on the patient’s breathing pattern, a volume difference of several hundred milliliters may result. The effect of the switch-in error may be insignificant, especially with the closed-circuit method. Equilibrium does not occur instantaneously at switch-in. The total volume of the spirometer and lungs is constantly changing with tidal breathing, the removal of CO2, and the addition of O2. If the switch-in error is large or the end-expiratory level appears to change during the maneuver, the test may need to be repeated.
Additional Comments on FRC by Gas-Dilution Techniques
In the gas-dilution techniques, RV is measured indirectly as a subdivision of the FRC. This method is preferred because the resting end-expiratory level depends less on patient effort than on maximal inspiration or expiration. The end-expiratory level (and the ERV) must be accurately measured. If tidal breathing is irregular, ERV may be overestimated or underestimated. Subtraction of an ERV value that is too large from the FRC will cause the RV to appear smaller than it actually is. Similarly, a small ERV will produce a larger-than-actual RV. For this reason, the patient’s tidal breathing pattern must be carefully monitored during the VC measurement.
The accuracy of the gas-dilution techniques depends on all parts of the lung being well ventilated. In patients who have an obstructive disease, some lung units are poorly ventilated. In these patients, it is often difficult to wash N2 out or mix He to a stable level in poorly ventilated parts of the lungs. Thus FRC, RV, and TLC may all be underestimated, usually in proportion to the degree of obstruction. Extending the time of these tests improves their accuracy. However, prolonging the test may not measure completely trapped gas, such as is found in bullous emphysema.
The graphic method of displaying breath-by-breath N2 washout provides a means of quantifying the evenness of ventilation. Some systems plot the logarithm of the N2 concentration against time or volume exhaled. The slope of the washout curve is determined by the FRC, tidal volume, dead-space volume, and frequency of breathing. If N2 is washed out of the lungs evenly, the log N2 plot appears as a straight line. Because the lung is not perfectly symmetric, the washout curve is slightly concave. The deviation from the expected curve indicates the extent to which ventilation is uneven. Washout should be complete within 3 to 4 minutes in healthy patients. The time to reach He equilibrium during the closed-circuit FRC determination can also be used as an index of distribution of ventilation. By simply recording the time to reach equilibrium and plotting the dilution curve, an estimate of the evenness of ventilation is obtained. The use of gas-dilution techniques to assess the distribution of ventilation is more commonly performed using radioisotope imaging and CT scanning.
In either of the gas-dilution techniques, a leak will cause erroneous estimates of FRC. Leaks may occur in breathing valves or circuitry or at the patient connection. Some patients have difficulty maintaining an adequate seal at the mouthpiece throughout the test. Failure to properly apply nose clips can also result in a leak. Leaks usually result in an overestimate of lung volume. A leak in the open-circuit N2-washout system allows room air to enter, increasing the volume of N2 washed out. A leak in the closed-circuit He dilution system allows air to dilute the He concentration or He to escape. Each situation causes the test gas concentration to change more than it should. Leaks during the N2 washout can usually be identified by an inspection of the graphic display or recording (Fig. 4.5). Inaccuracy or malfunction of the gas analyzers in either method often causes errors. Leaks or analyzer problems should be considered whenever lung volume values are inconsistent with spirometry results, for example, an extremely high TLC and RV/TLC ratio with normal spirometry (Interpretive Strategies 4.1).
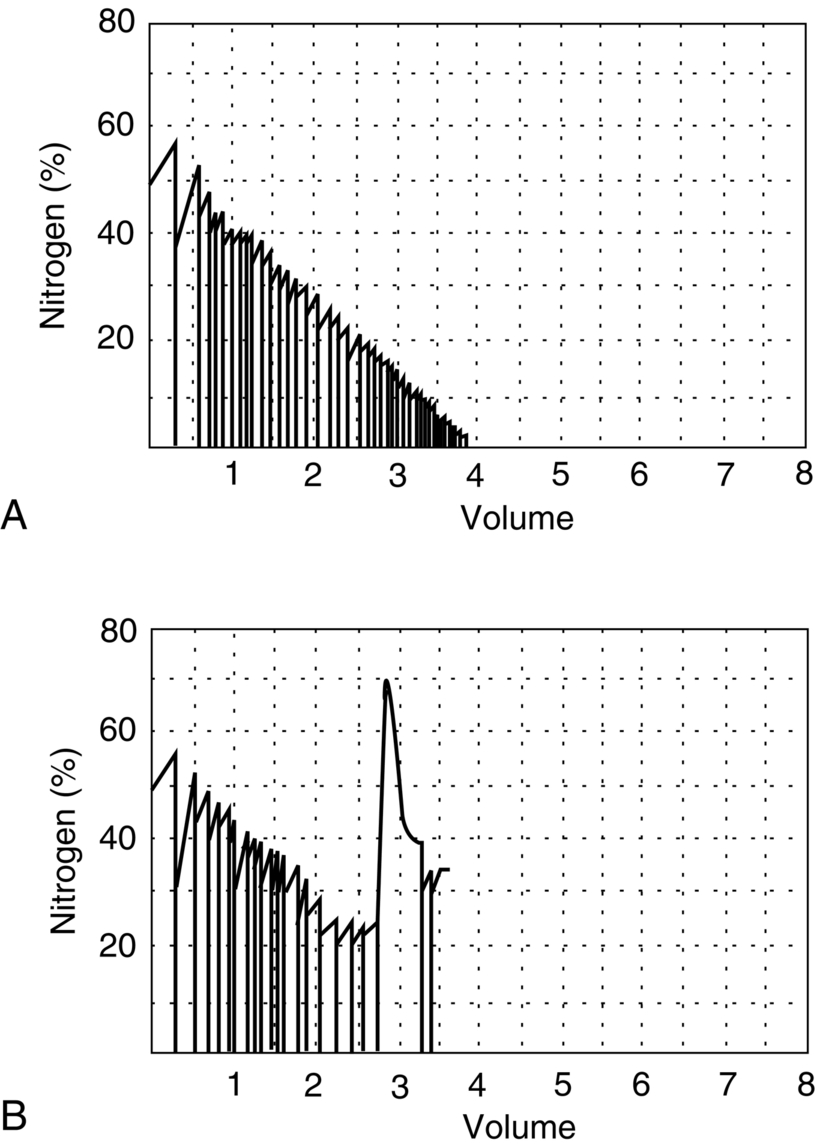
(A) A computer-generated recording of an N2-washout test in a healthy patient. The tracings show a continuous decrease in end-tidal N2 concentration with successive breaths. The test is continued until the N2 concentration falls to less than 1.5% for three consecutive breaths or for 7 minutes total. (B) A similar plot of N2 washout from a healthy patient, but in this instance, a leak occurs during the test. Leaks may occur if the patient does not maintain a tight seal at the mouthpiece. Leaks are usually easy to detect because room air enters the system and causes an abrupt increase in N2 concentration.
Body Plethysmography
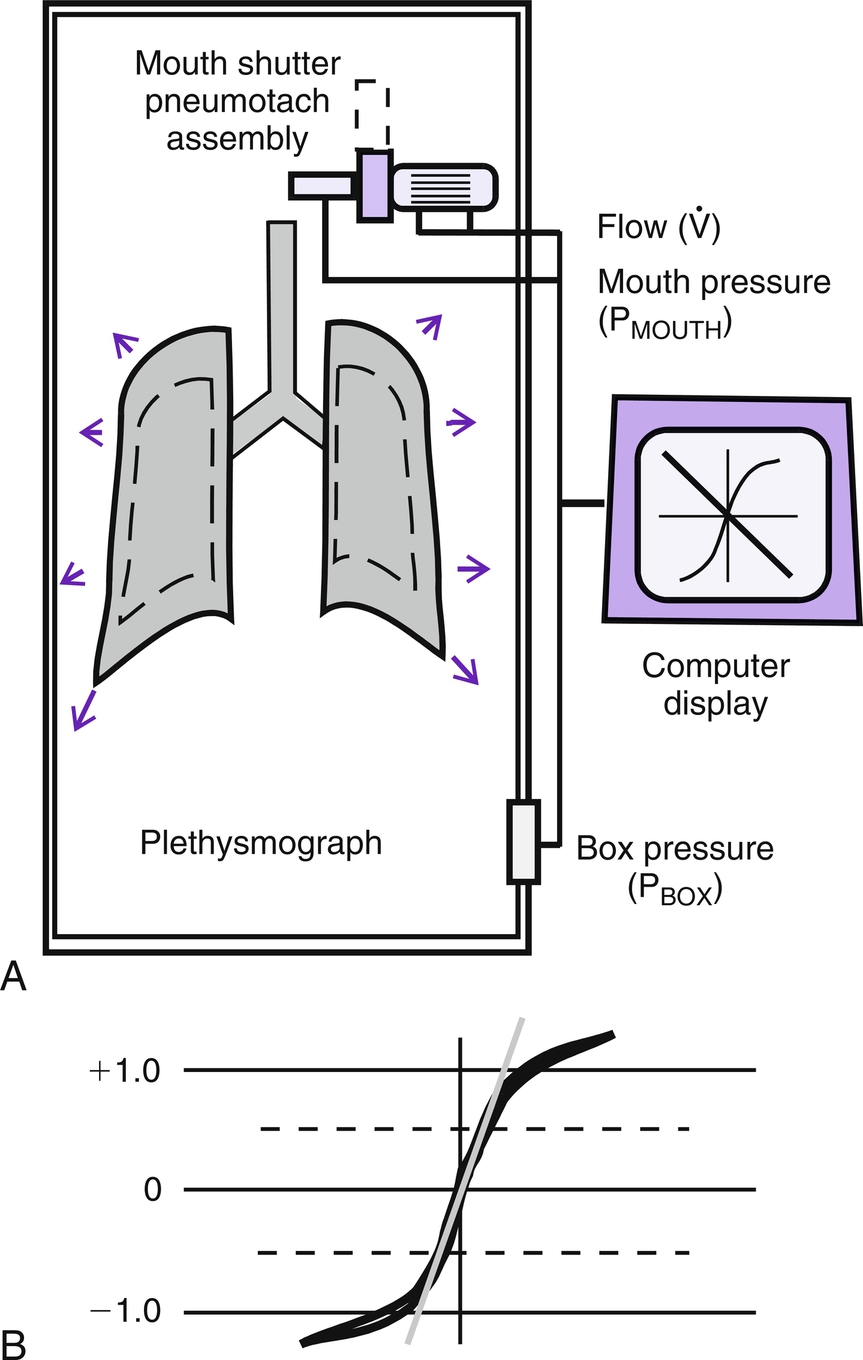
FRC measured with the body plethysmograph (FRCpleth) (Fig. 4.6) refers to the volume of intrathoracic gas measured when airflow occlusion occurs at end expiration (FRC) during shutter closure. The technique is based on Boyle’s law relating pressure to volume. A volume of gas varies in inverse proportion to the pressure to which it is subjected if the temperature remains constant (isothermal). The patient has an unknown volume of gas in the lungs at the end of a normal expiration (i.e., at FRC). The airway is occluded momentarily at or near FRC; the patient is asked to gently breathe at a frequency between 0.5 and 1.0 Hz (0.5–1.0 cycles per second), allowing the air in the chest to be gently compressed and decompressed. The breaths are shallow and should not create pressure changes > 10 cm H2O. The closed-shutter breathing causes a change in volume and pressure. The changes in pressure are easily measured at the mouth (Pmouth) with a pressure transducer. Mouth pressure theoretically equals alveolar pressure when there is no airflow. Changes in pulmonary gas volume are estimated by measuring pressure changes in the plethysmograph. The pressure in the plethysmograph is measured by a sensitive transducer. This transducer is calibrated by a small piston that moves a small volume of gas into and out of the sealed box and relates the pressure change to the known volume (Pbox). The calibration factor is then applied to measurements made on human patients. The term panting is often used to describe the gentle, shallow breathing pattern just discussed; however, in some patients, the use of the term panting may elicit fast breathing (e.g., > 1 breath per second). Breathing too quickly may result in an overestimation of lung volume.
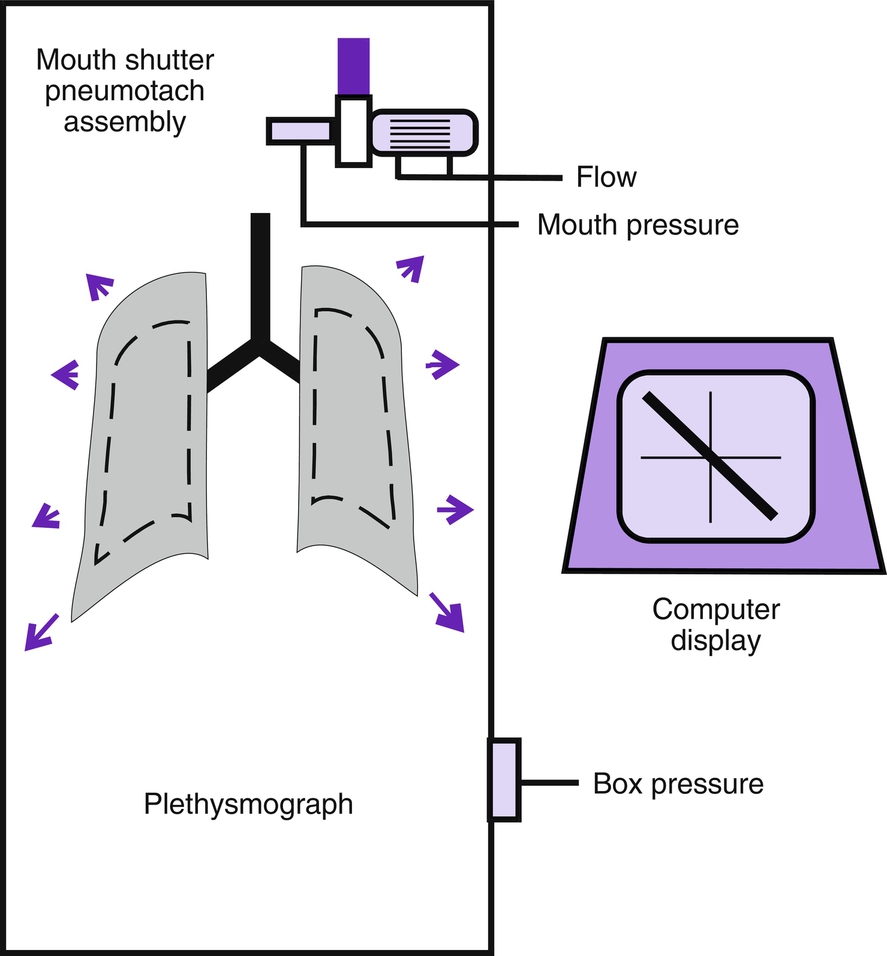
Boyle’s law states that volume varies inversely with pressure if temperature is held constant. A pressure-type (constant volume) plethysmograph, with pressure transducers for measurements of box pressure and mouth (alveolar) pressure, is shown. A pneumotachometer measures flow to track lung volumes. The mouth shutter occludes the airway momentarily so that alveolar pressure can be estimated. The patient breathes shallowly against the closed shutter. Gas in the lungs is alternately compressed and decompressed. Changes in lung volume are reflected by changes in box pressure. These changes are displayed as a sloping line on a computer display. When the original pressure (P), the new pressure (P + ΔP), and the new volume (V + ΔV) are known, the original volume (V or VTG) can be computed from Boyle’s law (see the section on the technique of thoracic gas volume, and see the Evolve website, http://evolve.elsevier.com/Mottram/Ruppel/).
The display of the shallow breathing maneuver is a graph with Pmouth and Pbox. Pmouth is plotted on the vertical axis, and Pbox is plotted on the horizontal axis (Fig. 4.7). The resulting figure appears as a sloping line equal to ΔP/ΔV, where ΔP equals the change in alveolar pressure, and ΔV equals the change in alveolar volume (VA). The change in VA is measured indirectly by noting the reciprocal change in plethysmograph volume.
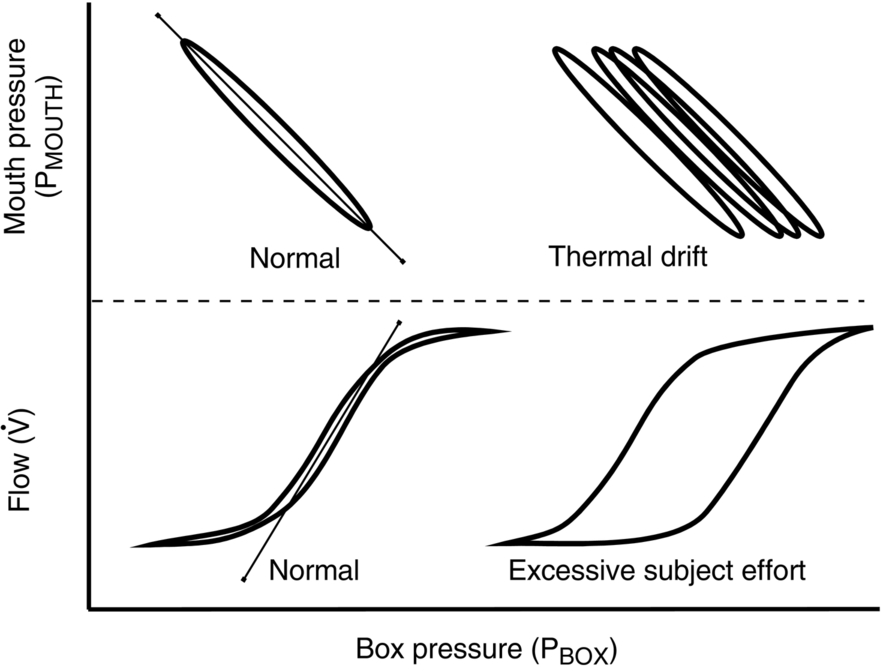
Top left, Normal closed-shutter maneuver in which mouth pressure is plotted against box pressure. The loop should be closed, or nearly so. If thermal equilibrium has not been achieved, the loop (shown on the top right) tends to be open and to drift across the screen. Bottom left, Normal open-shutter measurement in which flow is plotted against box pressure. If the patient breathes near functional residual capacity (FRC), the loop takes on a nearly closed S-shaped appearance. If the patient breathes too rapidly or too deeply, the tracing becomes open and flattened (shown on the bottom right). Thermal drift can also cause the open-shutter tracing to resemble excessive patient effort.
The VTG can then be obtained from the slope of the tracing by applying a derivation of Boyle’s law:

where:
- VTG = thoracic gas volume
- PB = barometric pressure minus water vapor pressure
- λVTG = slope of the displayed line equal to DP/DV
- Pboxcal = box pressure transducer calibration factor
- Pmouthcal = mouth pressure transducer calibration factor
- K = correction factor for volume displaced by the patient
For the complete derivation of the equation and sample calculations, see the Evolve website at http://evolve.elsevier.com/Mottram/Ruppel/.
Computerized plethysmograph systems permit the monitoring of tidal breathing in conjunction with the VTG maneuver. Instantaneous changes in lung volume can be monitored by continuously integrating the flow through the plethysmograph’s pneumotachometer. The end-expiratory level can be determined from tidal breathing. The patient then breathes shallow with the mouth shutter open. The computer records the change in lung volume above or below the resting level (FRC). When asked to breathe shallowly, most patients do so slightly above FRC. The shutter then closes automatically, the patient continues to breathe shallowly, and VTG is measured as described. The computer then adds or subtracts the change in volume from the end-expiratory level (before shallow breathing began) to calculate the true FRC. This computerized technique allows the patient to breathe at the correct frequency and depth before the shutter is closed. It also eliminates the necessity of closing the shutter precisely at end expiration. Raw and sGaw can also be measured simultaneously during the open-shutter breathing (see following text). It should be noted that the correct breathing frequencies for measuring Raw and VTG are slightly different. Raw measurements should be made with the patient breathing shallow at about 1.5 to 2.5 Hz (1.5–2.5 cycles per second, or 90–150 breaths/min), whereas VTG should be measured with the patient breathing at a slower rate of 0.5 to 1 Hz. Many computerized systems display the breathing frequency so that the technologist can coach the patient to achieve the correct rate.
A VC maneuver, along with its subdivisions (ERV and IC), should be performed immediately after the acquisition of FRCpleth. The American Thoracic Society–European Respiratory Society (ATS-ERS) Task Force recommends that a linked ERV maneuver to RV followed by an IC maneuver to TLC be performed. An alternative method is to perform linked maneuvers with an IC first to TLC followed by a VC breath to RV. Most plethysmograph systems allow these measurements using the built-in pneumotachometer. The same standards for accuracy should be applied to a slow VC measured in the plethysmograph as for any other spirometer. When FRCpleth has been determined, the remaining lung volumes can be calculated as described for the gas-dilution techniques.
Measurement of FRCpleth is a complex procedure. Each patient must be carefully instructed in the required maneuvers. Allowing the patient to sit in the box with the door open is helpful. A few patients may experience claustrophobia in the plethysmograph. The shallow-breathing maneuver should be demonstrated by the technologist and then practiced by the patient. The patient should be instructed to place both hands against the cheeks. This prevents unwanted pressure changes in the mouth when the patient pants against the closed shutter. If practical, the shutter may be closed so the patient knows what to expect during the test. The door of the plethysmograph can then be closed. The patient should understand that the plethysmograph can be opened if he or she becomes uncomfortable. The patient should be instructed on how to open the door from within the box. If the plethysmograph is equipped with a communication device, it should be adjusted so that the patient can hear instructions.
Depending on the construction of the plethysmograph, venting to the atmosphere is usually required to establish thermal equilibrium. Equilibrium takes about 30 to 60 seconds and can be presumed when the flow-volume recording stabilizes (i.e., does not drift). Some systems compensate for thermal drift, so waiting for equilibrium is not necessary. The patient is then instructed to breathe shallowly. When the correct breathing frequency and depth have been established, the shutter may be closed. Some plethysmograph systems require tidal breathing before shutter closure to establish the patient’s end-expiratory level. In either type of system, the patient should breathe shallowly against the closed shutter until a stable tracing is produced. Two to four breaths are usually sufficient. If the patient breathes too hard, the tracing may drift or appear as an “open” loop (see Fig. 4.7). The recorded pressure changes should be within the range over which the transducers were calibrated. The entire tracing should be visible on the display. If the tracing goes off-screen, the pressure changes probably exceed the calibration ranges. A minimum of three technically satisfactory maneuvers should be recorded, each followed by ERV and IVC maneuvers (see Criteria for Acceptability 4.3). At least three FRCpleth values that agree within 5% should be obtained and the mean value reported. The technologist’s comments should note the acceptability of the maneuvers. Most computerized plethysmographs automatically measure the slope of the ΔP/ΔV tracings. This is done by using the least-squares method to calculate a “best-fit” line through the recorded data points. The technologist may need to correct computer-generated tangents depending on data quality from the breathing maneuvers.
Additional Comments on FRC by Plethysmography
The plethysmographic method is a quick and accurate means of measuring lung volumes. It can be used in combination with simple spirometry to derive all lung volume compartments. The plethysmograph’s primary advantage is that it measures all gas in the thorax, whether in ventilatory communication with the atmosphere or not. The plethysmographic measurement of FRC is often larger than that measured by He dilution or N2 washout. This is the case in emphysema and other diseases characterized by air trapping, as well as in the presence of an uneven distribution of ventilation. When gas-dilution tests are continued for more than 7 minutes, the results for FRC determinations approach the VTG value. See Interpretive Strategies 4.2.
It may be useful, albeit impractical for a busy laboratory, to compare FRC values obtained by plethysmography with values obtained by gas-dilution methods, particularly in patients with obstructive disease. The ratio of FRCpleth/FRCN2 or FRCpleth/FRCHe can be used as an index of gas trapping. This ratio is usually near 1.0 in patients with normal lungs or even those with a restrictive lung disorder. Values greater than 1.0 indicate gas volumes detectable by the plethysmograph but hidden to the gas-dilution techniques. Care must be taken that lung volumes determined by the two separate methods are reliable before the values can be expressed as a ratio. Patients with severe bullous emphysema may have a difference in TLC of more than 1 L between FRCpleth and the gas-dilutional methods of measuring FRC.
Although it is conventional wisdom that dilution techniques may underestimate lung volumes in patients with airflow obstruction, there is evidence suggesting that in severe airway obstruction, FRC may be overestimated when the plethysmographic technique is used. This occurs primarily because Pmouth (measured when the shutter is closed) may not equal alveolar pressure if the airways are severely obstructed. Rapid breathing rates aggravate this inaccuracy. Care should be taken that patients with spirometric evidence of obstruction breathe at a rate of 0.5 to 1 Hz (30–60 breaths per minute).
Spirometry (e.g., forced vital capacity [FVC], forced expiratory volume in the first second [FEV1], and VC) may be performed with the patient in the plethysmograph. The pneumotachometer must be capable of accurately measuring the entire range of gas flows required (i.e., up to 12 L/sec).
Two varieties of body boxes are commonly used: pressure-based and flow-based boxes (see Chapter 11). Flow boxes allow a slightly different type of flow-volume curve to be recorded. Normal spirometry plots airflow at the mouth against volume at the mouth (as detected by the spirometer). With the patient in a flow box, flow at the mouth can be plotted against actual lung volume changes as detected by the box. This may be particularly useful in patients with severe airway obstruction. It is possible to detect a significant compression volume during forced expiration and plot it against the flow generated. Spirometry, lung volumes, and airway resistance can all be obtained in a single sitting with either type of plethysmograph.
Total Lung Capacity and Residual Volume/Total Lung Capacity Ratio
TLC is calculated by combining other lung volume measurements once FRC is measured by either a gas-dilution method or body plethysmography. The two most common methods to calculate TLC are as follows:

or

Each method requires accurate measurement of the subdivisions of the VC. TLC can also be calculated with single-breath techniques (i.e., single-breath He dilution or single-breath N2 washout). Single-breath measurements of lung volumes are usually done as part of other tests, such as the diffusing capacity (Dlco) test (see Chapter 3). Single-breath lung volumes correlate well with multiple-breath techniques in healthy patients. However, single-breath lung volumes tend to underestimate true values in moderate to severe obstruction. TLC can also be measured from standard chest x-ray films, as well as from CT scans of the thorax.
The RV/TLC ratio is calculated by dividing the RV by the TLC. This ratio is expressed as a percentage. Either ambient temperature, pressure, saturation (ATPS) or BTPS values may be used in the ratio, but both RV and TLC must be expressed in the same units.
The FRC, RV, and TLC should be reported in liters or milliliters, BTPS. Barrier filters must be used during lung volume determinations. The filter volume is subtracted from the lung volumes measured via dilution methods by the software.
Significance and Pathophysiology
FRC varies with body size, change in body position, and time of day (i.e., diurnal variation). However, unlike TLC and RV, FRC is an effort-independent maneuver determined by the balance of lung and chest wall recoil at relaxed end expiration. As with other lung volumes, normal FRC may be affected by racial or ethnic background (see Interpretive Strategies 4.1 and 4.2). Equations for calculating predicted FRC can be found on the Evolve website, http://evolve.elsevier.com/Mottram/Ruppel/.
Increased FRC is considered pathologic. FRC values greater than the ULN represent hyperinflation. Hyperinflation may result from emphysematous changes or from obstruction caused by asthma or bronchitis. Compensation for surgical removal of lung tissue or thoracic deformity can also cause increased FRC. Elevated FRC usually results in muscular and mechanical inefficiency of the respiratory apparatus. As lung volume increases, the chest wall and lungs themselves become “stiffer.” This causes an increase in the work of breathing. FRC can increase dynamically; patients with airway obstruction may increase their end-expiratory lung volume (EELV) during exercise. This change in lung volume with increased ventilatory demand often results in a sensation of breathlessness and reduces exercise time. Reduction in the rate of air trapping is one of the primary benefits of bronchodilator therapy in chronic obstructive pulmonary disease (COPD).
The TLC is the maximal volume of inspired air. TLC is determined by the balance of lung recoil plus chest wall recoil, on the one hand, and muscle strength and effort, on the other hand. Thus diseases that reduce lung recoil will result in increased TLC; those that increase lung recoil may reduce TLC. Likewise, muscle weakness or suboptimal effort may reduce TLC.
The RV is the volume left in the lungs after the VC is exhaled. An increased RV indicates that despite maximal expiratory effort, the lungs contain a larger volume of gas than normal. Increased RV often results in an equivalent decrease in VC (Fig. 4.8). Elevated RV may occur during an acute asthmatic episode but is usually reversible. Increased RV is characteristic of emphysema and bronchial obstruction; both may cause chronic air trapping. RV and FRC usually increase together. As RV becomes larger, increased ventilation is needed to adequately exchange O2 and CO2 in the lung. This requires an increase in the tidal volume, respiratory rate, or both. Because of altered pressure–volume characteristics of the lung, the work of breathing is also increased. Patients with increased RV often display gas exchange abnormalities such as hypoxemia or CO2 retention. Because RV is effort dependent, elevated RV may also be caused by muscle weakness or suboptimal effort.
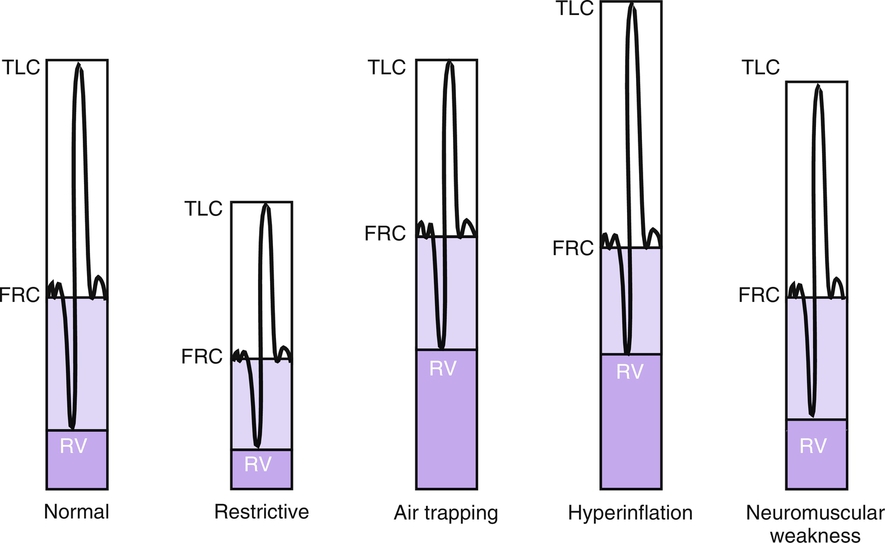
A comparison of changes in lung volume compartments and vital capacity (VC) (superimposed) shows the following: In restrictive patterns, functional residual capacity (FRC), residual volume (RV), and VC are all decreased proportionately, resulting in a decrease in the total lung capacity (TLC), which defines restriction (see text). In obstruction (with air trapping), FRC and RV are both increased at the expense of the VC, and therefore TLC remains relatively unchanged. Similar increases in RV and FRC may occur without reduction of VC, in which case the TLC increases (hyperinflation). In neuromuscular weakness, the FRC is normal, but the TLC is reduced, and the RV/TLC is too high.
Measuring lung volumes is critical to understanding changes in FVC. A normal FVC almost always excludes significant restriction. But because decrements in FVC can be from restriction, neuromuscular weakness, suboptimal effort, or severe obstruction, knowledge of TLC, FRC, and RV is invaluable in sorting out these possibilities.
FRC, RV, and TLC are typically decreased in restrictive diseases. Decreased lung volumes are seen in interstitial diseases associated with extensive fibrosis (e.g., sarcoidosis, asbestosis, and idiopathic pulmonary fibrosis). Restrictive disorders affecting the chest wall include kyphoscoliosis, neuromuscular disorders, and obesity. Diseases that impair the diaphragm often result in reduced lung volumes, particularly TLC. Lung volumes may also be decreased in diseases that occlude many alveoli, such as pneumonia. Congestive heart failure causes pulmonary congestion and pleural effusions, which can also reduce lung volume. Any disease process that occupies volume in the thorax (e.g., tumors) can reduce lung volume.
Table 4.2 lists comparative lung volumes for a healthy adult male and for patients with air trapping (as in emphysema), hyperinflation, restriction (as in sarcoidosis), and neuromuscular weakness (as in amyotrophic lateral sclerosis [ALS]).
Table 4.2
| Value | Normal | Air Trapping | Hyperinflation | Restriction | Neuromuscular Weakness |
|---|---|---|---|---|---|
| VC (L) | 4.80 | 3.00 | 4.80 | 3.00 | 3.50 |
| FRC (L) | 2.40 | 3.60 | 3.60 | 1.50 | 2.40 |
| RV (L) | 1.20 | 3.00 | 3.00 | 0.75 | 1.50 |
| TLC (L) | 6.00 | 6.00 | 7.80 | 3.75 | 5.00 |
| RV/TLC (%) | 20 | 50 | 38 | 20 | 30 |
Restrictive processes usually cause lung volumes to be reduced equally. Proportional relationships between lung volume compartments, such as the RV/TLC ratio, may be relatively normal in restrictive diseases. In various forms of extrapulmonary restriction, such as kyphoscoliosis, or pleural effusion, RV is often less reduced than TLC, resulting in a relatively elevated RV/TLC ratio despite a low TLC. Obesity usually affects ERV and FRC earlier more significantly than TLC.
In obstruction, two different patterns may be observed. RV is usually increased. This increase may be at the expense of a reduction in VC (see Fig. 4.6) with TLC remaining close to normal, in which case the elevated RV/TLC ratio reflects air trapping. Elevated TLC is referred to as hyperinflation, which is usually accompanied by air trapping. TLC may be either normal or increased in obstructive processes such as asthma, chronic bronchitis, bronchiectasis, cystic fibrosis, and emphysema. TLC does not appear to change dynamically, even though FRC may increase acutely during exercise (dynamic hyperinflation).
The RV/TLC ratio describes the percentage of total lung volume that cannot be emptied during expiration. In healthy adults, the RV/TLC ratio may vary from 20% in young adults to 35% in older patients. Values greater than 35% may result from absolute increases of RV (as in emphysema) or from a decrease in TLC because of a loss of VC. As mentioned previously, an elevated RV/TLC in the presence of increased TLC is often indicative of both hyperinflation and air trapping. An increased RV/TLC with a normal TLC indicates that air trapping is present. As an indicator of air trapping, the RV/TLC ratio is a weak but statistically significant indicator of outcome after lung volume reduction surgery (LVRS).
In neuromuscular weakness, FRC is typically normal because lung and chest wall recoil are not specifically affected. However, TLC is low, and RV is high, relative to FRC, because of the reduced muscle strength required to reach these upper and lower limits of lung volume, respectively.
Processes that occupy space in the lungs, such as edema, atelectasis, neoplasms, or fibrotic lesions, may decrease TLC. Other diseases that commonly result in decreased TLC include pulmonary congestion, pleural effusions, pneumothorax, and thoracic deformities. Pure restrictive defects show proportional decreases in most lung compartments, as described for FRC and RV. When the TLC value is less than the LLN, a restrictive process is present. Reduced VC, along with a normal or increased FEV1/FVC ratio, is suggestive of restriction, but a measurement of TLC is needed to confirm the diagnosis of a restrictive defect.
A less common pattern is mixed obstructive-restrictive lung disease, characterized by a low FEV1/FVC ratio and a low TLC. This is suggested by simple spirometry when both FEV1/FVC and FVC are reduced but can only be confirmed by measuring TLC. Measuring the reduction in TLC may allow for more accurate characterization of the concomitant degree of airway obstruction. Another interesting pulmonary function test (PFT) pattern is the so-called “nonspecific” pattern characterized by a reduced FEV1 and FVC, normal FEV1/FVC ratio, and normal TLC. This pattern may represent lung volume decruitment occurring in the presence of airway disease or thoracic restriction such as obesity. Obesity is typically characterized by larger decrements in FRC and ERV than in TLC.
Airway Resistance and Conductance
Description
The forces governing maximal airflow are the elastic recoil pressure of the lung and airway resistance upstream from the equal pressure point. This section addresses the measurement of airway resistance, which is accomplished by examining the relationship between alveolar pressure and flow during open-loop shallow breathing in the body plethysmograph.
Airway resistance (Raw) is the pressure difference per unit flow as gas flows into or out of the lungs. Raw is the difference between mouth pressure and alveolar pressure, divided by flow at the mouth. This pressure difference is caused primarily by the friction of gas molecules in contact with the airways. Raw is recorded in centimeters of water per liter per second (cm H2O/L/sec).
Gaw is the flow generated per unit of pressure drop across the airways. It is the reciprocal of Raw (1/Raw) and is recorded in liters per second per centimeter of water (L/sec/cm H2O). Gaw is not commonly reported because it changes with lung volume. Instead, specific airway conductance (sGaw), which is Gaw divided by the lung volume (in liters) at which the measurement was made, is usually calculated. It is reported in liters per second per centimeter of water per liter of lung volume (L/sec/cm H2O/L). The lung volume at which Raw is measured is determined during the closed-shutter maneuver to calculate VTG. However, the closed-shutter maneuver may be difficult to perform in some individuals, especially children, so VTG cannot be measured. It is possible to derive sRaw by comparing flow to the small shifts in lung volume that occur during tidal breathing without closed-shutter breathing, but this is rarely done, and few manufacturers offer this option. Mathematically, sRaw = Raw × VTG. Because sRaw encompasses lung volume, and Raw and lung volume vary inversely, sRaw is relatively stable with respect to changes in lung volume (i.e., as lung volume decreases, Raw increases, so the product sRaw remains the same, and vice versa). In this way, sRaw is similar to sGaw because it takes lung volume into account. However, whereas sGaw reflects Raw only, sRaw reflects both Raw and lung volume.
Technique
Raw can be measured as the ratio of alveolar pressure (PA) to airflow ( ). Gas flow at the mouth is measured with a pneumotachometer (see Chapter 11). PA is measured in the body plethysmograph (Fig. 4.9A). For gas to flow into the lungs during inspiration, PA must fall below atmospheric pressure (mouth pressure). During expiration, PA rises above atmospheric pressure. Changes in
 are plotted against plethysmograph pressure changes. Changes in plethysmograph pressure are proportional to VA changes. The patient breathes with a small VT at a rate of about 1.5 to 2.5 breaths/sec (1.5–2.5 Hz). Shallow rapid breathing may produce an S-shaped pressure–flow curve (see Fig. 4.9B). A tangent (the slope) is measured from this curve. Traditionally, the tangent is drawn to pass through zero flow and connects the + 0.5 L/sec and − 0.5 L/sec flow points. The slope of this line is the ratio of
  . is flow at the mouth, and Pbox is plethysmograph pressure.
(A) Diagrammatic representation of airway resistance measurement: Raw = Atmospheric pressure-alveolar pressure/Flow. Flow (
) is measured directly by means of the pneumotachometer. As the patient breathes with the shutter open, flow is plotted against box pressure (Pbox) as it occludes the airway momentarily, usually at end expiration, and a sloping line representing the ratio of mouth pressure to box pressure (Pmouth/Pbox) is recorded in a manner similar to that used for measurement of thoracic gas volume (VTG). In this example, the flow tracing (shutter open) and volume tracing (shutter closed) are superimposed on the computer display. The Pmouth/Pbox tangent is measured as for the VTG. (B) The flow tangent is measured from the steep portion of the flow tracing, from − 0.5 to + 0.5 L/sec. Airway resistance is then calculated as the ratio of these two tangents, using appropriate calibration factors (see text and Evolve website, http://evolve.elsevier.com/Mottram/Ruppel/).Problems with the open-shutter breathing technique are illustrated by the loops seen in Fig. 4.10. The most common problems are thermal drift and breathing at too high or low of a frequency or volume.
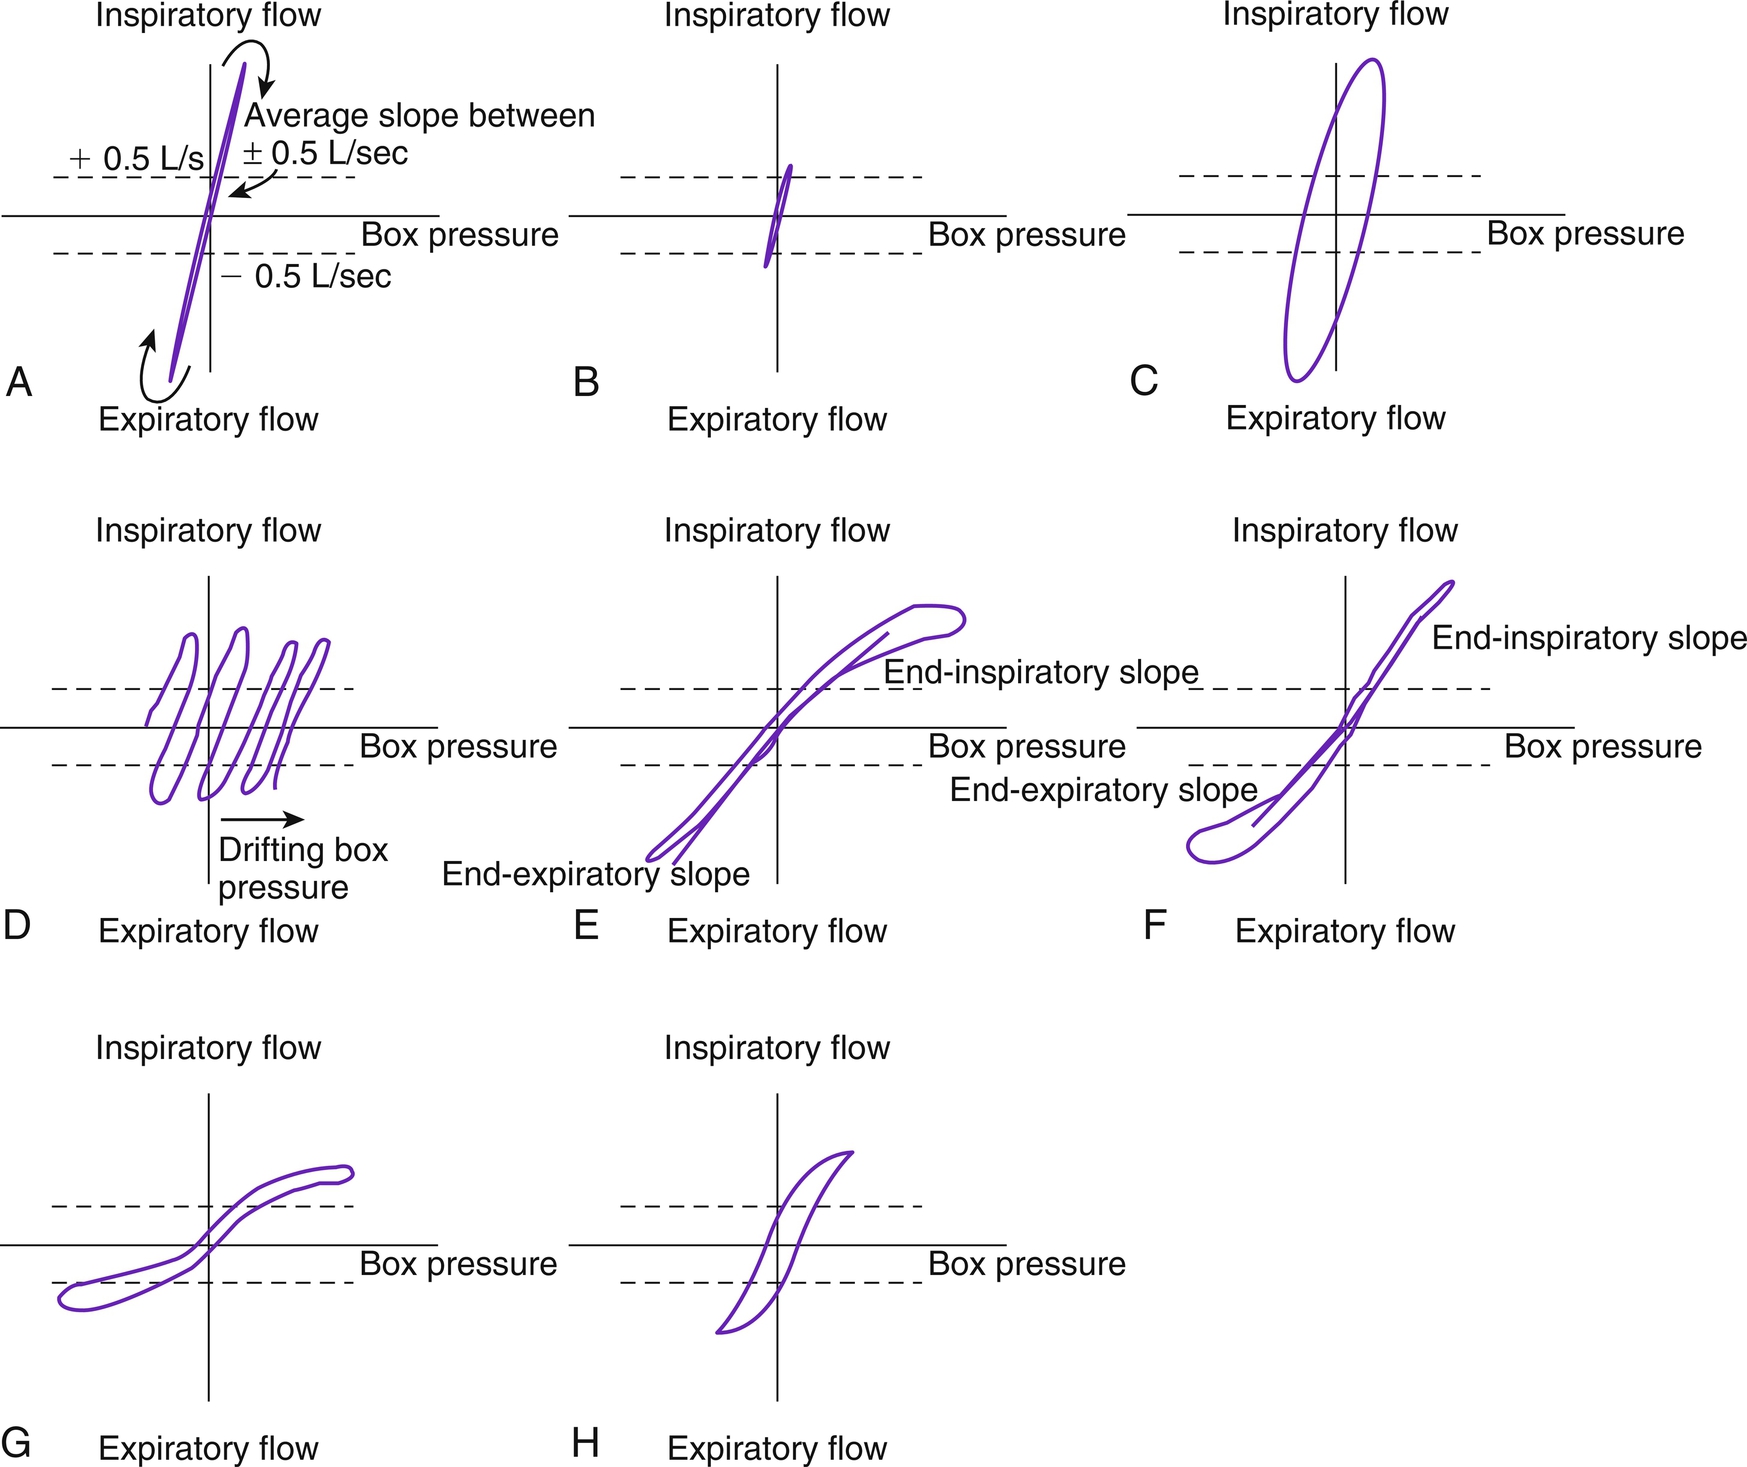
(A) Normal tracing showing narrow loop and consistent slope on both inspiration and expiration. (B) Small narrow loop caused by a breathing frequency that is too high or volume that is too small. (C) Wide large loop (hysteresis) caused by a breathing frequency that is too low or volume that is too large. (D) Thermal drift caused by the failure of body plethysmograph to come to a steady temperature before obtaining shallow breathing loops. (E) High inspiratory resistance causing hysteresis and flattening of inspiratory portion of the shallow breathing loop. Notice that separate inspiratory and expiratory tangents (slopes) can be obtained. (F) High expiratory resistance causing hysteresis and flattening of expiratory portion of the shallow-breathing loop. (G) High inspiratory and expiratory resistance caused by fixed airway obstruction causing flattening of both inspiratory and expiratory portions of the shallow loops. (H) Typical loop seen in asthma with slight widening and flattening of the loop indicative of overall increased resistance.
To measure VTG in association with Raw, the shutter at the mouthpiece is closed immediately after the open-shutter breathing, and the patient continues to breathe shallowly. The optimal rate for closed-shutter breathing is about 0.5 to 1.0 Hz, slightly slower than open-shutter panting. Changes in Pbox are then plotted against Pmouth. Because there is no flow into or out of the lungs, Pmouth equals PA. A second tangent is measured from this curve. The slope of this line is PA/Pbox, where PA equals alveolar pressure. Computerized plethysmographs usually calculate a “best-fit” line to measure the open-shutter and closed-shutter tangents. The technologist should visually inspect all computer-fitted lines. PFT systems allow the technologist to adjust computer-generated tangents manually. Problems with the closed-shutter breathing technique are similar to those that plague the open-shutter breathing measurement and also include leak around the mouth or nose.
Raw is then calculated by taking the ratio of these two slopes, as follows:

where:
- = airflow
- PA = alveolar pressure
- Pbox = plethysmographic pressure, measured with the shutter open and closed
- Mouth cal = calibration factor for the mouth pressure transducer
- Flow cal = calibration factor for the pneumotachometer
This formula shows how Raw is calculated from the ratio of PA and , as Pbox cancels out. Calibration factors for the flow and mouth pressure transducers are included in the previous equation (see the Sample Calculations on the Evolve website, http://evolve.elsevier.com/Mottram/Ruppel/).
Shallow breathing eliminates several artifacts from the tracing. Small rapid breaths (1.5–2.5 per second) reduce thermal drift, both in the box and in the pneumotachometer. Shallow breathing helps keep the glottis open, allowing measurement of alveolar pressure. Shallow breathing also allows measurements to be made near FRC. The resistances of the mouthpiece and pneumotachometer are subtracted from the patient’s Raw.
Gaw can be calculated as the reciprocal of Raw. Specific conductance is calculated by dividing Gaw by the lung volume at which it was measured, which is VTG calculated from the closed-shutter maneuver. sGaw should be calculated separately for each Raw maneuver because the lung volume at which measurements are made influences Raw and Gaw. After three to five acceptable trials are obtained, calculated Raw and sGaw are averaged. Individual values should be within approximately 10% of the mean (Criteria for Acceptability 4.4).
sRaw is calculated from the ratio of change in box volume (measured through changes in box pressure) to flow during tidal breathing, which is done in practice by taking the slope of the flow-pressure (or specific resistance) loop. The slope may be drawn through the + 0.5 L/s and − 0.5 L/s fixed flow rates or may be drawn between the points of maximal change in box pressure. Measurements should be made at breathing frequencies of 30 to 45 breaths per minute, which is usually near spontaneous breathing frequency for very young children. The final value is taken as the median of five technically valid specific resistance loops.
Computerized plethysmographs permit thoracic gas volume (VTG), Raw, and sGaw to be measured from a combined maneuver. The patient breathes through the pneumotachometer with the plethysmograph sealed. Tidal breathing is recorded with the patient breathing near FRC. The computer stores this end-expiratory volume as a reference point. Then the patient pants, and the open-shutter slope of is recorded. The mouth shutter is then closed, and Pmouth /Pbox is recorded as described previously. The VTG in this maneuver does not equal the FRC because the shutter is closed at a volume different from the FRC. However, the change in volume from the tidal breathing level was stored at the beginning of the maneuver. This volume is the “switch-in” volume described earlier and can be added to or subtracted from the VTG to determine FRC. Most patients pant above their FRC, so the VTG in this combined method is usually slightly greater (Fig. 4.11). Because of this issue, a separate test to measure FRC for use in calculating absolute lung volumes may need to be done and is often recommended.
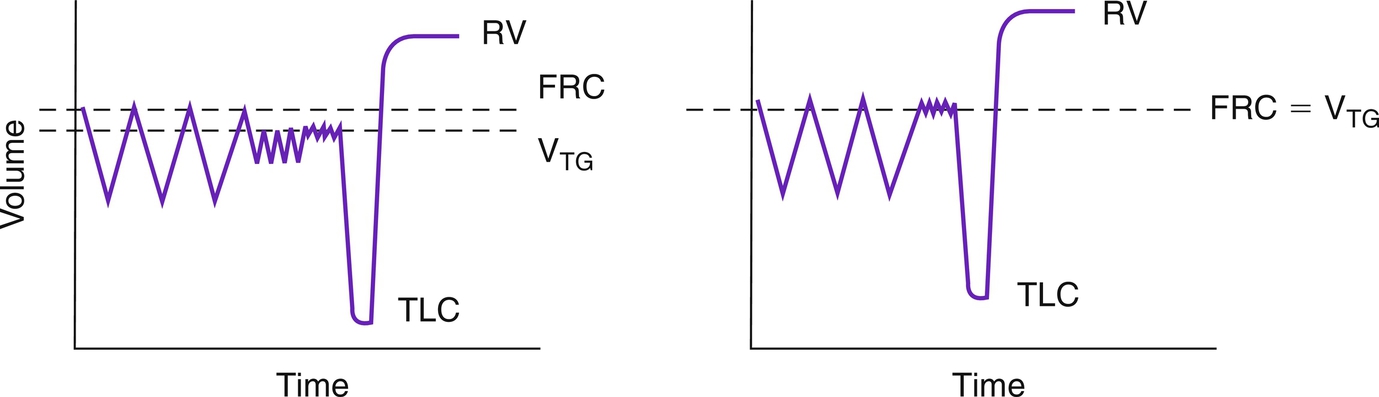
On the left, a combined open-shutter followed by closed-shutter maneuver was performed to obtain both Raw and VTG. Inhalation is down and exhalation is up. Because VTG drifted above FRC (downward in the tracing) during the open-shutter breathing maneuver, VTG is higher than FRC. VTG, in this case, is still necessary to calculate sGaw, but it is a poor approximation of FRC. On the right, only a closed-shutter maneuver was performed to measure VTG, which closely approximates FRC. In this case, a separate open-shutter maneuver is needed to measure Raw followed by a closed-shutter maneuver to calculate sGaw. RV, residual volume; TLC, total lung capacity.
Significance and Pathophysiology
Reference equations for indices of airway resistance are very limited. Normal values of Raw in adults may range from 0.6 to 2.4 cm H2O/L/sec. Gaw in healthy adults may range between 0.42 and 1.67 L/sec/cm H2O. sGaw varies in a manner similar to Gaw. sGaw values of less than 0.11 L/sec/cm H2O/L are consistent with airway obstruction. Measurements are standardized at flow rates of ± 0.5 L/sec, as described previously. Normal values for sRaw in children may range between 9.2 to 17.3 cm H2O/sec.
- Raw in healthy adults is divided across the airway as follows: Nose, mouth, upper airway = 50%
- Trachea and bronchi = 30%
- Small airways = 20%
Small airways (less than 2 mm in diameter) contribute only approximately one-fifth of the total resistance to flow. Significant obstruction can develop in the small airways with little increase in Raw or decrease in sGaw. Early or mild obstructive processes are not usually identified by abnormal Raw or sGaw. Raw may be increased in an acute asthmatic episode by as much as 3 times the normal values. Inflammation, mucus secretion, and bronchospasm all increase Raw in the small and medium airways. Raw is increased in advanced emphysema because of airway narrowing and collapse, especially in the bronchioles. Other obstructive diseases (e.g., bronchitis) may cause increases in Raw proportionate to the degree of obstruction in medium and small airways.
Lesions obstructing the larger airways (e.g., tumors, traumatic injuries, or foreign bodies) may also cause a significant increase in Raw. Large airway obstruction is often accompanied by increased work of breathing and dyspnea on exertion. Airflow in the trachea and mainstem bronchi is predominantly turbulent. Any large airway obstruction can exaggerate this turbulent flow. For this reason, Raw and sGaw may be more sensitive to elevations in central airway resistance than FEV1. Breathing low-density gas mixtures (e.g., helium + oxygen) reduces Raw and therefore the work of breathing. The shapes of the open-shutter breathing loops may give clues as to the underlying pathophysiology, as seen in Fig. 4.10.
Because some patients have changes in sGaw without changes in FEV1 or FVC after a bronchodilator, and such changes are thought to be clinically significant, measuring bronchodilator response by sGaw may be more sensitive than relying on spirometric indices only. Part of the reason for this may be caused by the anatomic location of airway obstruction, and part may relate to the bronchodilating ability of the deep breath necessarily associated with measuring spirometry, which occurs in healthy subjects and those with mild airway obstruction. Because of this increased sensitivity, sGaw may be less specific for patients with asthma compared with healthy subjects.
Raw is decreased at increased lung volume. The airways (particularly large and medium airways) are distended slightly, and their cross-sectional area increases. For this reason, the VTG is obtained with Raw to derive sGaw. This allows a comparison of values in different patients or in the same patient after treatment. sGaw is particularly useful for assessing changes in airway caliber after bronchodilator therapy or inhalation challenge. sGaw may change significantly after a bronchodilator or inhalation challenge even though other measures of flow (i.e., FEV1) vary only slightly. The primary site of airway obstruction (i.e., large versus small airways) may determine which parameters reflect changes in airway caliber.
sRaw is similar to sGaw because it considers lung volume. However, sGaw reflects only Raw, whereas sRaw reflects both Raw and lung volume. This may be illustrated by considering an obstructed patient with hyperinflation versus an obstructed patient without hyperinflation. In the former, Raw is elevated and sRaw is increased (increased work to move air through a higher lung volume), but the increased VTG associated with hyperinflation corrects conductance back to normal (normal sGaw). In the latter, Raw is increased and sRaw is increased (increased work to move air through an increased resistance), but sGaw is reduced (elevated Raw is not reduced by altered lung volume).
Raw and sGaw measurements are not influenced by the degree of patient effort, so Raw and sGaw measurements may be useful for determining airway status in patients who are unable or unwilling to exert maximum effort. However, acceptable shallow-breathing maneuvers in the plethysmograph require a certain degree of patient coordination. Not all patients may be able to perform these maneuvers. Patients with severe obstruction may produce pressure–flow curves during shallow breathing that are difficult to measure. Such curves may be flat (see Fig. 4.10) or show widening (hysteresis). Inspiratory and expiratory flows may produce different resistances, causing the curve to appear as a loop (see Fig. 4.10). In these cases, inspiratory flow resistance is usually reported.
In addition to resistance caused by flow through conducting airways, some frictional resistance is caused by the displacement of the lungs, rib cage, and diaphragm. In healthy patients, this tissue resistance is only approximately one-fifth of the total resistance, and therefore total pulmonary resistance is approximately 20% greater than the measured Raw.
In addition to measuring Raw by use of the body plethysmograph, measurement of Raw by means of the forced oscillation technique is becoming increasingly common. For further discussion, see Chapter 10. Another method, more popular outside the United States, especially in children, is the use of the interrupter technique to measure Raw. Both methods do not require special breathing maneuvers and are conducted during quiet tidal breathing, thus making them appealing from the standpoint of ease of performance on the part of the patient.
Gas Distribution Tests: Single-Breath Nitrogen Washout, Closing Volume, and Closing Capacity
Description
The single-breath nitrogen-washout test (SBN2) measures the distribution of ventilation. Distribution is analyzed by measuring the change in N2 concentration during expiration of the VC after a single breath of 100% O2. The evenness of distribution is assessed by two parameters: the change in percentage of N2 between the 750- and 1250-mL portion of the SBN2 test (Δ%N2 750–1250) and the slope of phase III of the expiratory tracing. Each of these indices is recorded as a percentage. Closing volume (CV) is the portion of the VC that can be exhaled from the lungs after the onset of airway closure. CV is also measured from the SBN2 maneuver and is usually expressed as a percentage of the VC. A related measurement, closing capacity (CC), is the sum of the CV and RV. CC is expressed as a percentage of the TLC.
Technique
The test is performed with equipment like that used for the open-circuit FRCN2 determination (see Fig. 4.1A). The patient exhales to RV and then inspires a VC breath of 100% O2 from a reservoir or demand valve. The 100% O2 dilutes the N2 present in the lungs. Without holding the breath, the patient exhales slowly and evenly at a flow of 0.3 to 0.5 L/sec. The N2 concentration is measured by an N2 analyzer, and the exhaled volume is measured by the spirometer. The volume expired is plotted against the N2 concentration on a graph (Fig. 4.12). This washout curve can be divided into four phases:
- Phase I: Upper airway gas from the anatomic dead space (VDanat), consisting of 100% O2.
- Phase II: Mixed dead space gas in which the relative concentrations of O2 and N2 change abruptly as the VDanat volume is expired.
- Phase III: A plateau caused by the exhalation of alveolar gas in which relative O2 and N2 concentrations change slowly and evenly.
- Phase IV: An abrupt increase in the concentration of N2 that continues until RV is reached.
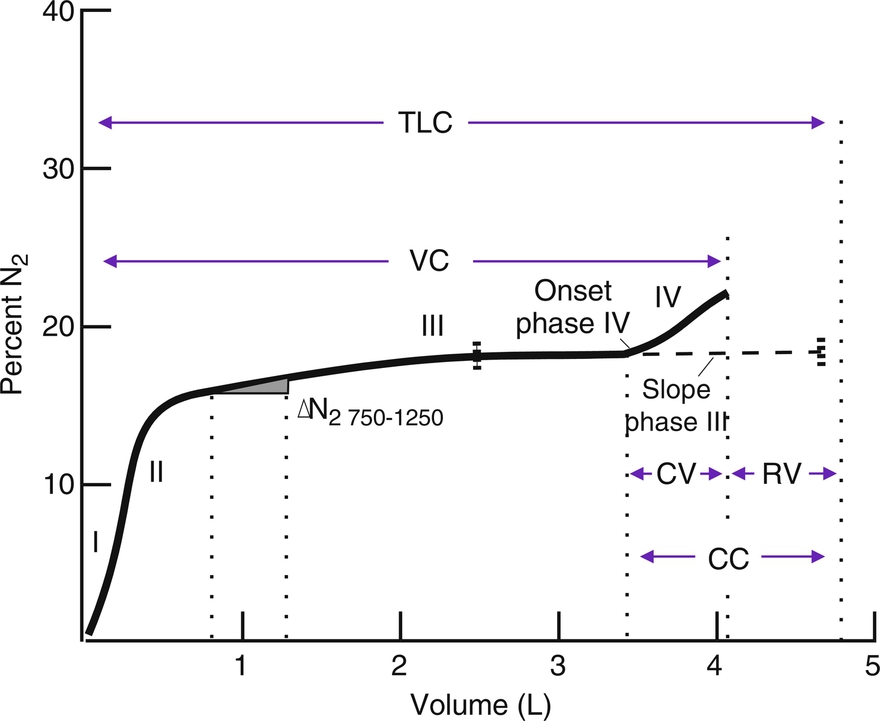
A plot of increasing N2 concentration on expiration after a single VC breath of 100% O2. The curve is divided into four phases. Phase I is the extreme beginning of the expiration when only O2 is being exhaled. Phase II shows an abrupt rise in N2 concentration as mixed bronchial and alveolar air is expired. Phase III is the alveolar gas plateau. N2 concentration changes slowly as long as ventilation is uniformly distributed. Phase IV is an abrupt increase in N2 concentration as basal airways close and a larger proportion of gas comes from the N2-rich lung apices. Several useful parameters are derived from the SBN2 tracing. The ΔN2 750–1250 and slope of phase III are indices of the evenness of ventilation distribution. CV can be read directly from the onset of phase IV until RV is reached; VC can also be read directly. RV, TLC, and CC can be calculated if the area under the curve is determined either by planimetry or electronic integration (see text).
The initial 750 mL of expired gas contains dead-space gas from phases I and II and is not used to assess the distribution of ventilation. The difference in the N2 concentration between the 750-mL and 1250-mL points is called the ΔN2 (%N2 750–1250).
The slope of phase III is the change in N2 concentration from the point at which 30% of the VC remains up to the onset of phase IV. It is recorded as Δ%N2 per liter of lung volume.
The volume expired after the onset of phase IV is the CV. CV may be added to the RV, if the RV has been determined, and expressed as the CC. CV is reported as a percentage of VC:

CC is recorded as a percentage of TLC:

TLC can be determined from the SBN2 test by integrating the area of the washout curve. When the volume of N2 is known, a dilution equation can be used to calculate RV. RV is then added to the measured VC to derive TLC. RV is calculated as follows:

where:
- FE⃗N2 = mean expired N2 concentration determined by integration of the area under the curve
- FAN2 = N2 concentration in the lungs at the beginning of inspiration, approximately 0.75 to 0.79
This method is accurate only in patients who do not have significant obstruction or dead-space–producing disease. CV and CC measurements may be in error if the patient does not perform an acceptable VC maneuver (Criteria for Acceptability 4.5). The inspired and expired VC should be within 5%. The VC during the SBN2 should match the FVC or VC within 5% or 200 mL. Expiratory flow should be maintained between 0.3 and 0.5 L/sec.
Significance and Pathophysiology
See Interpretive Strategies 4.3.
Δ%N2 750–1250
The normal Δ%N2 750–1250 is 1.5% or less for healthy young adults and slightly higher for healthy older adults (up to approximately 3%). Increased Δ%N2 750–1250 is found in diseases characterized by uneven distribution of gas during inspiration or unequal emptying rates during expiration, such as asthma, COPD, or cystic fibrosis. In patients with severe emphysema, Δ%N2 750–1250 may exceed 10%.
Slope of Phase III
A best-fit line is drawn through the phase III segment of the tracing from the point where 30% of the VC remains above RV to the onset of phase IV. The slope of this line is an index of gas distribution, similar to the Δ%N2 750–1250. Values in healthy young adults range from 0.5% to 1.0% N2/L of lung volume, with wide variability. Very slow expiratory flow rates may cause oscillations in the tracing of phase III, making the accurate measurement of Δ%N2 difficult. These oscillations are attributed to changes in alveolar N2 concentrations as blood pulses through the pulmonary capillaries during cardiac systole. Increasing the expiratory flow rate slightly eliminates this artifact. Patients who have small VC values may have difficulty exhaling enough gas to make the Δ%N2 or slope of phase III meaningful.
Other gases, such as He or sulfur hexafluoride (SF6), may also be used to assess the distribution of ventilation. The slope of the alveolar phase using these gases may be useful in detecting early changes in the small airways. Detecting these changes may identify bronchiolitis obliterans in recipients of double-lung transplants.
Closing Volume and Closing Capacity
After maximal expiration by an upright patient, more RV remains at the apices of the lungs than at the bases. Gravity causes this difference. When the test gas (O2) is inspired, the apices receive the gas occupying the patient’s dead space, which consists mostly of N2. O2 then goes preferentially to the bases of the lungs. Gas concentrations in the lungs become widely different. The apices contain RV gas plus dead-space gas rich in N2. The bases of the lungs contain a higher concentration of the test gas O2. Compression of the airways during the subsequent expiration causes the airways to narrow and then close as lung volume approaches RV. The airways at the bases close first because of gravity and the weight of the lung in patients sitting upright. As the airways at the bases close, proportionately more gas comes from the apices (known as the “first in, last out” phenomenon). This appears as an abrupt rise in the concentration of N2—the onset of phase IV.
The onset of phase IV marks the lung volume at which airway closure begins. The point at which this occurs in the VC depends on the caliber of the small airways. In healthy young adults, airways begin closing after 80% to 90% of the VC has been expired. This equates to a CC in healthy young adults of approximately 30% of the TLC with wide variations. CV and CC may be increased, indicating an earlier onset of airway closure, in the following:
- • Elderly patients
- • Restrictive disease patterns in which the FRC becomes less than the CV
- • Smokers and other patients with early obstructive disease of small airways
- • Congestive heart failure when the caliber of the small airways is compromised by edema
Patients with moderate or severe obstructive disease may have no sharp inflection separating phases III and IV of the SBN2. This lack of a clear point of airway closure is the result of the grossly uneven distribution of gas in the lungs. Patients who have airway obstruction typically show greater-than-normal values for the Δ%N2 750–1250 and slope of phase III.
In some patients with no pulmonary disease, the onset of phase IV cannot be accurately determined. Because of the variability in both the CV and CC, the mean of three tests is usually reported. Because of its poor reproducibility, the CV test is not widely used. Although it appears to be a sensitive indicator of abnormalities in the small airways, particularly in smokers, an increased CV/VC ratio is not highly predictive of which individuals will have chronic airway obstruction. To calculate normal values for CV/VC and CC/TLC according to age and sex, see the Evolve website at http://evolve.elsevier.com/Mottram/Ruppel/.
Of note, another commonly available global assessment of the distribution of ventilation is the comparison of the single-breath VA to the TLC as measured by multiple-breath inert gas washout or by body plethysmography. The VA is obtained as part of the single-breath diffusing capacity (discussed in Chapter 3) and is the volume of gas at TLC minus the estimated anatomic dead space. As such, the VA is very close to the TLC, with the normal VA/TLC ratio being greater than or equal to 85%. If the VA/TLC is less than 85%, this implies there is too much gas maldistribution such that the 10-second breath hold made during the measurement of VA is not adequate to allow full distribution of the inert gas throughout the lung.
Multiple-Breath Nitrogen Washout, Lung Clearance Index, And Phase III Slope Analysis
Description
Another gas distribution test that can be used to assess the distribution of ventilation is the multiple-breath nitrogen washout (MBNW). This test measures inert gas clearance over multiple tidal breaths as the patient breathes pure oxygen and washes out the ambient nitrogen in the lung. The patient essentially performs the same nitrogen-washout test for measuring FRC, except the data are analyzed to also allow a global indication of gas distribution, termed the lung clearance index (LCI), and a more specific analysis of the convection- and diffusion-dependent components of the phase III slope. Outside the United States, the multiple-breath washout test can also be performed with inhalation (wash-in phase) and subsequent exhalation (wash-out phase) of inert gases such as helium or sulfur hexafluoride (SF6).
Technique
The MBNW test is performed in the same manner as described for the open-circuit multiple-breath nitrogen-washout described previously. However, to accurately measure the LCI and components of the phase III slope, the ATS-ERS has recommended specific criteria of acceptability. In particular, these specify a regular breathing pattern with tidal volumes of 1.0 to 1.3 L, if feasible, with test termination indicated by at least three consecutive breaths with the end-tidal nitrogen concentration below one-fortieth of the starting concentration.
Significance and Pathophysiology
The LCI is defined as the number of FRC lung volume turnovers (cumulative expired volume/FRC) required to drive the nitrogen concentration down to one-fortieth of the starting nitrogen concentration. The normal LCI is in the range of 6 to 9, depending on patient age and equipment used. Clinical studies have suggested that LCI may be a more sensitive indicator of airway disease than FEV1, and some clinical trials are now using LCI as a primary outcome measure in response to intervention. For the phase III slope analysis, several steps are performed to determine the convection and diffusion-convection interaction-dependent components of ventilation inhomogeneity, termed the conductive slope (Scond) and the acinar slope (Sacin), respectively. Scond and Sacin are thought to roughly correspond to the terminal conducting airways and acinar airways, respectively. These slopes are currently used as research tools; for example, in asthma, both slopes are abnormal, implicating peripheral lung dysfunction.
Summary
- • To measure TLC, the FRC is measured first. FRC can be measured with N2-washout (FRCN2), He-dilution (FRCHe), or body plethysmograph (FRCpleth) techniques.
- • TLC is calculated by adding the inspiratory capacity (measured from simple spirometry) to the FRC.
- • The ERV (measured by simple spirometry) may be subtracted from FRC to derive RV.
- • The addition of RV and VC (from spirometry) also provides an estimate of TLC.
- • The plethysmographic technique is the preferred method because it is largely independent of gas distribution in the lungs.
- • The plethysmographic technique also allows the measurement of airway resistance (Raw) and its volume-associated parameters, sGaw and sRaw.
- • Gas-dilution techniques may underestimate lung volumes in the presence of significant airway obstruction.
- • Analysis of expired N2 after a single breath of oxygen (SBN2) provides a means of assessing gas distribution in the lungs. A more sophisticated analysis is possible by analyzing the breath-by-breath nitrogen washout that occurs during the MBNW test.
Case Studies
Case 4.1
The subject is a 27-year-old male high school teacher whose chief complaint is dyspnea on exertion. He states that his breathlessness has worsened over the past several months. He has smoked one pack of cigarettes per day for 10 years (10 pack-years). He denies a cough or sputum production. No one in his family ever had emphysema, asthma, chronic bronchitis, carcinoma, or tuberculosis. There is no history of exposure to extraordinary environmental pollutants.
Lung Volumes (by Plethysmograph)
| blank cell | Measured | Predicted | % Predicted |
|---|---|---|---|
| VC (L) | 2.9 | 4.7 | 62 |
| IC (L) | 1.96 | 2.91 | 67 |
| ERV (L) | 0.94 | 1.8 | 59 |
| FRC (L) | 1.87 | 3.29 | 57 |
| RV (L) | 0.93 | 1.49 | 57 |
| TLC (L) | 3.83 | 6.2 | 62 |
| RV/TLC (%) | 24 | 24 | – |
Spirometry results met all ATS-ERS acceptability and repeatability recommendations. Good subject cooperation and effort.
All data from spirometry and lung volumes are acceptable. Spirometry shows a decreased FVC and FEV1. The FEV1% is normal. Flows are within normal limits, as is the MVV. Raw is near the ULN, but sGaw is normal. Lung volumes are decreased, with the RV/TLC ratio preserved.
Impression: Moderate restrictive lung disease without evidence of obstruction. The restrictive pattern may be related to the subject’s weight. Recommend arterial blood gas testing to evaluate gas exchange abnormalities.
This case is a good example of what might be considered a pure restrictive defect. A proportional decrease in all lung volumes, including FVC and FEV1, is characteristic of a restrictive process. Flows such as FEF25%–75% or FEF50% show little or no decrease (see subject’s flow-volume curve). In addition, characteristic of simple restriction is the well-preserved ratio of FEV1 to FVC. The volume expired in the first second was in correct proportion to the VC despite decreases in their absolute volumes. The MVV demonstrates the subject’s ability to move a normal maximal volume. This may be accomplished, despite moderately severe restriction, by an increase in the rate rather than the tidal volume.

The explanation for the restrictive pattern lies in the subject’s weight of 297 pounds. His actual weight is approximately 200% of his ideal weight. Obesity commonly causes restrictive patterns.
The subject returned for analysis of arterial blood gases, which revealed resting hypoxemia and slightly elevated Paco2. Blood gas measurements confirmed the degree of impairment caused by the moderately severe restrictive pattern. Other tests that might be considered include ventilatory response tests for hypoxemia or hypercapnia (Chapter 5). Studies to diagnose sleep apnea might be indicated if the subject had symptoms of disordered breathing during sleep or excessive daytime sleepiness. This subject’s borderline Raw suggests upper airway involvement, which might predispose him to obstructive sleep apnea. Obesity is also associated with an increased risk of asthma, which may indicate the need for challenge testing (e.g., methacholine) if the patient reports suggestive symptoms.
The subject was referred to a dietician for counseling in weight management.
Case 4.2
The subject is a 37-year-old pipefitter whose chief complaint is shortness of breath at rest and with exertion. His dyspnea has worsened in the past 6 months, so much so that he is no longer able to work. Additional symptoms include a dry cough. He admits some sputum production when he has a chest cold. He has smoked one pack of cigarettes per day for 19 years (19 pack-years). He quit smoking approximately 3 weeks before the tests. His father died of emphysema and his mother of lung cancer. His brother is in good health. His occupational exposure includes working for the past 13 years in the assembly room of a boiler plant. He admits to seldom using the respirators provided at work despite a dusty environment.
| blank cell | Pre BD | Predicted | % Predicted | Post BD | % Predicted | % Change |
|---|---|---|---|---|---|---|
| FVC (L) | 3.04 | 5.05 | 60 | 3.1 | 61 | + 2% |
| FEV1 (L) | 2.03 | 3.90 | 52 | 2.26 | 58 | + 11% |
| FEV1/FVC (%) | 67 | 77 | — | 73 | — | + 9% |
| FEF25%–75% (L/sec) | 1.3 | 4.09 | 32 | 1.60 | 39 | + 23% |
| FEF50% (L/sec) | 2.12 | 5.78 | 37 | 2.42 | 42 | + 14% |
| FEF25% (L/sec) | 0.78 | 2.95 | 26 | 1.2 | 41 | + 54% |
| MVV (L/min) | 83 | 141 | 59 | 91 | 65 | + 10% |
| Raw (cm H2O)/L/sec) | 2.51 | 0.6–2.4 | — | 2.47 | — | -2% |
| sGaw (L/sec/cm H2O/L) | 0.14 | 0.11–0.44 | — | 0.15 | — | + 7% |
| blank cell | Measured | Predicted | % Predicted |
|---|---|---|---|
| VC (L) | 3.04 | 5.05 | 60 |
| IC (L) | 1.62 | 3.18 | 51 |
| ERV (L) | 1.42 | 1.87 | 76 |
| FRC (L) | 2.75 | 3.81 | 72 |
| RV (L) | 1.33 | 1.94 | 69 |
| TLC (L) | 4.37 | 6.99 | 63 |
| RV/TLC (%) | 30 | 28 | – |
Spirometry results met all ATS-ERS recommendations, prebronchodilator and postbronchodilator. Lung volumes by N2 washout: All maneuvers were performed acceptably. Duplicate measurements were averaged. Raw and sGaw efforts were performed appropriately.
- 1. What is the interpretation of the following?
- a. Prebronchodilator spirometry
- b. Response to bronchodilator
- c. Airway resistance and conductance
- d. Lung volumes
- 2. What is the cause of the subject’s symptoms?
- 3. What other tests might be indicated?
- 4. What treatment might be recommended based on these findings?
All data from spirometry and lung volumes are acceptable. Spirometry shows a reduced FVC and FEV1. The FEF25%–75%, FEF50%, and FEF25% are all reduced. The MVV is low. Raw and sGaw are close to their respective limits of normal. Response to bronchodilators is borderline, with an increase in the FEV1 of 230 mL (11%). The FEF25% improved somewhat more than the other flows. The subject’s lung volumes are all decreased. His RV/TLC ratio is normal.
Impression: There is mild airway obstruction combined with a restrictive pattern. The response to inhaled bronchodilator medication is borderline. A trial of bronchodilators should be considered. Arterial blood gas testing to evaluate possible hypoxemia is recommended.
He typifies a patient who has combined obstructive and restrictive disease. His spirometry results indicate that a mild obstructive component is present, as revealed by his FEV1 (52% of predicted) and the other flows. His FEV1/FVC, however, is close to normal because his FVC is also reduced. His symptoms of cough and sputum suggest an obstructive process. His smoking and family history place him at risk. Because FVC can be reduced in either obstructive or restrictive processes, spirometry alone would not have adequately defined the subject’s disease.
Lung volume measurements (see subject’s N2-washout curve) confirm the presence of a restrictive component (see Fig. 4.8). All lung volumes are reduced in similar proportions. The reduction in VC matches decreases in FRC, RV, and TLC. The patient’s history and symptoms suggest the possibility of restrictive or obstructive disease or both. The obstructive component may be related to the subject’s smoking history, but the etiology of the restrictive component is less clear. On further inquiry, it was learned that the patient’s occupation involved exposure to asbestos, which can cause fibrosis and/or carcinoma. Chest radiographs revealed linear calcifications of the diaphragmatic pleura and pleural thickening, as well as fibrotic changes. These findings are all consistent with asbestos exposure.
A sputum examination was performed, and asbestos bodies were identified from the subject’s sputum. Open-lung biopsy was deferred because both the obstructive and restrictive components seemed to be appropriately identified. Analysis of resting arterial blood gases is probably indicated because the subject has a significant degree of restriction. Diffusing capacity (Dlco) could also be used to identify possible gas exchange abnormalities.
Because of his dyspnea on exertion, the patient returned for an exercise evaluation. He walked on a treadmill with an arterial catheter in place. His Pao2 fell from 65 mm Hg (rest) to 55 mm Hg after only 2 minutes of walking at 2 miles per hour. The desaturation was corrected when the subject breathed O2 by nasal cannula at 1 L/min. A baseline 6-Minute Walk Test would allow future assessments of the patient’s functional capacity and prognosis.
The patient was given a trial of bronchodilators and reported significant symptomatic improvement. He began using supplemental O2 via a portable system and was able to return to work in a position modified to accommodate his abilities.
Self-Assessment Questions
Entry-Level
- 1. Which of the following cannot be used to measure FRC?
- a. Single-breath nitrogen washout
- b. Open-circuit multiple-breath nitrogen washout
- c. Closed-circuit multiple-breath helium dilution
- d. Body plethysmography
- 2. In patients with obstructive lung disease, the gas-dilution methods for FRC determination
- a. overestimate FRC.
- b. equal body plethysmography FRC.
- c. underestimate FRC.
- d. equal radiographic FRC.
- 3. Standardizing the measurement of lung volumes, the N2-washout test is considered complete when the
- a. N2 concentration has decreased to less than 2.5% after 7 minutes.
- b. N2 concentration has decreased to less than 1.5% for at least three consecutive breaths.
- c. N2 concentration changes by less than 0.02% in 30 seconds.
- d. N2 concentration has reached equilibrium.
- 4. A patient has the following results from a pulmonary function test:
What is the patient’s RV, and what is the RV/TLC ratio?- a. 4.60 L and 70%
- b. 1.80 L and 27%
- c. 2.20 L and 34%
- d. 1.95 L and 26%
- 5. A patient has the following lung volumes measured using a body plethysmograph:
blank cell Measured Predicted % Predicted VC (L) 3.50 4.30 81 FRCpleth (L) 3.80 3.00 127 RV (L) 3.00 2.00 150 TLC (L) 7.20 6.30 114
These values are most consistent with- a. normal lung volumes.
- b. a restrictive pattern as in pulmonary fibrosis.
- c. an obstructive pattern such as emphysema.
- d. a mixed obstructive and restrictive pattern.
- 6. The calculation of FRC with the body plethysmograph is based on
- a. Charles’ law.
- b. Poiseuille’s law.
- c. Boyle’s law.
- d. Dalton’s law.
- 7. Which is the correct formula for sGaw?
- a. sGaw = Raw × TLC
- b. sGaw = Raw × VTG
- c. sGaw = (1/Raw)/VTG
- d. sGaw = (1/Raw)/TLC
- 8. Which of the following are true about the measurement of lung volumes using the body plethysmograph?
- 1. The plethysmograph measures all gas in the thorax.
- 2. Gas in the thorax that does not communicate with the mouth is not measured by the plethysmograph.
- 3. FRCpleth is often larger than gas-dilutional FRC determinations.
- 4. FRCpleth can overestimate true FRC in severe airway obstruction.
- a. 1, 2, 3, and 4
- b. 1 and 2
- c. 1, 3, and 4
- d. 2 and 3
- 9. A 53-year-old woman has the following measurements obtained during pulmonary function testing:
Which of the following best explains these findings?- a. A leak during the FRCHe determination
- b. Normal pulmonary function
- c. Airflow obstruction with air trapping
- d. Poor patient effort
- 10. In measuring FRC by body plethysmography, which of the following is most correct?
- 1. The patient should pant at a rate between 0.5 and 1Hz.
- 2. The patient should pant at about 90 breaths/min.
- 3. The largest of three acceptable tests is reported.
- 4. The average of three acceptable tests that agree within 5% is reported.
- a. 1 and 3 only
- b. 2 and 4 only
- c. 1 and 4 only
- d. 1, 2, and 3
- 11. A 25-year-old patient performs an SBN2 test and records a slope of phase III of 2.9%. This value is
- a. consistent with increased physiologic dead space.
- b. indicative of uneven distribution of gas within the lungs.
- c. within normal limits.
- d. consistent with a gas analyzer malfunction.
- 12. A patient with alpha-1 antitrypsin deficiency and severe airway obstruction has lung volumes measured with the open-circuit N2-washout method and by plethysmography, with the following results:
The volume of trapped gas is- a. 0.91 L.
- b. 3.04 L.
- c. 1.81 L.
- d. 1.59 L.
- 13. A patient with an FEV1 of 1.24 L and an FVC of 3.10 L performs the FRCHe test. The He concentration between 6 and 6.5 minutes changed by 0.1%, and between 7 and 7.5 minutes, it changed by 0.08%. The technician correctly concludes that equilibration has not been reached. Which is the most likely explanation?
- a. The patient is malingering.
- b. The N2 analyzer has malfunctioned.
- c. The CO2 absorber is contaminated.
- d. This is consistent with severe airway obstruction.
- 14. A 30-year-old man is being tested for asthma but has normal spirometry at baseline and no change after a bronchodilator. Which of the following parameters could be used to assess whether the patient has a bronchodilator response?
- a. sGaw
- b. TLC
- c. Raw
- d. FEV1/FVC