Altered Cellular and Tissue Biology: Environmental Agents
Victoria Gray, Kathryn L. McCance and Julia L. Rogers
 http://evolve.elsevier.com/Rogers/pathophysiology/
Most diseases are caused by multiple factors acting together (multifactorial) or a single factor interacting with a genetically susceptible person. Injury to cells or their surrounding environment, the extracellular matrix (ECM), leads to tissue and organ damage. Although the normal cell is characterized by a narrow range of structural and functional constraints, cells can adapt to increased demands and stress to maintain a steady state, called homeostasis. Adaptation is a reversible response involving structural or functional modifications to accommodate both physiologic (normal) demands and pathologic (adverse) conditions. For example, the uterus adapts to pregnancy—a normal physiologic state—by enlarging. Pregnancy triggers an increase in the size and number of cells to accommodate a growing fetus. Adaptation to a pathologic condition occurs with high blood pressure or hypertension. Myocardial cells become enlarged, resulting in a larger, thicker left ventricle to accommodate the increased workload of the heart. Cellular adaptations to pathologic conditions are usually only temporarily successful. If the stressor is eliminated, cells can return to normal state without lasting injury; however, severe or long-term stressors can overwhelm the adaptive processes, resulting in cellular injury or death. Common sources of cell stress include structural damage, neoplasia, fluid/solute accumulations, genetic influences, and aging.
Cellular injury can result from any factor that disrupts cellular structures or deprives the cell of oxygen and essential nutrients. Resultant injury may be sublethal (reversible) or lethal (irreversible). Common sources of cell injury are classified broadly as ischemic–hypoxic (lack of sufficient oxygen), ischemia–reperfusion, free radical, immunologic, infectious, intentional or unintentional, and inflammatory. Clinical manifestations and alteration to normal physiology will vary with the type of injury. Stress from metabolic derangements is linked to intracellular excessive accumulations of carbohydrate, protein, and lipids. Cell death can result in calcium accumulation within surrounding damaged tissue, a condition referred to as pathologic calcification. The two main types of cell death are necrosis and apoptosis. A third process, autophagy, occurs during times of cellular stress and is typically triggered by deficiency of nutrients or growth factors. The various forms of cell death are discussed in greater detail later in this chapter.
Cellular aging causes structural and functional changes that may result in decreased capacity to recover from injury and, ultimately, cell death. The exact mechanisms governing cellular aging is unclear; distinguishing pathologic changes from age-associated physiologic changes can be challenging. Aging clearly results in alterations to cellular structure and function, yet senescence (growing old) is both inevitable and normal.
Cellular Adaptation
Cells have the remarkable capacity to adapt to their environment to avoid injury. An adapted cell is neither normal nor injured; its status falls somewhere between these two states. Adaptations are reversible changes affecting the size, number, phenotype, metabolic activity, or function of cells.1
Adaptive responses have limits; additional stress can compromise essential cell functions leading to cell injury or death. Cell adaptation may be the central component in many disease states. In the early stages of successful adaptation, cells may have enhanced function, making it difficult to distinguish a pathologic response from vigorous adaptation. Over time, the adaptive response may fail, and pathology will ensue. The most significant adaptive changes in cells include the following:
- • Atrophy—decrease in cell size
- • Hypertrophy—increase in cell size
- • Hyperplasia—increase in cell number
- • Metaplasia—reversible replacement of one differentiated cell type by another cell type
- • Dysplasia—or deranged cellular growth, is not considered a true cellular adaptation but rather atypical hyperplasia
These changes are shown in Fig. 2.1.

A series of six illustrations shows the adaptive and dysplastic alterations in simple cuboidal epithelial cells.under Each illustration shows a basement membrane under epithelial cells. The first illustration represents the normal state of cells and shows four simple cuboidal epithelial cells, arranged in a neat row. The second illustration represents the atrophy in cells, where the cells are smaller and distorted. The third illustration represents hypertrophy in cells, where the cells are enlarged. The fourth illustration represents hyperplasia, where the cells are dense and narrower. The fifth illustration represents metaplasia, where the cells are smaller and clustered into a heap. The sixth illustration represent dysplasia, where the cells are much smaller, with broken nuclei, and clustered into a heap.
Atrophy
Atrophy refers to decrease in cell size. If atrophy affects enough cells, the affected organ decreases in size and is said to be atrophic. Atrophy can affect any organ, but it occurs most commonly in skeletal muscle, heart muscle, secondary sex organs, and the brain. Atrophy is classified as either physiologic or pathologic, depending on the underlying cause, and regardless of whether atrophy results from normal physiologic or pathologic conditions, identical changes to cellular structure will occur. Physiologic atrophy occurs with normal development. In early development, embryonic structures (i.e., notochord) undergo atrophy, whereas during early childhood the thymus gland involutes, and in adolescence, the tonsils shrink. In women, the uterus decreases in size shortly after childbirth.
Pathologic atrophy occurs in organs as a result of decreases in workload, pressure, use, blood supply, nutrition, hormonal stimulation, or neural stimulation. Disuse atrophy (decreased workload) occurs when a limb is placed in a cast for an extended period with prolonged bed rest or immobilization. Pressure can cause tissue to atrophy and is often seen in pressure ulcers. Chronic ischemia can result in senile atrophy from a decrease in blood supply to the brain (Fig. 2.2). The lack of hormonal stimulation results in atrophic changes that occur more readily with age. In postmenopausal women, the ovaries atrophy secondary to a lack of estrogenic stimulation. In men, the gonads shrink secondary to decreases in hormonal stimulation. Aging also results in atrophic changes to brain cells. Denervation atrophy is seen with peripheral neuropathies. Atrophic muscle cells contain less endoplasmic reticulum (ER), fewer mitochondria, and fewer myofilaments (the contractile components of the muscle fiber) compared with normal cells. Muscle atrophy, caused by decreased neural stimulation, results in reduced oxygen consumption and decreased amino acid uptake. The mechanisms of atrophy for such changes include a decrease in protein synthesis, an increase in protein degradation, or both. The degradation of proteins occurs mainly by the ubiquitin–proteosome pathway (see Chapter 1).
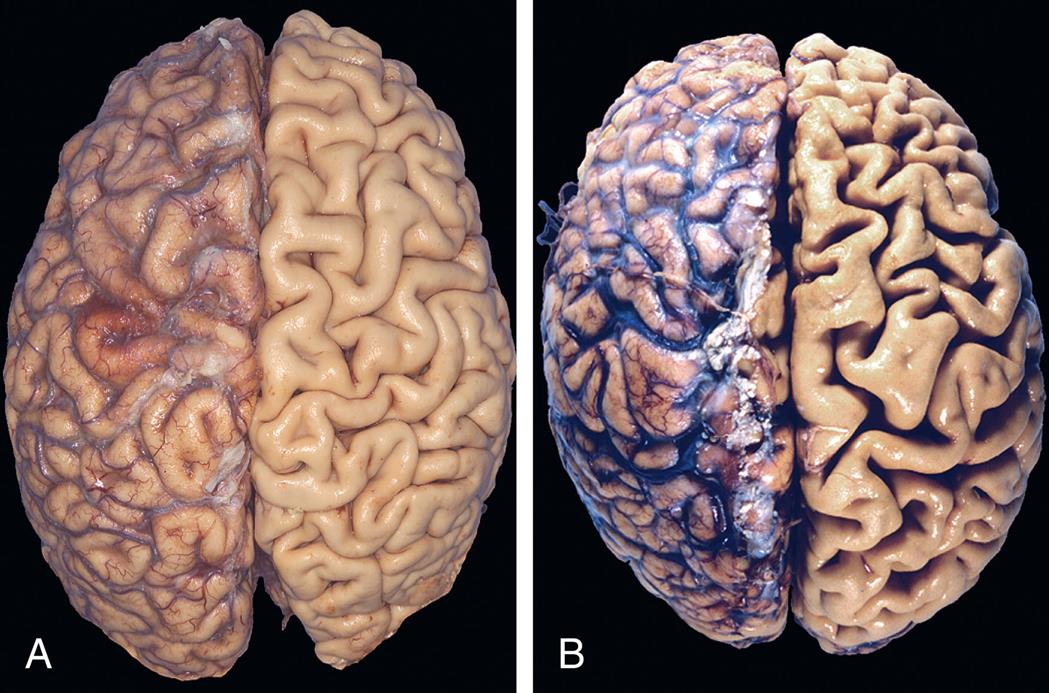
(A) Normal brain of a young adult. (B) Atrophy of the brain in an 82-year-old male with atherosclerotic cerebrovascular disease, resulting in reduced blood supply. Note that loss of brain substance narrows the gyri and widens the sulci. The meninges have been stripped from the right half of each specimen to reveal the surface of the brain. (From Kumar V, Abbas AK, Aster JC. Robbins & Cotran pathophysiologic basis of disease, 10th edition. Philadelphia: Elsevier; 2020:60.)
Atrophy, secondary to chronic malnutrition, is associated with a process called autophagy (“self-eating”), where self-destructive autophagic vacuoles are created within the cell. These membrane-bound vesicles contain cellular debris and hydrolytic enzymes that degrade substances into simple units of fat, carbohydrate, or protein. Isolation of these enzymes within autophagic vacuoles prevents uncontrolled cell destruction in neighboring cells and tissue. Some substances contained within autophagic vacuole may resist destruction, persisting as membrane-bound residual bodies within tissues. Lipofuscin refers to yellow-brown pigmented granules; lipid-containing residue that persists after lysosomal destruction. These granules tend to accumulate in liver, myocardial, renal, retinal, adrenal, and neural tissues as individuals age. When they accumulate in the skin, they are the basis of the so-called age spots appearing in older individuals.
Hypertrophy
Hypertrophy is a compensatory increase in the size of cells, occurring in response to mechanical load or stress, and results in increased size of the affected organ. Common triggers include repetitive stretching, chronic pressure, and volume overload. The cells of the heart and kidneys are particularly prone to enlargement. Hypertrophy, as an adaptive response, occurs in the striated muscle cells of both the heart and skeletal muscles. It presents clinically as muscle enlargement. In the case of cardiac muscle hypertrophy, typically left ventricular hypertrophy (LVH), an increased synthesis of cardiac muscle proteins follows, allowing muscle fibers to do more work (Fig. 2.3). Hypertrophy may be physiologic or pathologic. Physiologic hypertrophy results from increased demand, stimulation by hormones, and growth factors. An example of physiologic hypertrophy is enlargement secondary to aerobic exercise or a “runner's heart.” In this case, no pathology is present, and normal structure and function are preserved. Pathologic hypertrophy results from chronic hemodynamic overload, such as from hypertension or heart valve dysfunction. When LVH occurs secondary to hypertension, it represents pathologic hypertrophy. The initial adaptation, in the form of cardiac enlargement with dilated ventricles, is short lived. Prolonged cardiac hypertrophy progresses to contractile dysfunction and finally heart failure. In contrast to physiologic hypertrophy, where the myocardial matrix is preserved, pathologic hypertrophy is associated with increased interstitial fibrosis, cell death, and abnormal cardiac function (see Fig. 2.3). After a unilateral nephrectomy (removal of one kidney), compensatory hypertrophy occurs in the remaining kidney, which preserves renal structure and function.
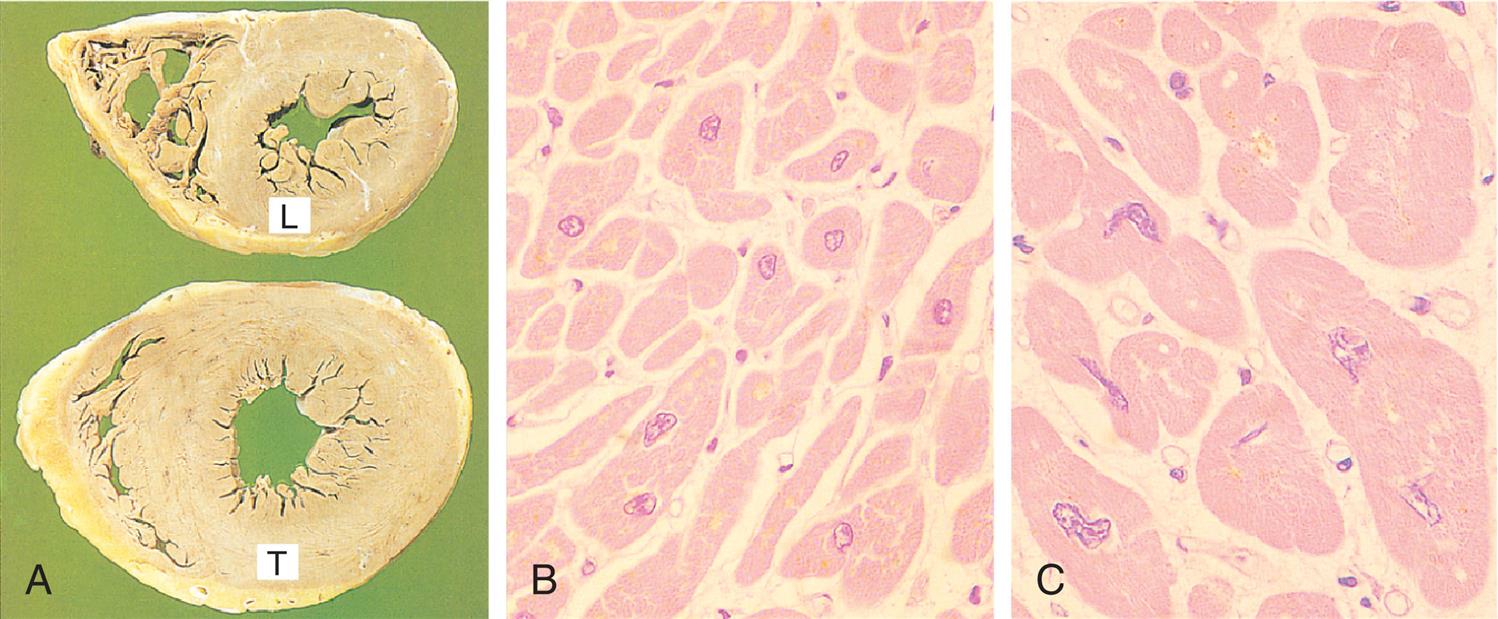
(A) Transverse slices of a normal heart and a heart with hypertrophy of the left ventricle (L, normal thickness of left ventricular wall; T, thickened wall from heart in which severe narrowing of aortic valve caused resistance to systolic ventricular emptying). (B) Histology of cardiac muscle from the normal heart. (C) Histology of cardiac muscle from a hypertrophied heart. (From Stevens A, Lowe J. Pathology: Illustrated review in color, 2nd edition. Edinburgh: Mosby; 2000.)
Close-up A shows transverse slices of a heart, one with normal thickness, labeled L, and the other with thickened walls, labeled T. Micrograph B shows normal tissues in the cardiac muscle of a heart. Micrograph C shows larger and thicker tissues in the cardiac muscle of a heart.
Hyperplasia
Hyperplasia is an increase in the number of cells, resulting from an increased rate of cellular division. As a response to a stimulus (e.g., injury), hyperplasia occurs when the damage is severe or prolonged or when it results in cell death. Hyperplasia requires that cells undergo mitosis, a process wherein a single cell divides into two identical cells. The main mechanism for hyperplasia is the production of hormones or growth factors, which stimulate the remaining cells after injury or cell loss to synthesize new cell components and, ultimately, to divide. Another mechanism is increased output of new cells from tissue stem cells. For example, if liver cells are injured, new cells can regenerate from intrahepatic stem cells.1 Mature cells have differing capacity for hyperplastic (mitotic) growth. Although hyperplasia and hypertrophy have distinct processes, they can occur together within the same tissue.
Two types of physiologic (normal) hyperplasia occur: compensatory hyperplasia and hormonal hyperplasia. Compensatory hyperplasia is an adaptive mechanism that enables organs to regenerate. Removal of part of the liver leads to rapid hyperplasia of the remaining hepatocytes (liver cells). Even with removal of 70% of liver mass, regeneration is complete in about 2 weeks. Significant compensatory hyperplasia readily occurs in epidermal and intestinal epithelia, hepatocytes, bone marrow cells, and fibroblasts. Loss of cells within an organ triggers deoxyribonucleic acid (DNA) synthesis, mitotic division, and hyperplasia. To a lesser extent, hyperplasia occurs in bone, cartilage, and smooth muscle cells. A callus, or thickening of the skin, is an example of compensatory hyperplasia. It occurs in response to injury from a mechanical stimulus. Another example is the response to wound healing secondary to the inflammation process (see Chapters 7 and 9).
Hormonal hyperplasia occurs chiefly in estrogen-dependent organs, such as the uterus and breast. For example, during pregnancy and puberty in the female, proliferation of the glandular epithelium occurs, causing hypertrophy (enlargement) of the female breasts. Similarly, after ovulation, estrogen stimulates the endometrium to grow and thicken for reception of the fertilized ovum. If pregnancy occurs, hormonal hyperplasia, as well as hypertrophy, enables the uterus to enlarge. (Hormone function is discussed further in Chapters 21, 22, 24–26.)
Pathologic hormonal hyperplasia is the abnormal proliferation of normal cells, usually in response to excessive hormonal stimulation or to the action of growth factors on target cells. Hyperplastic cells are identified by pronounced enlargement of the nucleus, clumping of chromatin, and the presence of one or more enlarged nucleoli. The most common example is pathologic hyperplasia of the endometrium, which is caused by an imbalance between estrogen and progesterone levels with relative increases of estrogen (see Chapter 25). Pathologic endometrial hyperplasia, which causes excessive menstrual bleeding, is under the influence of regular growth-inhibition controls. The resulting endometrial hyperplasia commonly presents as erratic or excessive uterine bleeding, known as dysfunctional uterine bleeding. Left unchecked, the regular growth-inhibiting control mechanisms can fail over time, producing malignant transformation or endometrial cancer.1
Benign prostatic hyperplasia (BPH) is another example of pathologic hyperplasia and results from changes in hormone balance (Fig. 2.4). The incidence of BPH increases with age, secondary to age-related hormonal imbalances that result in epithelial and stromal proliferation or impaired apoptosis. Similarly, thyroid enlargement, including thyroid goiters, can result from excessive levels of pituitary thyroid-stimulating hormone (TSH). In the absence of malignant transformation, when the predisposing factors are corrected, pathologic hyperplasia will typically regress.
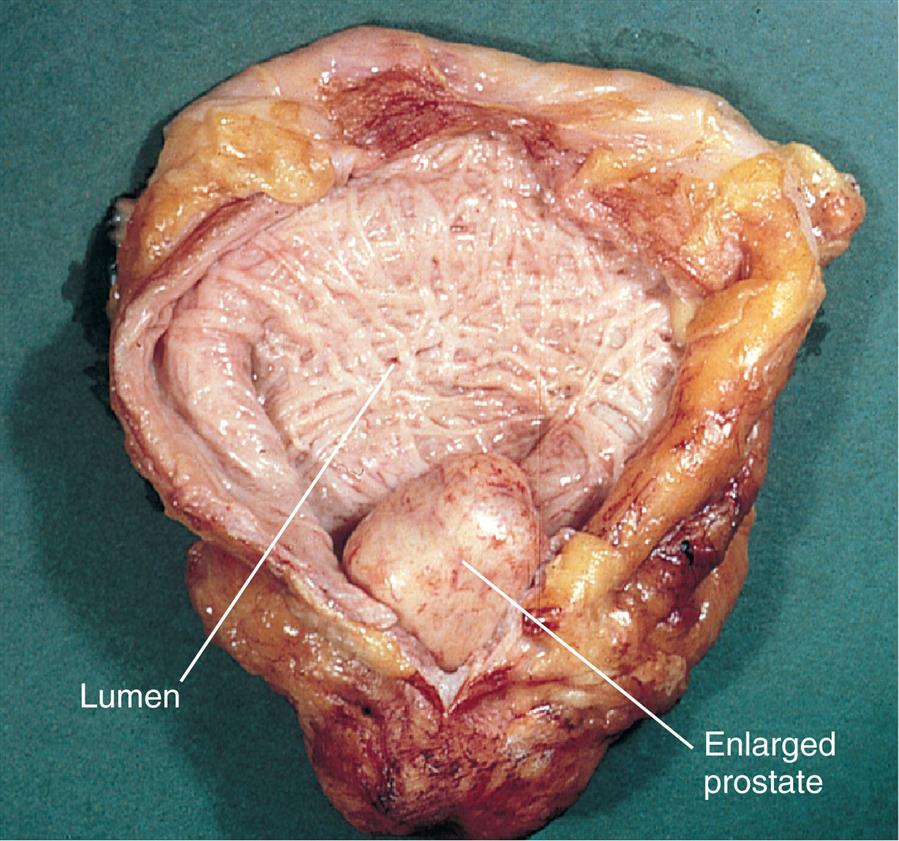
The enlarged prostate is seen protruding into the lumen of the bladder, which appears trabeculated. These “trabeculae” result from hypertrophy and hyperplasia of smooth muscle cells that occur in response to increased intravesical pressure caused by urinary obstruction. (From Damjanov I. Pathology for the health professions, 4th edition. St Louis: Saunders; 2012.)
Dysplasia: Not a True Adaptive Change
Dysplasia refers to abnormal changes in the size, shape, and organization of mature cells (Fig. 2.5). Dysplasia is not considered a true adaptive process but is related to hyperplasia and is often referred to as atypical hyperplasia. Although dysplastic tissue appears disorderly, the term dysplasia does not refer to cancer. Dysplastic changes are common in the epithelial tissue of the uterine cervix, the endometrium, and the gastrointestinal (GI) and respiratory tract mucosa. Dysplasia that does not involve the entire thickness of epithelium may be completely reversible.1 When dysplastic changes penetrate the basement membrane, it is considered an invasive neoplasm. Dysplasia is described as “low grade” or “high grade,” depending on the degree of variation from normal. If the triggering stimulus is removed—for example, certain hormonal stimuli—dysplastic transformation may be reversible. (Dysplasia is discussed further in Chapter 12.)
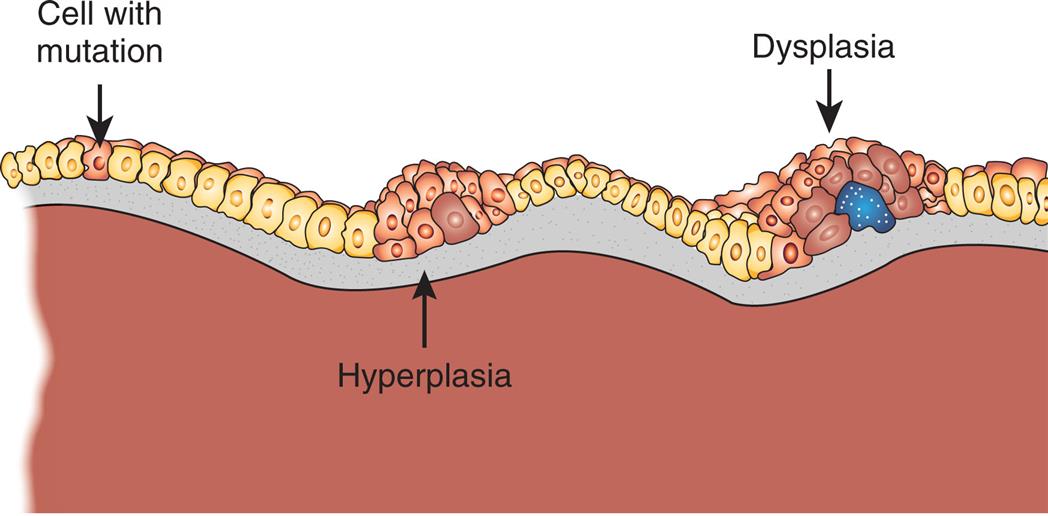
Abnormal changes in the size, shape, and organization of cells. Dysplasia is related to hyperplasia and called atypical hyperplasia. (Adapted from http://www.ndhealthfacts.org/wiki/Oncology_%28Cancer%29.)
A diagram shows a series of cells with three distinct sections. The section on the left shows a mutated cell nestled between two normal cells. The section in the middle show a cluster of cells affected by hyperplasia. The section on the right shows a cluster of cells affected by dysplasia.
Metaplasia
Metaplasia is the reversible replacement of one mature cell type (epithelial or mesenchymal) by another cell type that can survive in an adverse environment. It is found in association with tissue damage, repair, and regeneration.1 Usually, however, the change is not beneficial. For example, in the long-term cigarette smoker, the chronic irritation from smoke causes the normal ciliated columnar epithelial cells of the trachea and bronchi to become replaced by stratified squamous epithelial cells (Fig. 2.6). The newly formed squamous epithelial cells do not secrete mucus or have cilia, causing a loss of a critical protective mechanism. Bronchial metaplasia can be reversed if the inducing stimulus, usually cigarette smoking, is removed. If the inducing stimulus is persistent, it can initiate malignant transformation in the metaplastic epithelium. At certain times, the adaptive replacement cell type may be more suitable to the changed conditions in the surrounding environment. For example, gastroesophageal reflux damages squamous epithelium of the esophagus, and the adapted change or replacement by glandular epithelium may better tolerate the acidic environment.
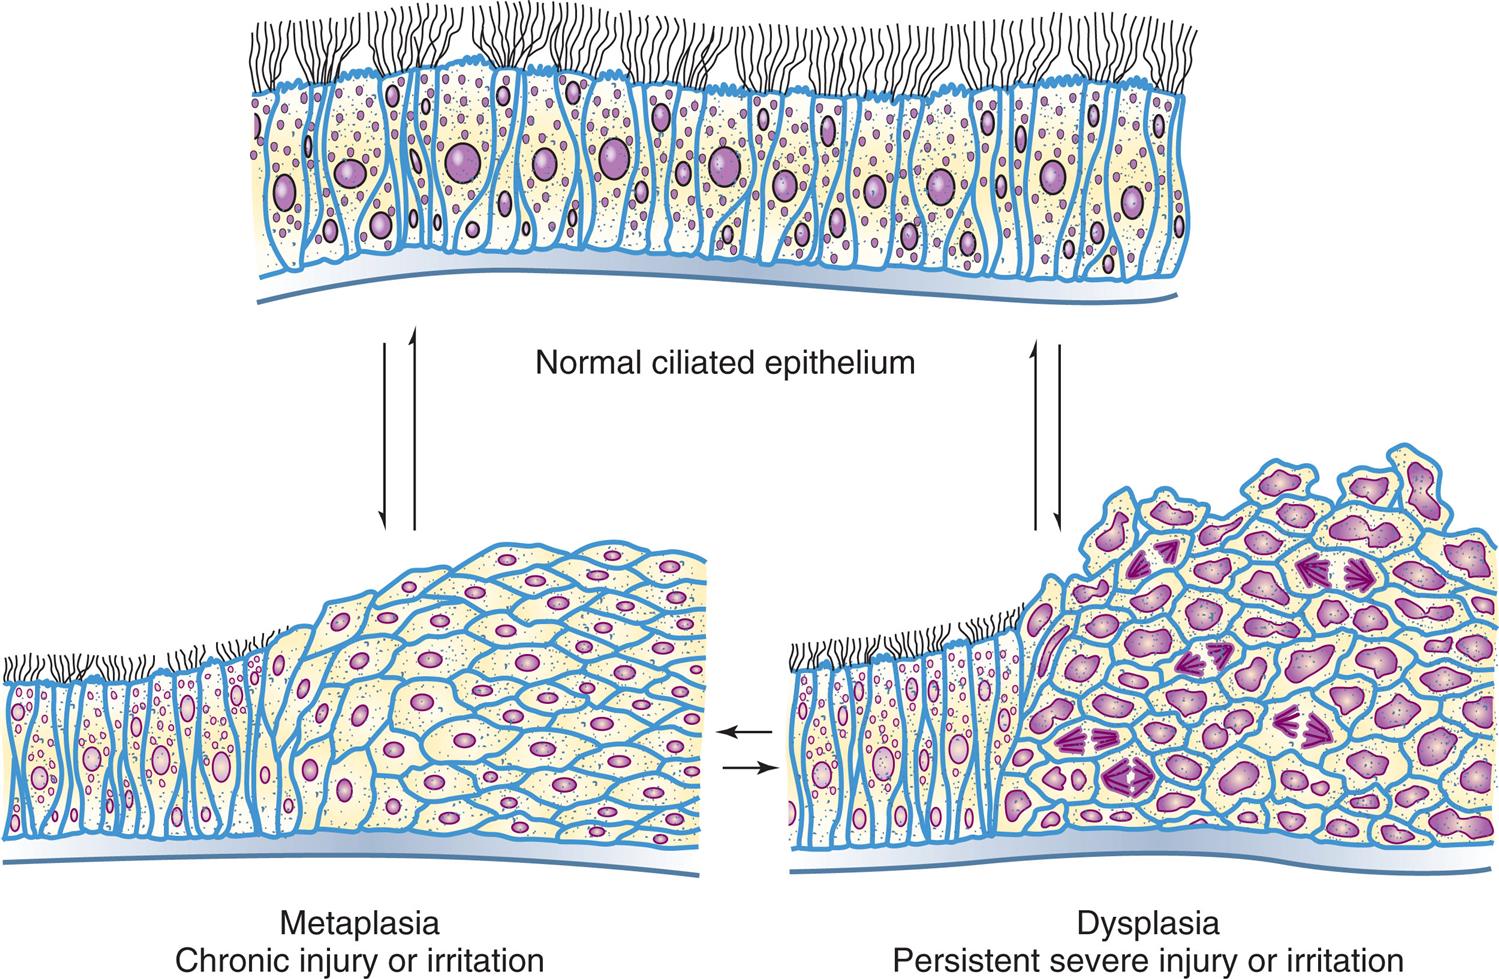
A three-part diagram illustrates reversible changes in cells along the lining of the bronchi. The part at the top shows a normal ciliated epithelium. The part on the bottom left shows epithelium cells with metaplasia, resulting in chronic injury or irritation. The part on the bottom right shows epithelium cells with dysplasia, resulting persistent severe injury irritation. Each part can experience a reversible process resulting in the other part.
Metaplasia results from a reprogramming of stem cells present in most epithelia or colonization by differentiated cell populations from adjacent sites.1 These precursor cells mature along a different pathway with metaplastic change. Differentiation of stem cells from a particular cell lineage responds to signals generated by growth factors, cytokines, and ECM components in the cell’s environment.
Cellular Injury
Injury to cells and to the ECM leads to injury of tissues and organs and ultimately determines the structural patterns of disease. Cellular injury occurs when the cell is unable to maintain homeostasis (a normal or adaptive steady state). The injury may be reversible injury (the cell can recover) or irreversible injury (cellular death). Loss of function is the result of cell and ECM injury and cell death. Cellular injury may occur secondary to a variety of factors: chemical agents, hypoxia, free radicals, infectious agents, physical and mechanical factors, immunologic reactions, genetic factors, and nutritional imbalances. Types of cell injuries and their responses are summarized in Table 2.1 and Fig. 2.7.
Table 2.1
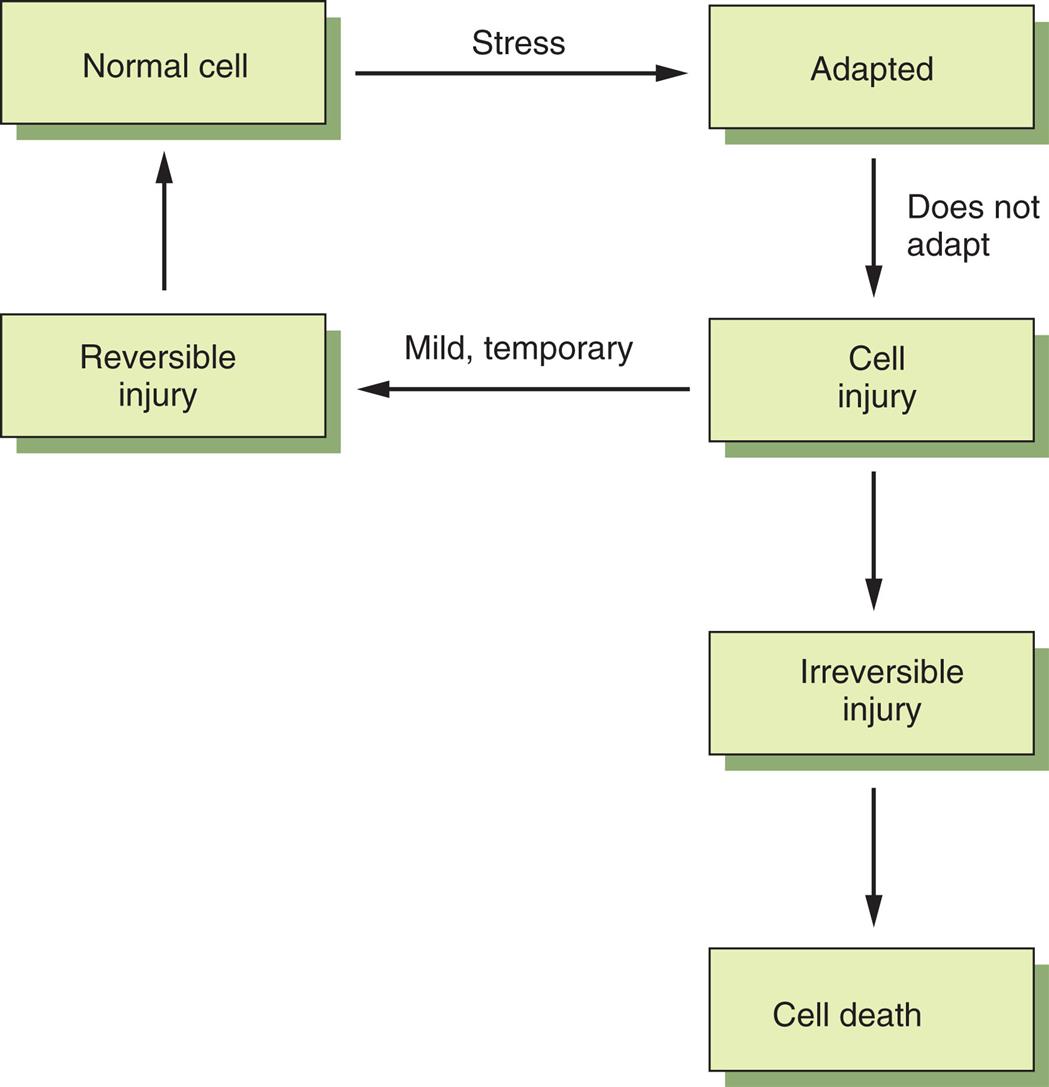
The normal cell responds to physiologic and pathologic stresses by adapting (atrophy, hypertrophy, hyperplasia, metaplasia). Cell injury occurs if the adaptive responses are exceeded or compromised by injurious agents, stress, and mutations. The injury is reversible if it is mild or transient, but if the stimulus persists, the cell suffers irreversible injury and eventually death.
A flow diagram shows the various stages of cellular adaptation. The stages are as follows. Normal cell through stress to adapted cell. If cell does not adapt, the cell experiences injury. If the injury is mild and temporary, the cell returns to its normal state. If the injury is irreversible, it leads to cell death.
The extent of cellular injury is a function of cell type, level of differentiation, and adaptive mechanisms of the cell. Also important are the nature, severity, and duration of the injury. Fully differentiated, mature cells are more susceptible to injury than are cell precursors. Two individuals exposed to an identical stimulus may incur varying degrees of cellular injury. Individual differences, including genetics, nutritional status, and immunologic competency, can profoundly influence the extent of cell injury. The precise “point of no return” with respect to cell death remains unclear. Once changes to the nucleus have occurred or cell membranes are disrupted, or both, irreversible injury and cell death are inevitable.
General Mechanisms of Cell Injury
Regardless of the cause of injury, a host of biochemical events results in cell injury and death. Such events include adenosine triphosphate (ATP) depletion, damage from oxygen-derived free radicals, and alterations in calcium level. Injury to cell components includes membrane damage, protein folding defects, mitochondrial compromise, and DNA damage (see Table 2.2). The most common forms of cell injury include (1) ischemic and hypoxic injury, (2) ischemia–reperfusion injury, (3) oxidative stress or accumulation of oxygen-derived free radicals-induced injury, and (4) chemical injury.
Table 2.2
ATP, Adenosine triphosphate; Ca++, calcium; DNA, deoxyribonucleic acid; H2O2, hydrogen peroxide; O2,superoxide radical; OH−, hydroxyl radical; ROS, reactive oxygen species.
Ischemic and Hypoxic Injury
Hypoxia, or the lack of sufficient oxygen within cells, is the single most common cause of cellular injury and is a prominent feature of pathological states encountered in bacterial infection, inflammation, wounds, cardiovascular defects, and cancer (Fig. 2.8).2 Hypoxia can result from several circumstances, such as reduced oxygen content in the ambient air, loss of hemoglobin, decreased red blood cell (RBC) production, respiratory and cardiovascular diseases, and poisoning of the cellular oxidative enzymes (cytochromes). The most common cause of hypoxia is ischemia, or a reduced supply of blood and therefore oxygen. Hypoxia negatively impacts normal physiologic processes: differentiation, angiogenesis, proliferation, erythropoiesis, and overall cell viability. Mitochondria are the primary consumers of oxygen. Hypoxia triggers the mitochondrial complex to produce reactive oxygen species (ROS). From a physiologic perspective, ROS can be both beneficial and harmful, for example, by promoting oxidative stress, which can damage cells (oxidative stress is discussed in the next section). The relationship between hypoxia and inflammation has been linked to inflammatory bowel disease, certain cancers, and infection. Ongoing research seeks to clarify how tumors adapt to low oxygen levels, including angiogenesis, increasing glucose consumption, and promoting the metabolic state of glycolysis.

(A) Consequences of decreased oxygen delivery or ischemia with decreased adenosine triphosphate (ATP). The structural and physiologic changes are reversible if oxygen is delivered quickly. Significant decreases in ATP result in cell death, mostly by necrosis. (B) Mitochondrial damage can result in changes in membrane permeability, loss of membrane potential, and decrease in ATP concentration. Between the outer and inner membranes of the mitochondria are proteins that can activate the cell's suicide pathways, called apoptosis. (C) Calcium ions are critical mediators of cell injury. Calcium ions (Ca++) are usually maintained at low concentrations in the cell's cytoplasm; thus ischemia and certain toxins can initially cause an increase in the release of Ca++ from intracellular stores and later an increased movement (influx) across the plasma membrane. (Adapted from Kumar V, Abbas AK, Aster JC. Robbins & Cotran pathophysiologic basis of disease, 9th edition. St. Louis: Saunders; 2014.)
Part A is a flow diagram. The first stage in the flow is obstruction or cessation of blood flow, which leads to ischemia, which leads to decreased mitochondrial oxygenation, which results in severe vacuolization of mitochondria or decreased A T P. Decreased A T P can result in two sequences. Sequence 1 comprises four stages. Stage 1. Decreased sodium ion pump. Stage 2. Increased intracellular sodium ions, increased extracellular potassium ions, and increased intracellular calcium ions. Stage 3. Water. Stage 4. Acute cellular swelling. The first three stages of sequence 1 can also lead to dilation of endoplasmic reticulum, resulting in detachment of ribosomes, leading to reduced protein synthesis and lipid deposition. Sequence 2 is as follows: increased anaerobic glycolysis, decreased glycogen, increased lactase, decreased p H, and nuclear chromatin clumping. Part B is a cross-sectional illustration of a mitochondrion, with decreased A T P, which releases hydrogen ions, resulting in altered membrane permeability, loss of membrane potential, inability to make A T P, and necrosis. Pro-apoptotic proteins result in apoptosis. Part C is a cross-sectional illustration of a cell superimposed with a flow diagram. Calcium ions enter the cell and combine with calcium-ion rich mitochondria and smooth endoplasmic reticulum, resulting in increased cytosolic calcium ions. Increased cytosolic calcium ions result in calcium ions and cellular enzyme activities. Cellular enzyme activities activate A T Pase, phospholipases, proteases, and endonuclease. Phospholipases and proteases result in membrane damage. Endonuclease result in nucleus damage. A T Pase and mitochondrial permeability changes result in reduced A T P.
Arteriosclerosis (narrowing of blood vessels) and thrombus (blood clots within vessels) can result in localized tissue ischemia. Progressive hypoxia, caused by gradual arterial narrowing, is better tolerated than the acute anoxia (total lack of oxygen) caused by an acute obstruction, or a thrombus. An acute obstruction in a coronary artery can result in a rapidly evolving myocardial infarction (“heart attack”) if the blood supply is not restored. Irreversible myocardial cell death, with loss of heart function, will follow. Gradual onset of ischemia, however, usually results in myocardial adaptation. Myocardial infarction and stroke are frequent causes of mortality in the United States and generally result from atherosclerosis and consequent ischemic injury.3
Cellular responses to hypoxic injury occur rapidly. Within 1 minute after the blood supply to the myocardium is interrupted, the heart becomes pale and dysfunctional and unable to contract normally. Within 3 to 5 minutes, mitochondrial compromise occurs, resulting in insufficient ATP production. At this point, the compromised portion of the myocardium ceases to contract. The abrupt lack of contraction is caused by a rapid decrease in mitochondrial phosphorylation, which results in insufficient ATP production. Lack of ATP leads to an increase in anaerobic metabolism, which generates ATP from glycogen when there is insufficient oxygen. When glycogen stores are depleted, even anaerobic metabolism ceases.
Ischemia-induced reduction in ATP levels causes a failure of the plasma membrane's sodium–potassium (Na+-K+) pump and sodium–calcium (Na+-Ca++) exchange mechanisms. Sodium and calcium influx into and accumulate in the cell. Potassium (K+) diffuses out of the cell. Without the pump mechanism, sodium and water can freely enter the cell resulting in cellular swelling and dilation of the ER. With dilation, ribosomes detach from the rough ER, reducing protein synthesis. If hypoxia persists, the entire cell becomes markedly swollen. These disruptions are reversible if oxygen (O2) is restored. If oxygen is not restored, vacuolation (formation of vacuoles or cytoplasmic small cavities) occurs within the cytoplasm. The damaged outer membrane causes lysosomes to swell; marked swelling occurs to the mitochondria. With continued hypoxia, cell death rapidly follows as calcium accumulates within the cell, essential metabolic processes cease, and cell membranes become dysfunctional (see Fig. 2.8C). Influx of calcium into the cell activates enzymes that trigger apoptosis. Restoration of blood flow and oxygen can actually result in additional injury known as ischemia–reperfusion injury.
Ischemia–Reperfusion Injury
Restoration of blood flow and oxygen to ischemic tissues can increase recovery of cells reversibly injured, but paradoxically result in additional injury known as ischemia–reperfusion injury (reperfusion [reoxygenation] injury) and cause cell death (Fig. 2.9). Reperfusion is a serious complication and an important mechanism of injury in instances of tissue transplantation and other ischemic syndromes (e.g., hepatic, intestinal, renal). Several mechanisms are proposed for reperfusion injury, including the following:
- • Oxidative stress: Reoxygenation induces oxidative stress by generating ROS and nitrogen species. Reactive oxygen intermediates include hydroxyl radical (OH−), superoxide radical anion (O2−), nitric oxide-derived peroxynitrite (ONOO−), and hydrogen peroxide (H2O2), and all have been shown to increase within minutes of reperfusion. They cause damage to the myocytes by altering membrane proteins and phospholipids.1
- • Nitrogen-based free radicals present mostly in the form of nitric oxide (NO) and are generated by endothelial cells, macrophages, neurons, and other cells. The radicals further damage the already compromised membrane and facilitate calcium overload within the mitochondria. Additionally, reperfusion injury promotes proinflammatory neutrophil adhesion to the endothelium where they release toxic oxidants and harmful proteases. Antioxidant agents, such as vitamin C and vitamin E, reverse neutrophil adhesion. They also reverse neutrophil-mediated reperfusion injury in cardiac muscle.4,5
- • Increased intracellular calcium concentration: Intracellular and mitochondrial calcium accumulate within the cell during acute ischemia. Reperfusion results in even more calcium influx because of damaged cell membranes and ROS-mediated injury to the sarcoplasmic reticulum. The increased calcium enhances mitochondrial permeability; damaged mitochondria have decreased or ceased production of ATP.
- • Inflammation: Ischemic injury promotes inflammation. Dead cells stimulate immune cells to release cytokine-mediated danger signals, thus initiating an inflammatory response.
- • Complement activation: Complement activation may exacerbate microvascular damage that has occurred secondary to reperfusion injury.1
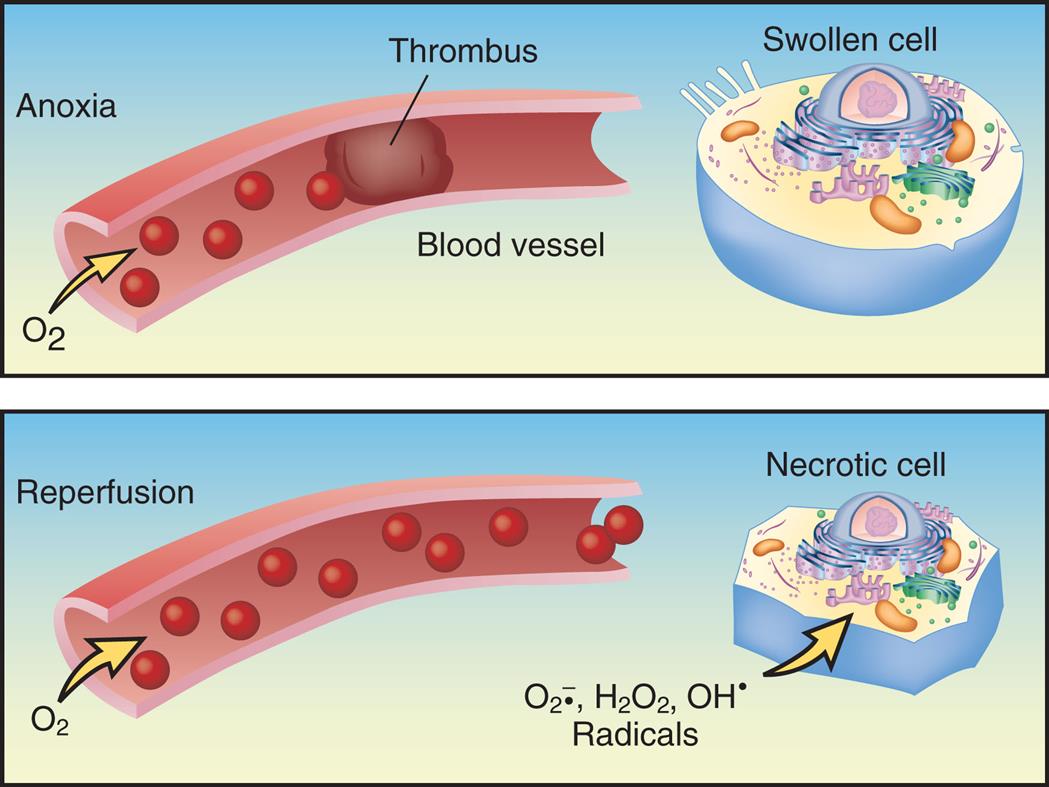
Without oxygen, or in anoxia, the cells display hypoxic injury and become swollen. With reoxygenation, risk of reperfusion injury increases because of the formation of reactive oxygen radicals that can cause cell necrosis. (Redrawn from Damjanov I. Pathology for the health professions, 3rd edition. St Louis: Saunders; 2006.)
A two-part illustration demonstrates anoxia and reperfusion. The panel for anoxia, at the top, shows a thrombus blocking the passage of oxygen through the blood vessel. An accompanying cutaway diagram shows a swollen cell. The panel for reperfusion, at the bottom, shows oxygen flowing freely through the blood vessel. An accompanying cutaway diagram shows a necrotic cell with radicals: O 2 anions, H 2 O 2, and O H.
Free Radicals and Reactive Oxygen Species—Oxidative Stress
Free radicals are an important mechanism of cellular injury, especially injury caused by ROS. This form of injury is called oxidative stress. Reactive oxygen species (ROS) are reactive molecules from molecular oxygen formed as a natural oxidant species in cells during mitochondrial respiration and energy generation. The intracellular sources of oxidants are numerous and include (1) cellular organelles with mitochondria (thought to be the largest contributor), ER (particularly during endoplasmic stress), and peroxisomes; (2) nicotinamide adenine dinucleotide phosphate (NADPH) oxidases (NOX enzymes); and (3) other enzymes (Fig. 2.10). From oxidative phosphorylation, mitochondria utilize oxygen to generate ATP from organic fuel molecules and, in the process, produce ROS. Oxidative stress is caused by an increase in different reactive species, depletion of antioxidant defense, or both. Oxidative stress results in detrimental oxidation of different molecules, including proteins, lipids, nucleic acids, and others. Oxidative stress can activate several intracellular signaling pathways because ROS can regulate enzymes and transcription factors. This process is an important mechanism of cell damage in many conditions, including cell injury, cancer, certain degenerative diseases (e.g., Alzheimer disease), and aging.
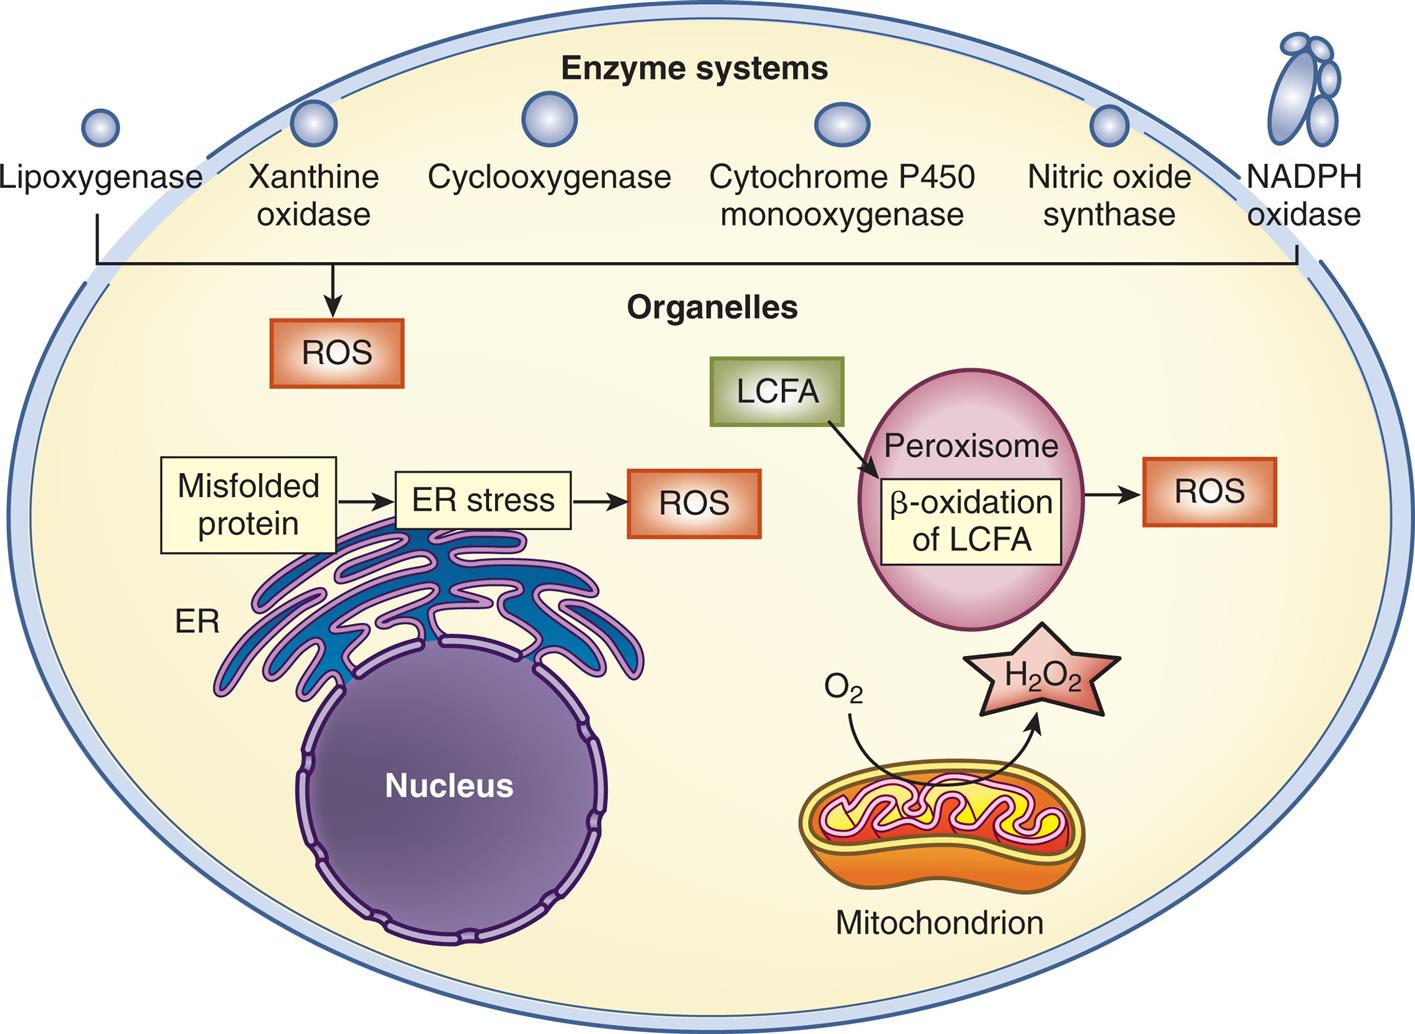
The intracellular sources of reactive oxygen species (ROS) include some organelles: mitochondria, endoplasmic reticulum (ER) (particularly ER stress), and peroxisomes (metabolizing long-chain fatty acids [LCFAs]). As part of the enzymatic reaction cycles, various enzymes generate ROS, including oxidases and oxygenases. H2O2, Hydrogen peroxide; NADPH, nicotinamide adenine dinucleotide phosphate. (Adapted from Homstrom KM, Finkel T. Cellular mechanisms and physiological consequences of redoxdependent signalling. Nature Reviews, 2014;15(6):411–421.)
An illustration of a cell shows enzyme systems, organelles, nucleus, peroxisome, and mitochondrion. Mitochondrion utilizes O 2 to release H 2 O 2. Misfolded protein results in E R stress, which results in R O S. L C F A undergoes beta-oxidation in peroxisome, resulting in R O S. R O S comprises lipoxygenase, xanthine oxidase, cyclooxygenase, cytochrome p 450 monooxygenase, nitric oxide synthase, and N A D P H Oxidase.
A free radical is an electrically uncharged atom, or group of atoms, which has an unpaired electron. Having one unpaired electron makes the molecule unstable; the molecule becomes stabilized either by donating or by accepting an electron from another molecule. The free radical has the potential to form a damaging chemical bond with proteins, lipids, and carbohydrates found within the cell membrane. Free radicals are highly reactive. They have low chemical specificity—that is, they can react with most molecules in their proximity. Reactions involving free radicals are difficult to control, and they initiate chain reactions. Free radicals are generated in a variety of conditions, including chemical and radiation injury, ischemia–reperfusion injury, cellular aging, and microbial destruction by phagocytes.
Free radicals are generated within cells by a number of mechanisms. These mechanisms are as follows:
- 1. Reduction–oxidative reactions (redox reactions): An oxidative-reduction reaction is a type of biochemical reaction involving the transfer of elections between two species (molecule, atom, or ion). A species may either gain or lose an electron. All biologic membranes contain redox systems, which serve to support cellular activity (Fig. 2.11).
- 2. Absorption of extreme energy sources (ultraviolet light, radiation) produces free radicals.
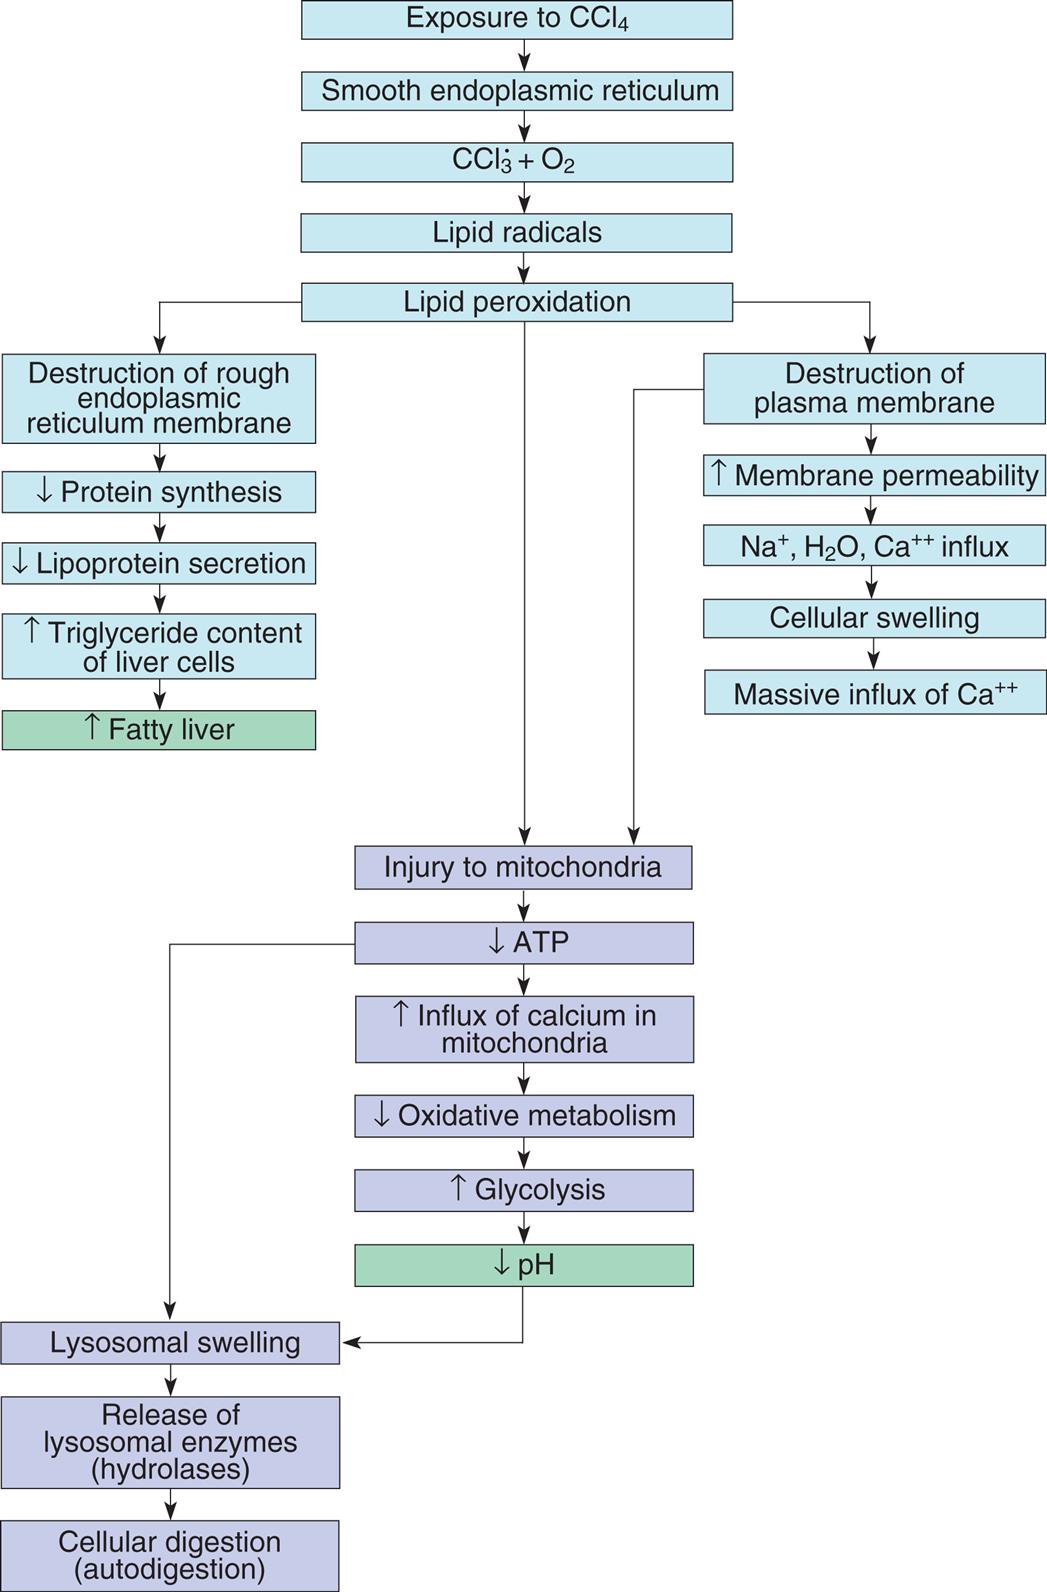
- 3. Enzymatic metabolism of exogenous chemicals or drugs: Many exogenous (outside the body) substances within the environment readily generate free radicals. As an example, CCL3, a byproduct of carbon tetrachloride [CCl4]) (Fig. 2.12), forms free radicals known to damage the liver, predisposing this organ to cancer. Accordingly, CCL4 is classified by the International Agency for Research on Cancer (IARC; Group 2B) as a possible carcinogenic and by the Environmental Protection Agency (EPA) as a probable human carcinogen. Many reported cases of CCL4 toxicity are associated with drinking alcohol.
- 4. Transition metals (iron and copper) donate or accept free electrons during intracellular reactions, generating free radicals in the process. As an example, the Fenton reaction, involving iron and H2O2, produces the potentially damaging hydroxyl radical and higher oxidation states of the iron. It has been implicated in iron accumulation disease.
- 5. NO, a colorless gas, acts as an intermediate in reactions involving endothelial cells, neurons, macrophages, and other cell types. NO can act as a free radical and convert to highly reactive compounds, including peroxynitrite anion (ONOO−), nitrogen dioxide (NO2), and nitrate (NO3). Table 2.3 describes the most significant free radicals.
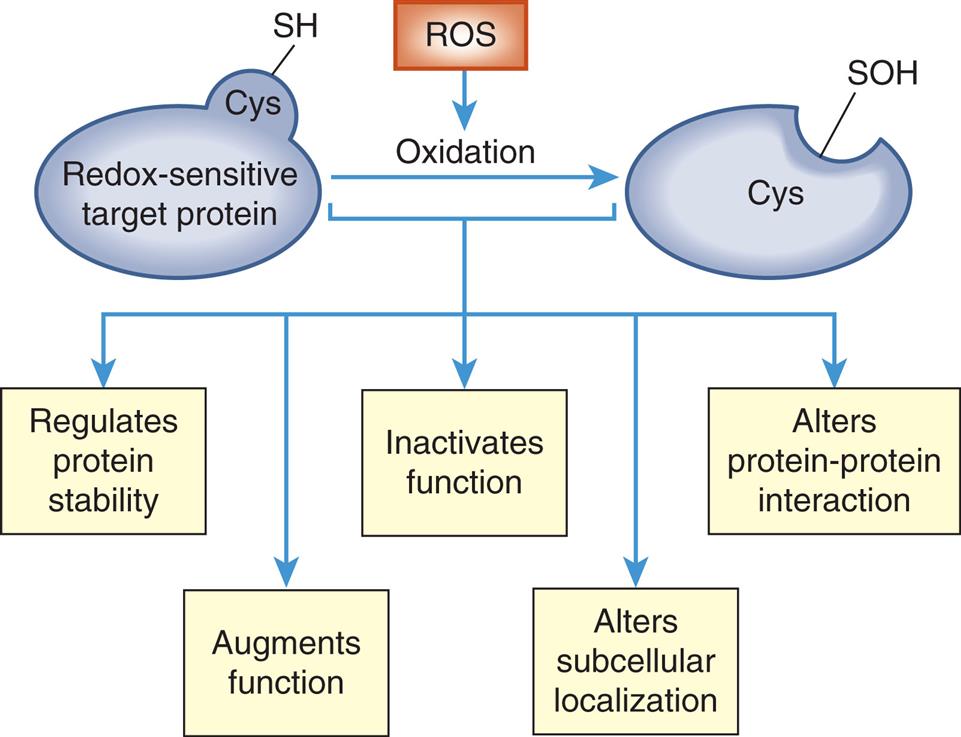
The oxidation and reduction (redox) of sensitive targets or proteins with cysteine (Cys) residues provide a mechanism to rapidly and reversibly alter protein function. Cys residues can function as redox-dependent “switches.” Oxidation of Cys residues (SH [thiol]) to SOH (sulfenic acid) leads to alterations in the redox-sensitive target that result in many effects on protein stability, activity, and protein-protein interaction. (Adapted from Homstrom KM, Finkel T. Cellular mechanisms and physiological consequences of redoxdependent signalling. Nature Reviews, 2014;15(6):411–421.)
A flow diagram represents redox-dependent signaling. Redox-sensitive target protein with cys S H undergoes oxidation from R O S and results in cys S O H. The process regulates protein stability, augments function, inactivates function, alters subcellular localization, and alters protein-protein interaction.
ATP, Adenosine triphosphate.
A flow diagram of five connected subparts illustrates the effect of chemical injury induced by carbon tetrachloride in liver cells. Subpart 1. Exposure to C C l 4. Smooth endoplasmic reticulum. C C l 3 plus O 2. Lipid radicals. Lipid peroxidation. Lipid peroxidation can lead to Subparts 2, 3, and 4. Subpart 2. Destruction of rough endoplasmic reticulum membrane. Reduced protein synthesis. Reduced lipoprotein secretion. Increased triglyceride content of liver cells. Increased fatty liver. Subpart 3. Destruction of plasma membrane. Increased membrane permeability. Influx of N a ions, H 2 O, and C a ions. Cellular swelling. Massive influx of C a ions. Destruction of plasma membrane also leads to Subpart 4. Subpart 4. Injury to mitochondria. Reduced A T P. Increased influx of calcium in mitochondria. Reduced oxidative metabolism. Increased glycolysis. Reduced p H. Decreased A T P and decreased p H lead to Subpart 5. Subpart 5. Lysosomal swelling. Release of lysosomal enzymes (hydrolases). Cellular digestion (autodigestion).
Table 2.3


Data from Cotran RS, et al. Robbins pathologic basis of disease, 6th edition. Philadelphia: Saunders; 1999.
Free radicals also cause several damaging effects, such as the following:
- 1. Lipid peroxidation—the destruction of polyunsaturated lipids, which leads to membrane damage and increased permeability. This same process causes fats to become rancid.
- 2. Protein alteration—a process whereby polypeptide chains become fragmented, leading to protein loss, protein misfolding, and alters protein–protein interaction.
- 3. DNA damage—results in mutations (Fig. 2.13 and Chapter 4).
- 4. Mitochondrial effects—mitochondria are organelles that generate ATP. They can become damaged by ROS compromising available energy for the cell. Increases in intracellular calcium also damage mitochondria (see Fig. 2.8A and B). Box 2.1 summarizes the major types of mitochondrial damage. Cell damage from ROS can extend to neighboring cells.
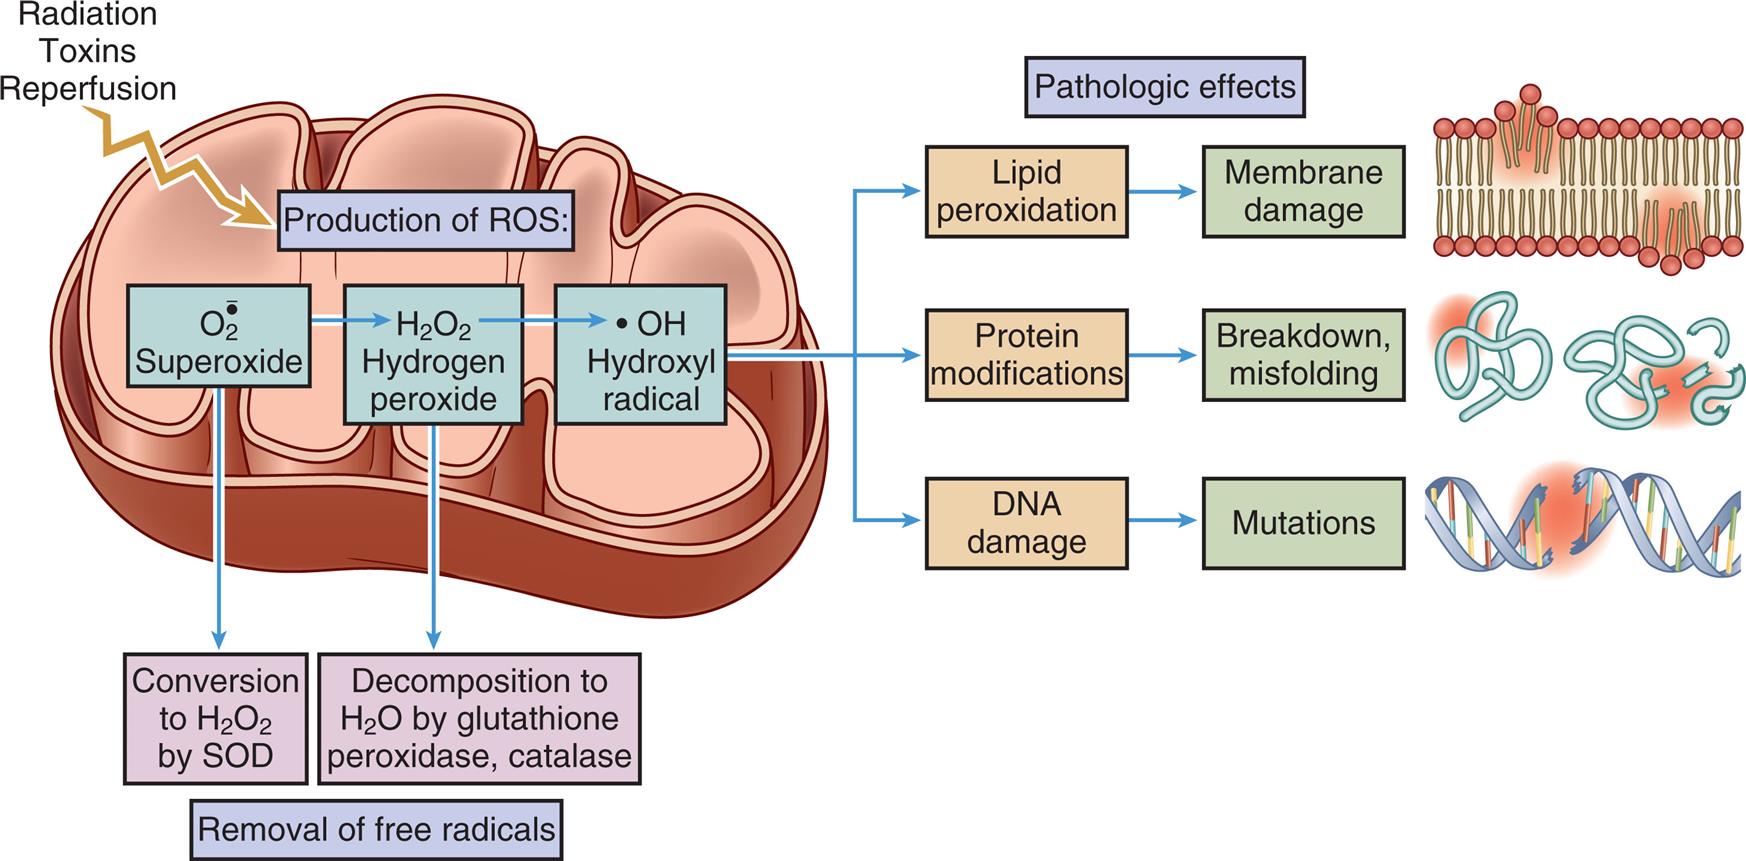
The production of reactive oxygen species (ROS) can be initiated by many cell stressors, such as radiation, toxins, and reperfusion of oxygen. Free radicals are removed by normal decay and enzymatic systems. ROS accumulates in cells because of insufficient removal or excess production leading to cell injury, including lipid peroxidation, protein modifications, and DNA damage or mutations. (Adapted from Kumar V, et al., eds. Robbins and Cotran pathologic basis of disease, 10th edition. Philadelphia: Elsevier; 2020.)
A cross-sectional illustration of a mitochondrion and a superimposed flow diagram demonstrate the role of reactive oxygen species in cell injury. Radiation, toxins, and reperfusion occur in the mitochondrion, producing R O S. O 2 superoxide results in conversion to H 2 O 2 by S O D and H 2 O 2, hydrogen peroxide. H 2 O 2, hydrogen peroxide results in decomposition to H 2 O by glutathione peroxidase, catalase. Conversion to H 2 O 2 by S O D and decomposition to H 2 O by glutathione peroxidase, catalase result in removal of free radicals. H 2 O 2, hydrogen peroxide results in O H, hydroxyl radical. The pathologic effects of hydroxyl radicals include lipid peroxidation, protein modifications, and D N A damage. Lipid peroxidation results in membrane damage. Protein modifications result in breakdown and misfolding. D N A damage results in mutations.
The toxicity of certain drugs and chemicals can be attributed to free radicals. The drug/chemical may be converted to a free radical, or it may generate oxygen-derived metabolites. Free radicals have been either directly or indirectly linked with a growing number of diseases and disorders (see Box 2.2). The body has various mechanisms to eliminate free radicals. As an example, the oxygen free radical superoxide may spontaneously decay into oxygen and hydrogen peroxide. Table 2.4 summarizes other methods that contribute to inactivation or termination of free radicals.
Table 2.4
| Method | Process |
|---|---|
| Antioxidants | Endogenous or exogenous; either blocks synthesis or inactivates (e.g., scavenges) free radicals; includes vitamin E, vitamin C, cysteine, glutathione, albumin, ceruloplasmin, transferrin, γ-lipoacid, others |
| Enzymes | Superoxide dismutase,a which converts superoxide to hydrogen peroxide (H2O2); catalasea (in peroxisomes) decomposes H2O2; glutathione peroxidasea decomposes hydroxyl radical (OH−) and H2O2 |
aThese enzymes are important in modulating the cellular destructive effects of free radicals; also released in inflammation.
Chemical or Toxic Injury
Humans are exposed to thousands of chemicals that have insufficient toxicologic data.6 Time, cost, and an interest in reducing animal testing dictate the need to develop new methods for toxicity testing. To meet public health concerns, many agencies have collaborated to investigate how chemicals interact with biologic systems. Advances in molecular and systems biology, computational toxicology, and bioinformatics have aided investigators’ efforts. Mechanisms of cell stress from chemical agents include oxidative stress, ER stress, heat shock response, DNA damage response, mental stress, inflammation, and osmotic stress (sudden change in solute concentration). Chemicals are being classified under these types of cell stress mechanisms.
Xenobiotics (from Greek xenos, “foreign”; bios, “life”) are compounds and chemicals that have toxic, mutagenic, or carcinogenic properties (Fig. 2.14). A few of these compounds include pesticides, antibiotics, steroids, and biomedical waste compounds.7 Some of these chemicals are found in the human diet, for example, the fungal mycotoxin, aflatoxin B1. Many xenobiotics are hepatotoxic (toxic to the liver). The liver is the initial site of contact for many ingested compounds—xenobiotics, drugs, and alcohol—predisposing this organ to chemically induced injury. Once absorbed by the GI tract, the liver is the initial site of contact. This dynamic is called first-pass effect. A frequent cause for withdrawing medications from the market is hepatotoxicity. Herbal products are less subject to regulation by the U.S. Food and Drug Administration (FDA). There are several classes of dietary, weight reduction, and body building supplements that have compounds that are listed as potentially hepatotoxic. Several marketed herbal medicines, such as ma huang (ephedra), kava Huang, Lipokinetix, and Hydroxycut, have been identified as harmful by the FDA and other health authorities, and subsequently, the FDA has requested these products be removed.8
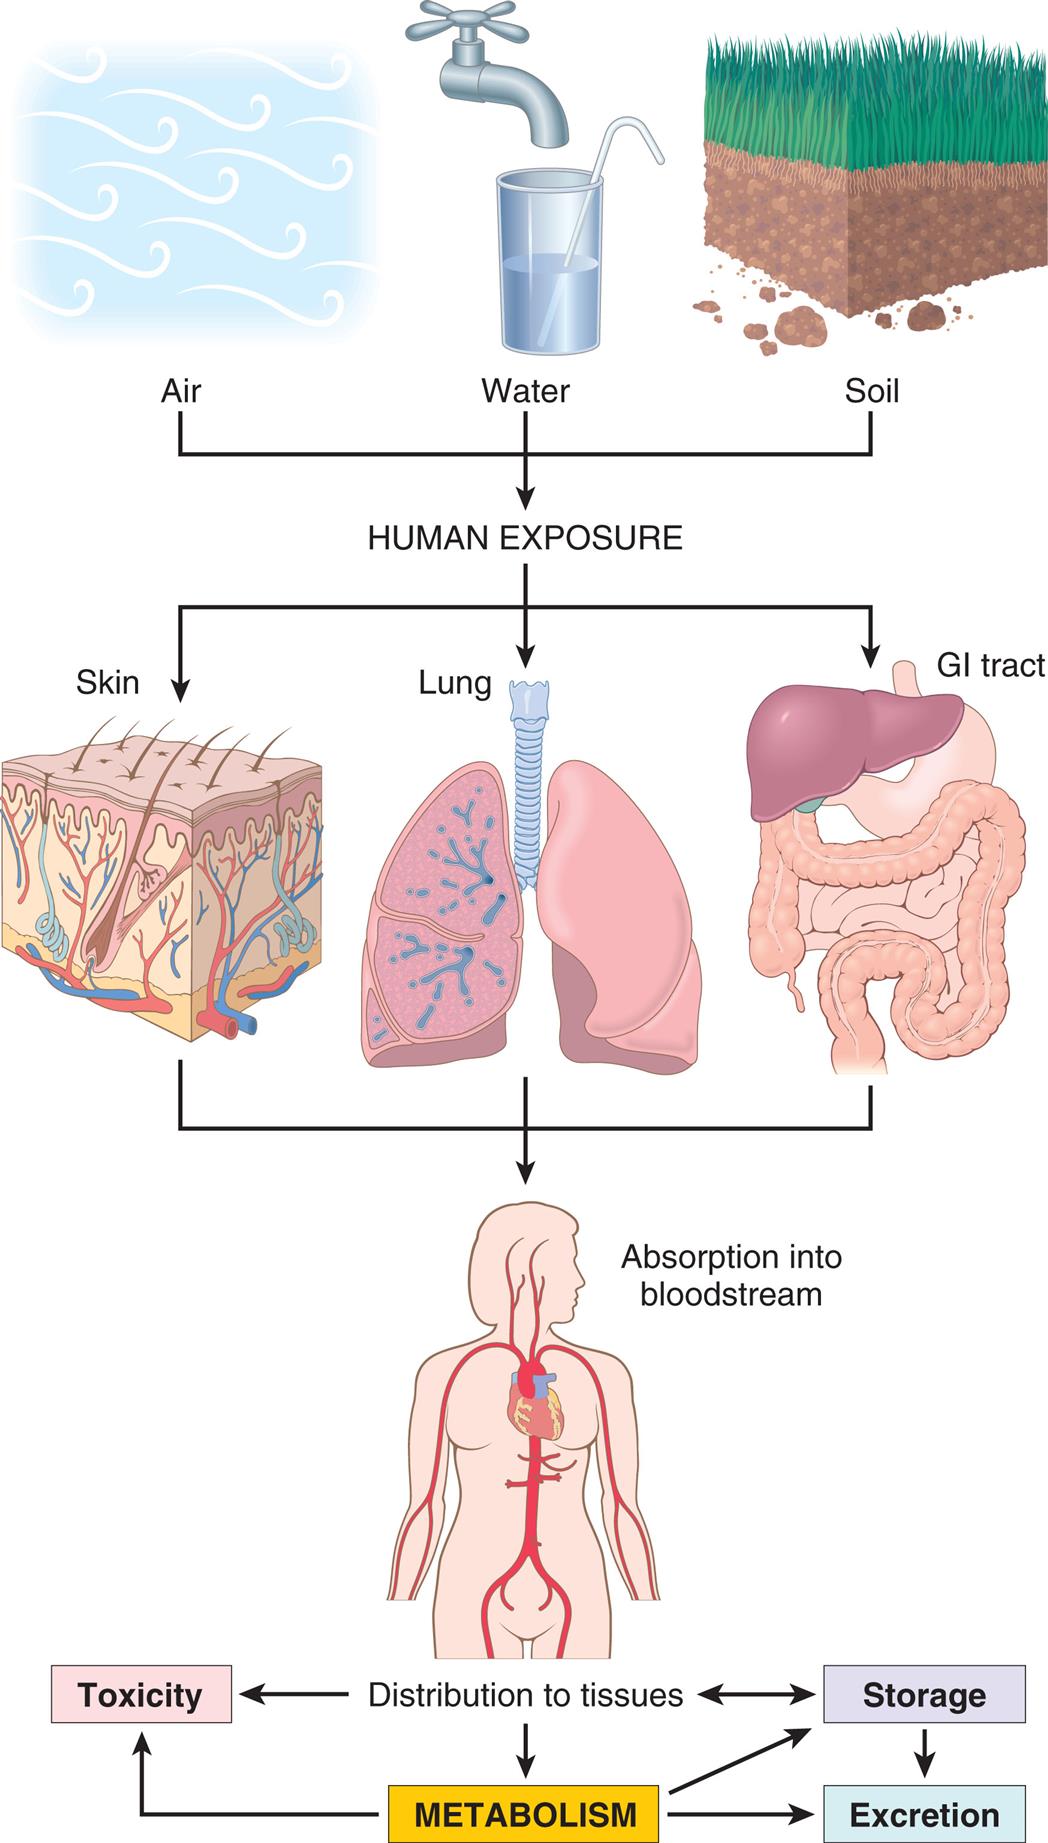
In the body, the pollutants may act at the site of absorption but are generally transported through the bloodstream to various organs where they can be stored or metabolized. Metabolism of xenobiotics may result in the formation of water-soluble compounds that are excreted, or a toxic metabolite may be created by activation of the agent. (From Kumar V, et al., eds. Robbins and Cotran pathologic basis of disease, 10th edition. Philadelphia: Elsevier; 2020:407.)
A series of diagrams illustrates the metabolism of xenobiotics. Human exposure to air, water, and soil affects skin, lung, and G I tract, leading to absorption into bloodstream and subsequent distribution to tissues. Distribution to tissues results in toxicity, metabolism, and storage. Metabolism leads to toxicity, storage, and excretion. Storage leads to distributions to tissues and excretion.
Many chemical compounds used in household cleaning, insect control, outdoor maintenance, or chemical manufacturing are potential carcinogens. Many such agents are absorbed in the body through the skin or by inhalation; ubiquitous in the environment, some agents have been linked with liver and other organ damage. The extent of chemically induced liver injury varies from minor liver injury to acute liver failure, cirrhosis, and liver cancer.9,10
Hepatic detoxification occurs through enzyme-mediated biotransformation and antioxidant systems. Biotransformation is a process whereby enzymatic reactions convert one chemical into a less toxic or nontoxic compound. The liver has the highest supply of biotransformation enzymes of all organs and plays a key role in protecting the host from chemical toxicity. Fig. 2.15 provides a summary of chemically induced liver injury.
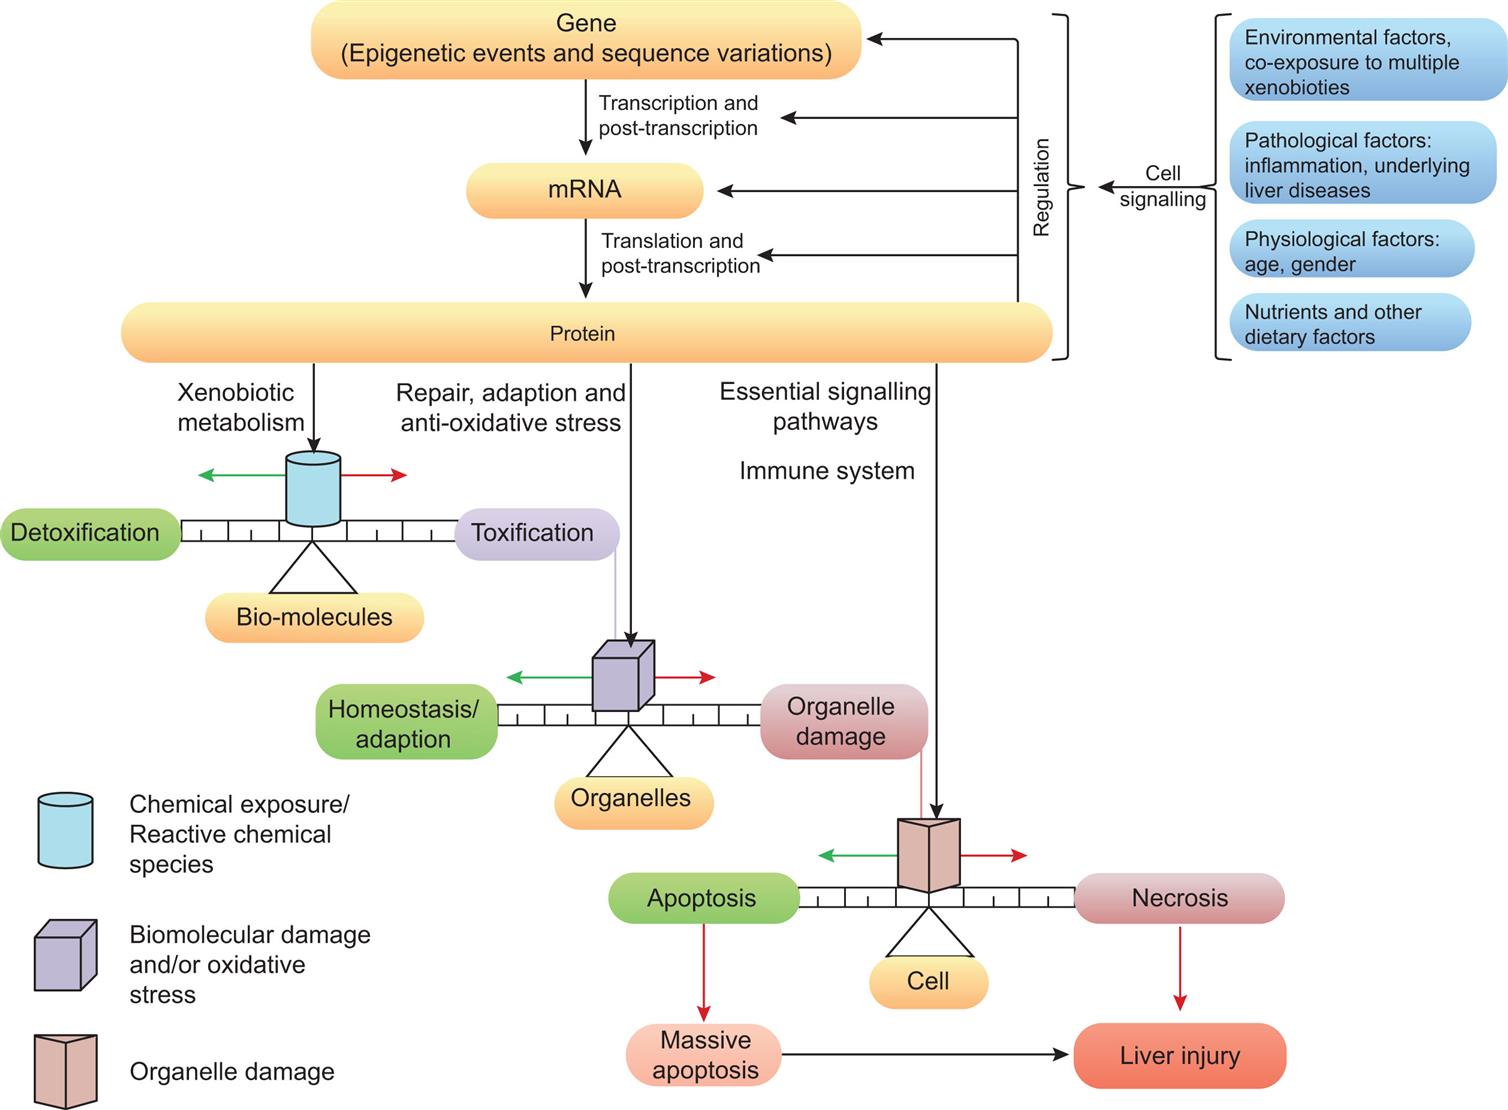
Certain chemicals can form toxic or chemically reactive metabolites. The risk of liver injury also can increase with increasing doses of a toxicant. Xenobiotic enzyme induction can lead to altered metabolism of chemicals, and drugs can either inhibit or induce drug-metabolizing enzymes. These changes can lead to greater toxicity. The dose at the site of action is controlled by phase I to III xenobiotic metabolites, and metabolizing enzymes are encoded by numerous different genes. Additionally, all aspects of xenobiotic metabolism are regulated by certain transcription factors (cellular mediators of gene regulation). Overall, the extent of cell damage depends on the balance between reactive chemical species and protective responses aimed at decreasing oxidative stress, repairing macromolecular damage, or preserving cell health by inducing apoptosis or cell death. Significant clinical outcomes of chemical-induced liver injury occur with necrosis and the immune response. Covalent binding of reactive metabolites to cellular proteins can produce new antigens (haptens) that initiate autoantibody production and cytotoxic T-cell responses. Necrosis, a form of cell death (see the Cellular Death section), can result from extensive damage to the plasma membrane with altered ion transport, changes of membrane potential, cell swelling, and eventual dissolution. Green arrows are pathways leading to cell recovery; red arrows indicate pathways to cell damage or death; black arrows are pathways leading to chemically induced liver injury. (Adapted from Gu X, Manautou JE. Molecular mechanisms underlying chemical liver injury. Expert Reviews in Molecular Medicine, 2013;14:e4.)
A flow diagram shows the stages in chemical liver injury. Cell signaling is a result of environmental factors, co-exposure to multiple xenobiotics, pathological factors including inflammation, underlying liver diseases, physiological factors: age, gender, and nutrients and other dietary factors. Cell signaling results in regulation of gene, m R N A, and protein in three stages: gene, epigenetic events and sequence variations, through transcription and post-transcription to m R N A, through translation and post-transcription to protein. Protein leads through xenobiotic metabolism to chemical exposure or reactive chemical species in bio-molecules and can result in detoxification or toxification. Protein can also lead through repair, adaptation, and anti-oxidative stress to biomolecular damage and or oxidative stress in organelles and can result in homeostasis or adaption or organelle damage. Protein can also lead through essential signaling pathways and immune system to organelle damage in cell and can result apoptosis or necrosis. Apoptosis leads to massive apoptosis. Necrosis leads to liver injury. Massive apoptosis also leads to liver injury.
Antioxidants are molecules that inhibit the oxidation of other molecules, thereby preventing the formation of free radicals. Antioxidants often terminate a chain reaction, which would otherwise result in free radical formation. Endogenous antioxidants are antioxidants produced by the body. The five most powerful endogenous antioxidants are superoxide dismutase (SOD), alpha lipoic acid (ALA), catalase, coenzyme Q 10 (CoQ10), and glutathione peroxidase (GPX). Exogenous antioxidants are antioxidants that originate from outside the body, typically from dietary sources, such as vitamin C. Foods rich in antioxidants are appropriately encouraged as part of a healthy diet.
Chemical Agents Including Drugs
Numerous chemical agents cause cellular injury. Minute amounts of some, such as arsenic and cyanide, can rapidly destroy cells and cause death of the individual. Chronic exposure to air pollutants, insecticides, and herbicides can cause cell injury (see Fig. 2.14). Carbon tetrachloride, alcohol, and social drugs can significantly alter cellular function and injure cellular structures. Over-the-counter (OTC) and prescribed drugs are an important cause of cellular injury. The abuse and addiction to opioids, such as heroin, morphine, and fentanyl, and other prescription pain relievers, are a serious global problem that affects all societies. Millions of people abuse opioids worldwide. The issue has become a public health crisis. In the United States, drug overdoses dramatically increased over the last 2 years, with the COVID-19 pandemic as a contributing factor.11 Over the last two decades, deaths related to opioids more than tripled.12
The leading cause of poisoning in children is cosmetics and personal care products in children under 6 years of age, followed by cleaning substances and analgesic medications, including inappropriate administration of OTC preparations containing acetaminophen.13 Social or street drugs are listed in Table 2.5. The use of e-cigarettes or vaping has become one of the leading causes of lung injury. In 2019, there were 6401 e-cigarette exposures, with nearly 45% involving children less than 5 years of age and another 23% in children 6 to 19 years of age. The exposure rate is up from 2018, when the number of e-cigarette exposures was 3142, causing acute lung injuries disproportionally affecting adolescents, children, and young adults. Hence, the Centers for Disease Control and Prevention (CDC) has classified this injury as e-Cigarette or Vaping Product Use-Associated Lung Injury (EVALI).14
Table 2.5
CNS, Central nervous system; HIV, human immunodeficiency virus.
Data from Kumar V, Abbas A, Aster J. Robbins and Cotran pathologic basis of disease, 9th edition. Philadelphia: Saunders; 2015; Nahas G, Sutin K, Bennett WM. Review of marihuana and medicine. New England Journal of Medicine, 2000;343(7):514..
Snakebite: Envenoming
Snakebite envenoming, poisoning by venom from either the bite of a venomous snake or by spraying venom into the victim’s eyes, can have potentially deadly effects.15 Snakes have hollow fangs in their anterior mouth that they use to inject venom into the subcutaneous tissue of their prey. Snake venom is composed primarily of proteins (e.g., metalloproteinases) and other complex substances with enzymatic activity. Available global data show that 4.5 to 5.4 million people per year are bitten by snakes. The majority (>99%) of snakebites in the United States are from pit vipers, with the majority (56.3%) occurring from rattlesnakes.16 The chemistry and resulting cellular levels effects of snake venom can vary between species of snakes, but most pit viper envenomation has little neurotoxic effects. Box 2.3 shows the pathophysiology, clinical manifestations, evaluation, and treatment for snakebite envenoming. Fig. 2.16 presents a step-by-step management approach to snake (crotalid) envenomation.
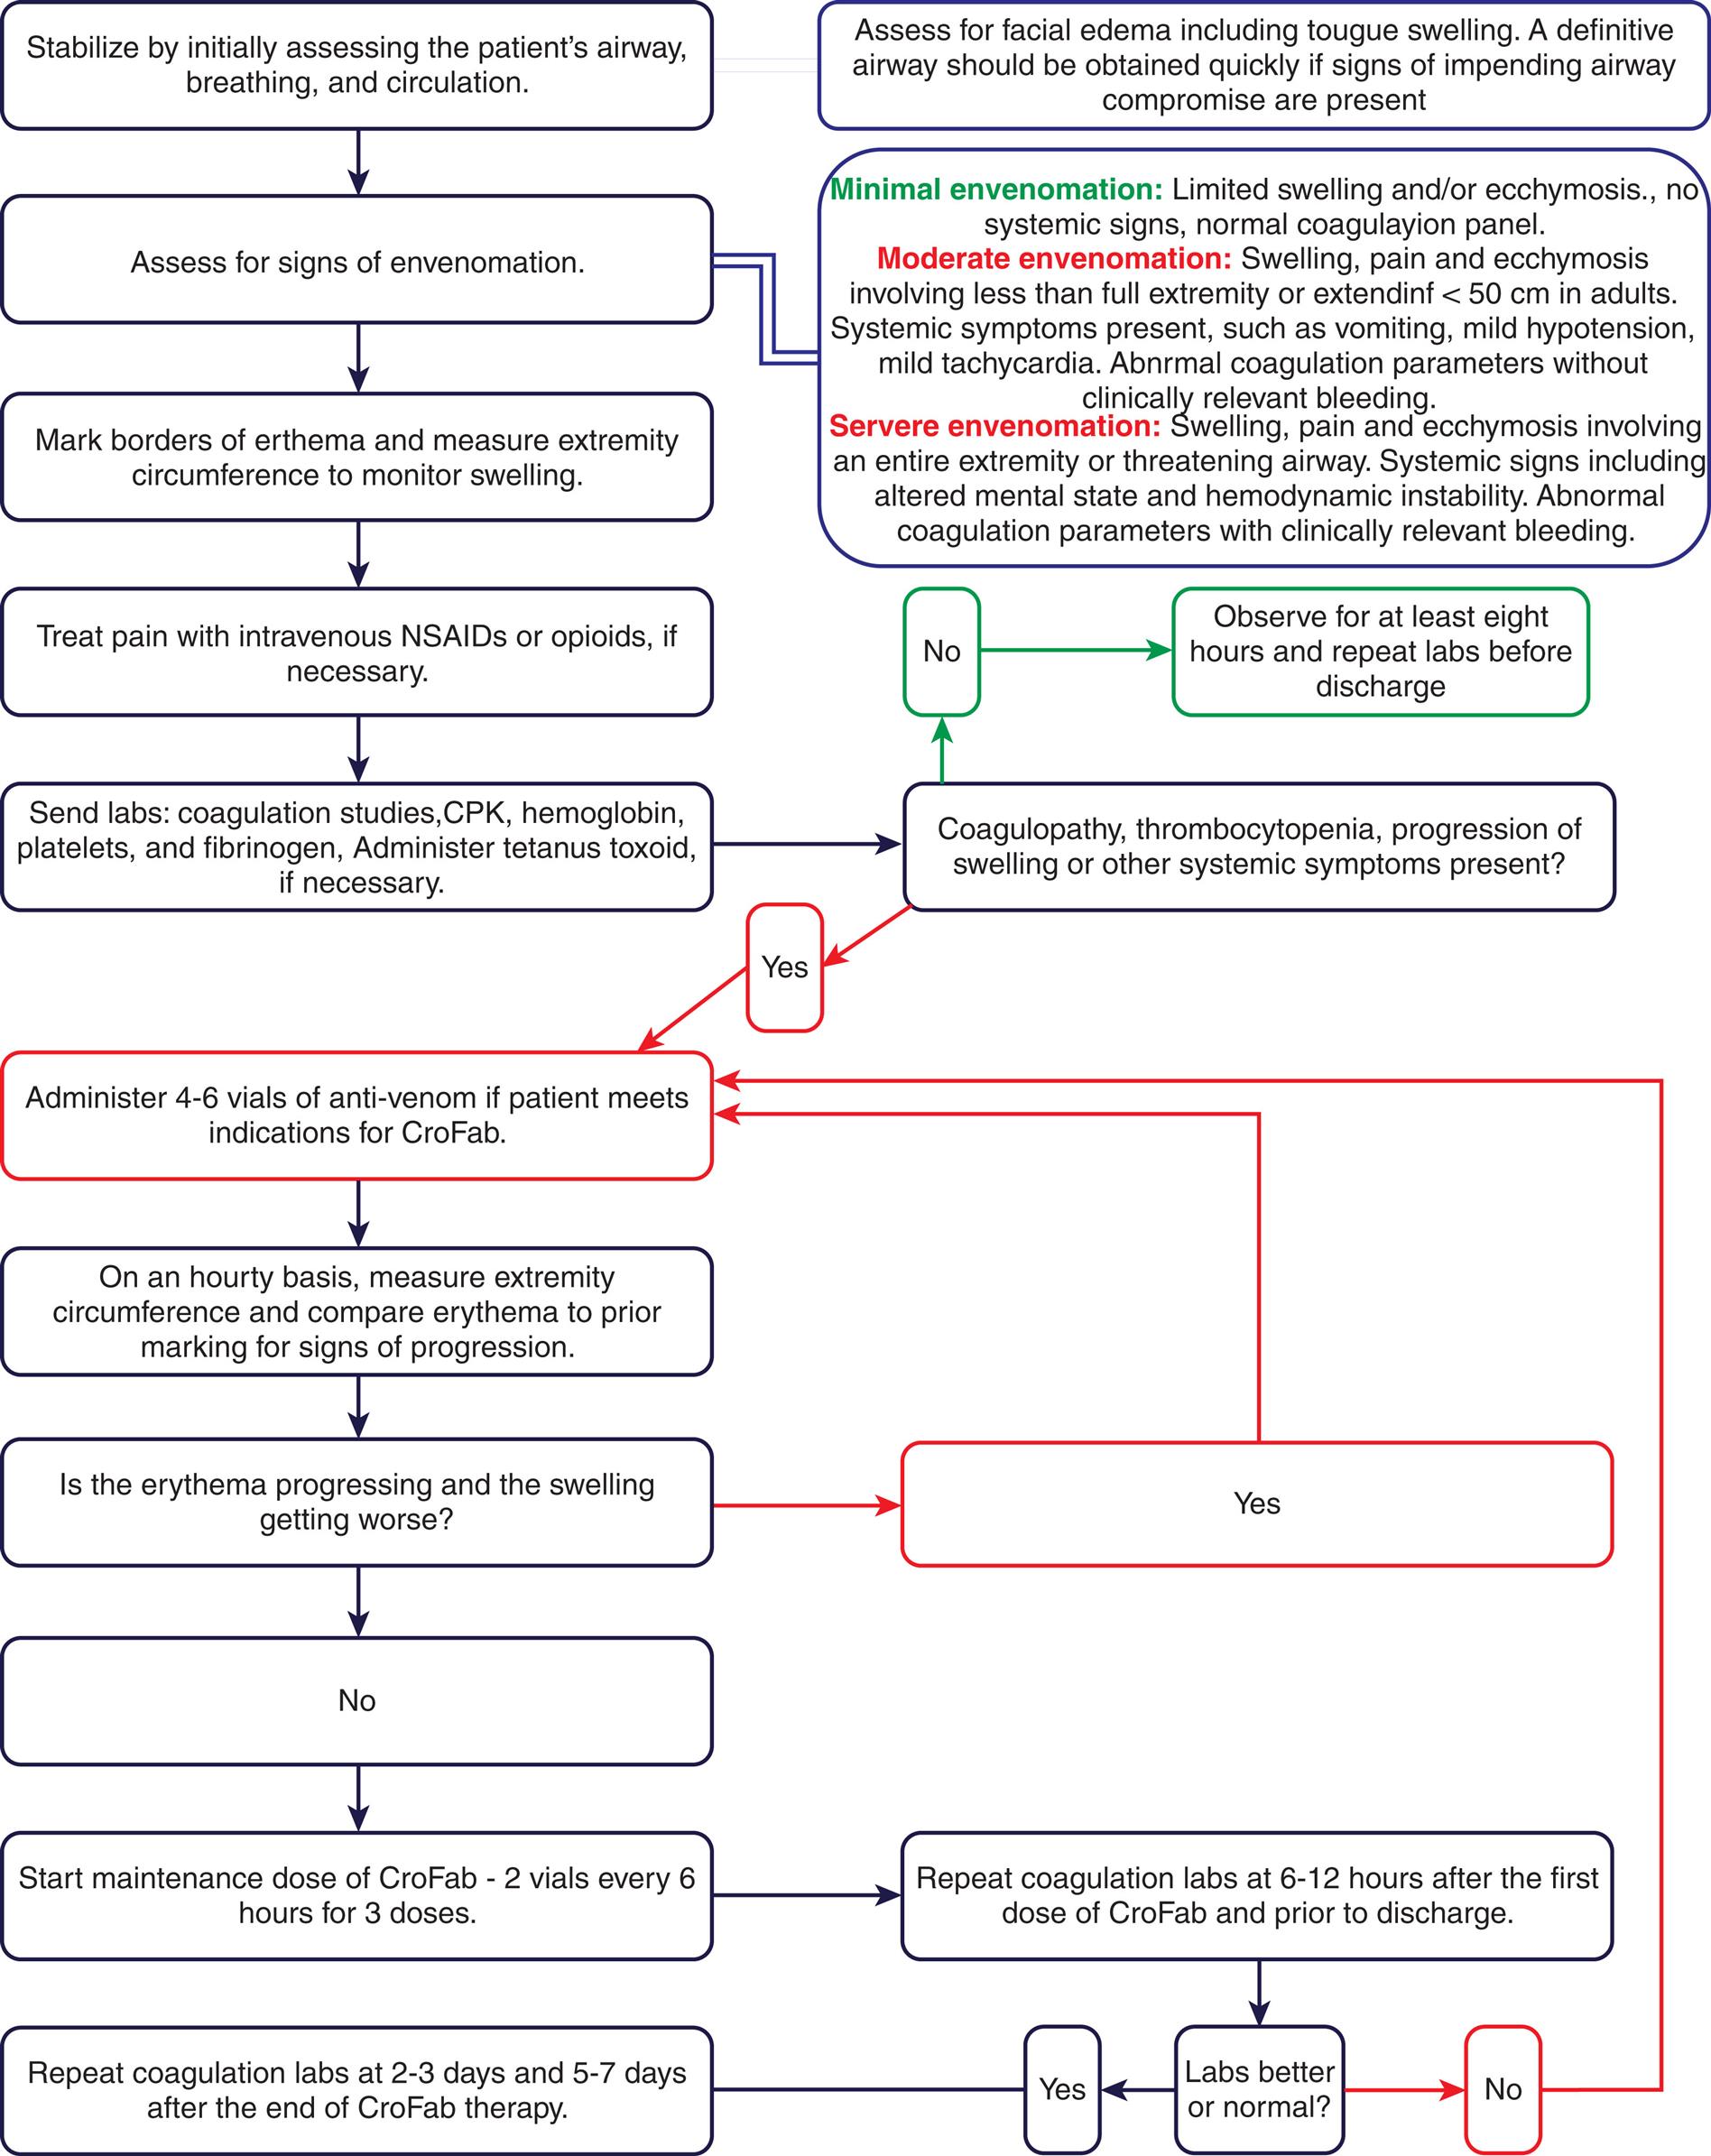
Crotalid venom causes various local, hematologic, neurologic, and system effects requiring a step-by-step approach to treatment. (From Patel V, Kong EL, Hamilton RJ. Rattle snake toxicity. StatPearls [Internet]. Treasure Island, FL: StatPearls; 2021.)
A process diagram represents Algorithm Snake or Crotalid Envenomation Management. The process is as follows. Step 1. Assess for facial edema including tongue swelling. A definitive airway should be obtained quickly if signs of impending airway compromise are present. Step 2. Stabilize by initially assessing the patient’s airway, breathing, and circulation. Step 3. Assess for signs of envenomation. Minimal envenomation: Limited swelling and or ecchymosis., no systemic signs, normal coagulation panel. Moderate envenomation: Swelling, pain and ecchymosis involving less than full extremity or extending less than 50 centimeters in adults. Systemic symptoms present, such as vomiting, mild hypotension, mild tachycardia. Abnormal coagulation parameters without clinically relevant bleeding. Severe envenomation: Swelling, pain and ecchymosis involving an entire extremity or threatening airway. Systemic signs including altered mental status and hemodynamic instability. Abnormal coagulation parameters with clinically relevant bleeding. Step 4. Mark borders of erythema and measure extremity circumference to monitor swelling. Step 5. Treat pain with intravenous N S A I Ds or opioids, if necessary. Step 6. Send labs: coagulation studies, C P K, hemoglobin, platelets, and fibrinogen, Administer tetanus toxoid, if necessary. Step 7. Coagulopathy, thrombocytopenia, progression of swelling or other systemic symptoms present? If No, Observe for at least eight hours and repeat labs before discharge. If Yes: Step 8. Administer 4 to 6 vials of anti-venom if patient meets indications for CroFab. Step 9. On an hourly basis, measure extremity circumference and compare erythema to prior marking for signs of progression. Step 10. Is the erythema progressing and the swelling getting worse? If Yes, Step 8. If No: Step 11. Start maintenance dose of CroFab-2 vials every 6 hours for 3 doses. Step 12. Repeat coagulation labs at 6-12 hours after the first dose of CroFab and prior to discharge. Step 13. Labs better or normal? If No, Step 8. If Yes, Repeat coagulation labs at 2 to 3 days and 5 to 7 days after the end of CroFab therapy.
Common Environmental Toxins
Air Pollution
Ambient fine particle air pollution
The world's largest single environmental health risk is air pollution. Air pollution is contamination of the indoor or outdoor environment by any chemical, physical, or biologic agent that modifies natural characteristics of the atmosphere. Air pollution was the fourth leading risk factor for premature death globally, with nearly 12% of all deaths, and more than 6.67 million in 2019 alone (Fig. 2.17). Early deaths from air pollution were surpassed only by high blood pressure, tobacco use, and poor diet.17 The percentage of Global Deaths attributed to air pollution in 2019 was:
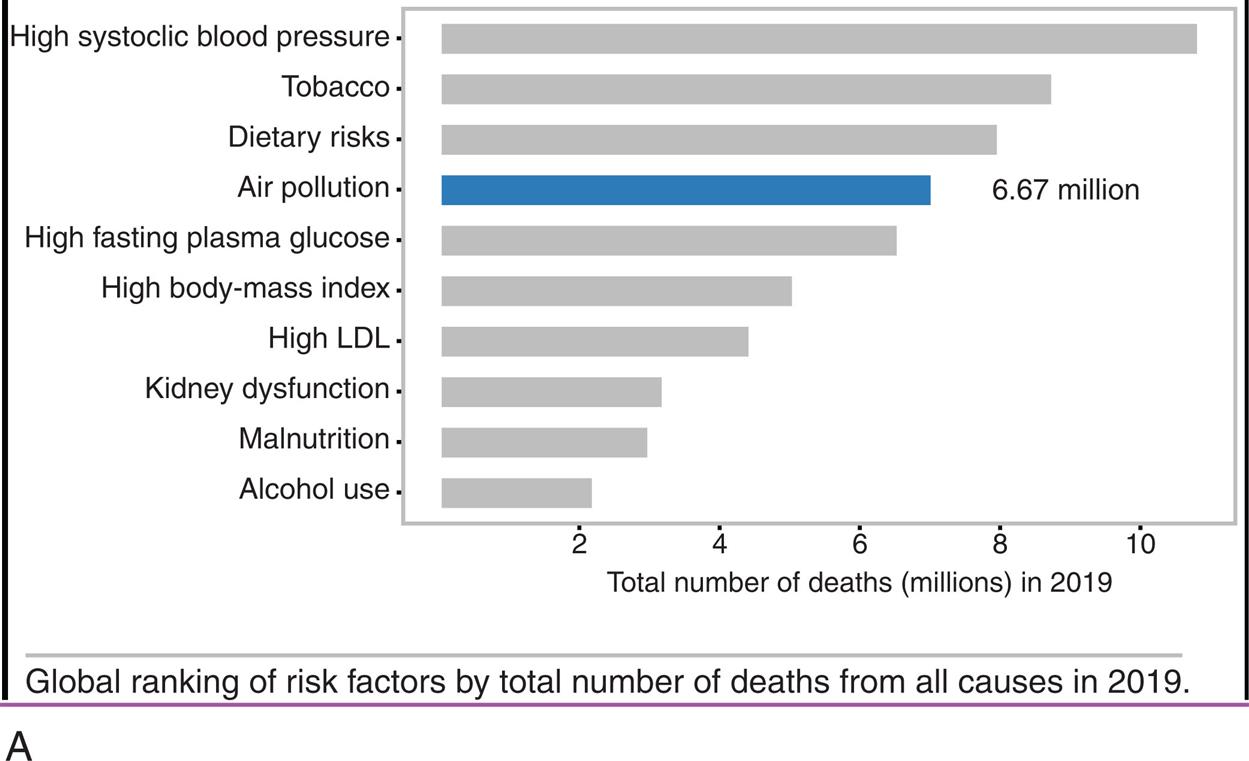
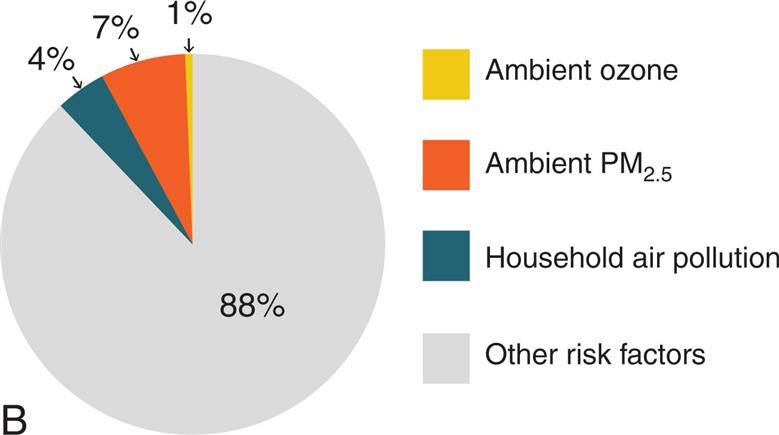
(A) Bar graph showing rankings by total numbers of deaths in 2019. (B) Percentage of global deaths from individual pollutants. (Data from Health Effects Institute. State of Global Air 2020 Report. Data source: Global Burden of Disease Study. IHME; 2020. https://www.stateofglobalair.org/resources.)
Part A is a horizontal bar graph ranking total number deaths in 2019, by cause. Approximate data from the graph are as follows. Dietary risks, 7.5 million. Air pollution, 6.67 million. High fasting plasma glucose, 6.3 million. High body-mass index, 5 million. High L D L, 4.5 million. Kidney dysfunction, 3.2 million. Malnutrition, 3 million. Alcohol use, 2.1 million. Part B is a pie chart showing the distribution of global deaths from individual pollutants. The data from the graph are as follows. Ambient P M sub 2.5, 7 percent; household air pollution, 4 percent; Ambient ozone, 1 percent; Other risk factors, 88 percent.
The EPA has identified the following six pollutants as “criteria” air pollutants: carbon monoxide, lead, nitrogen oxides, photochemical oxidants, ground-level ozone particle pollution known as particulate matter, and sulfur oxides (Figs. 2.18 through 2.20).18Table 2.6 defines each of the criteria pollutants with sources and known human health impacts.
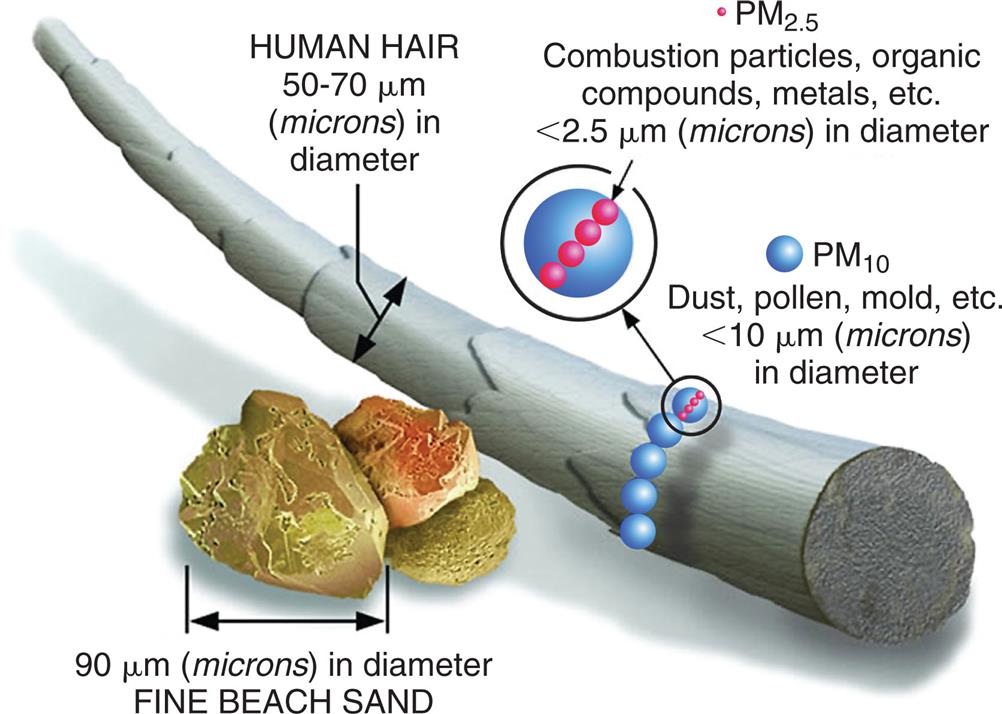
An illustration compares the sizes of fine beach sand and human hair. Human hair is 50 to 70 micrometers or microns in diameter. Fine beach sand is 90 micrometers or microns in diameter. P M 10 substances on a hair stand include dust, pollen, and mold that are less than 10 micrometers or microns in diameter. P M 2.5 substances, on P M 10 substances, include combustion particles, organic compounds, and metals that are less than 2.5 micrometers or microns in diameter.
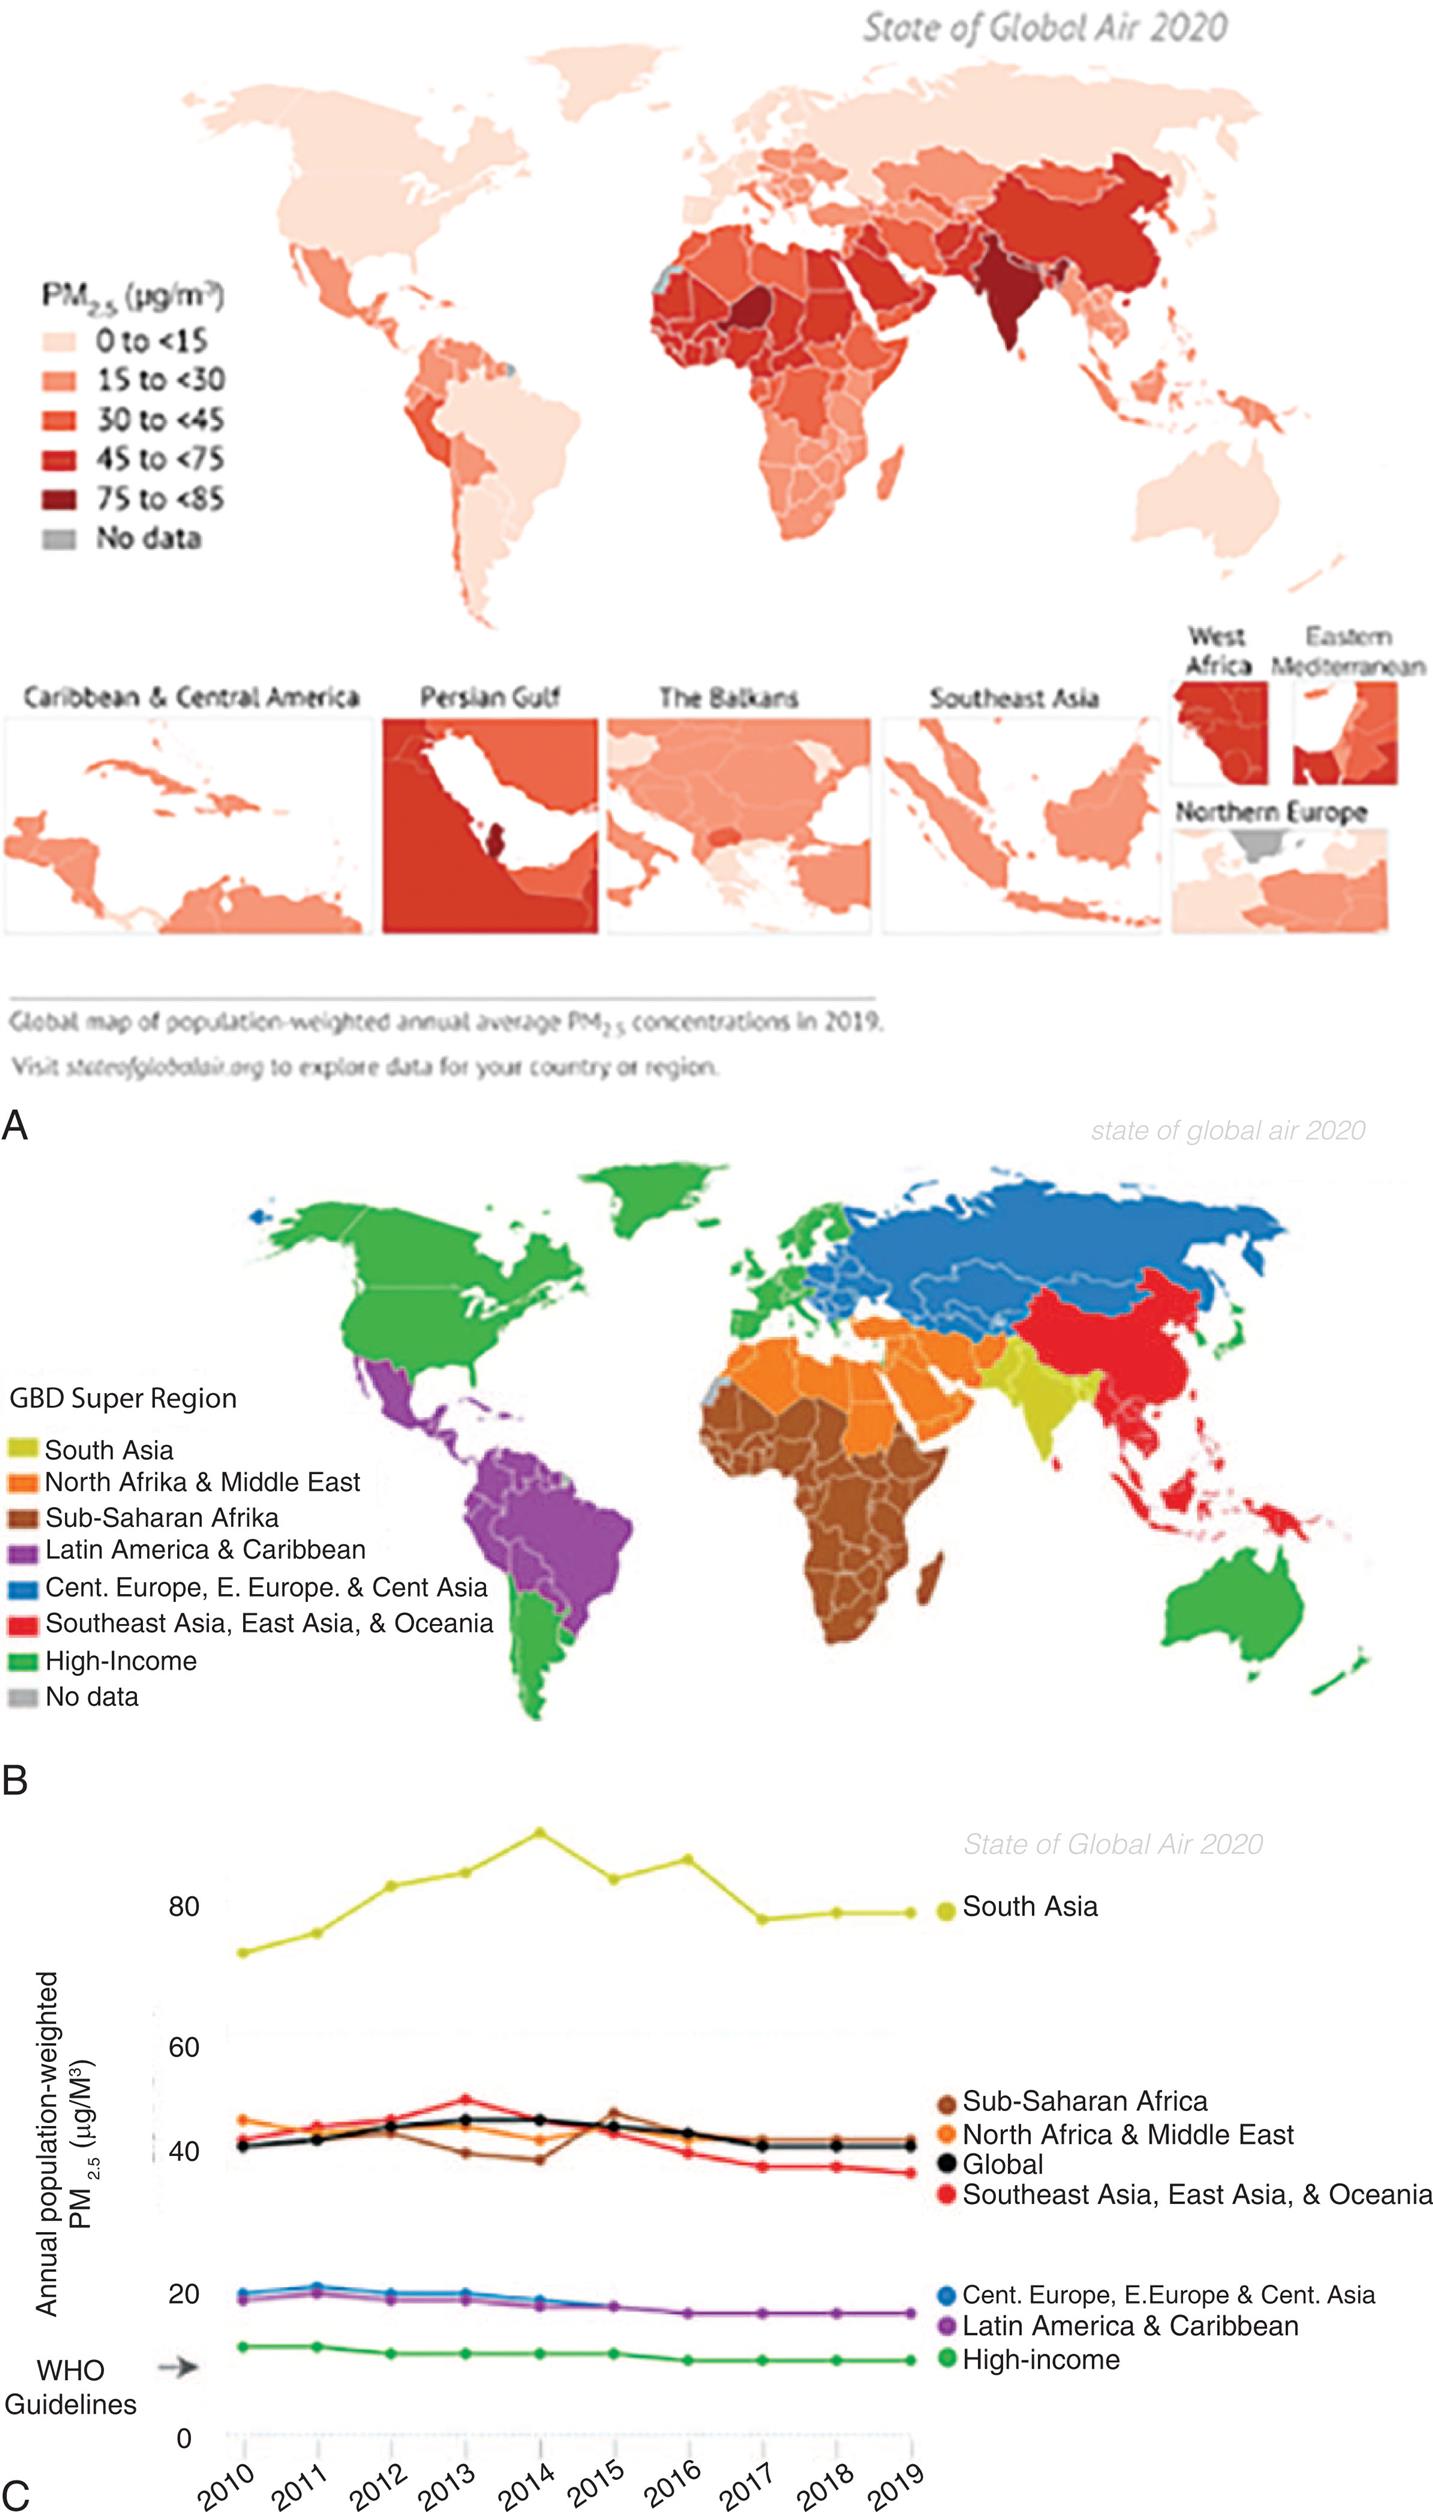
(B) Countries included in the seven Global Burden of Disease (GBD) Super Regions. That is, countries grouped by similar cause-of-death patterns. (C) Trends in population-weighted annual average PM 2.5 concentrations globally and in the GBD Super Regions, 2010–2019. (Data from Health Effects Institute. State of Global Air 2020 Report. Data source: Global Burden of Disease Study. IHME; 2020. https://www.stateofglobalair.org/resources, to explore data for a certain country or region.)
Two maps and a graph show data for global air pollution. Map A shows the prevalence of P M 2.5 substances in picograms per cubic meter. The approximate data from the graph are as follows. Less than 15 picograms per cubic meter: North America, Greenland, South America, Europe, Asia, and Australia. 15 picograms per cubic meter to 30 picograms per cubic meter: Latin America, Caribbean, South Africa, Middle East, East Asia. 30 picograms per cubic meter to 45 picograms per cubic meter: parts of South Africa, Middle East, and Central Asia. 45 picograms per cubic meter to 75 picograms per cubic meter: parts of North Africa, Middle East, and Southeast Asia. 75 picograms per cubic meter to 85 picograms per cubic meter: South Asia and parts of Western Africa. Map B is a color-coded world map grouping countries by similar cause-of-death patterns or global burden of diseases, G B D. In increasing order of patterns, the regions color-coded are as follows: South Asia; North Africa and Middle East; Sub-Saharan Africa; Latin America and Caribbean; Central, Europe, Eastern Europe, and Central Asia; Southeast Asia, East Asia, and Oceania; and High-Income. Line Graph C show annual population-weighted P M sub 2.5 substances in micrograms per cubic meter. The vertical axis ranges from 0 to 80 units, in increments of 20. The horizontal axis ranges from 20 10 to 20 19, in increments of 1 year. The data from the map and graph are as follows. 75 micrograms per cubic meter to 85 micrograms per cubic meter: South Asia. 40 micrograms per cubic meter to 50 micrograms per cubic meter: Sub-Saharan Africa, North Africa, Middle East, Southeast Asia, East Asia, and Oceania. 20 micrograms per cubic meter: Central Europe, Eastern Europe, Central Asia, Latin America, and Caribbean. The W H O Guideline is at about 13 micrograms per cubic meter and includes high-income countries: North America, South America, Greenland, Western Europe, Japan, Australia, and New Zealand.
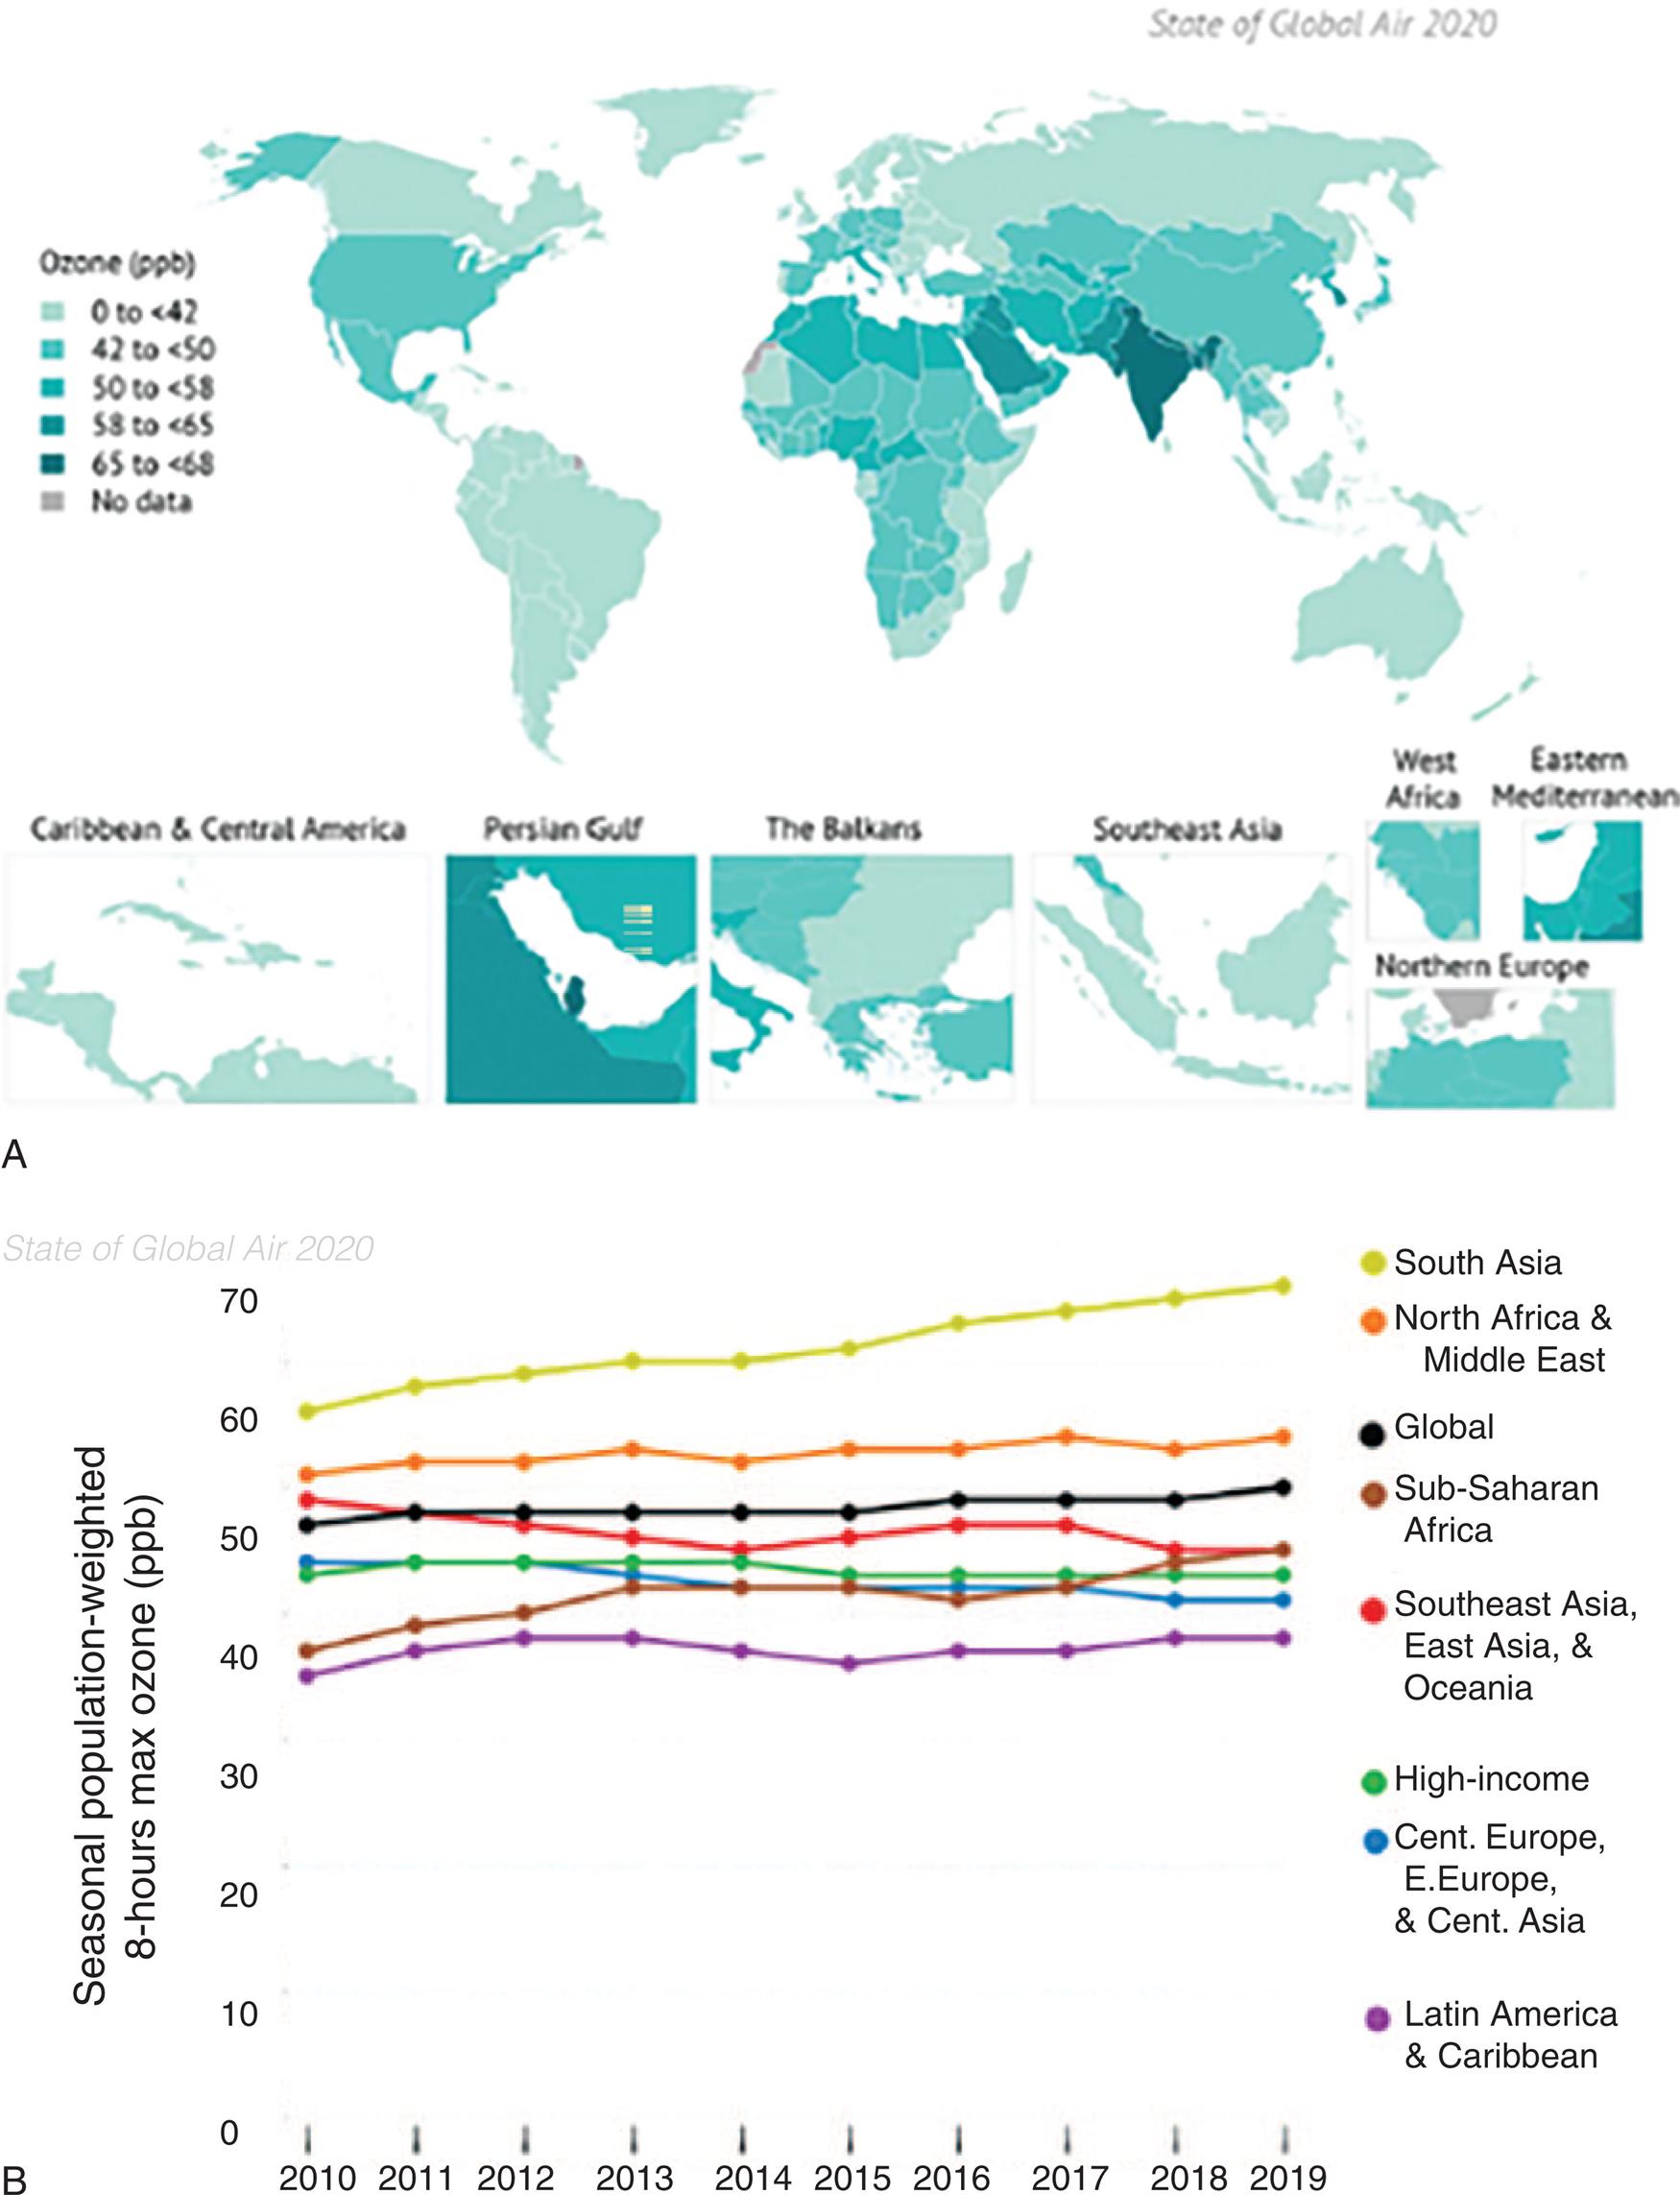
(A) Global map of population-weighted average seasonal 8-hour maximum ozone concentrations in 2019. (B) Trends in population-weighted average seasonal 8-hour maximum ozone concentration globally and in the Global Burden of Disease (GBD) Super Regions, 2010–2019. (Data from Health Effects Institute. State of Global Air 2020 Report. Data source: Global Burden of Disease Study. IHME; 2020. https://www.stateofglobalair.org/resources.)
Map A shows data for global zone levels in parts per billion. Less than 42 parts per billion: Canada, Greenland, South America, Eastern Europe, Central Europe, Central Asia, parts of South Africa, Oceania, Australia, and New Zealand. 42 parts per billion to 40 parts per billion: United States, Western Europe, parts of Africa, Middle East, and Eastern Asia. 50 parts per billion to 58 parts per billion: Northern Africa and Middle East. 58 parts per billion to 65 parts per billion: Eastern Mediterranean. 65 parts per billion to 68 parts per billion: South Asia. Graph B shows seasonal populated-weighted 8-hour max ozone levels in parts per billion over the years for the period between 20 10 and 20 19. The vertical axis ranges from 0 to 70 units, in increments of 10. The horizontal axis ranges from 20 10 to 20 19, in increments of 1. The approximate data from the graph are as follows. South Asia: 57 parts per billion in 20 10 to 68 parts per billion in 20 19. North Africa and Middle East: 50 parts per billion from 20 10 to 20 19. Global: 48 parts per billion from 20 10 to 49 parts per billion 20 19. Sub-Saharan Africa: 38 parts per billion in 20 10 to 42 parts per billion in 20 19. Southeast Asia, East Asia, and Oceania: 50 parts per billion in 20 10 to 42 parts per billion in 20 19. High-Income Countries: 42 parts per billion from 20 10 to 20 19. Central Europe, Eastern Europe, and Central Asia: 44 parts per billion in 20 10 to 40 parts per billion in 20 19. Latin America and Caribbean: 35 parts per billion in 20 10 to 38 parts per billion in 20 19.
Table 2.6
Household air pollution
From the most recent report, 3.8 billion people cook using solid fuels (e.g., coal, charcoal, wood, dung, kerosene, agricultural residue) (Fig. 2.21). Nearly 50% of the world’s population is exposed to household air pollution from the burning of solid fuels, which contributes to 3.8 million premature deaths per year (2018) from illnesses caused by these practices.19 These inefficient practices produce high levels of household air pollution with a range of health-damaging pollutants, including carbon monoxide and small soot particles that penetrate deep into the lungs. Indoor smoke can be 100 times higher than acceptable levels for fine particles.17 These exposures are particularly high for women and young children. Most individuals exposed to indoor pollutants live in developing countries. Individuals exposed to indoor pollution along with outdoor pollution face a double health burden.20 Household air pollution is a significant contributor to ambient PM2.5.21
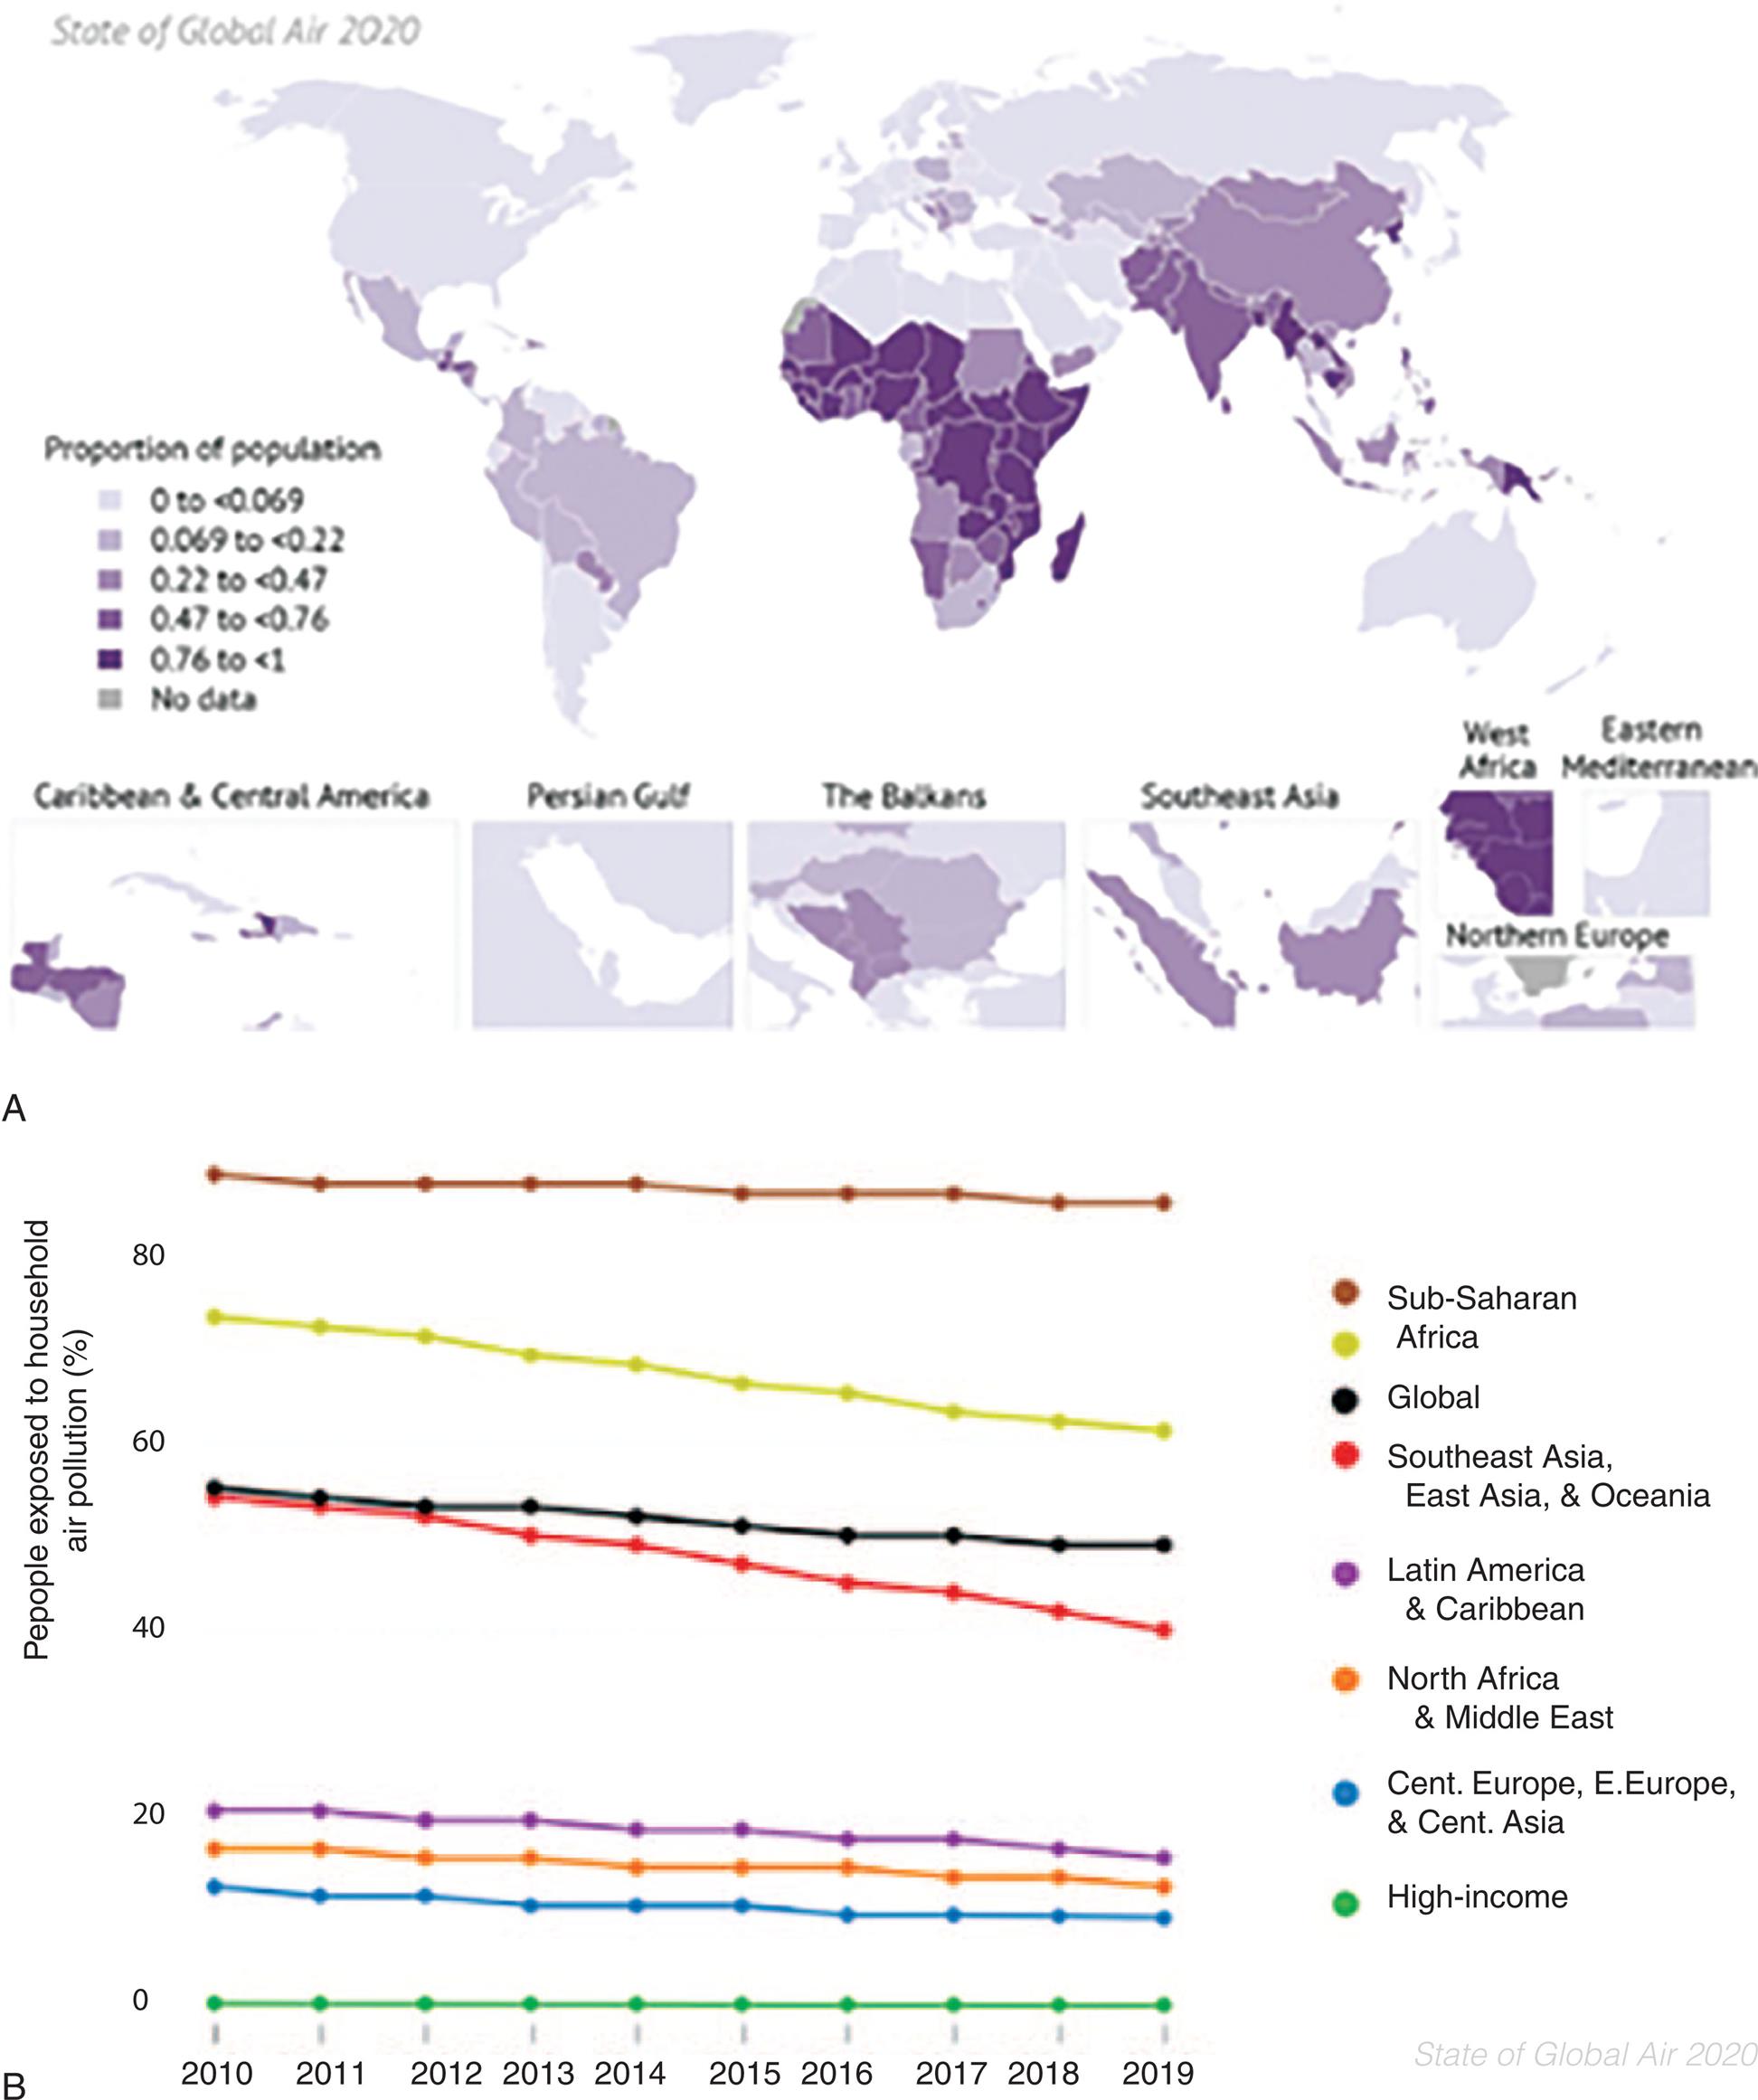
(B) Trends in the proportion of population cooking with solid fuels globally and in the GBD Super Regions, 2010–2019. (Data from Health Effects Institute. State of Global Air 2020 Report. Data source: Global Burden of Disease Study. IHME; 2020. https://www.stateofglobalair.org/resources.)
Part A: A map and line graph show data for percentage of people exposed o household air pollution over the years, for the period from 20 10 to 20 19. The approximate data from the map are as follows. 0 to 0.69: High-Income Countries. 0.069 to 0.22: Latin America, Caribbean, and Eastern Europe. 0.22 to 0.47: Parts of Southern Africa and Southeast Asia. 0.47 to 0.76: South Asia. 0.76 to 1: Parts of Africa and Southeast Asia. Part B: The vertical axis ranges from 0 to 80 units in increments of 20. The horizontal axis ranges from 20 10 to 20 19, in increments of 1. The approximate data from the graph are as follows. Sub-Saharan Africa: 85 percent from 20 10 to 20 19. South Africa: 75 percent in 20 10 to 62 percent in 20 19. Global: 57 percent in 20 10 to 56 percent in 20 19. Southeast Asia, East Asia, and Oceania: 57 percent in 20 10 to 40 percent in 20 19. Latin America and Caribbean: 21 percent in 20 10 to 20 percent in 20 19. North Africa and Middle East: 19 percent from 20 10 to 20 19. Central Europe, Eastern Europe, and Central Asia: 18 percent in 20 10 to 17 percent in 20 19. High-Income Countries: 0 percent from 20 10 to 20 19.
Reducing outdoor emissions from household coal and biomass energy systems, agricultural waste incineration, forest fires, and certain agroforestry activities (e.g., charcoal production) would reduce key rural and peri-urban air pollution sources in developing regions.17 Reducing outdoor air pollution decreases emissions of CO2 and short-lived climate pollutants; for example, black carbon particles and methane. These actions would contribute to mitigating climate change. Since 2010, the use of solid fuels has fallen slowly and steadily in most regions, especially in South Asia, Southeast Asia, East Asia, and Oceania Super Regions (see Fig. 2.21B).
COVID-19 infection has raised awareness to an invisible threat to our respiratory and cardiovascular health and has brought renewed attention to air pollution. Although COVID-19’s effects may appear in a few weeks, the health consequences of air pollution may take years to manifest in the form of chronic diseases (see Emerging Science Box: Long-Term Exposure to Air Pollution and Increased Risk of Severe COVID-19 Outcomes). Respiratory and cardiovascular health have made individuals more vulnerable to the effects of COVID-19.21
Heavy Metals as Environmental Pollutants
The most common heavy metals associated with harmful effects in humans include lead, mercury, arsenic, and cadmium. Damage from metals includes involvement of DNA repair mechanisms, tumor suppressor functions, and interference with signal transduction pathways.
Lead
Lead (Pb) is a heavy toxic metal present in paint of older homes (built before 1978), the environment, and the workplace. Lead may be found in hazardous concentrations in food, water, and air, and it is one of the most common overexposures found in industry.22 Despite efforts to reduce exposure through government regulation, lead exposure persists in homes, the environment, and the workplace for many people, and lead toxicity is still a primary hazard to children. Older buildings, where lead-based paint is peeling from the walls, are a particular hazard to children (see Emerging Science Box: Lead Poisoning). Lead-based paint has a sweet taste, and toddlers are apt to find paint chips on the floor and put them into their mouths. Although Pb was removed from paint in the United States in 1978, many homes in the United States still contain leaded paint, and chipped and peeling leaded paint constitutes a significant source of current childhood exposure.23,24
The chipped paint can disintegrate at friction surfaces to form lead dust. Another source of contamination is lead dust dispersed along roadways from previous leaded gasoline emissions. When lead was removed from gasoline, blood lead levels (BLLs) dropped significantly.25
Previous emissions of leaded fuel created large dispersions of lead dust in the environment. Particulate lead (2 to 10 μm) does not degrade and persists in the environment, making it a notable source of human exposure.26 Other airborne sources include smelters and piston-engine airplanes.27 Drinking water exposed to lead occurs from outdated fixtures, plumbing without corrosion control, and solders. Because well water is not subject to EPA regulation, it may not be tested for lead. Although the average blood levels of lead in children in the United States have dropped since the 1970s, there are at-risk populations with higher-than-average BLLs. Children living at or below the poverty line who live in older housing are at greatest risk. Importantly, the CDC reports “no safe blood lead level in children has been identified.”28 Millions of children are being exposed to lead in their homes, increasing their risks for damage to the brain and nervous system, slowed growth and development, learning and behavior problems (e.g., reduced IQ, attention-deficit/hyperactivity disorder [ADHD], juvenile delinquency, and criminal behavior), and hearing and speech problems.
The neurologic effect of lead in exposed children is the driving force for reducing lead levels in the environment. Children are more susceptible than adults to the effects of lead for several reasons: