Structure and Function of the Cardiovascular and Lymphatic Systems
Karen C. Turner and Valentina L. Brashers
 http://evolve.elsevier.com/Rogers/pathophysiology/
The functions of the circulatory system include delivery of oxygen, nutrients, hormones, immune system components, and other substances to body tissues and removal of the waste products of metabolism. Delivery and removal are achieved by an extensive array of tubes—the blood and lymphatic vessels—connected to a pump—the heart. The heart continuously pumps blood through the blood vessels in collaboration with other systems, particularly the nervous and endocrine systems, which are intrinsic regulators of the heart and blood vessels. Immune system components, nutrients, and oxygen are supplied by the immune, digestive, and respiratory systems; gaseous wastes of metabolism are expired through the lungs; and other wastes are removed by the kidneys and digestive tract.
http://evolve.elsevier.com/Rogers/pathophysiology/
The vascular endothelium also is a key component of the circulatory system and is sometimes considered a separate endocrine organ. This endothelium is a multifunctional tissue whose health is essential to normal vascular, immune, and hemostatic system function. Endothelial dysfunction is a critical factor in the development of vascular and other diseases (see Chapter 32).
Circulatory System
The heart is composed of two conjoined pumps moving blood through two separate circulatory systems in sequence: one pump supplies blood to the lungs, whereas the second pump delivers blood to the rest of the body. Structures on the right side, or right heart, pump blood through the lungs. This system is termed the pulmonary circulation and is described in Chapter 34. The left side, or left heart, sends blood throughout the systemic circulation, which supplies all of the body except the lungs (Fig. 31.1). These two systems are serially connected; thus the output of one becomes the input of the other.

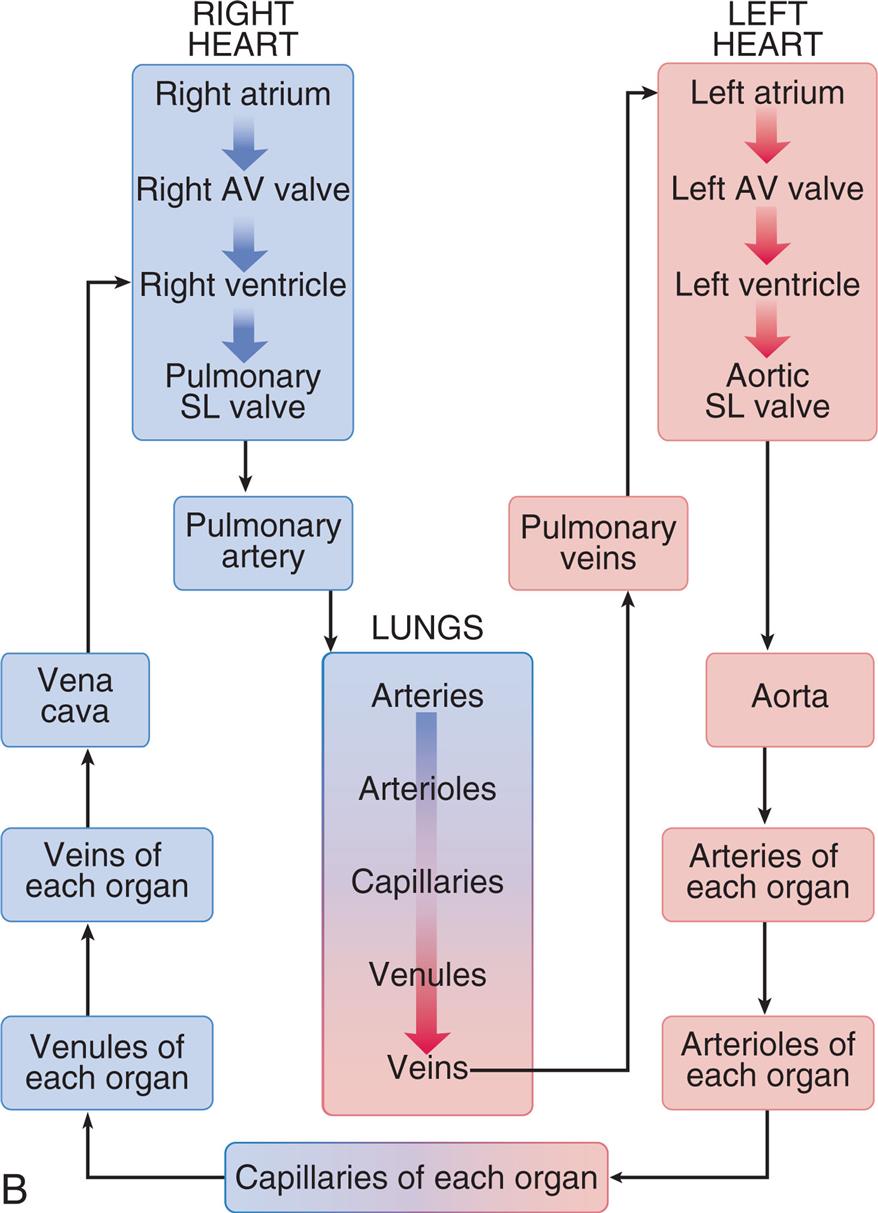
(A) The right heart pumps unoxygenated blood (blue) through the pulmonary circulation, where oxygen enters the blood and carbon dioxide is exhaled, and the left heart pumps oxygenated (red) blood to and from all the other organ systems in the body. (B) Blood flow begins at the left ventricle of the heart; the blood flows to the arteries, arterioles, capillaries of each body organ, venules, veins, right atrium, right ventricle, pulmonary artery, lung capillaries, pulmonary veins, and left atrium and then returns to the left ventricle. (B, Adapted from Patton KT, Thibodeau GA. The human body in health & disease, 7th edition. St. Louis: Mosby; 2018.)
Left panel, A. The illustration shows the pulmonary and the systemic circulatory system and the arrow mark in the system and the blood flow is indicated by arrow marks. The following structures in the pulmonary circulation system are labeled: right pulmonary artery, right pulmonary vein, right lung capillaries, left pulmonary artery, left pulmonary vein, and left lung capillaries. The following structures in the systemic circulation system are labeled: liver circulation, vena cava, aorta, hepatic portal vein, systemic circulation, intestinal capillaries, renal capillaries, and systemic capillary beds. Right panel, B. The cycle shows the direction of the blood flow. The sequence of the flow is as follows. •Capillaries of each organ. •Venules of each organ. •Veins of each organ. •Vena cava. •Right heart (right atrium, right A V valve, right ventricle, and pulmonary S L valve). •Lungs (arteries, arterioles, capillaries, venules, and veins) •Pulmonary veins. •Left heart (left atrium, left A V valve, left ventricle, and aortic S L valve). •Aorta. •Arteries of each organ. •Arterioles of each organ. •Capillaries of each organ.
Arteries carry blood from the heart to all parts of the body, where they branch into arterioles and even smaller vessels, ultimately becoming a fine meshwork of capillaries. Capillaries allow the closest contact and exchange between the blood and the interstitial space, or interstitium—the environment in which cells live. Venules and then veins next carry blood from the capillaries back to the heart. Some of the plasma or liquid part of the blood passes through the walls of the capillaries into the interstitial space. This fluid, called lymph, is returned to the cardiovascular system by vessels of the lymphatic system. The lymphatic system is a critical component of the immune system as described in Chapters 7 and 8.
Heart
The adult heart is about the size of a fist and weighs between 250 and 350 g. The heart lies obliquely (diagonally) in the mediastinum, the area above the diaphragm and between the lungs. Heart structures can be categorized by function:
- 1. Structural support of heart tissues and circulation of pulmonary and systemic blood through the heart. This category includes the heart wall and fibrous skeleton enclosing and supporting the heart and dividing it into four chambers; the valves directing flow through the chambers; and the great vessels conducting blood to and from the heart.
- 2. Maintenance of cardiac metabolism. This category includes all the vessels of the coronary circulation—the arteries and veins that serve the metabolic needs of all the heart cells—and the heart's lymphatic vessels.
- 3. Stimulation and control of heart action. Among these structures are the nerves and specialized muscle cells that direct the rhythmic contraction and relaxation of the heart muscles, propelling blood throughout the pulmonary and systemic circulatory systems.
Structures that Direct Circulation Through the Heart
The complex anatomy and physiology of the heart serve to accept blood from the venous system and propel it unidirectionally through the right heart into the lungs, then through the left heart and out into the systemic arterial circulation (Fig. 31.2A). This process ensures the delivery of oxygenated blood into the systemic circulation and maintains tissue perfusion.
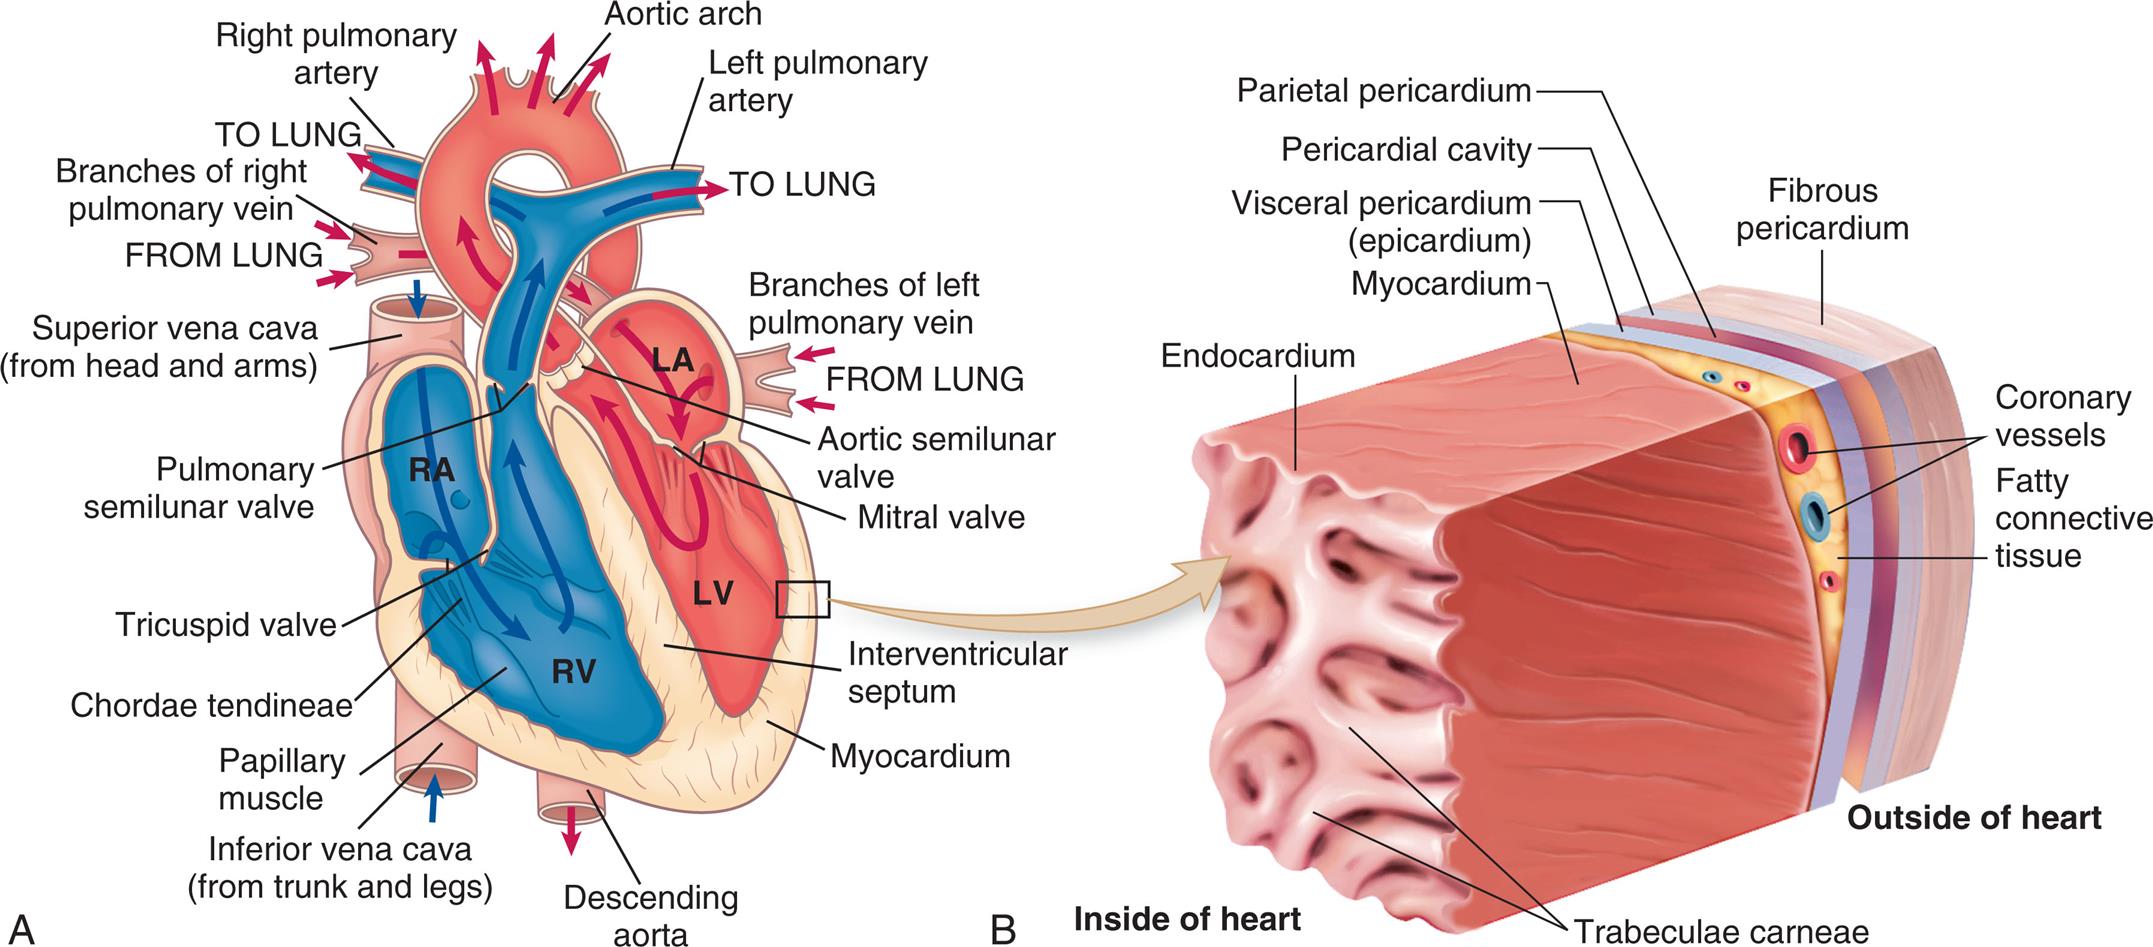
(A) The arrows indicate the path of blood through the chambers, valves, and major vessels. (B) This section of the heart wall shows the fibrous pericardium, the parietal and visceral layers of the serous pericardium (with the pericardial space between them), the myocardium, and the endocardium. Note the fatty connective tissue between the visceral layer of the serous pericardium (epicardium) and the myocardium. Note also that the endocardium covers tubular projections of myocardial muscle tissue called trabeculae. (Revised from Applegate E. The anatomy and physiology learning system, 4th edition. St. Louis: Saunders; 2011.)
Left panel, A. An illustration shows a cross-section of the heart. The flow of blood is traced as follows: from the lung through the branches of left pulmonary vein to the left atrium, through the mitral vale to the left ventricle and into the aortic arch. The blood also flows from the superior vena cava (from head and arms) to the right atrium, into the right ventricle, and into the lung. Other structures identified on the illustration, clockwise from the right include: aortic semilunar valve, interventricular septum, myocardium, descending aorta, inferior vena cave (from trunk and legs), papillary muscle, chordae tendineae, pulmonary semilunar valve, and branches of right pulmonary vein. Right panel, B. The illustration shows a magnified view of the heart and identifies the following layers from the inside of the heart to the outside of the heart: endocardium, myocardium, coronary vessels, fatty connective tissue, visceral pericardium (epicardium), parietal pericardium, pericardial cavity, and fibrous pericardium.
Heart Wall
The three layers of the heart wall—the epicardium, myocardium, and endocardium—are enclosed in a double-walled membranous sac, the pericardium (see Fig. 31.2B). The pericardial sac has several functions: provides stability of the heart within the thorax, reduces friction between the heart and the mediastinal structures, limits the size of the heart chambers, provides a barrier to the spread of infection, and it contains pain receptors and mechanoreceptors that can cause reflex changes in blood pressure and heart rate.1 The fibrous pericardium is composed of tough connective tissue that surrounds but does not attach to the heart. Within this outer layer are the parietal pericardium which adheres to the internal surface of the fibrous pericardium, and the visceral pericardium which adheres to the heart (see Fig. 31.2B). These two layers are separated by a fluid-containing space called the pericardial cavity. The pericardial fluid (about 20 mL) is secreted by cells of the mesothelial layer of the pericardium and lubricates the membranes that line the pericardial cavity, enabling them to slide smoothly over one another with minimal friction as the heart beats. The amount and character of the pericardial fluid are altered if the pericardium is inflamed (see Chapter 32).
The smoothness of the outer layer of the heart, the epicardium, also minimizes the friction between the heart wall and the pericardial sac. The thickest layer of the heart wall, the myocardium, is composed of cardiac muscle and is anchored to the heart's fibrous skeleton. The thickness of the myocardium varies tremendously from one heart chamber to another. Thickness is related to the amount of resistance the muscle must overcome to pump blood from the different chambers. The heart muscle cells, cardiomyocytes, provide the contractile force needed for blood to flow through the heart and into the pulmonary and systemic circulations. About 0.5% to 1% of the cardiomyocytes are replaced annually; thus over a lifetime only about half of these muscle cells are replaced.2 There is great interest in finding therapies that will increase the rate of cardiomyocyte replacement for persons who have suffered a myocardial infarction or have heart failure from another cause because the limited myocyte turnover is insufficient to restore contractile function (see Emerging Science Box: Myocardial Regeneration).3
The internal lining of the myocardium, the endocardium, is composed of connective tissue and squamous cells (see Fig. 31.2B). This lining is continuous with the endothelium that lines all the arteries, veins, and capillaries of the body, creating a continuous, closed circulatory system.
Great Vessels
Blood moves into and out of the heart through several large veins and arteries (see Fig. 31.2A). The right heart receives venous deoxygenated blood from the systemic circulation through the superior and inferior venae cavae, which join and then enter the right atrium. Blood leaving the right ventricle enters the pulmonary circulation through the pulmonary artery, which divides into right and left branches to transport deoxygenated blood from the right heart to the lungs. The pulmonary arteries branch further into the pulmonary capillary beds, where oxygen and carbon dioxide exchange occurs (see Fig. 31.1B).
Four pulmonary veins, two from the right lung and two from the left lung, carry oxygenated blood from the lungs to the left side of the heart. The oxygenated blood moves through the left atrium and ventricle, out into the aorta that subsequently branches into the systemic arteries that supply the body.
Chambers of the Heart
The heart has four chambers: the left atrium, the right atrium, the right ventricle, and the left ventricle. These chambers form two pumps in series: the right heart is a low-pressure system pumping blood through the lungs, and the left heart is a high-pressure system pumping blood to the rest of the body (see Fig. 31.2A). The atria are smaller than the ventricles and have thinner walls. The ventricles have a thicker myocardial layer and constitute much of the bulk of the heart. The wall of the right ventricle is about 4 to 5 mm thick, and that of the more muscular left ventricle is 8 to 12 mm thick.1 The ventricles are formed by a continuum of muscle fibers originating from the fibrous skeleton at the base of the heart.
The wall thickness of each cardiac chamber depends on the amount of pressure or resistance it must overcome to eject blood. The two atria have the thinnest walls because they are low-pressure chambers that serve as storage units and channels for blood that is emptied into the ventricles. Normally, there is little resistance to flow from the atria to the ventricles. The ventricles, on the other hand, must propel the blood all the way through the pulmonary or systemic vessels. The ventricular myocardium must be strong enough to pump against pressures within the pulmonary or systemic vessels. The mean pulmonary artery pressure, the force the right ventricle must overcome, is only 15 mm Hg, whereas the mean arterial pressure the left ventricle must pump against is about 92 mm Hg. Because the pressure is markedly higher in the systemic circulation, the wall of the left ventricle is about three times thicker than that of the right ventricle.
The right ventricle is shaped like a crescent or triangle, enabling a bellows-like action that efficiently ejects large volumes of blood through the pulmonary semilunar valve into the low-pressure pulmonary system. The larger left ventricle is bullet shaped, which allows it to generate enough pressure to eject blood through a relatively larger aortic semilunar valve into the high-pressure systemic circulation.
The ventricles are structurally more complex than the atria. Each ventricle contains muscle fibers that divide it roughly into an inflow tract, which receives blood from the atrium, and an outflow tract, which sends blood to the circulation (see Fig. 31.2A).
Blood normally does not flow between the chambers of the right and left sides of the heart. The atria are separated by the interatrial septum, and the ventricles by the interventricular septum. However, because the fetus does not depend on the lungs for oxygenation, there is an opening before birth between the right and left atria, called the foramen ovale, that facilitates circulation. This opening closes functionally at the time of birth as the higher pressure in the left atrium pushes a flap, the septum primum, over the hole. In 75% to 80% of infants these septa are permanently fused within the first year of life (see Chapter 33).
Valves of the Heart
Four valves in the heart direct blood flow in one direction through the heart chambers (Fig. 31.3). The atrioventricular(AV) valves are termed such because they fall between the atria and ventricles. The AV valve openings are composed of tissue flaps called leaflets or cusps, which are attached at the upper margin to a ring in the heart's fibrous skeleton and by the chordae tendineae at the lower end to the papillary muscles (see Fig. 31.2A). The papillary muscles, extensions of the myocardium, help hold the cusps together and downward at the onset of ventricular contraction, thus preventing their backward expulsion or prolapse into the atria. The AV valve in the right heart is called the tricuspid valve because it has three cusps. The tricuspid opening (orifice) has the largest diameter of all the heart valves.1 The left atrioventricular valve is a bicuspid (two-cusp) valve called the mitral valve. The tricuspid and mitral valves function as a unit because the atria, fibrous rings, valvular tissue, chordae tendineae, papillary muscles, and ventricular walls are connected. Collectively, these six structures are known as the mitral and tricuspid complex. Damage to any one of the six components of this complex can alter function significantly and contribute to heart failure.
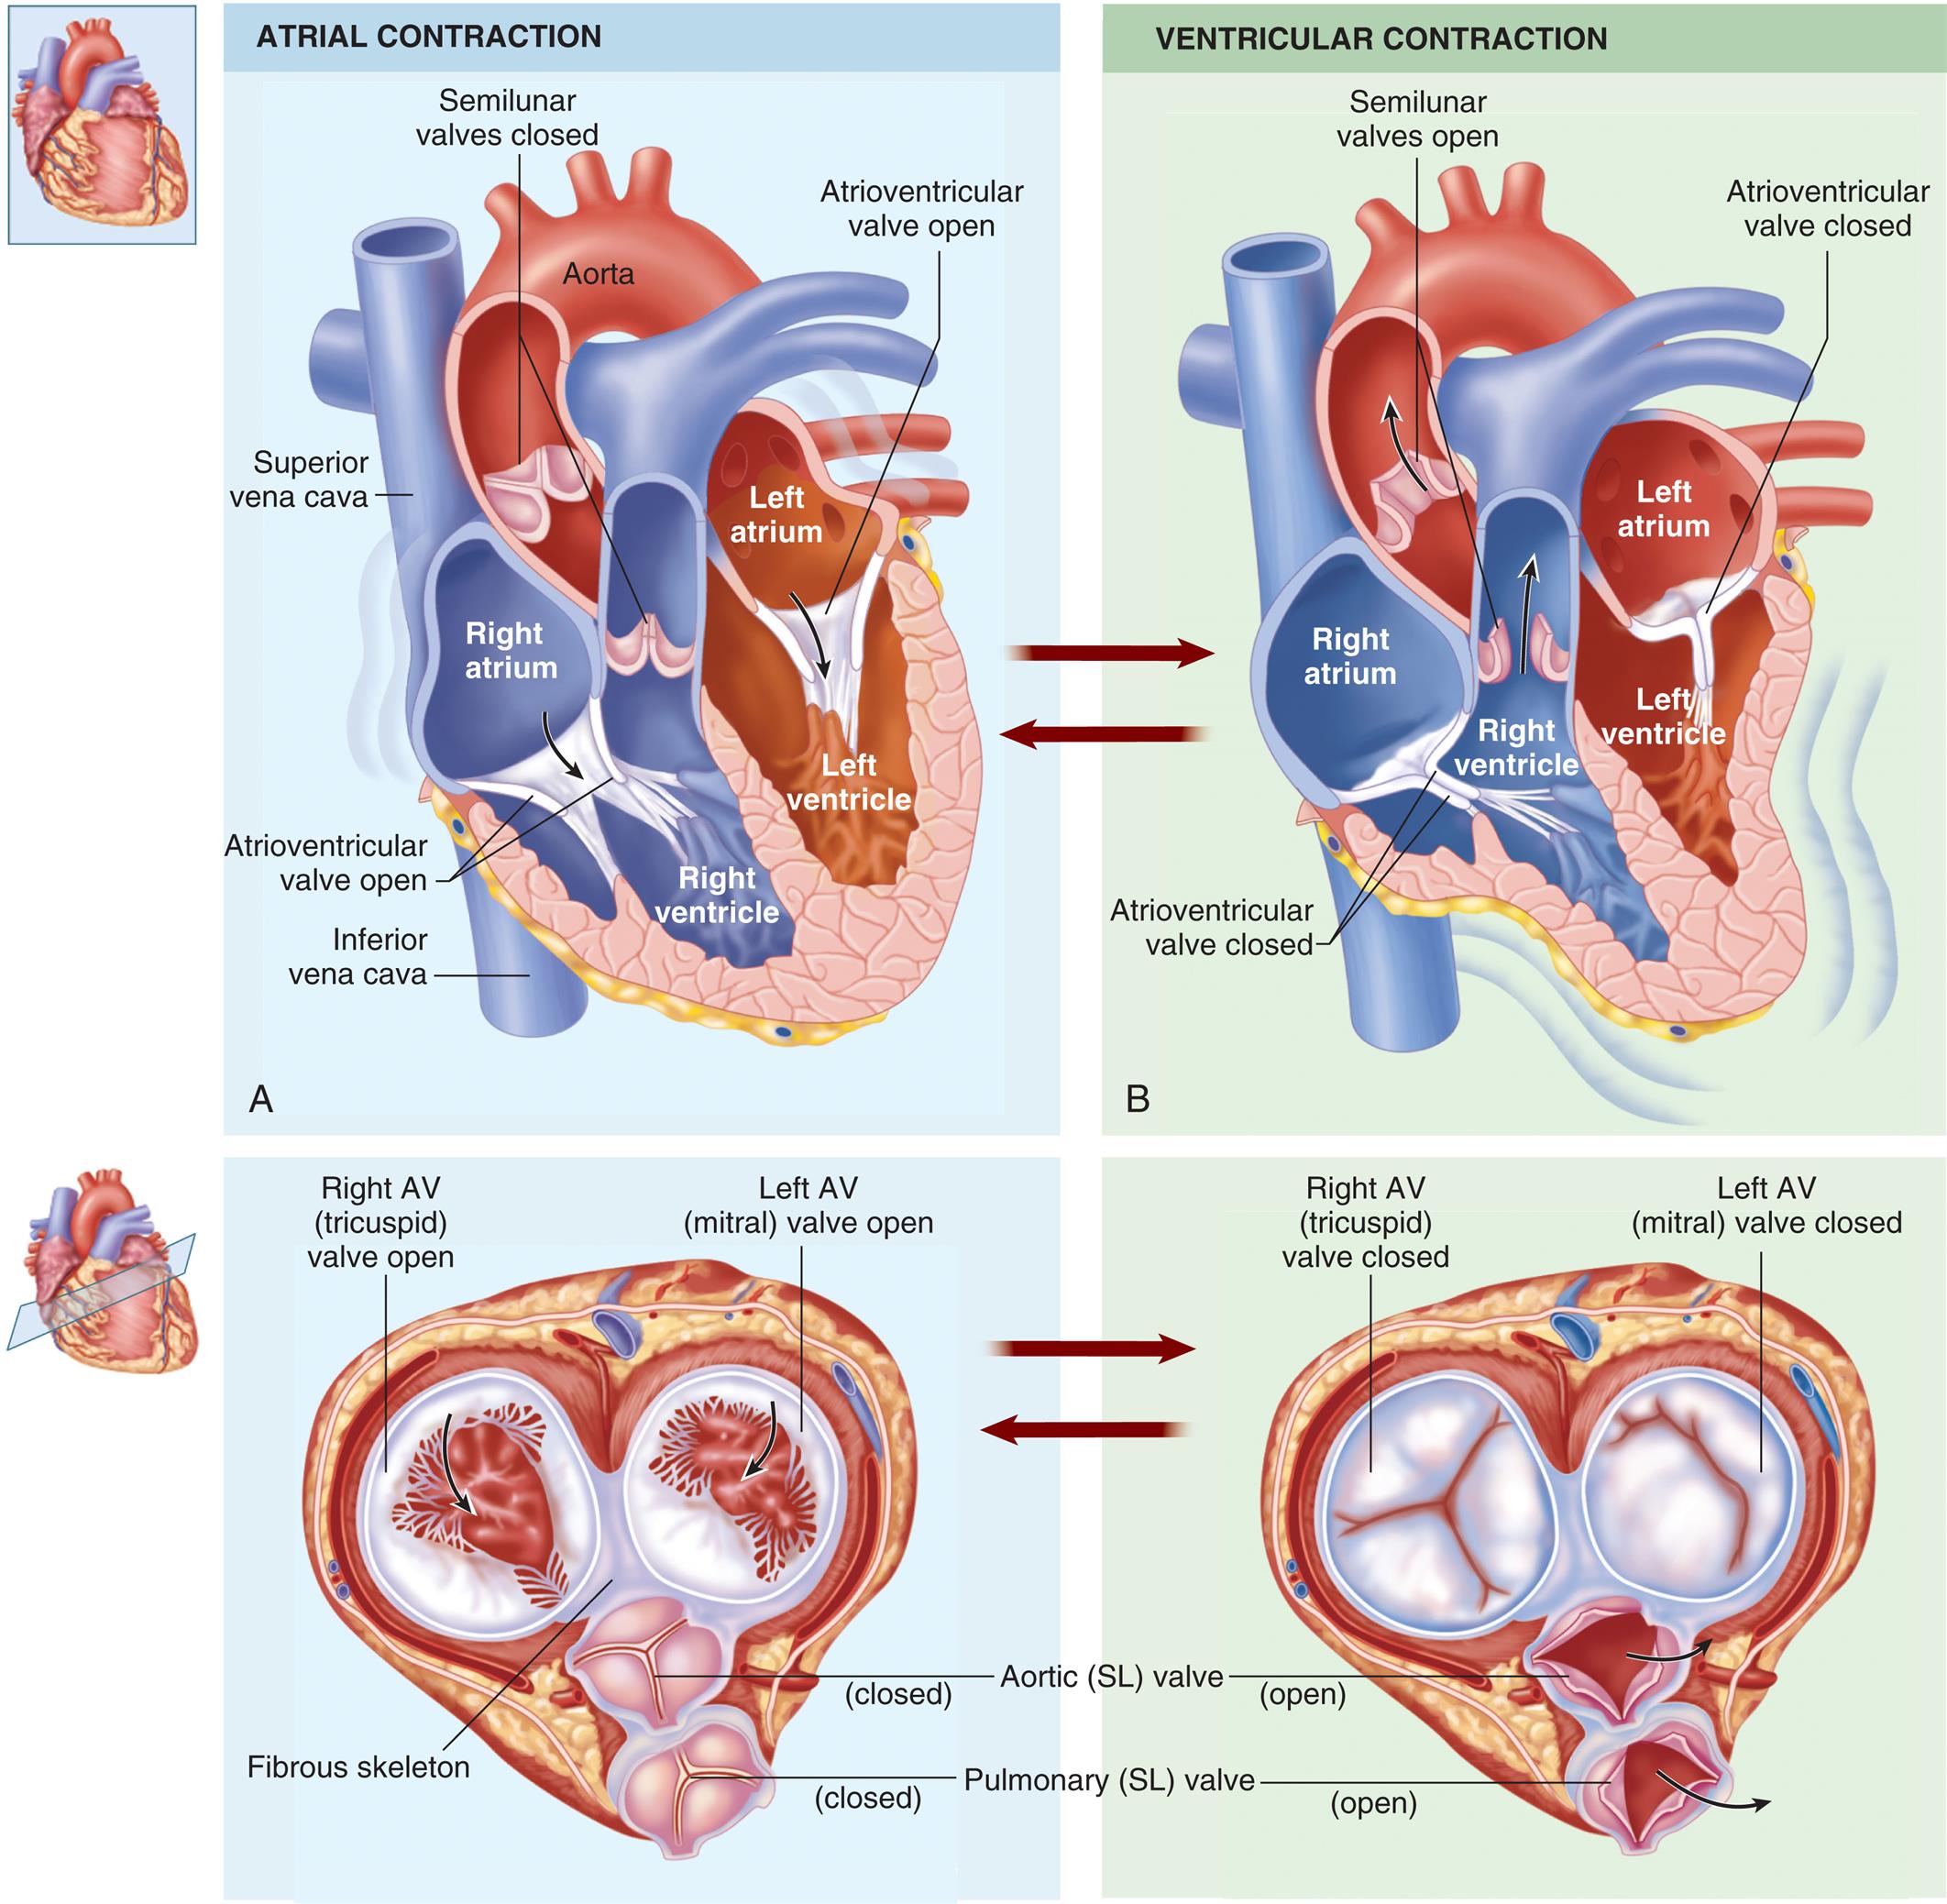
(A) During diastole, blood flows into atria, the atrioventricular valves are pushed open, and blood begins to fill the ventricles. Atrial systole squeezes the blood remaining in the atria into the ventricles. (B) During ventricular systole, the ventricles contract, pushing the blood out through the semilunar valves into the pulmonary artery (right ventricle) and the aorta (left ventricle). (From Patton KT, Thibodeau GA. Structure & function of the body, 15th edition. St. Louis: Elsevier; 2016.)
Left panel, A. A coronal cross-section and an axial cross-section of the heart illustrate atrial contraction and the arrows indicate the flow of blood. The following structures on the coronal cross-section are labeled, clockwise from the top: aorta, left atrium, atrioventricular valve open, left ventricle, right ventricle, inferior vena cava, atrioventricular valve open, right atrium, superior vena cava, and semilunar valves closed. The following structures on the axial cross-section are labeled, clockwise from the top: left A V (mitral) valve open, aortic (S L) valve close, pulmonary (S L) valve closed, fibrous skeleton, and right A V (tricuspid) valve open. Left panel, A. A coronal cross-section and an axial cross-section of the heart illustrate ventricular contraction and the arrows indicate the flow of blood. The following structures on the coronal cross-section are labeled, clockwise from the top: atrioventricular valve closed, left atrium, left ventricle, atrioventricular valve closed, right ventricle, right atrium, and semilunar valves open. The following structures on the axial cross-section are labeled, clockwise from the top: left A V (mitral) valve closed, aortic (S L) valve open, pulmonary (S L) valve open, and right A V (tricuspid) valve closed.
The other two valves in the heart are called the semilunar valves. These valves have three cup-shaped cusps that arise from the fibrous skeleton. Blood leaves the right ventricle through the pulmonary semilunar valve, and it leaves the left ventricle through the aortic semilunar valve (see Figs. 31.2 and 31.3).
Fibrous Skeleton of the Heart
Four rings of dense fibrous connective tissue provide a firm anchorage for the attachments of the atrial and ventricular musculature, as well as the valvular tissue (see Fig. 31.3). The fibrous rings are adjacent and form a central, fibrous supporting structure collectively termed the annuli fibrosi cordis.
Intracardiac Pressures
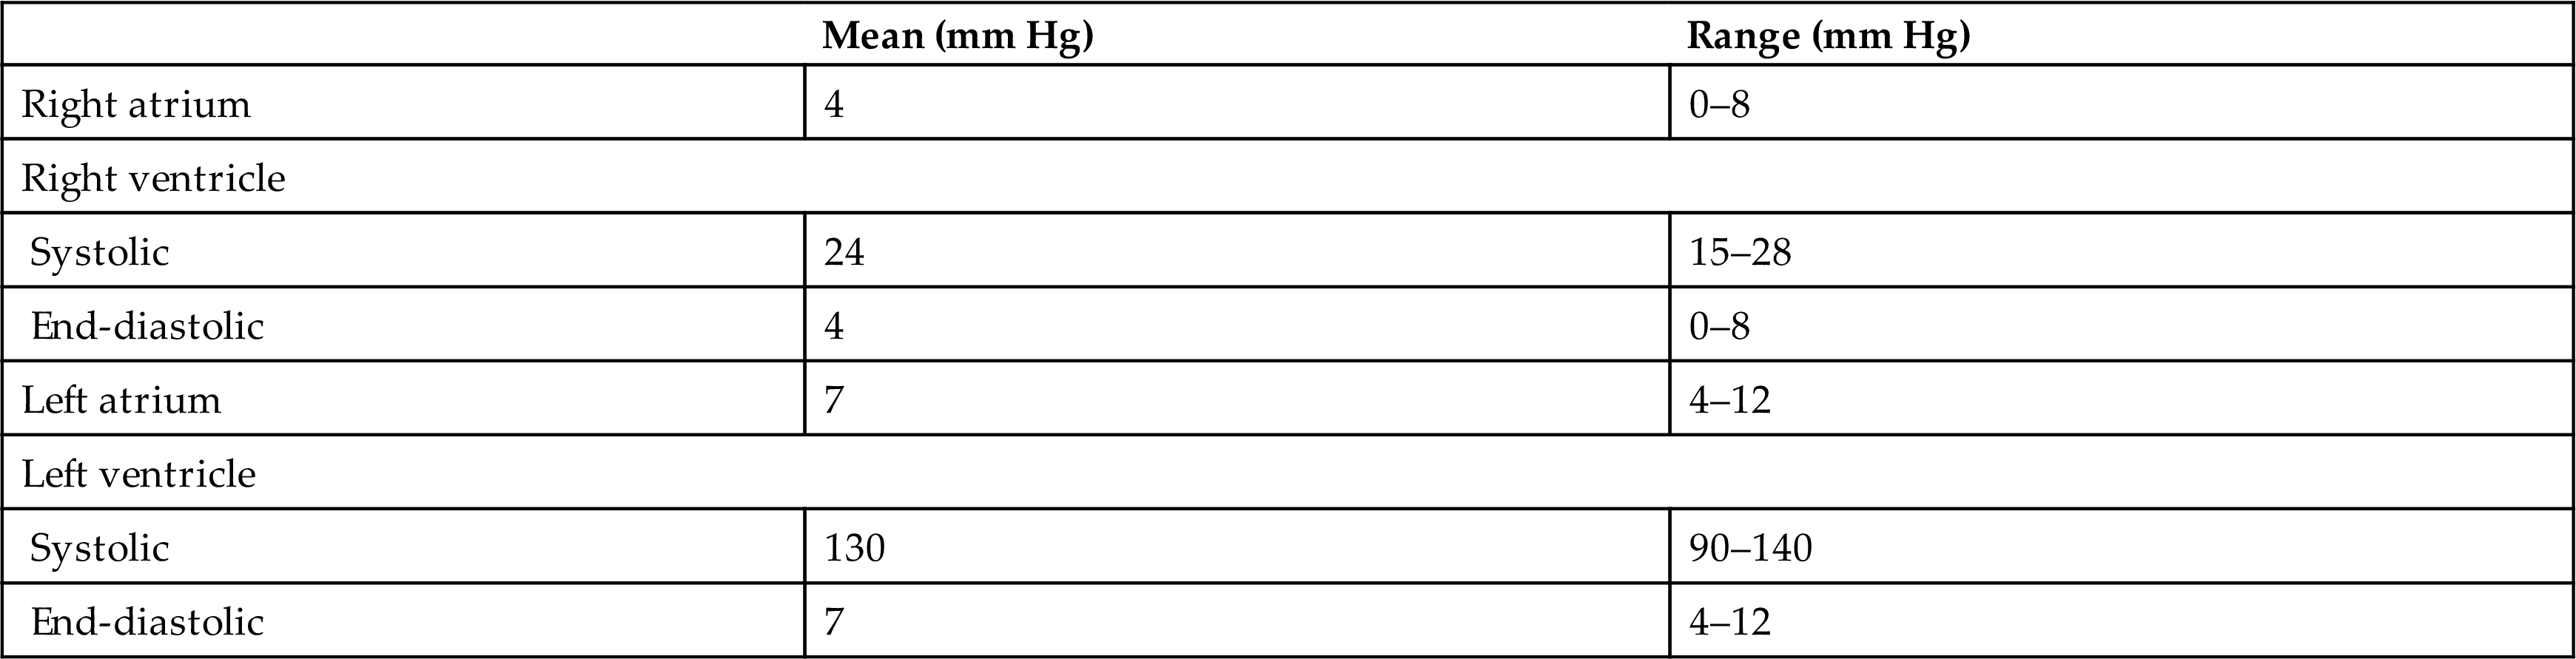
Four heart valves, four chambers, and the pressure gradients they maintain ensure that blood only flows one way through the heart. When the ventricles are relaxed, the two AV valves open and blood flows from the relatively higher pressure in the atria to the lower pressure in the ventricles. As the ventricles contract, ventricular pressure increases and causes these valves to close and prevent backflow into the atria. The semilunar valves of the heart open when intraventricular pressure exceeds aortic and pulmonary pressures, and blood flows out of the ventricles and into the pulmonary and systemic circulations. After ventricular contraction and ejection, intraventricular pressure decreases and the pulmonary and aortic semilunar valves close when the pressure in the vessels is greater than the pressure in the ventricles, thus preventing backflow into the right and left ventricles, respectively. The actions of the heart valves are shown in Figs. 31.2 and 31.3. Normal intracardiac pressures are shown in Table 31.1.
Table 31.1
| Mean (mm Hg) | Range (mm Hg) | |
|---|---|---|
| Right atrium | 4 | 0–8 |
| Right ventricle | ||
| Systolic | 24 | 15–28 |
| End-diastolic | 4 | 0–8 |
| Left atrium | 7 | 4–12 |
| Left ventricle | ||
| Systolic | 130 | 90–140 |
| End-diastolic | 7 | 4–12 |
Cardiac pressure curves depicted in Fig. 31.4 include left atrial, left ventricular, and aortic pressures. Left atrial pressures increase during systole as the atrium receives blood from the superior and inferior venae cavae, and peaks during atrial contraction. In addition, a small bump in atrial pressure occurs early in systole as the closed mitral valve bulges into the left atrium during ventricular contraction. Left ventricular pressure increases rapidly during systole as the ventricle contracts, then falls rapidly as blood flows into the aorta and ventricular volume decreases. Aortic pressure rises and then falls after blood from the left ventricle is distributed to the systemic arterial circulation during diastole. This is reflected clinically in the difference between systolic and diastolic blood pressures when measured in the arm with a blood pressure cuff.
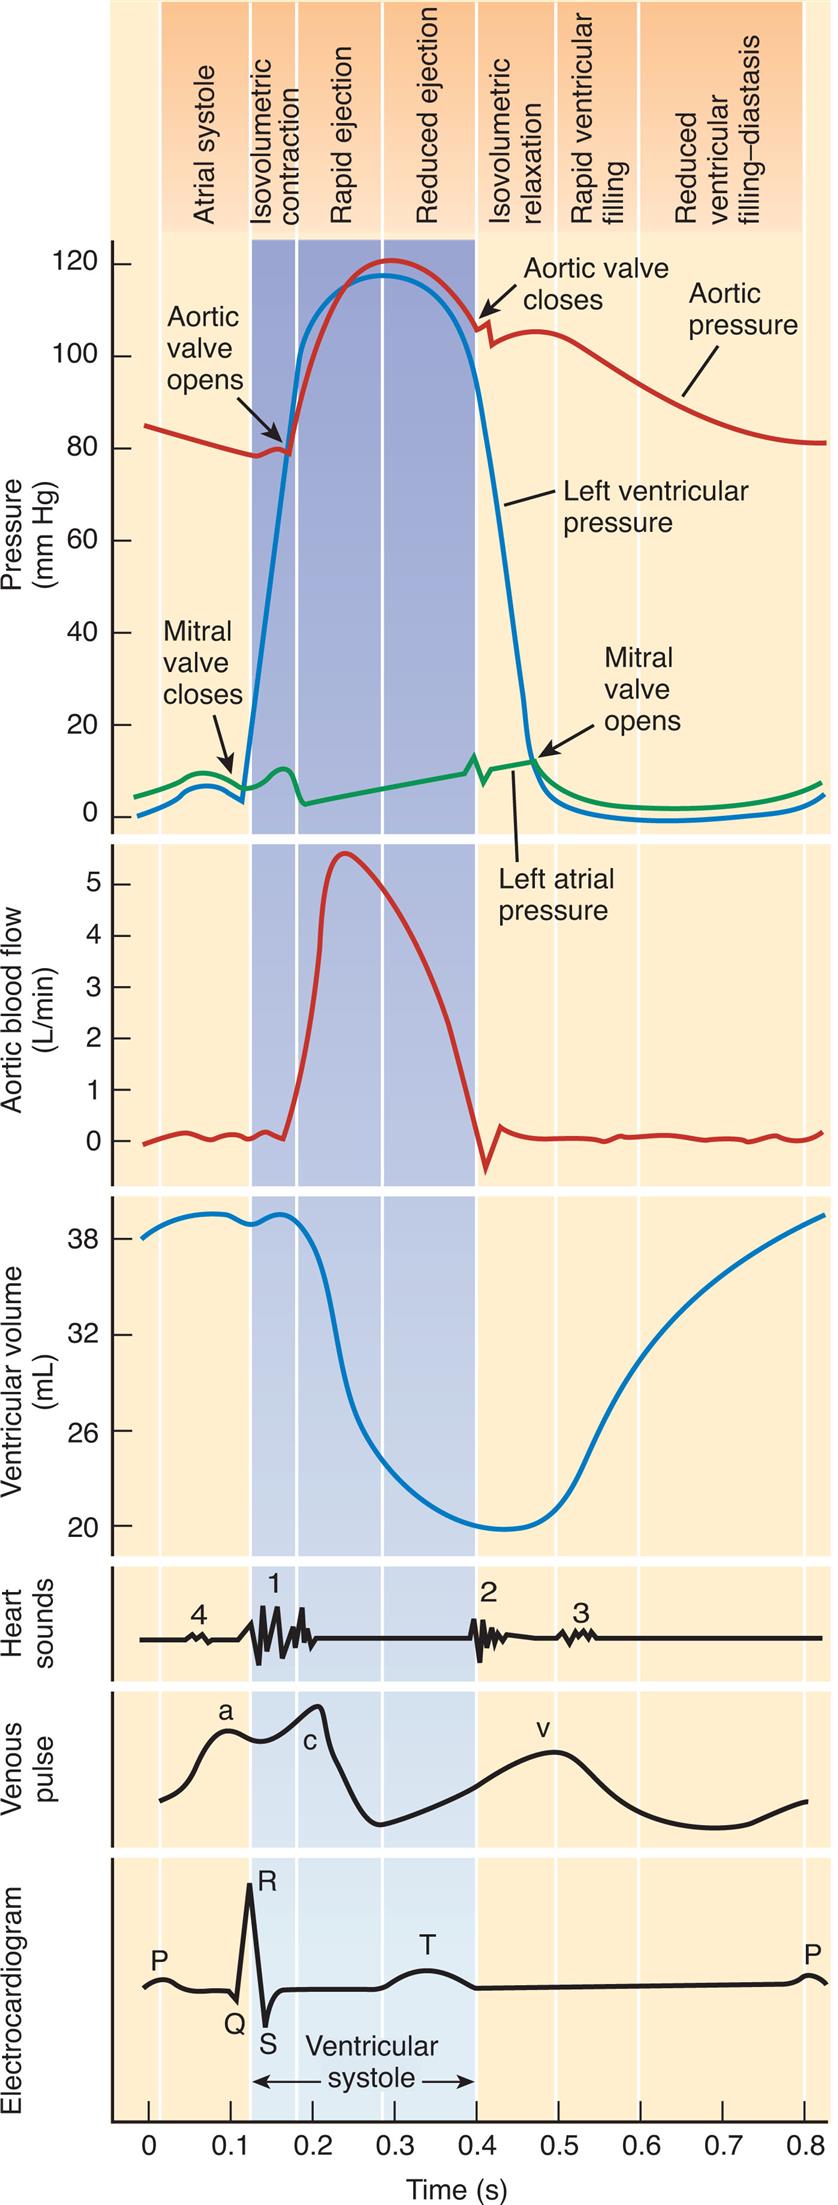
This chart is a composite of several diagrams of heart function (cardiac pumping cycle, blood pressure, blood flow, volume, heart sounds, venous pulse, and an electrocardiogram [ECG]), all on the same time scale.
Five sets of graphs represent the rhythm of the cardiac pumping cycle depending on pressure, aortic blood flow, ventricular volume, heart sounds, venous pulse, and electrocardiogram, all on the same time scale and the on top indicates atrial systole, Isovolumetric contraction, reduced ejection, isovolumetric relaxation, rapid ventricular filling, and reduced ventricular filling diastasis depending on pressure. The horizontal axis represents the time given in seconds. The first graph represents the cardiac rhythm depending on pressure. The vertical axis represents the pressure given millimeters per mercury, which shows three graphs labeled left ventricular pressure, aortic pressure, and left atrial pressure. Arrow marks indicate that the aortic valve opens, the mitral valve opens, the mitral valve closes, and the aortic valve closes. The second graph depicts the cardiac rhythm depending on aortic blood flow, with the vertical axis representing aortic valve flow given in liters per minute, and the curve is plotted from (0.1, 0), reaching the peak at (0.2, 5), and falls at (0.5, 0). The third graph depicts the cardiac rhythm depending on ventricular volume, with the vertical axis representing ventricular volume given in milliliters. The curve is plotted from (0, 38) slopes down at (0.3, 20), and rises at (0.4, 20) reaching (0.8, 38). The fourth graph depicts the wave pattern of cardiac rhythm depending on heart sounds, venous pulse, and electrocardiogram. The wave pattern of heart sounds represents four-phase at points 1, 0.1; 2, 0.4; 3, 0.6; and 4, 0.1. The wave pattern for venous plus represents three-phase at points a, 0.1; c, 0.2; and v, 0.5. The wave pattern for electrocardiogram represents P at 0; Q at 0.1, R at 0.15; S at 0.2, T at 0.35. All data are approximate.
Venous pressure pulses (like that seen in the jugular vein of the neck) are composed of three waves. The a wave is generated by atrial contraction, which actively fills the right ventricle in end-diastole. The c wave occurs after the a wave during early systole and represents the bulging of the closed tricuspid valve into the right atrium. The v wave corresponds to the passive increase in pressure and volume of the right atrium as it fills in late systole and early diastole. Other aspects of falling venous pressure are defined. The x descent follows the c wave and reflects movement of the lower portion of the right atrium toward the right ventricle during the final phases of ventricular systole The y descent corresponds to the abrupt termination of the downstroke of the v wave during early diastole after the tricuspid valve opens and the right ventricle starts to fill passively.
Blood Flow during the Cardiac Cycle
The pumping action of the heart consists of contraction and relaxation of the heart muscle, or myocardium. Each ventricular contraction and the relaxation that follows it constitute one cardiac cycle (Fig. 31.5). During the period of relaxation, termed diastole, blood fills the ventricles. The ventricular contraction that follows, termed systole, propels the blood out of the ventricles and into the pulmonary and systemic circulations. Contraction of the left ventricle occurs slightly earlier than contraction of the right ventricle.
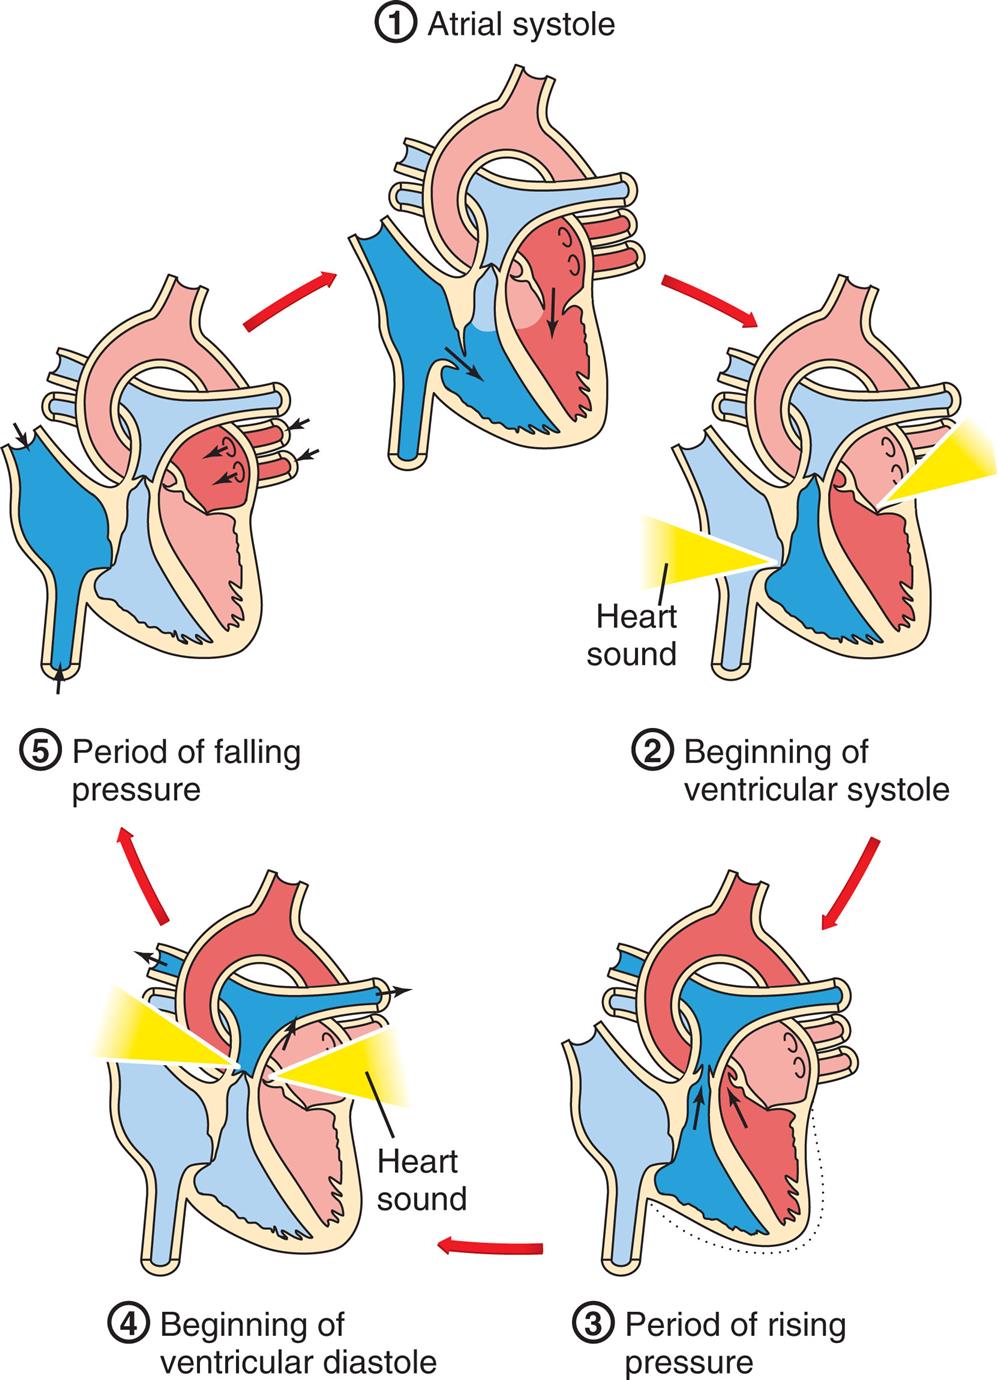
1, Atrial systole. The atria contract, pushing blood through the open tricuspid and mitral valves into the ventricles. The semilunar valves are closed. 2, Beginning of ventricular systole. The ventricles contract, increasing pressure within the ventricles. The tricuspid and mitral valves close, causing the first heart sound. 3, Period of rising pressure. The semilunar valves open when pressure in the ventricle exceeds that in the arteries. Blood spurts into the aorta and pulmonary arteries. 4, Beginning of ventricular diastole. Pressure in the relaxing ventricles drops below that in the arteries. The semilunar valves snap shut, causing the second heart sound. 5, Period of falling pressure. Blood flows from the veins into the relaxed atria. The tricuspid and mitral valves open when pressure in the ventricles falls below that in the atria. (Adapted from Solomon E. Introduction to human anatomy and physiology, 4th edition. St. Louis: Saunders; 2016.)
A cycle diagram shows the five phases of the cardiac cycle as follows. 1. Atrial systole. 2. Beginning of ventricular systoles. 3. Period of rising pressure. 4. Beginning of ventricular diastole. 5. Period of falling pressure.
During ventricular systole, blood from the veins of the systemic circulation enters the thin-walled right atrium from the superior and inferior venae cavae (see Figs. 31.2 and 31.3). Venous blood from the coronary circulation enters the right atrium through the coronary sinus. The right atrium fills, which, along with the falling right ventricular pressures, allows the right AV (tricuspid) valve to open and fill the right ventricle during ventricular diastole (occasionally called atrial systole). The same sequence of events occurs a split second earlier in the left heart. The four pulmonary veins, two from the right lung and two from the left lung, carry blood from the pulmonary circulation to the left atrium. As the left atrium fills and left ventricular pressure falls, the mitral valve opens and blood flows into the left ventricle. Left atrial contraction, termed atrial kick, provides significant increases in the volume of blood entering the left ventricle at the end of diastole. Filling of the right and left ventricles occurs during one period of diastole. Five phases of the cardiac cycle can be identified (see Figs. 31.4 and 31.5). The cardiac cycle is said to begin with the opening of the mitral and tricuspid valves and atrial contraction, and to end with the closing of the mitral and tricuspid valves and passive ventricular filling. As blood is pushed through the inflow and outflow tracts of the ventricles, it flows around the crista supraventricularis—the muscle that separates the inflow from the outflow tracts—and is mixed by passing through the strands of the trabeculae carneae.
Structures that Support Cardiac Metabolism: Coronary Circulation
The myocardium and other heart structures are supplied with oxygen and nutrients by the coronary circulation, which is the part of the systemic circulation that occurs within the blood vessels of the heart muscles. The coronary arteries originate at the upper edge of the aortic semilunar valve cusps (Fig. 31.6A and B) and receive blood through openings in the aorta called the coronary ostia. The cardiac veins empty into the right atrium through another ostium, the opening of a large vein called the coronary sinus (see Fig. 31.6C). (The Regulation of the Coronary Circulation section describes the regulation of this mechanism, which is similar to regulation of flow through systemic and pulmonary vessels.)

(A) Arteries. (B) Coronary artery openings from the aorta. (C) Veins. Both A and C are anterior views of the heart. Vessels near the anterior surface are more darkly colored than vessels of the posterior surface seen through the heart. (A and C, From Patton KT, Thibodeau GA. Anatomy & physiology, 7th edition. St. Louis: Mosby; 2010. B, Patton KT, Thibodeau GA. The human body in health & disease, 6th edition. St. Louis: Mosby; 2014.)
Top-left panel, A. An illustration of the heart shows and labels the following structures, clockwise from the top: pulmonary trunk, left coronary artery (L C A), circumflex artery, left marginal artery, left anterior descending, posterior interventricular artery, right marginal artery, right coronary artery (R C A), aortic semilunar valve, aorta, and superior vena cava. Top-right panel, B. Two illustrations showing a magnified view of the aorta illustrate ventricular contraction and ventricular relaxation. • Ventricular contraction, aortic valve open. Blood flows into the aortic valve. • Ventricular relaxation, aortic valve closed. Backflow of blood closes valve and fills coronary arteries. Blood flows into the right and left coronary artery and to myocardium. Bottom panel, C. An illustration of the heart shows and labels the following structures, clockwise from the top: aorta, pulmonary trunk, great cardiac vein, coronary sinus, left marginal artery, middle cardiac vein, left anterior descending, small cardiac vein, and superior vena cava.
Coronary Arteries
The major coronary arteries, the right coronary artery (RCA) and the left coronary artery (LCA) (see Fig. 31.6A), traverse the epicardium, myocardium, and endocardium and branch to become arterioles and then capillaries. The LCA arises from a single ostium behind the left cusp of the aortic semilunar valve. It generally divides into the left anterior descending (LAD) artery (supplies blood to portions of the left and right ventricles and much of the interventricular septum), and the circumflex artery (supplies blood to the left atrium and the lateral wall of the left ventricle). The RCA originates from an ostium behind the right aortic cusp. It branches into the conus (supplies blood to the upper right ventricle), right marginal branch (supplies the right ventricle to the apex), and posterior descending branch (supplies smaller branches to both ventricles). Because women's hearts weigh proportionally less than men's hearts, the coronary arteries are smaller in women.
Collateral Arteries
Collateral arteries are connections, or anastomoses, between branches of the same coronary artery or connections of branches of the right coronary artery with branches of the left. The epicardium contains more collateral vessels than the endocardium. New collateral vessels are formed through two processes: arteriogenesis (new artery growth branching from preexisting arteries) and angiogenesis (growth of new capillaries within a tissue). This collateral growth is stimulated by shear stress, an increased blood flow speed within and just beyond areas of stenosis, or narrowing, as well as the production of growth factors and cytokines. The collateral circulation assists in supplying blood and oxygen to myocardium that has become ischemic following gradual stenosis of one or more major coronary arteries (coronary artery disease). Unfortunately, diabetes, which predisposes to coronary artery disease, also impedes collateral formation because of increased production of antiangiogenic factors, such as endostatin and angiostatin. Current research is focused on identifying whether some factors that stimulate collateral growth might be useful treatments for myocardial ischemia.4
Coronary Capillaries
The heart requires an extensive capillary network to function. Blood travels from the arteries to the arterioles and then into the capillaries, where oxygen and other nutrients enter the myocardium while waste products enter the blood. At rest, the heart extracts 70% to 80% of the oxygen delivered to it, and coronary blood flow is directly correlated with myocardial oxygen consumption. Any alteration of the cardiac muscles dramatically affects blood flow in the capillaries. For example, in ventricular hypertrophy (enlargement of the ventricular myocardium), the capillary network does not expand along with muscle fiber size. Therefore, the same number of capillaries must now perfuse a larger area. This results in decreased exchange of oxygen and nutrients.
Coronary Veins and Lymphatic Vessels
After passing through the capillary network, blood from the coronary arteries drains into the cardiac veins located alongside the arteries. Most of the venous drainage of the heart occurs through veins in the visceral pericardium. The veins then feed into the great cardiac vein and coronary sinus on the posterior surface of the heart, between the atria and ventricles, in the coronary sulcus (see Fig. 31.6C).
There is an extensive system of lymphatic capillaries and collecting vessels within the layers of the myocardium and the valves. With cardiac contraction, the lymphatic vessels drain fluid to lymph nodes in the anterior mediastinum that empty into the superior vena cava. The cardiac lymphatics maintain tissue fluid homeostasis, allow immune cells to move in and out of the heart tissue, aid in nutritional lipid transport, and participate in reverse cholesterol transport (see Emerging Science Box: Coronary Lymphatics in Health and Disease).5
Structures that Control Heart Action
Life depends on continuous repetition of the cardiac cycle (systole and diastole), which requires the transmission of electrical impulses, termed cardiac action potentials, through the myocardium.6 (Action potentials are described in Chapters 1 and 3.) As an electrical impulse passes from cell to cell (fiber to fiber) in the myocardium, it stimulates an intracellular process that results in fiber shortening—that is, muscular contraction or systole. Between action potentials, the fibers relax and return to their resting length, causing diastole. The muscle fibers of the myocardium are electrically coupled so that action potentials pass from cell to cell very rapidly and efficiently. The myocardial structures that allow the action potentials to move so rapidly through the heart are the gap junctions in the intercalated discs. In the intercalated discs, the channel-forming proteins, called connexins, form pores in the gap junctions.7 As a result of these structures plus the heart's conduction system, an action potential generated in one part of the myocardium passes very quickly throughout the heart, causing rapid, organized, sequential contraction of the atria and then the ventricles.
The myocardium contains its own conduction system—a collection of specialized cells that enable the myocardium to generate and transmit action potentials without input from the nervous system (Fig. 31.7). Cells that initiate signals are called pacemakers. The pacemaker cells are concentrated at two sites in the myocardium, called nodes: the sinoatrial node and the atrioventricular node. The cardiac cycle is stimulated by these nodes of specialized cells. Although the heart is innervated by the autonomic nervous system (both sympathetic and parasympathetic fibers), neural impulses are not needed to maintain the cardiac cycle. Thus the heart will beat in the absence of any innervation, one of the many factors that allow heart transplantation to be successful. The cardiac cycle is adjusted to the physical needs of the body by the autonomic fibers.
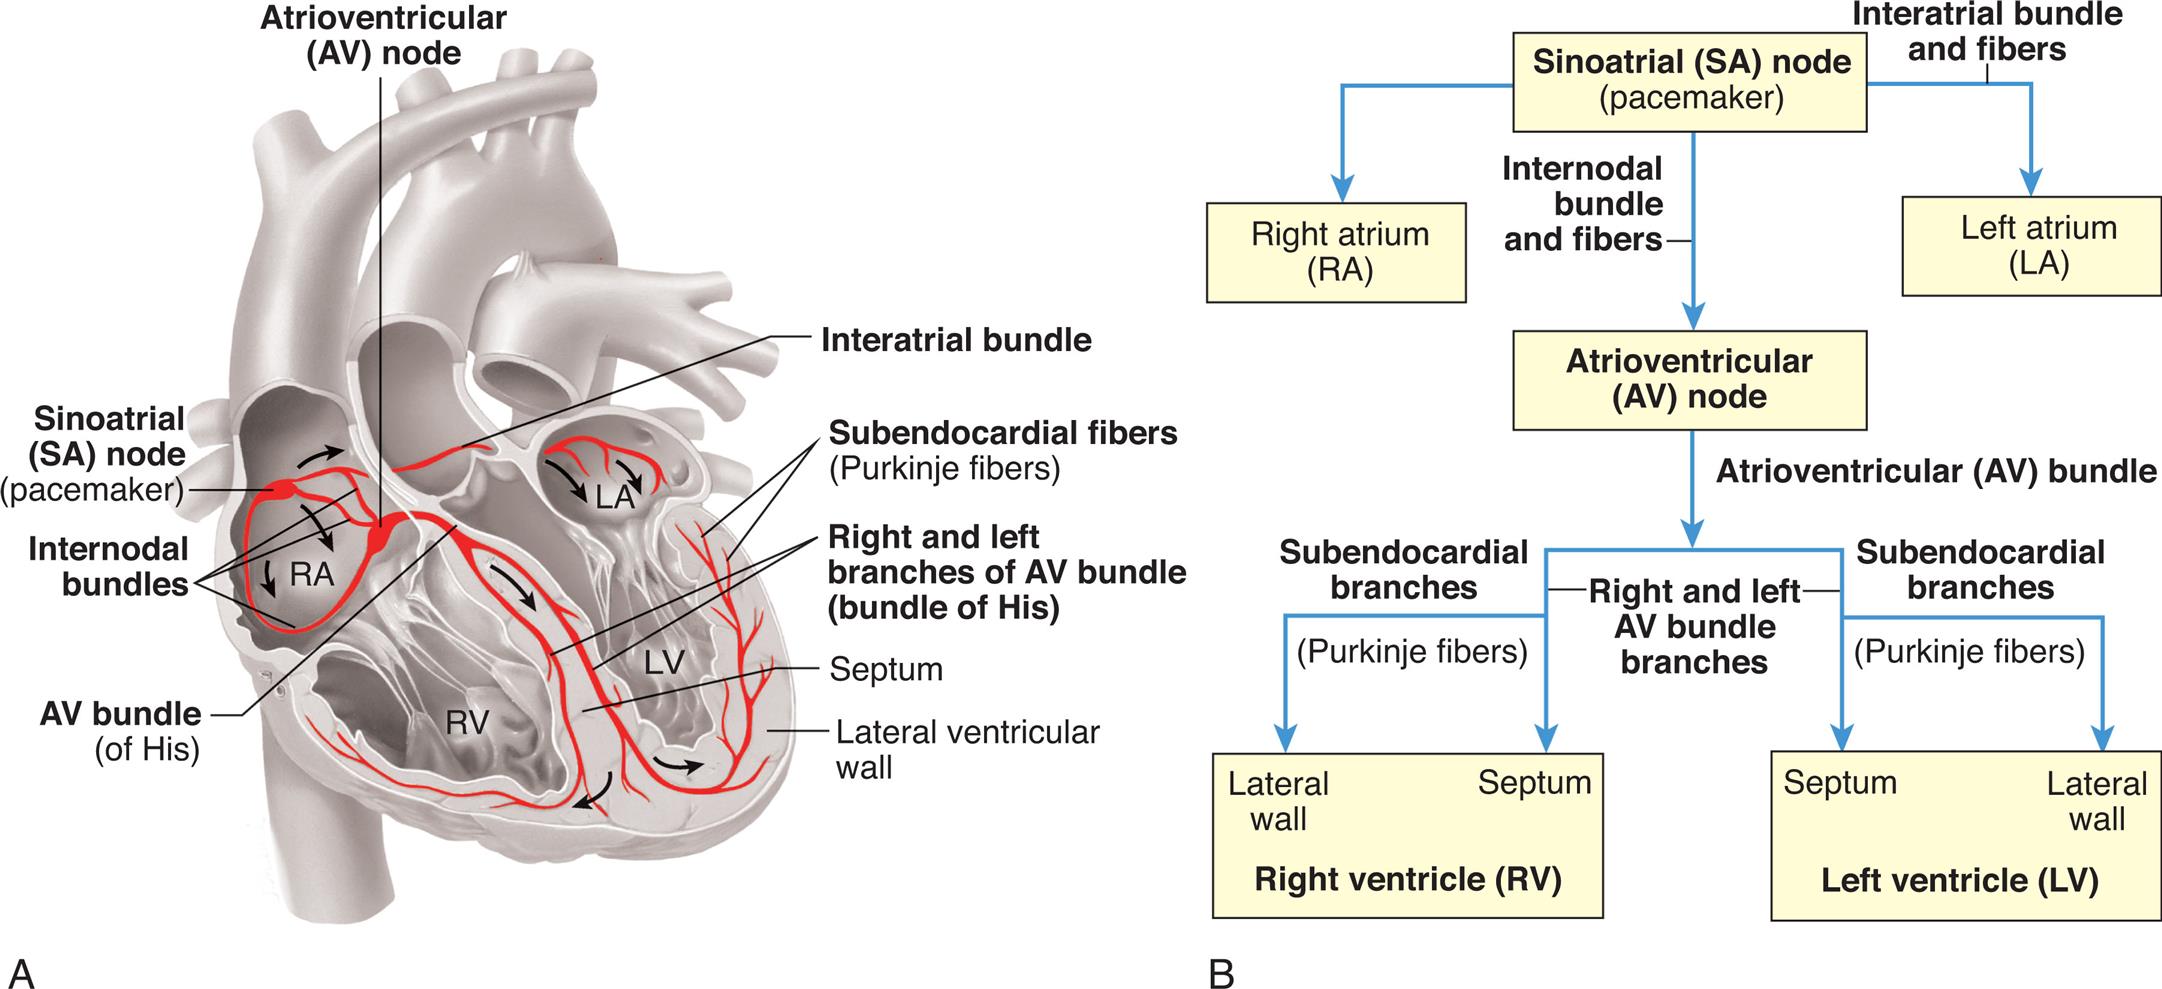
Specialized cardiac muscle cells (boldface type) in the wall of the heart rapidly initiate or conduct an electrical impulse throughout the myocardium. Both the sketch of the conduction system (A) and the flowchart (B) show the origin and path of conduction. The signal is initiated by the SA node (pacemaker) and spreads to the rest of the right atrial myocardium directly, to the left atrial myocardium by way of a bundle of interatrial conducting fibers, and to the AV node by way of three internodal bundles. The AV node then initiates a signal that is conducted through the ventricular myocardium by way of the AV bundle (of His) and subendocardial branches (Purkinje fibers). (From Patton KT, Thibodeau GA. The human body in health & disease, 7th edition. St. Louis: Mosby; 2018.)
Left panel, A. An illustration of the coronal cross-section of the heart shows and labels the following structures, clockwise from the top: atrioventricular (A V) node, interatrial bundle, subendocardial fibers (Purkinje fibers), right and left branches of A V bundle (bundle of His), septum, lateral ventricular wall, A V bundle (of His), internodal bundles, and sinoatrial (S A) node (pacemaker). Right panel, B. A flowchart tracks the conduction path. 1. Sinoatrial (S A) node (pacemaker). Leads to 2, 3 (through interatrial bundle and fibers), and 4 (through internodal bundle and fibers). 2. Right atrium (R A). 3. Left atrium (L A). 4. Atrioventricular (A V) node. Leads to 5 (through atrioventricular bundle). 5. Right ventricle (R V): lateral wall and septum. 6. Left ventricle (L V): lateral wall and septum.
Heart action is also influenced by substances delivered to the myocardium in coronary blood. Nutrients and oxygen are needed for cellular survival and normal function. Hormones and biochemical substances, including medications, can affect the strength and duration of myocardial contraction and the degree and duration of myocardial relaxation. Normal or appropriate function depends on the supply of these substances, which is why coronary artery disease can seriously disrupt heart function.
Conduction System
Normally, electrical impulses arise in the sinoatrial (SA) node (sinus node), the usual pacemaker of the heart. The SA node is located at the junction of the right atrium and superior vena cava, just superior to the tricuspid valve (see Fig. 31.7). It sits only 1 mm beneath the visceral pericardium, making it vulnerable to injury and disease, especially pericardial inflammation. The SA node is nourished by the sinus node artery, which passes through the center of the node. The SA node is heavily innervated by both sympathetic and parasympathetic nerve fibers. In the resting adult the SA node generates about 60 to 100 action potentials per minute, depending on the age and physical condition of the person. Each action potential travels rapidly from cell to cell and through the atrial myocardium as well as through interatrial and internodal fibers, carrying the action potential onward to the atrioventricular (AV) node, as well as causing both atria to contract, beginning systole (see Fig. 31.7).
The AV node, located in the right atrial wall superior to the tricuspid valve and anterior to the ostium of the coronary sinus, conducts the action potentials onward to the ventricles. It is innervated by nerves from the autonomic parasympathetic ganglia that serve as receptors for the vagus nerve and cause slowing of impulse conduction through the AV node.
Conducting fibers from the AV node converge to form the bundle of His (atrioventricular bundle), within the posterior border of the interventricular septum. The bundle of His then gives rise to the right and left bundle branches. The right bundle branch (RBB) is thin and travels without much branching to the right ventricular apex. Because of its thinness and relative lack of branches, the RBB is susceptible to interruption of impulse conduction by damage to the endocardium. The left bundle branch (LBB) divides into two branches, or fascicles. The left anterior bundle branch (LABB) passes the left anterior papillary muscle and the base of the left ventricle and crosses the aortic outflow tract. Damage to the aortic valve or the left ventricle can interrupt this branch. The left posterior bundle branch (LPBB) travels posteriorly, crossing the left ventricular inflow tract to the base of the left posterior papillary muscle. This branch spreads diffusely through the posterior inferior left ventricular wall. Blood flow through this portion of the left ventricle is relatively nonturbulent, so the LBB is somewhat protected from injury caused by wear and tear.
The Purkinje fibers are the terminal branches of the RBB and LBB (see Fig. 31.7). They extend from the ventricular apexes to the fibrous rings and penetrate the heart wall to the outer myocardium. The first areas of the ventricles to be excited are portions of the interventricular septum. The septum is activated from both the RBB and the LBB. The extensive network of Purkinje fibers promotes the rapid spread of the impulse to the ventricular apexes. The basal and posterior portions of the ventricles are the last to be activated.
Cardiac excitation
From the SA node, the impulse that begins systole spreads throughout the right atrium at a conduction velocity of about 35 cm/s.8 The action potential is delayed in the region of the AV node, possibly because of electrophysiologic differences in the cells that comprise the AV region. Conduction velocity within the node is about 10 cm/s, markedly slower than conduction through the atria. The delay between atrial and ventricular excitation permits an additional boost to ventricular filling by atrial contraction (atrial kick). From the AV node the impulse travels from the AV bundle and through the bundle branches to the Purkinje fibers. Conduction velocities in the AV and Purkinje fibers are the most rapid in the heart.
Ventricular activation occurs sequentially in three phases: (1) septal activation, (2) apical activation, and (3) basal (upper) and posterior activation. The first areas of the ventricles to be excited are portions of the interventricular septum. The septum is activated from both the RBB and the LBB, although the impulse travels from left to right. The extensive network of Purkinje fibers promotes the rapid spread of the impulse to the ventricular apexes. Activation traverses the heart wall from the inside outward (from the endocardium to the epicardium). The basal and posterior portions of the ventricles are the last to be activated. Deactivation, which begins in diastole, occurs in the opposite direction, spreading from the outside inward (epicardium to endocardium). All areas of the ventricle recover at about the same time.
Propagation of cardiac action potentials
Electrical activation of the muscle cells, termed depolarization, is caused by the movement of ions, including sodium, potassium, calcium, and chloride, across cardiac cell membranes. Deactivation, called repolarization, occurs the same way. (Movement of ions across cell membranes is described in Chapter 1; electrical activation of muscle cells is described in Chapter 43.)
Movement of ions into and out of the cell creates an electrical (voltage) difference across the cell membrane, called the membrane potential. The resting membrane potential of myocardial cells is between −80 and −90 mV, whereas that of the SA node is between −50 and −60 millivolts and that of the AV node is between −60 and −70 mV.8 During depolarization, the inside of the cell becomes less negatively charged as positive ions move inside. In cardiac cells, as in other excitable cells, when the resting membrane potential (in millivolts) becomes less negative with depolarization and reaches the threshold potential for cardiac cells, a cardiac action potential is fired. The various phases of the cardiac action potential are related to changes in the permeability of the cell membrane to sodium, potassium, chloride, and calcium. Threshold is the point at which the cell membrane's selective permeability to these ions is temporarily disrupted, leading to an “all or nothing” depolarization. Drugs that alter the movement of these ions (e.g., calcium) have profound effects on the action potential and can alter heart rate. If the resting membrane potential becomes more negative because of a decrease in the extracellular potassium concentration (hypokalemia), it is termed hyperpolarization.
Normal myocardial cell depolarization and repolarization occur in five phases numbered 0 through 4 (Fig. 31.8). Phase 0 consists of depolarization. This phase lasts 1 to 2 ms and represents rapid sodium entry into the cell. Phase 1 is early repolarization, in which calcium slowly enters the cell. Phase 2, also called the plateau, is a continuation of repolarization, with slow entry of calcium and sodium into the cell. Potassium is moved out of the cell during phase 3, with a return to resting membrane potential in phase 4.8 The time between action potentials corresponds to diastole.

(A) Ventricle. (B) Sinoatrial (SA) node. (C) Atrium. Sweep velocity in (B) is half that in (A) or (C). (Modified from Koeppen BM, Stanton BA. Berne and Levy Physiology, 6th edition. Philadelphia: Mosby; 2010.)
Illustration A depicts the action potential of a ventricle indicating four phases and points are as follows. (0, minus 40), (1, 20), (3, minus 40), (4, minus 90). All data are approximate. Illustration B depicts the action potential of S A node indicating two phases and points are as follows. (4, minus 60), (0, 30), (3, minus 40). All data are approximate. Illustration C depicts the action potential of the atrium indicating four phases and points are as follows. (0, minus 30), (1, 10), (3, minus 40), (4, minus 80). All data are approximate.
The phases of depolarization and repolarization occur somewhat differently in the SA and AV node cells, a difference that enables these cells to generate cardiac action potentials independently. The cells of the Purkinje fibers, atria, and ventricles begin with a negative resting membrane potential and proceed to a rapid upstroke, or depolarization (phase 0), a rapid early repolarization (phase 1), a plateau (phase 2), and a rapid later repolarization (phase 3) (see Fig. 31.8 A and C). The fast inward current of phase 0 is mediated by sodium ions flowing through “fast channels” in the cell membrane and causes the rapid upstroke of the action potential in Purkinje fibers, atria, and ventricles. In contrast, the cells of the SA and AV nodes begin with a less negative resting membrane potential, proceed to a slow upstroke (phase 0), and usually lack a plateau (phase 2) (see Fig. 31.8B). The slow inward current, mediated by calcium through transient and long-lasting channels and sodium ions flowing through “slow channels” of the cell membrane, is responsible for the action potential of the SA node and the AV node. Hence, drugs that block calcium have profound effects on the slow inward current and can alter heart rate. Slow channel-blocking drugs, such as verapamil, are used to treat a variety of cardiovascular disorders.
The absolute refractory period, during which no new cardiac action potential can be initiated by a stimulus, no matter the strength, follows depolarization. The absolute refractory period corresponds to the time needed for the reopening of channels that permit sodium and calcium influx (phase 0 through half of phase 3). A relative refractory period occurs near the end of repolarization. During this time, the membrane can be depolarized again but only by a greater than normal stimulus. Abnormal refractory periods as a result of disease can cause abnormal heart rhythms or dysrhythmias, including ventricular fibrillation and cardiac arrest (see Chapter 32).
The electrocardiogram
An electrocardiogram originates from myocardial cell electrical activity as recorded by skin electrodes and is the summation of all the cardiac action potentials (Fig. 31.9). The P wave represents atrial depolarization. The PR interval is a measure of time from the onset of atrial activation to the onset of ventricular activation. The PR interval represents the time necessary for electrical activity to travel from the sinus node through the atrium, AV node, and His-Purkinje system to activate ventricular myocardial cells. The QRS complex represents the sum of all ventricular muscle cell depolarization. The configuration and amplitude of the QRS complex may vary considerably among individuals. During the ST interval, the entire ventricular myocardium is depolarized. The QT interval is sometimes called the electrical systole of the ventricles but the time it takes varies inversely with the heart rate. The T wave represents ventricular repolarization.
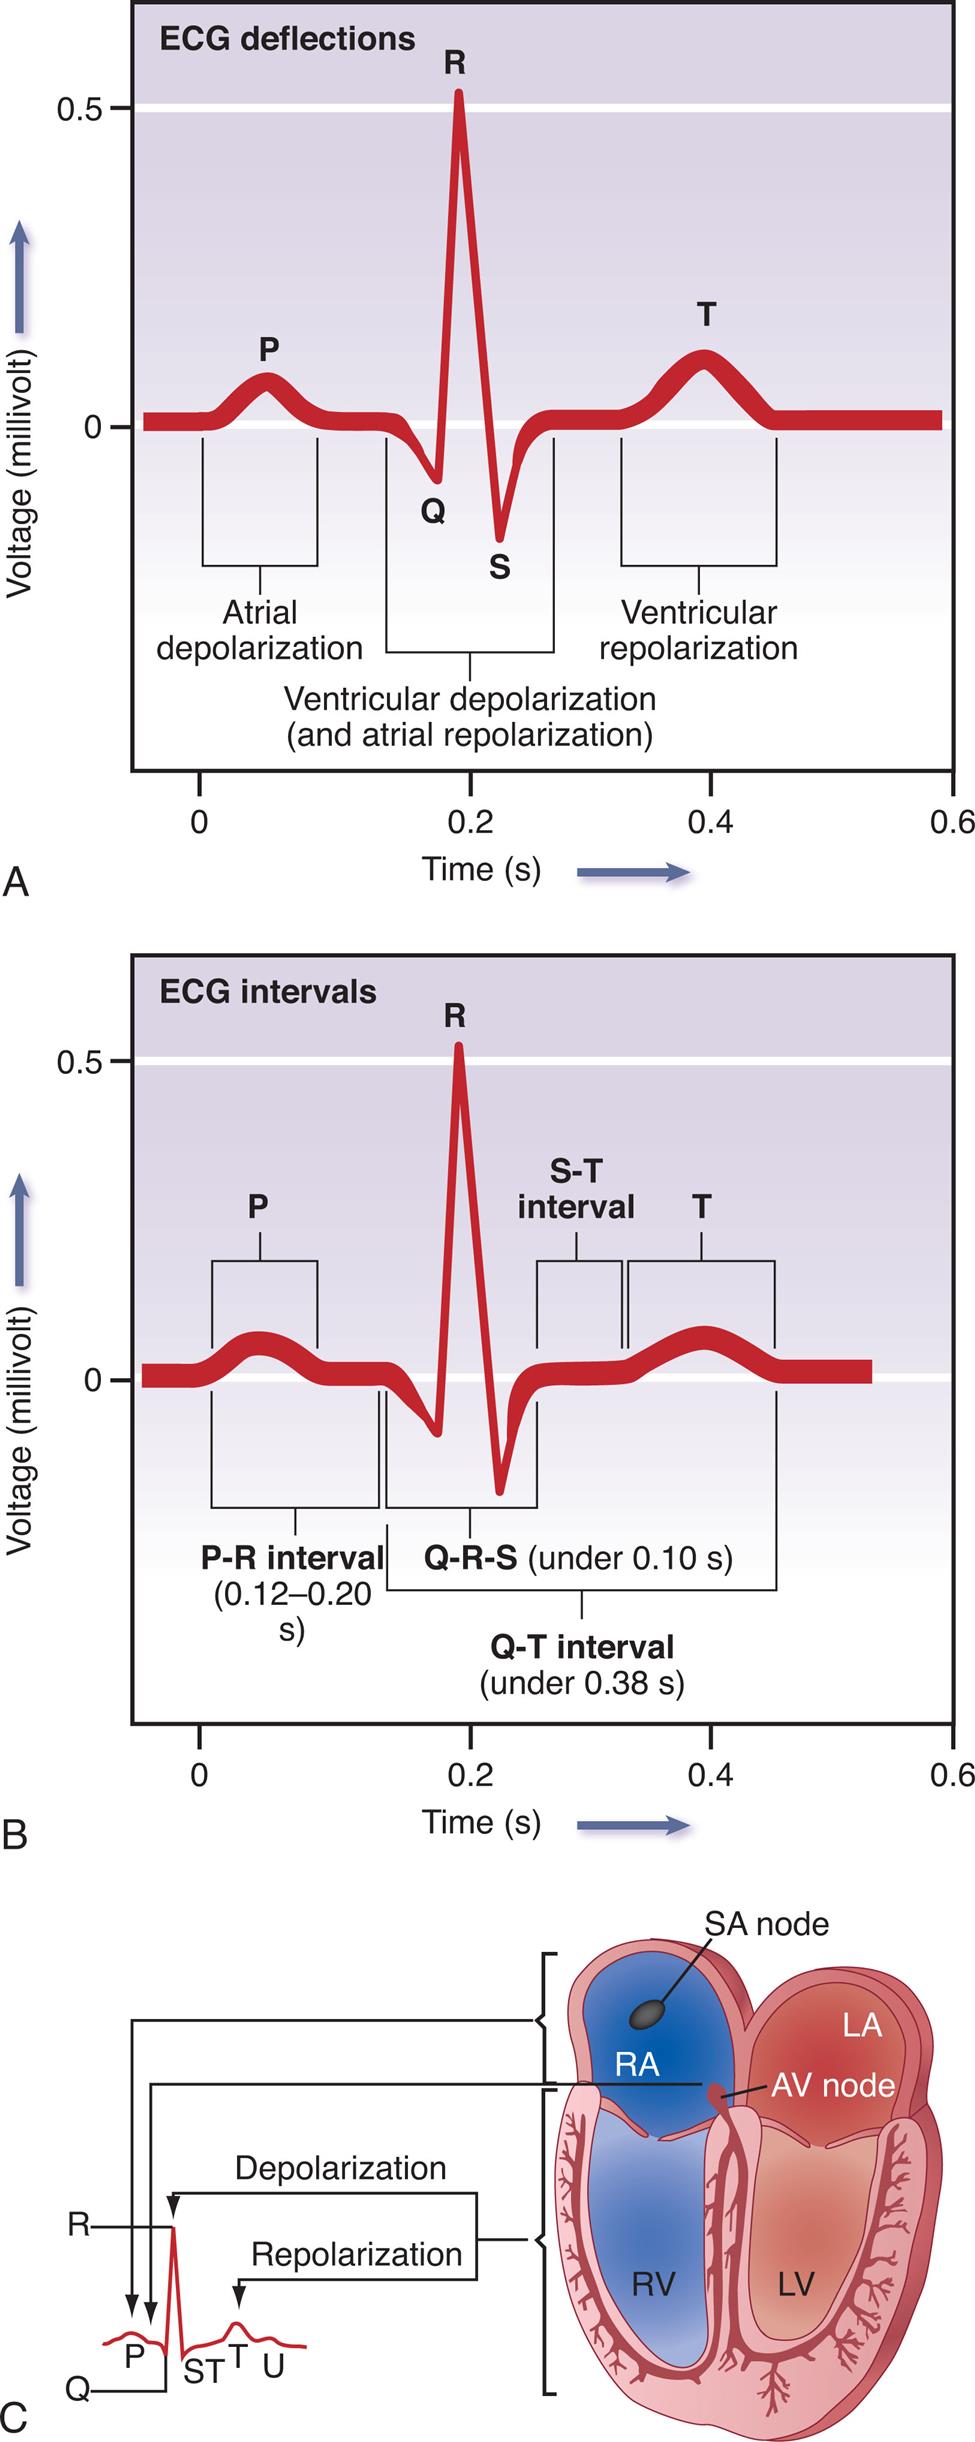
(A) Normal ECG. Depolarization and repolarization. (B) ECG intervals among P, QRS, and T waves. (C) Schematic representation of ECG and its relationship to cardiac electrical activity. AV, Atrioventricular; LA, left atrium; LBB, left bundle branch; LV, left ventricle; RA, right atrium; RBB, right bundle branch; RV, right ventricle.
Illustration A depicts the tracing for E C G deflections. The horizontal represents the time given in seconds and the vertical axis represents the voltage in millivolt. The E C G tracing comprises P which indicates the atrial depolarization, QRS which indicates the ventricular depolarization and atrial depolarization, and T which indicates the ventricular repolarization. Illustration B depicts the tracing for E C G which shows the E C G intervals among P, QRS, and T waves. The horizontal represents the time given in seconds and the vertical axis represents the voltage in millivolt. The E C G tracing shows the P R interval between 0.12 to 0.20 s, Q R S under 0.10 s, S T interval, and T Illustration B depicts the relationship between cardiac electrical activity and E C G which shows the S A node in right atrium and A V node in left atrium relates to P, depolarization of right ventricle relates to S T, and repolarization of left ventricular relates to T.
Automaticity
Automaticity, or the property of generating spontaneous depolarization to threshold, enables the SA and AV nodes to generate cardiac action potentials without any external stimulus. Cells capable of spontaneous depolarization are called automatic cells. The automatic cells of the cardiac conduction system can stimulate the heart to beat even when it is transplanted and thus has no innervation. Spontaneous depolarization is possible in automatic cells because the membrane potential of these special cells does not actually “rest” during the phase 4 return to the resting membrane potential. Instead, it slowly depolarizes toward threshold during the diastolic phase of the cardiac cycle. Because threshold is approached during diastole, return to the resting membrane potential in automatic cells is called diastolic depolarization. The electrical impulse normally begins in the SA node because its cells depolarize more rapidly than other automatic cells.
Rhythmicity
Rhythmicity is the regular generation of an action potential by the heart's conduction system. The SA node sets the pace because normally it has the fastest rate of depolarization. The SA node depolarizes spontaneously 60 to 100 times per minute. If the SA node is damaged, the AV node can become the heart's pacemaker at a rate of about 40 to 60 spontaneous depolarizations per minute. Eventually, however, conduction cells in the atria usually take over from the AV node. Purkinje fibers are capable of spontaneous depolarization but at an even slower rate than the AV node. Therefore the Purkinje fibers only function as pacemakers when the SA and AV nodes are diseased or there is interruption to movement of electrical current through the heart.
Cardiac Innervation
Sympathetic and parasympathetic nerves
Although the heart's nodes and conduction system are able to generate action potentials independently, the autonomic nervous system influences both the rate of impulse generation (firing), depolarization, and repolarization of the myocardium, and the strength of atrial and ventricular contraction. Autonomic neural transmission produces changes in the heart and circulatory system faster than metabolic or humoral agents. Speed is important, for example, in stimulating the heart to increase its pumping action with increased physical activity or during times of stress and fear—the so-called fight or flight response. Although increased delivery of oxygen, glucose, hormones, and other blood-borne factors sustains increased cardiac activity, the rapid initiation of increased activity depends on the sympathetic and parasympathetic fibers of the autonomic nervous system.
Sympathetic and parasympathetic nerve fibers innervate all parts of the atria and ventricles and the SA and AV nodes. Efferent sympathetic and parasympathetic fibers join at the cardiac plexus, a neural junction located at the root of the aorta in front of the trachea. The cardiovascular center in the brainstem responds to input from higher brain centers and from sensory receptors in the periphery and modulates sympathetic and parasympathetic nerve activation (Fig. 31.10) In general, sympathetic stimulation increases electrical conductivity and the strength of myocardial contraction, and vagal parasympathetic nerve activity does the opposite, slowing the conduction of action potentials through the heart and reducing the strength of contraction. Thus the sympathetic and parasympathetic nerves affect the speed of the cardiac cycle (heart rate, or beats per minute). Sympathetic nervous activity enhances myocardial performance. Stimulation of the SA node by the sympathetic nervous system rapidly increases heart rate. The sympathetic nervous system may also induce an increased influx of calcium (Ca2+), which increases the contractile strength of the heart and the speed of electrical impulses through the heart muscle and the nodes. Finally, sympathetic nerves influence the diameter of the coronary vessels. Increased sympathetic discharge dilates the coronary vessels by causing the release of vasodilating metabolites resulting from increased myocardial contraction.
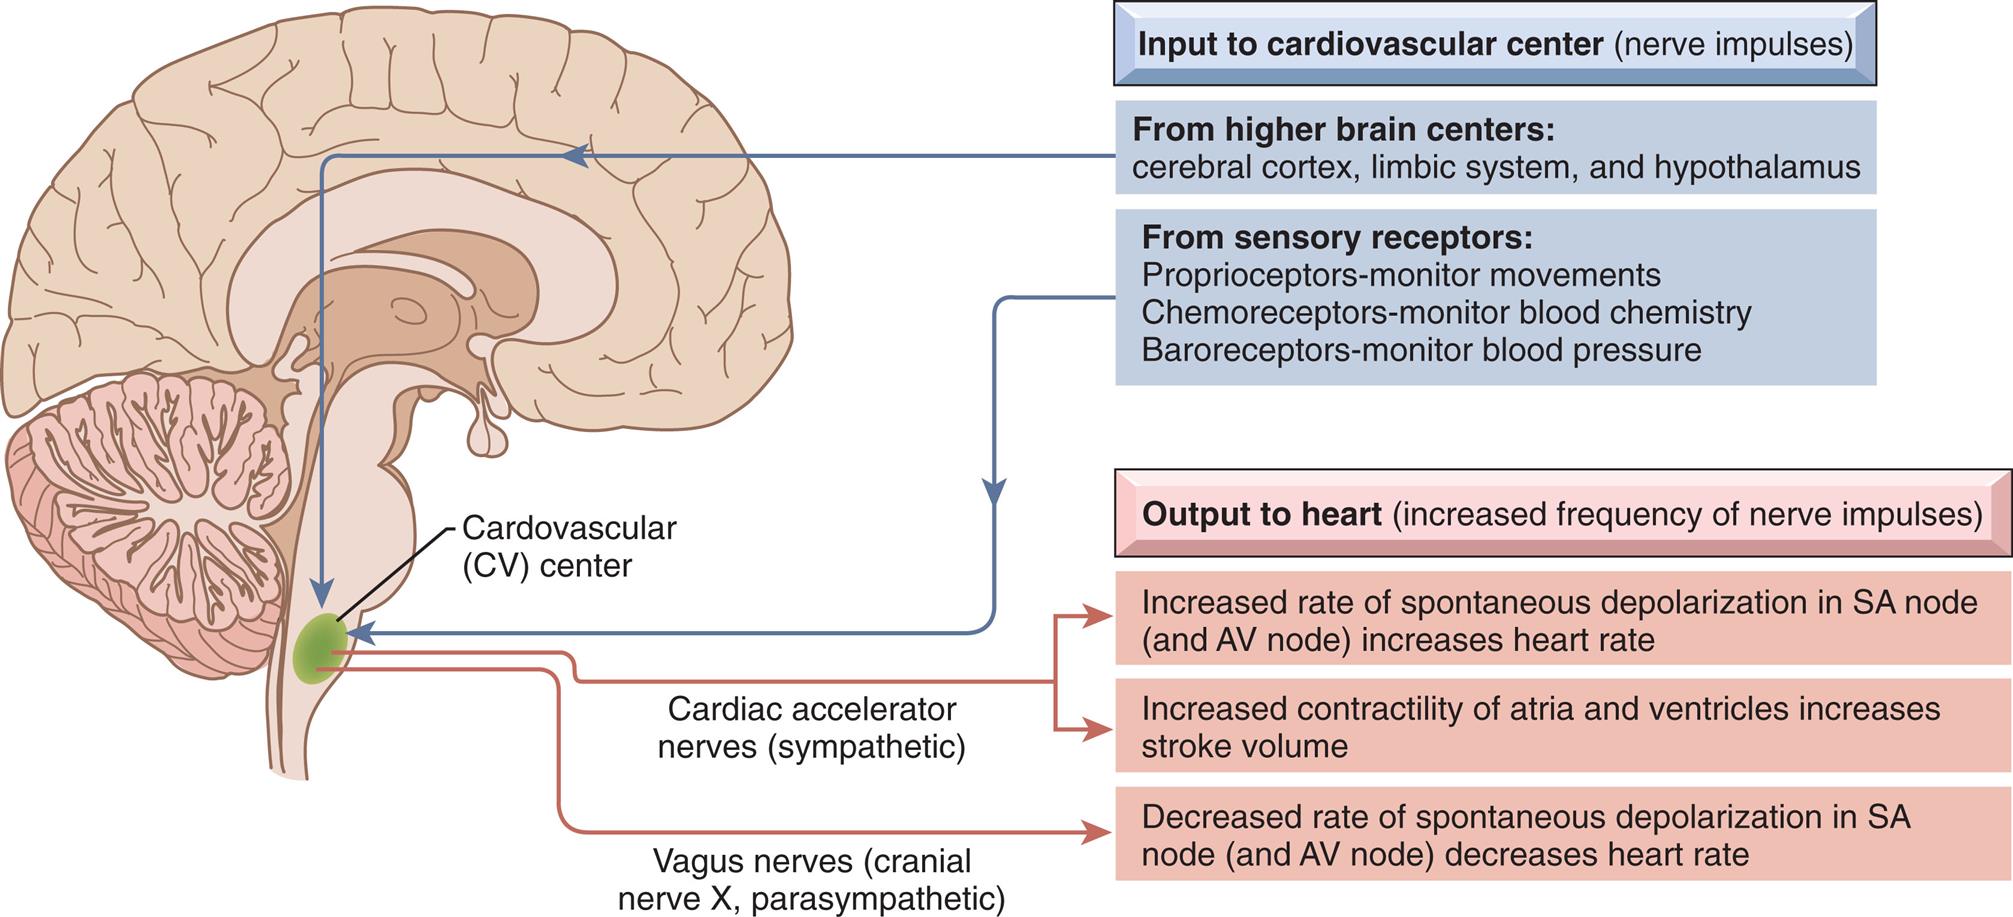
Input to the cardiovascular center and output to the heart.
A right lateral illustration of the brain highlights the cardiovascular (C V) center at the base of the brain. The inputs to the cardiovascular center (nerve impulses) are as follows. • From higher brain centers: cerebral cortex, limbic system, and hypothalamus. • From sensory receptors: Proprioceptors-monitor movements, chemoreceptors-monitor blood chemistry, and baroreceptors-monitor blood pressure. The outputs to the heart (increased frequency of nerve impulses) are as follows. • Cardiac accelerator nerves (sympathetic): Increased rate of spontaneous depolarization in S A node (and A V node) increases heart rate. Increased contractility of atria and ventricles increases stroke volume. • Vagus nerves (cranial nerve X, parasympathetic): Decreased rate of spontaneous depolarization in S A node (and A V node) decreases heart rate.
The parasympathetic nervous system affects the heart through the vagus nerve, which releases acetylcholine. Receptors for acetylcholine are found in the myocardium and coronary vessels of the heart. Acetylcholine causes a decreased heart rate, slows conduction through the AV node, and reduces myocardial contraction strength.
Adrenergic receptor function
Sympathetic neural stimulation of the myocardium and coronary vessels depends on the presence of G-protein–coupled adrenergic receptors, which bind specifically with neurotransmitters of the sympathetic nervous system. The effects of sympathetic stimulation depend on whether the α- or β-adrenergic receptors are most plentiful on cells of the effector tissue and whether the neurotransmitter is norepinephrine or epinephrine. Individual variations in receptor structure also influence receptor responsiveness.9 There are five types of adrenergic receptors: β1, β2, β3, α1, and α2. (Each of the α-adrenergic receptors also has three subtypes, so some sources indicate that there are nine types of adrenergic receptors.) Overall, cardiovascular structures have more β- than α-receptors; therefore, effects mediated by the β-receptors predominate. Norepinephrine is released by postsynaptic sympathetic nerve endings in the heart, whereas epinephrine is mainly released by the adrenal medulla and reaches the heart through the bloodstream.
The β1-receptors are found mostly in the heart, specifically the conduction system (AV and SA nodes, Purkinje fibers) and the atrial and ventricular myocardium. The β2-receptors are found in the heart and also on vascular smooth muscle. Stimulation of both the β1- and β2-receptors results in an increase in heart rate (chronotropy) and force of myocardial contraction (inotropy).6 In addition, stimulation of the β2-receptors results in vasodilation because of the location of the receptors on vascular smooth muscle. Overall β1 and β2 stimulation enables the heart to pump more blood, and β2 stimulation also increases coronary blood flow. In the heart, stimulation of β3-receptors found in the myocardium and coronary vessels opposes the effects of β1- and β2-receptor stimulation and decreases myocardial contractility (negative inotropic effect).9 Thus, β3-receptors may provide a “safety mechanism” to prevent overstimulation of the heart by the sympathetic nervous system.
Norepinephrine binding with α1-receptors, all of which are postsynaptic in the systemic and coronary arteries, causes smooth muscle contraction and thus vasoconstriction. One of the subtypes of α2-receptors is located on the sympathetic ganglia and nerve terminals. The effect of norepinephrine on these receptors is to inhibit release of more norepinephrine, which promotes vasodilation, thus providing another safety mechanism to prevent excess blood pressure elevation. Dysfunction of α- and β-adrenergic receptors can occur in many conditions (e.g., diabetes, hypertension) and has been implicated in the pathogenesis of many cardiac diseases, including heart failure, myocardial ischemia, and dysrhythmias (see Chapter 32).
Myocardial Cells
Cardiomyocytes are composed of long, narrow fibers that contain bundles of longitudinally arranged myofibrils; a nucleus; mitochondria; an internal membrane system (the sarcoplasmic reticulum); cytoplasm (sarcoplasm); and a plasma membrane (the sarcolemma), which encloses the cell (Fig. 31.11).6 Cardiac and skeletal muscle cells also have an “external” membrane system made up of transverse tubules (T tubules) formed by inward pouching of the sarcolemma. The sarcoplasmic reticulum forms a network of channels that surrounds the muscle fiber.
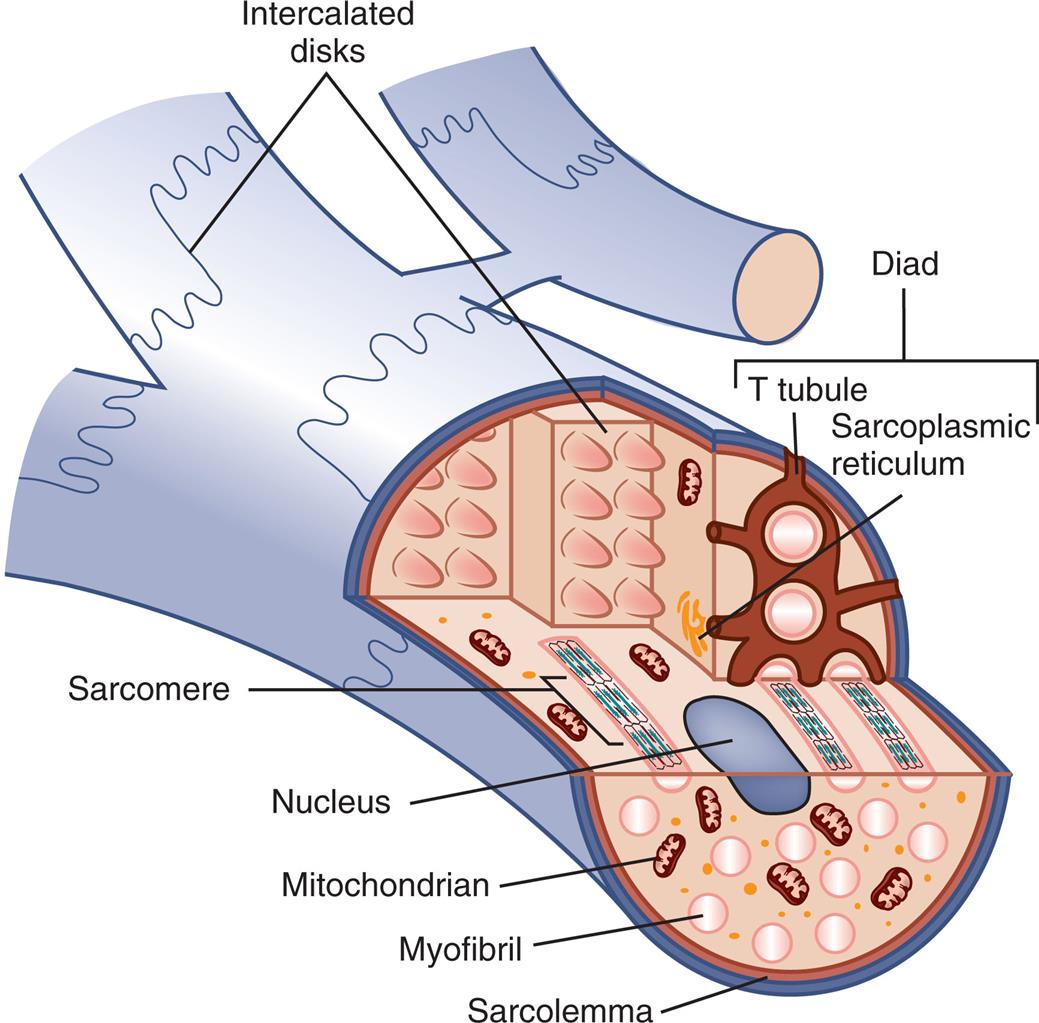
Unlike other types of muscle fibers, cardiac muscle fibers are typically branched with junctions, called intercalated discs, between adjacent myocytes. Like skeletal muscle cells, cardiac muscle cells contain sarcoplasmic reticula and T tubules, although these structures are not as highly organized as in skeletal muscle fibers.
A cutaway illustration of the cardiac muscle fiber shows and labels the following structures: intercalated disks, T tubule, sarcoplasmic reticulum, sarcomere, nucleus, mitochondrion, myofibril, and sarcolemma.
Because the myofibrils in both cardiac and skeletal fibers consist of alternating light and dark bands of protein, the fibers appear striped, or striated. The dark and light bands of the myofibrils create repeating longitudinal units, called sarcomeres, which are between 1.6 and 2.2 μm long (Fig. 31.12). The length of these sarcomeres determines the limits of myocardial stretch at the end of diastole and subsequently the force of contraction during systole. Alterations in sarcomere size are seen in both physiologic and pathologic myocardial hypertrophy.
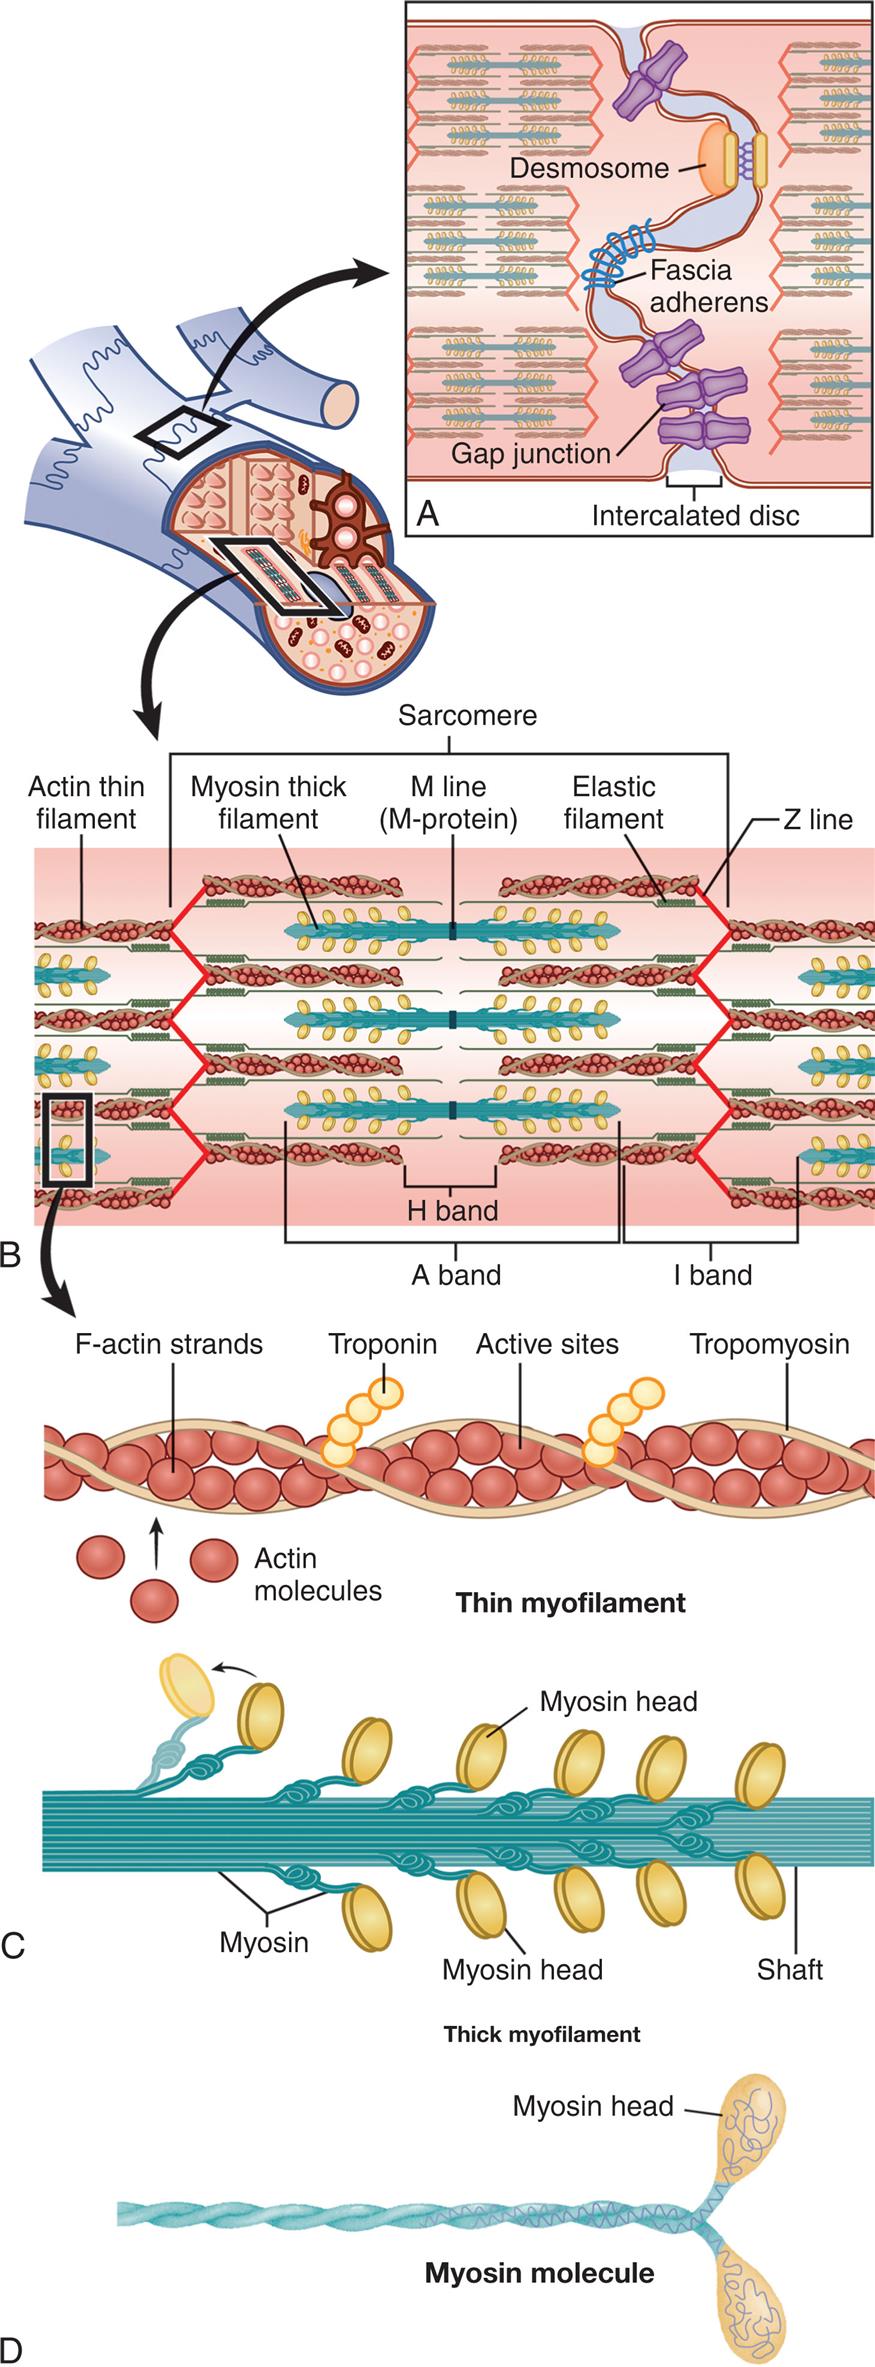
(A) Structure of the intercalated disc with three types of junctions. (B) The sarcomere is the basic contractile unit of a muscle cell. The Z line is the anchor for the contractile elements actin and myosin. Actin attaches directly to the Z line, whereas myosin is attached to it by elastic titin filaments. The myosin filaments are connected to each other by M-protein at the M line. The A, H, and I bands refer to parts of the sarcomere as they were originally seen by light microscopy. (C) Thin myofilament and thick myofilament. (D) Myosin molecule.
A cutaway illustration of the cardiac muscle fiber accompanying four magnified views A through D. Illustration A shows the structure of the intercalated disc. Illustration B shows the structure of the thin myofilament in the sarcomere with labels indicating F-actin strands, troponin, active sites, tropomyosin, and actin molecules. Illustration C shows the structure of the thin myofilament of sarcomere with labels indicating myosin, myosin head, and shaft. Illustration D shows the structure of the myosin molecule with label indicating myosin head.
There are a number of differences between cardiac and muscle cells. Cardiac cells are arranged in branching networks throughout the myocardium, whereas skeletal muscle cells tend to be arranged in parallel units throughout the length of the muscle. Cardiac fibers have only one nucleus, whereas skeletal muscle cells have many nuclei. Differences between cardiac and skeletal muscle often relate to heart function. Some of these functions include:
- 1. Transmit action potentials quickly from cell to cell. Myocardial cells are all electrically and mechanically connected within the wall of a particular heart chamber. Electrical impulses are transmitted rapidly from cardiac fiber to cardiac fiber because the network of fibers connects at intercalated discs, which are thickened portions of the sarcolemma. The intercalated discs contain three junctions: desmosomes, or macula adherens; fascia adherens, which mechanically attach one cell to another; and gap junctions, which allow the electrical impulse to spread from cell to cell through a low-resistance pathway (see Fig. 31.12A). Changes in the function of these junctional elements may cause an increased risk of arrhythmias.10
- 2. Maintain high levels of energy synthesis. Unlike skeletal muscle, the heart cannot rest and is in constant need of energy, which is supplied by molecules such as adenosine triphosphate (ATP). Therefore, the cytoplasm surrounding the bundles of myofibrils in each cardiomyocyte contains a large number of mitochondria (25% to 35% of cell volume, versus 3% to 8% of cell volume in skeletal muscle). Cardiac muscle cells have more mitochondria than skeletal muscle cells to provide the necessary respiratory enzymes for aerobic metabolism and supply quantities of ATP sufficient for the constant action of the myocardium.
- 3. Gain access to more ions, particularly sodium and potassium, in the extracellular environment. Cardiac fibers contain more T tubules than do skeletal muscle fibers (see Fig. 31.11). This increased closeness to the T tubules gives each myofibril in the myocardium faster access to molecules needed for the transmission of action potentials, a process that involves transport of sodium and potassium through the walls of the T tubules. Because the T tubule system is continuous with the extracellular space and the interstitial fluid, it facilitates the rapid transmission of the electrical impulses from the surface of the sarcolemma to the myofibrils inside the fiber. This rapid transmission activates all the myofibrils of one fiber simultaneously. The sarcoplasmic reticulum is located around the myofibrils. As an action potential is transmitted through the T tubules, it induces the sarcoplasmic reticulum to release its stored calcium, thus activating the contractile proteins actin and myosin.
The sarcomere
Within each myocardial sarcomere are myosin and actin molecules that are grouped together to form filaments. Myosin molecules resemble golf clubs with two large, ovoid heads at one end of the shaft (see Fig. 31.12D). The bi-lobed heads contain an actin-binding site and a site of ATPase activity. About 200 myosin molecules are bundled together with their heads facing outward, forming a single thick filament. Actin molecules resemble beads, and they are strung into two chains that wind around each other, forming a thin filament (see Fig. 31.12C).
Several proteins are also present in the sarcomere. A tropomyosin molecule (a relaxing protein) lies alongside actin molecules. Troponin, another relaxing protein, associates with the tropomyosin molecule. The troponin complex itself has three components. Troponin T aids in binding of the troponin complex to actin and tropomyosin; troponin I inhibits the ATPase of actomyosin; and troponin C contains binding sites for the calcium ions involved in contraction. Troponin T and I molecules are released into the bloodstream during myocardial injury. They can be measured to evaluate if a myocardial infarction or other damage has occurred. The sarcomere also contains a giant elastic protein, titin, which attaches myosin to the Z line, acts as a spring, and influences myocardial stiffness. The titin structure affects myocardial diastolic filling and has been found to play a role in heart failure.11
Where thick filaments overlap with thin filaments, a central dark band is formed, called the anisotropic band, or A band (see Fig. 31.12B). The light bands of the sarcomere, called isotropic bands or I bands, contain only actin molecules and no myosin. The center of the sarcomere is a less dense region called the H band, which contains only myosin molecules and no actin. Thick filaments are held together by M-protein molecules that form a central thin, dark M line.7 Thin filaments of actin extend from each side of the Z line, a dense fibrous structure at the center of each I band. The area from one Z line to the next Z line defines one sarcomere.
Myocardial metabolism
Cardiomyocytes depend on the constant production of ATP, which is synthesized within the mitochondria mainly from glucose, fatty acids, and lactate. If the myocardium is underperfused because of coronary artery disease, anaerobic metabolism must be used for energy (see Chapter 1). Energy produced by metabolic processes fuels muscle contraction and relaxation, electrical excitation, membrane transport, and synthesis of large molecules. Normally, the amount of ATP produced supplies sufficient energy to pump blood throughout the system.
Cardiac work is expressed as myocardial oxygen consumption (MV̇O2), which is closely correlated with total cardiac energy requirements. The MV̇O2 is determined by three major factors: (1) the amount of wall stress during systole, estimated by measuring the systolic blood pressure; (2) the duration of systolic wall tension, measured indirectly by the heart rate; and (3) the contractile state of the myocardium, which is not measured clinically.
The coronary arteries deliver oxygen (O2) to the myocardium. Approximately 70% to 75% of this O2 is used immediately by cardiac muscle, leaving little O2 in reserve. Because the O2 content of the blood and the amount of O2 extracted from the blood cannot be increased under normal circumstances, any increased energy needs can be met only by increasing coronary blood flow. The MV̇O2 increases with exercise and decreases with hypotension and hypothermia. As myocardial metabolism and consumption of O2 increase, the concentration of local vasoactive metabolic factors increases. Some of these (e.g., adenosine, nitric oxide, and prostaglandins) dilate coronary arterioles, thus increasing coronary blood flow. Aging reduces the efficiency of myocardial metabolism and may contribute to the development of heart failure.12
Myocardial Contraction and Relaxation
Myocardial contractility is a change in developed tension at a given resting fiber length, which basically is the ability of the heart muscle to shorten. Each sarcomere serves as the basic contractile unit of a muscle cell. The outward-facing heads of myosin molecules are called cross-bridges because they can form force-generating bridges by binding with exposed actin molecules. Once bound, the myosin molecules effectively pull the thin filaments toward the center of the sarcomere, shortening the sarcomere and resulting in contraction. This process is known as the cross-bridge theory of muscle contraction (Fig. 31.13). Anatomically, contraction occurs when the sarcomere shortens, causing adjacent Z lines to move closer together. The width of the A band, which contains the thick myosin filaments, is unchanged whereas the I band becomes narrower as the overlap between the thick and thin filaments increases. The degree of shortening depends on the amount of overlap between the thick and thin filaments.
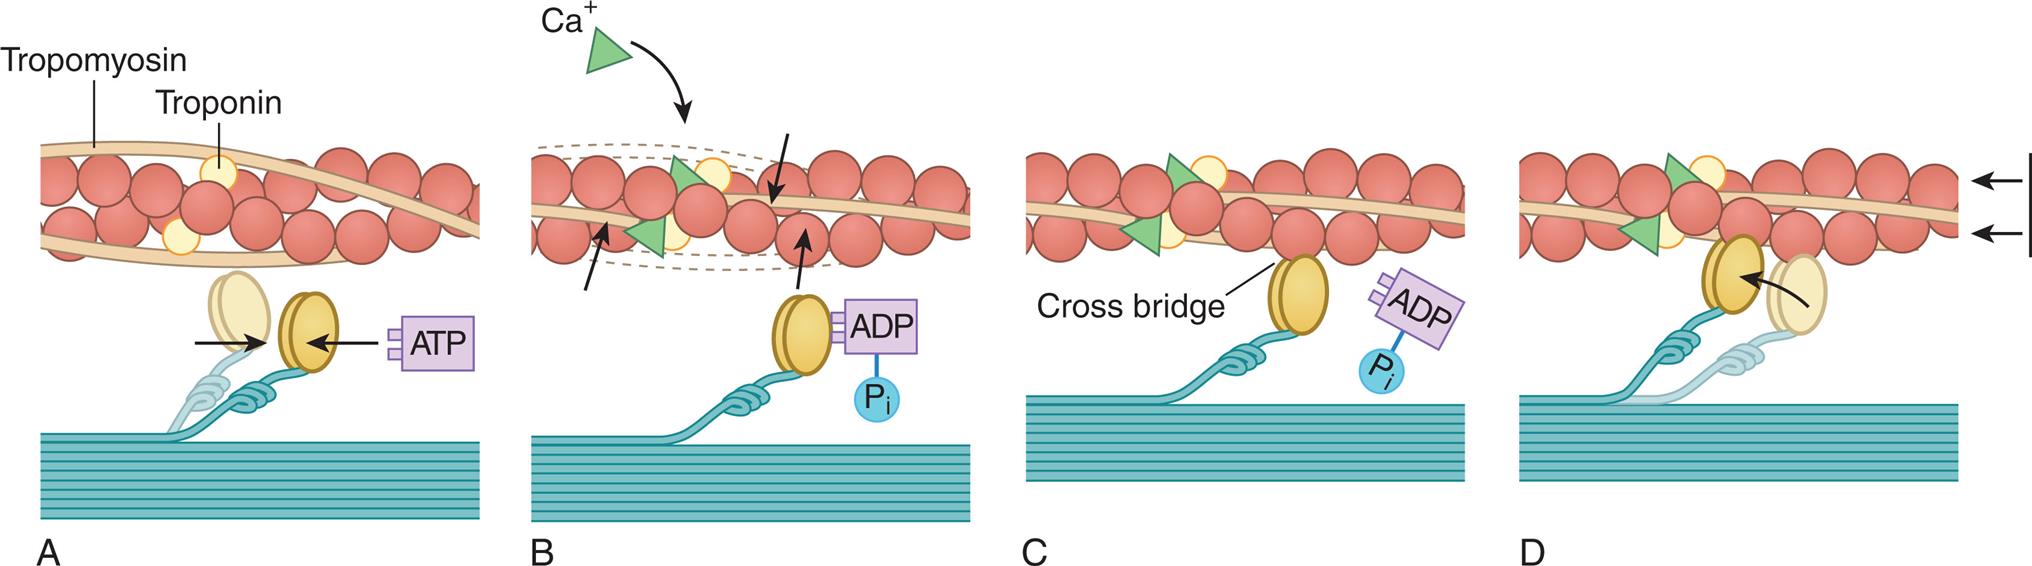
(A) Each myosin cross-bridge in the thick filament moves into a resting position after an adenosine triphosphate (ATP) molecule binds and transfers its energy. (B) Calcium ions released from the sarcoplasmic reticulum bind to troponin in the thin filament, allowing tropomyosin to shift from its position blocking the active sites of actin molecules. (C) Each myosin cross-bridge then binds to an active site on a thin filament, displacing the remnants of ATP hydrolysis—adenosine diphosphate (ADP) and inorganic phosphate (Pi). (D) The release of stored energy from step A provides the force needed for each cross-bridge to move back to its original position, pulling actin along with it. Each cross-bridge will remain bound to actin until another ATP molecule binds to it and pulls it back into its resting position (A). (Adapted from Thibodeau GA, Patton KT. Anatomy & physiology, 4th edition. St. Louis: Mosby; 1999.)
Cross-bridge cycling
The ovoid head-end of the myosin contains a binding site for actin and a separate enzymatic site that catalyzes the breakdown of ATP to adenosine diphosphate (ADP) and inorganic phosphate (Pi) (see Fig. 31.13). This reaction releases the chemical energy stored in ATP. The splitting of ATP occurs on the myosin molecule before it attaches to actin, but the ADP and inorganic phosphate released remain bound to the active site on myosin.
The binding of this high-energy myosin-actin to form a cross-bridge releases the energy stored in myosin (i.e., ADP and Pi), producing the force necessary for movement of the cross-bridge. With the attachment of actin to myosin at the cross-bridge, the myosin head molecule undergoes a position change, exerting traction on the rest of the myosin bridge, causing the thin filaments to slide past the thick filaments (see Fig. 31.13D). During contraction each cross-bridge undergoes several cycles of attachment, movement, and dissociation from the thin filaments. The rate of cross-bridge cycling is linked to systolic function and cardiac output.13
Calcium and excitation-contraction coupling
Excitation-contraction coupling is the process by which an action potential arriving at the muscle fiber plasma membrane triggers the cycle, leading to cross-bridge formation and contraction. Cycle activation depends on calcium availability, and the amount of force developed is regulated by how much the concentration of calcium ions increases within the cardiomyocytes. Calcium enters the myocardial cell from the interstitial fluid after electrical excitation that increases membrane calcium permeability. Two types of calcium channels are identified in cardiac tissues. The L-type, or long-lasting, channels are the predominant type of calcium channels and are the channels blocked by calcium channel–blocking drugs (verapamil, nifedipine, diltiazem). The major effect of these medications is to decrease the strength of cardiac contraction. The T-type, or transient, channels are much less abundant in the heart and are not blocked by currently available calcium channel–blocking drugs and are being investigated.
Calcium entering the cell triggers the release of additional calcium from the two storage sites within the sarcomere. Calcium ions then diffuse toward the myofibrils, where they bind with troponin. The calcium-troponin complex interaction facilitates the contraction process (see Fig. 31.13). In the resting state, troponin is bound to actin and the tropomyosin molecule covers the sites where the myosin heads bind to actin, thereby preventing interaction between actin and myosin. Calcium binds to troponin, which ultimately results in tropomyosin moving troponin, thus uncovering the binding sites. Myosin and actin can now form cross-bridges, and ATP can be dephosphorylated to adenosine diphosphate (ADP). Under these circumstances, sliding of the thick and thin filaments can occur, and the muscle contracts.
Myocardial relaxation
Relaxation is as vital to optimal cardiac function as contraction, and calcium, troponin, and tropomyosin also facilitate relaxation. After contraction, free calcium ions are actively pumped out of the cell back into the interstitial fluid or taken back into storage by the sarcoplasmic reticulum and tubule system. As the concentration of calcium within the sarcomere decreases, troponin releases its bound calcium. The tropomyosin complex moves and blocks the active sites on the actin molecule, preventing cross-bridge formation with the myosin heads. If the ability of the myocardium to relax is impaired, it can lead to increased diastolic filling pressures and eventually heart failure (see Chapter 32).
Factors Affecting Cardiac Output
Cardiac performance can be evaluated by measuring the cardiac output. Cardiac output is calculated by multiplying the heart rate in beats per minute by the stroke volume (volume of blood ejected during systole) in liters per beat. Normal adult cardiac output is about 5 L/min at rest, given a heart rate of about 70 beats/min and a normal stroke volume of about 70 mL.
With each heartbeat, the ventricles eject much of their blood volume, and the percentage of total end-diastolic ventricular volume ejected per beat is called the ejection fraction. The ejection fraction is calculated by dividing the stroke volume by the end-diastolic volume. The end-diastolic volume of the normal ventricle is about 70 to 80 mL/m2, and the normal ejection fraction of the resting heart, measured with gated myocardial perfusion imaging, was 66% ± 8% for women and 58% ± 8% for men. The ejection fraction is increased by factors that increase contractility, such as increased sympathetic nervous system activity. A decrease in the ejection fraction may indicate ventricular failure. The effects of aging on cardiovascular function are summarized in Table 31.2.
Table 31.2
| Determinant | Resting Cardiac Performance | Exercise Cardiac Performancea |
|---|---|---|
| Cardiac output | Unchanged | Decreases because of a decrease in maximum heart rate |
| Heart rate | Slight decrease | Increases less than in younger people |
| Stroke volume | Slight increase | No change |
| Ejection fraction | Unchanged | Decreased |
| Afterload | Increased | Increased |
| End-diastolic volume | Unchanged | Increased |
| End-systolic volume | Unchanged | Increased |
| Contraction | Decreased velocity | Decreased |
| Myocardial wall stiffness | Increased | Increased |
| Maximum oxygen consumption | Not applicable | Decreased |
| Plasma catecholamines | — | Increased |
aChanges in healthy men and women up to age 80 years as compared to those 20 years of age.
Data from Lakatta EG, et al. Aging and cardiovascular disease in the elderly. In: Fuster V, et al., eds. Hurst’s the heart, 13th edition. Philadelphia: McGraw-Hill; 2011.
The factors that determine cardiac output are (1) preload, (2) afterload, (3) myocardial contractility, and (4) heart rate. Preload, afterload, and contractility all affect stroke volume (Fig. 31.14).
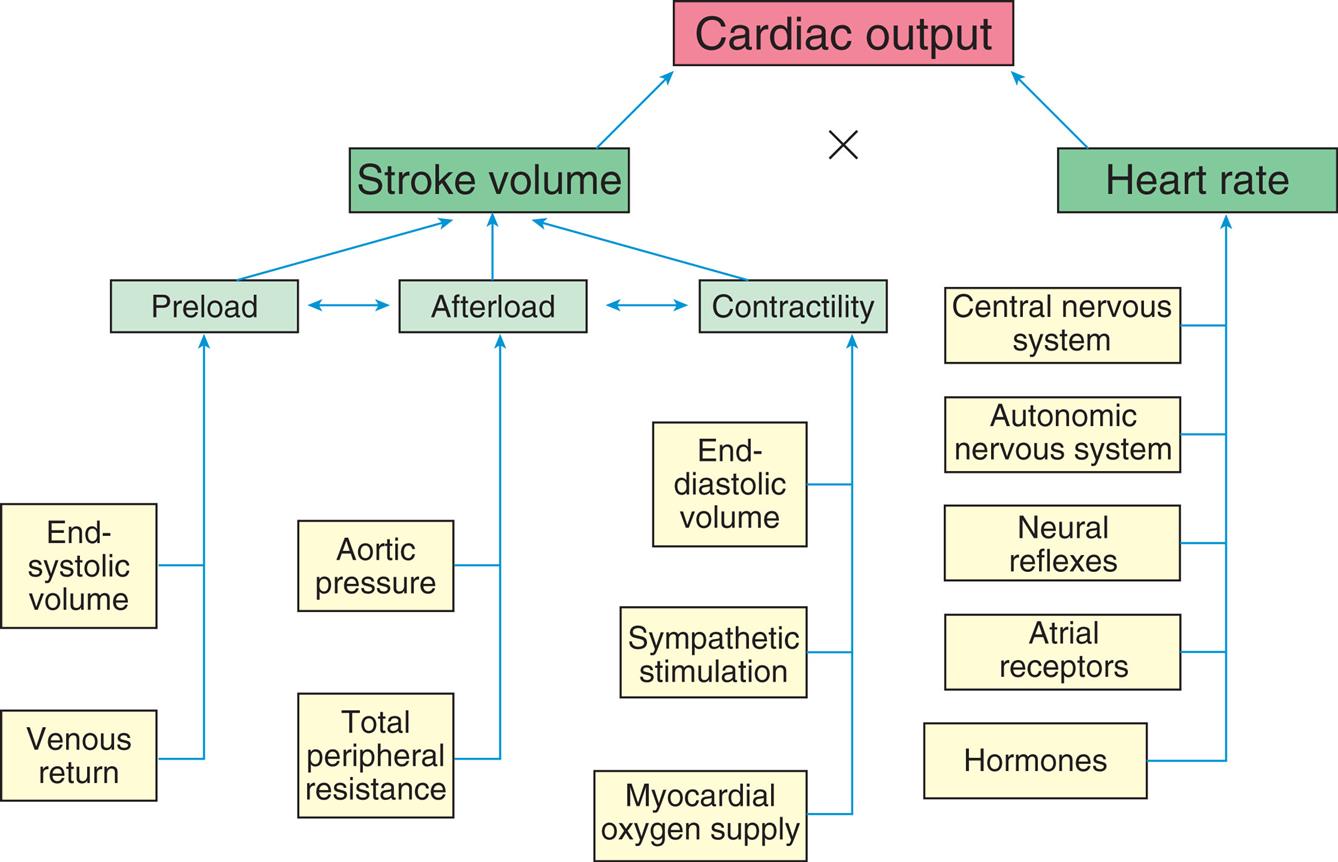
Cardiac output, the amount of blood (in liters) ejected by the heart per minute, depends on the heart rate (beats per minute) and stroke volume (milliliters of blood ejected during ventricular systole).
A flowchart lists the factors affecting cardiac performance. • End-systolic volume and venous return affects preload. • Total peripheral resistance and aortic pressure affects afterload. • Myocardial oxygen supply, sympathetic stimulation, and end diastolic volume affects contractility. • Preload, afterload, and contractility are interrelated which impacts stroke volume. • Hormones, atrial receptors, neural reflexes, autonomic nervous system, and central nervous system affect heart rate.
Preload
Preload is the volume and pressure inside the ventricle at the end of diastole (ventricular end-diastolic volume [VEDV] and pressure [VEDP]). Preload is determined by two primary factors: (1) the amount of blood left in the ventricle after systole (end-systolic volume) and (2) the amount of venous blood returning to the ventricle during diastole. End-systolic volume is dependent on the strength of ventricular contraction and the resistance to ventricular emptying. Venous return is dependent on blood volume and flow through the venous system and the atrioventricular valves. Clinically, preload is estimated by measuring the central venous pressure (CVP) for the right side of the heart and the pulmonary artery wedge pressure (cross-sectional pressure) for the left side. Normal values for these two estimates are 1 to 5 mm Hg and 4 to 12 mm Hg, respectively. Heart failure can occur because of an increase in preload (VEDV), which causes a decline in stroke volume and also increases VEDP (see Chapter 32). Increased VEDP causes pressures to increase or “back up” into the pulmonary or systemic venous circulation, increasing plasma outflow through the vessel walls, causing fluid to accumulate in lung tissues (pulmonary edema) or in peripheral tissues (peripheral edema).
Frank-starling law of the heart
Cardiac muscle, like other muscle, increases its strength of contraction when it is stretched up to a certain point. The Frank-Starling law of the heart, or the length-tension relationship of cardiac muscle, relates resting sarcomere length, expressed as the volume of blood in the heart at the end of diastole (end-diastolic volume), to tension generation, described as development of left ventricular pressure. Thus, the volume of blood in the heart at the end of diastole (the length of its muscle fibers) is directly related to the force of contraction during the next systole. Although the change in pressure is related to the volume of the ventricle and, consequently, to the length of the ventricular muscle fibers, preload (i.e., filling pressure) is commonly used as an index of ventricular volume. The length-tension mechanism is the main mechanism by which the normal right and left ventricles maintain equal minute outputs even though their stroke outputs may vary considerably during normal respiration. For example, changes in volume occur when an individual assumes a reclining position after being in a standing position; the volume of blood returning to the heart temporarily increases. The right ventricle stretches to accommodate this increase in volume and thereby increases its force of contraction. A larger stroke volume (i.e., the amount of blood ejected per beat) is pumped to the lungs, generating higher pressures. Pulmonary vascular pressure increases, causing a rise in the left ventricular filling pressure or preload. Left ventricular volume and pressure increase. The left ventricle pumps a larger stroke volume, and arterial vascular pressure rises.
The mechanical function of the heart is characterized by a number of length-tension curves (Fig. 31.15). Factors that increase contractility, such as sympathetic nerve stimulation, cause the heart to operate on a higher length-tension curve (curve A in Fig. 31.15). A higher tension or increase in ventricular stroke volume is generated without a necessary change in left ventricular end-diastolic volume (LVEDV) or fiber length. Heart failure (curve C in Fig. 31.15) is characterized by a lower length-tension curve. The Frank-Starling law of the heart may not apply to dilated or failing hearts because their fibers are already stretched beyond their optimal length. The failing heart responds to increased filling or stretch with a progressive decline in the force of contraction. Thus at the same left ventricular end-diastolic volume (LVEDV) as curves A and B (see Fig. 31.15), the force of contraction of stroke volume is decreased (Fig. 31.15C).
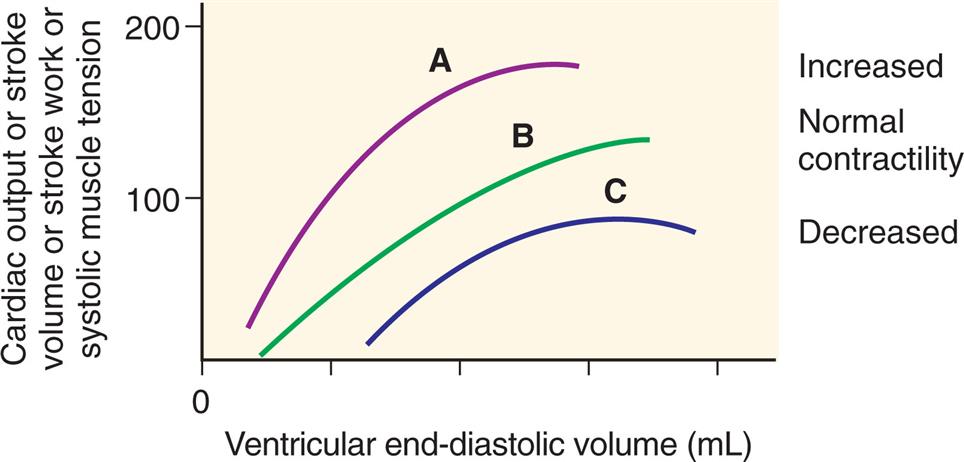
The relationship between length and tension in the heart. The end-diastolic volume determines the end-diastolic length of ventricular muscle fibers and is proportional to tension generated during systole, as well as to cardiac output, stroke volume, and stroke work. A change in myocardial contractility causes the heart to perform on a different length-tension curve. (A) Increased contractility; (B) normal contractility; (C) heart failure or decreased contractility. (See text for further explanation.)
A graph shows the effect of changes in myocardial contractility on the Frank-Starling curve. The horizontal axis represents the ventricular end-diastolic volume given in milliliters. The vertical axis represents the cardiac output or stroke volume or stroke work or systolic muscle tension, ranging from 0 to 200. The curve shifts downward and to the right as contractility is decreased. Stroke volume in response to increased left ventricular end-diastolic volume in heart failure.
The cross-bridge arrangement with the sarcomere partially accounts for the length-tension mechanism of cardiac muscle. According to the Frank-Starling law, the longer the initial resting length of the cardiac muscle fiber (optimal length is between 2.2 and 2.4 mm), the greater the strength of contraction. At 2.2 mm an optimal number of active cross-bridges exist between actin and myosin. However, if the fibers are stretched beyond 2.2 to 2.4 mm, the force of contraction decreases because actin and myosin become partially disengaged, disrupting many of the cross-bridges. Excessive stretching, to about 3.65 mm, causes actin and myosin to become completely disengaged so that tension (force of contraction) drops to zero. The relationship between stretch and contraction can be compared with that of a rubber band. Up to a certain point, the more the rubber band is stretched the farther it will fly when one end is released; beyond that point, however, the rubber band will break but, of course, the myocardium does not actually break.
Laplace law
Laplace law states that wall tension is related directly to the product of intraventricular pressure and internal radius, and inversely related to the wall thickness as shown in the Laplace equation:where T = wall tension, p = intraventricular pressure, r = internal radius of the sphere, and μm = wall thickness. In other words, the amount of tension generated in the ventricular wall (or any chamber or vessel) to produce a given intraventricular pressure depends on the size (radius and wall thickness) of the ventricle.
Laplace law is useful for understanding aneurysm formation, distensibility in blood vessels, and the effects of ventricular dilation on myocardial contraction. Dilation is an important factor in heart failure (see Chapter 32). With a dilated ventricle, myocardial fibers in the wall must develop greater tension to produce a given pressure within the ventricle. The disadvantage of dilation is that the increased force, or tension, in the myocardial fibers required to develop a given pressure inside a dilated ventricle decreases the rate of fiber shortening, thereby decreasing the ability of the ventricle to eject blood.
Afterload
Ventricular afterload is the resistance to ejection of blood from the ventricle. It is the load the muscle must move during contraction. The aortic systolic pressure is an index of afterload. Pressure in the ventricle must exceed the aortic pressure before blood can be pumped out during systole. Low aortic pressures (decreased afterload) enable the heart to contract more rapidly and efficiently, whereas high aortic pressures (increased afterload) slow contraction and cause higher workloads against which the heart must function to eject blood. Increased aortic pressure is usually the result of increased systemic vascular resistance (SVR), sometimes referred to as total peripheral resistance (TPR). In individuals with hypertension, increased SVR means that afterload is chronically elevated, resulting in increased ventricular workload and hypertrophy of the myocardium. SVR is calculated by dividing the mean arterial pressure by the cardiac output; the normal range is 700 dyne/s/cm−5. The most sensitive measure of afterload is SVR. In some individuals, changes in afterload are the result of aortic valvular disease.
Myocardial Contractility
Stroke volume, or the volume of blood ejected per beat during systole, also depends on the force of contraction, myocardial contractility, or the degree of myocardial fiber shortening. Three major factors determine the force of contraction (see Fig. 31.14):
- 1. Changes in the stretching of the ventricular myocardium caused by changes in VEDV (preload). As discussed previously, increased venous return to the heart distends the ventricle, thus increasing preload, which increases the stroke volume and, subsequently, cardiac output, up to a certain point. However, an excessive increase in preload leads to decreased stroke volume.
- 2. Alterations in the inotropic stimuli of the ventricles. Hormones, neurotransmitters, or medications that affect contractility are called inotropic agents. The most important endogenous positive inotropic agents are epinephrine and norepinephrine released from the sympathetic nervous system. The most important negative inotropic agent is acetylcholine released from the vagus nerve. Many medications have positive or negative inotropic properties that can have significant effects on cardiac function. In sepsis, a variety of cytokines, including tumor necrosis factor-alpha (TNF-α), and interleukin-1β, have been shown to impair myocardial contractility.14
- 3. Adequacy of myocardial oxygen supply. O2 and carbon dioxide levels (tensions) in the coronary blood also influence contractility. With severe hypoxemia (arterial O2 saturation less than 50%), contractility is decreased. Moderate degrees of hypoxemia may increase contractility by enhancing the myocardial response to circulating catecholamines.
Preload, afterload, and contractility all interact with one another to determine stroke volume and cardiac output (see Fig. 31.14). Changes in any one of these factors can result in deleterious effects on the others, resulting in heart failure (see Chapter 32).
Heart Rate
As described previously, SA node activity is the primary determinant of the heart rate. The average heart rate in healthy adults is about 70 beats/min; in children it is typically greater. This rate diminishes by 10 to 20 beats/min during sleep and can accelerate to more than 100 beats/min during muscular activity or emotional excitement. In well-conditioned athletes, the resting heart rate is normally about 50 to 60 beats/min. In highly trained or elite athletes, the resting heart rate can be below 50 beats/min; these athletes also have a greater stroke volume and lower peripheral resistance in active muscles than they had before training. The control of heart rate includes activity of the central nervous system, autonomic nervous system, neural reflexes, atrial receptors, and hormones (see Fig. 31.14).
Heart rate variability
Heart rate varies naturally with many factors such as exercise, anxiety, temperature, and hormones (e.g., estrogen). This ability of the heart to change rate is called heart rate variability (HRV) and is a measure of cardiac autonomic function. For example, heart rate varies with respiration, the rate increasing with inspiration and decreasing with expiration. This normal alteration in rhythm pattern, called sinus arrhythmia, is caused by changes that occur within the chest cavity because of respiration. Inspiration results in stretch and an associated increase in firing of the SA node that increases heart rate. The stretch is reduced with expiration and the SA node firing rate slows, resulting in a decrease in heart rate. Adequate amounts of HRV in response to physiologic conditions is believed to be an important indicator of health.
Many pathophysiologic factors are linked to decreased HRV, including neurologic disease (e.g., parkinsonian syndrome, multiple sclerosis), cardiovascular disease (e.g., coronary artery disease, heart failure), inflammation, alcohol and drug consumption, occupational exposures, exposure to electromagnetic fields, air pollution, and others.15 Recent studies have documented the relationship between psychological stress, lack of effective coping mechanisms, and mental health disorders with decreased heart rate variability.16 A decrease in HRV may indicate that the individual is vulnerable to complications from their underlying conditions. For example, a decrease in HRV is associated with a higher risk of cardiovascular events and mortality in individuals with cardiovascular disease.17
Cardiovascular control centers in the brain
The cardiovascular vasomotor control center is in the medulla and pons areas of the brainstem, with additional areas in the hypothalamus, cerebral cortex, and thalamus. The hypothalamic centers regulate cardiovascular responses to changes in temperature, the cerebral cortex centers adjust cardiac reaction to a variety of emotional states, and the brainstem control center regulates heart rate and blood pressure.
The nerve fibers from the cardiovascular control center synapse with autonomic neurons that influence the rate of firing of the SA node. As previously discussed, an increased heart rate occurs with sympathetic (adrenergic) stimulation. When the parasympathetic nerves to the heart are stimulated (primarily via the vagus nerve), the heart rate slows and the sympathetic nerves to the heart, arterioles, and veins are inhibited. At rest, the heart rate in healthy individuals is primarily under the control of parasympathetic stimulation. Administration of drugs that block parasympathetic function (anticholinergic) or physical interruption of the vagus nerve causes significant tachycardia (abnormally fast heart rate) because this inhibitory parasympathetic influence is lost.
Neural reflexes
Output from the baroreceptor reflexes influences short-term regulation of the vascular smooth muscle of resistance arteries, myocardial contractility, and heart rate, all components of blood pressure control. The baroreceptors or pressoreceptors are located in the aortic arch and carotid arteries. If blood pressure decreases, the baroreceptor reflex accelerates the heart rate, increases myocardial contractility, and increases vascular smooth muscle contraction in the arterioles, thus raising blood pressure. This reflex is critical to maintaining adequate tissue perfusion. When the blood pressure increases, the baroreceptors increase their rate of discharge, sending neural impulses over a branch of the glossopharyngeal nerve (cranial nerve IX) and through the vagus nerve to the cardiovascular control centers in the medulla. These reflexes increase parasympathetic activity and decrease sympathetic activity, causing the resistance arteries to dilate, decreasing myocardial contractility and the heart rate. The role of baroreceptors in influencing blood pressure is discussed in more detail later in this chapter.
Atrial receptors
Mechanoreceptors that influence the heart rate exist in both atria. They are located where the veins, venae cavae, and pulmonary veins enter their respective atria. The Bainbridge reflex is the name for the changes in the heart rate that may occur after intravenous infusions of blood or other fluid. The change in heart rate is thought to be caused by a reflex mediated by these atrial volume receptors that are innervated by the vagus nerve (volume receptors are thought to respond to increased plasma volume). Although this reflex can be elicited in humans, its relevance is uncertain at this time. Stimulation of these atrial receptors also increases urine volume, presumably because of a neurally mediated reduction in antidiuretic hormone. In addition, peptides of the atrial natriuretic family are released from atrial tissue in response to the increases in blood volume. These peptides have diuretic and natriuretic (salt excretion) properties, resulting in decreased blood volume and pressure. The atrial natriuretic peptides also have been shown to relax vascular smooth muscle and oppose myocardial hypertrophy, leading to measurement of blood levels to evaluate clinical status and raising interest in their use as therapeutic agents (see Chapter 32).
Hormones and biochemicals
Hormones and other biochemically active substances affect the arteries, arterioles, venules, capillaries, and contractility of the myocardium. Norepinephrine, mainly released as a neurotransmitter from the adrenal medulla, dilates vessels of the liver and skeletal muscle and also causes an increase in myocardial contractility. Epinephrine dilates vessels of the liver and skeletal muscle and causes an increase in myocardial contractility. Some adrenocortical hormones, such as hydrocortisone, increase the effects of the catecholamines—norepinephrine and epinephrine.
Thyroid hormone, specifically triiodothyronine, causes increases in both heart rate and contractility, resulting in an increase in cardiac output; it also decreases systemic vascular resistance. Triiodothyronine acts directly on the cardiac myocytes to cause gene transcription and cellular changes that result in more calcium release from the sarcoplasmic reticulum.18 Awareness of these changes helps to understand the cardiovascular changes that occur with thyroid diseases. Growth hormone, working together with insulin-like growth factor-1 (IGF-1), also has been shown to increase myocardial contractility.19 Decreases in levels of growth hormone or thyroid hormone may result in bradycardia (heart rate below 60 beats/min), reduced cardiac output, and low blood pressure. (Other hormones are discussed in the Regulation of Blood Pressure section.)
Systemic Circulation
The arteries and veins of the systemic circulation are illustrated in Fig. 31.16. Oxygenated blood leaves the left side of the heart through the aorta and flows into the systemic arteries. These arteries branch into small arterioles, which branch into the smallest vessels, the capillaries, where nutrient and waste product exchange between the blood and tissues occurs. Blood from the capillaries then enters tiny venules that join to form the larger veins, which return venous blood to the right heart (see Fig. 31.1B). Peripheral vascular system is the term used to describe the part of the systemic circulation that is outside of the chest or abdomen, consisting primarily of the vessels that supply blood to the extremities. Cerebrovascular system is the term used to describe the vessels that supply blood to the neck, head, and brain.
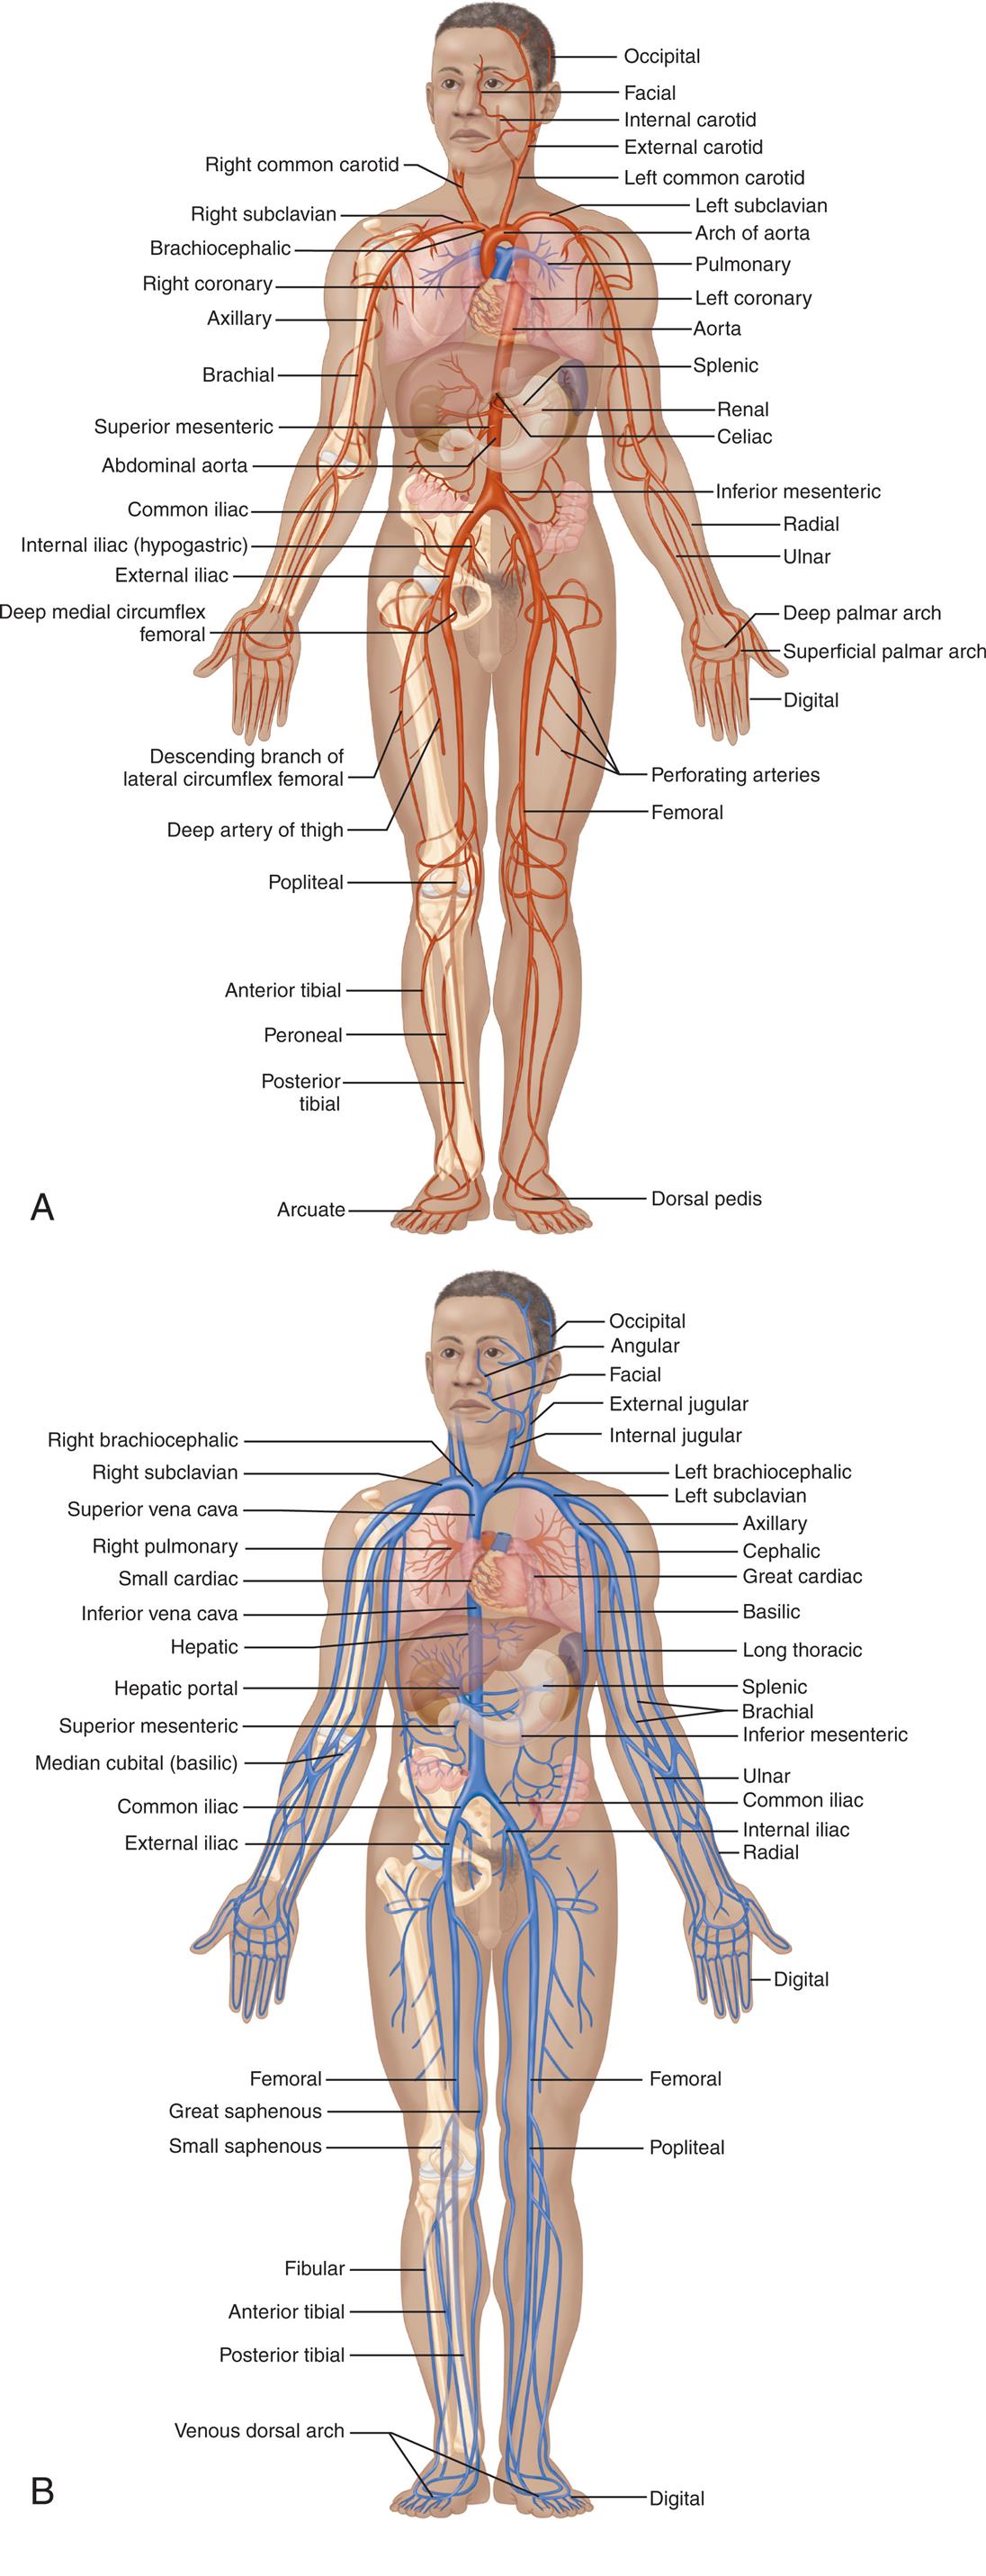
(A) Principal arteries of the body. (B) Principal veins of the body. (From Patton KT, Thibodeau GA. The human body in health & disease, St. Louis: Elsevier; 2018.)
Top panel, A. An illustration of the anterior view of person shows and identifies the following arteries, clockwise from the top right: occipital, facial, internal carotid, external carotid, left common carotid, left subclavian, arch of aorta, pulmonary, left coronary, aorta, splenic, renal, celiac, inferior mesenteric, radial, ulnar, deep palmar arch, superficial palmar arch, digital, perforating arteries, femoral, dorsal pedis, arcuate, posterior tibial, peroneal, anterior tibial, popliteal, deep artery of thigh, descending branch of lateral circumflex femoral, deep medial circumflex femoral, external iliac, internal iliac (hypogastric), common iliac, abdominal aorta, superior mesenteric, brachial, axillary, right coronary, brachiocephalic, right subclavian, and right common carotid. Bottom panel, B. An illustration of the anterior view of person shows and identifies the following veins, clockwise from the top right: occipital angular, facial, external jugular, internal jugular, left brachiocephalic, left subclavian, axillary, cephalic, great cardiac, basilic, long thoracic, splenic, brachial, inferior mesenteric, ulnar, common iliac, internal iliac, radial, digital, femoral, popliteal, digital, venous dorsal arch, posterior tibial, anterior tibial, fibular, small saphenous, great saphenous, femoral, external iliac, common iliac, median cubital (basilic), superior mesenteric, hepatic portal, hepatic, inferior vena cava, small cardiac, right pulmonary, superior vena cava, right subclavian, and right brachiocephalic.
Structure of Blood Vessels
Blood vessel walls are composed of three layers: (1) the tunica intima (innermost, or intimal, layer), (2) the tunica media (middle, or medial, layer), and (3) the tunica externa or adventitia (outermost, or external, layer), which also contains nerves and lymphatic vessels. These layers are illustrated in Fig. 31.17. Blood vessel walls vary in thickness, depending on the thickness or absence of one or more of these three layers. Cells of the larger vessel walls are nourished by the vasa vasorum, small vessels located in the tunica externa, and innervated by perivascular nerves. The vasa vasorum arises from the blood vessel itself or from other vessels nearby.

Structure of blood vessels. The tunica externa of the veins are color-coded blue and the arteries red. (From Patton KT. Anatomy & physiology, 10th edition. St. Louis: Elsevier; 2019.)
An illustration of the heart and accompanying magnified views of arteries and veins shows and labels its different structures. Top-left. The illustration shows a cutaway view of the large vein and identifies the following structures from the inside to the outside: tunica intima (endothelium, basement membrane), tunica media (smooth muscle), and tunica externa (fibrous connective tissue, nervi vasorum, vasa vasorum, and collage fibers). Top-right. The illustration shows a cutaway view of the elastic artery and identifies the following structures from the inside to the outside: tunica intima (endothelium, basement membrane), tunica media (elastic tissue and smooth muscle), and tunica externa (fibrous connective tissue, nervi vasorum, vasa vasorum, and collagen fibers). Middle-left. The illustration shows a cutaway view of a medium-sized vein and identifies the following structures from the inside to the outside: valve, tunica intima (endothelium, basement membrane), tunica media (smooth muscle), and tunica externa (fibrous connective tissue). Middle-right. The illustration shows a cutaway view of the muscular artery and identifies the followings structures from the inside to the outside: tunica intima (endothelium, basement membrane), tunica media (internal elastic membrane, smooth muscle), and tunica externa (external elastic membrane, fibrous connective tissue). Bottom-left. The illustration shows a cutaway view of the venule and identifies the following structures from the inside to the outside: tunica intima (endothelium, basement membrane), tunica media (smooth muscle), and tunica externa (fibrous connective tissue). Bottom-center. The illustration shows a capillary and labels its endothelium and basement membrane. Bottom-right. The illustration shows a cutaway view of the arteriole and identifies the following structures from the inside to the outside: tunica intima (endothelium, basement membrane), tunica media (smooth muscle), and tunica externa (fibrous connective tissue).
Adults are capable of growing new blood vessels through three processes, all of which are important in wound healing but also contribute to tumor growth. The three processes are angiogenesis, arteriogenesis, and vasculogenesis. Both angiogenesis and arteriogenesis occur by growth of new vessels that branch from existing vessels. Angiogenesis is branching of small vessels, such as capillaries, whereas arteriogenesis occurs by branching from larger vessels, such as arterioles. Vasculogenesis is a term that refers to the growth of vessels from progenitor or stem-like cells that originate in the bone marrow and other body tissues.
Arterial Vessels
An artery is a thick-walled, pulsating blood vessel transporting blood away from the heart. In the systemic circulation, arteries carry oxygenated blood. When the iron in hemoglobin is oxygenated, it turns bright red, which is why arterial vessels are often color-coded red in illustrations (see Fig. 31.17). Arterial walls are composed of elastic connective tissue, fibrous connective tissue, and smooth muscle. There are two types of arteries: elastic and muscular. Elastic arteries have a thick tunica media with more elastic fibers than smooth muscle fibers. Elastic arteries are located close to the heart and include the aorta and its major branches and the pulmonary trunk. Elasticity allows the vessel to absorb energy and stretch as blood is ejected from the heart during systole. During diastole, elasticity promotes recoil of the arteries, maintaining blood pressure within the vessels.
Muscular arteries, consisting of the medium and small size arteries, are farther from the heart than the elastic arteries. They contain more muscle fibers and fewer elastic fibers than the elastic arteries and they function to distribute blood to arterioles throughout the body (see Fig. 31.17). Because their smooth muscle can contract or relax, they play a role in blood flow control and in directing flow to body parts with the highest need at any point in time. For example, during exercise more blood is sent to the skeletal muscles, while after a meal more blood is directed to the gut and liver. Contraction narrows the vessel lumen (the internal cavity of the vessel), which diminishes flow through the vessel (vasoconstriction). When the smooth muscle layer relaxes, more blood flows through the vessel lumen (vasodilation).
An artery becomes an arteriole where the diameter of its lumen narrows to less than 0.5 mm. Arterioles are mainly composed of smooth muscle and regulate the flow of blood into the capillaries by constricting or dilating to either slow or increase the flow of blood into the capillaries (Fig. 31.18). The thick smooth muscle layer of the arterioles is a major determinant of the resistance blood encounters as it flows through the systemic circulation.
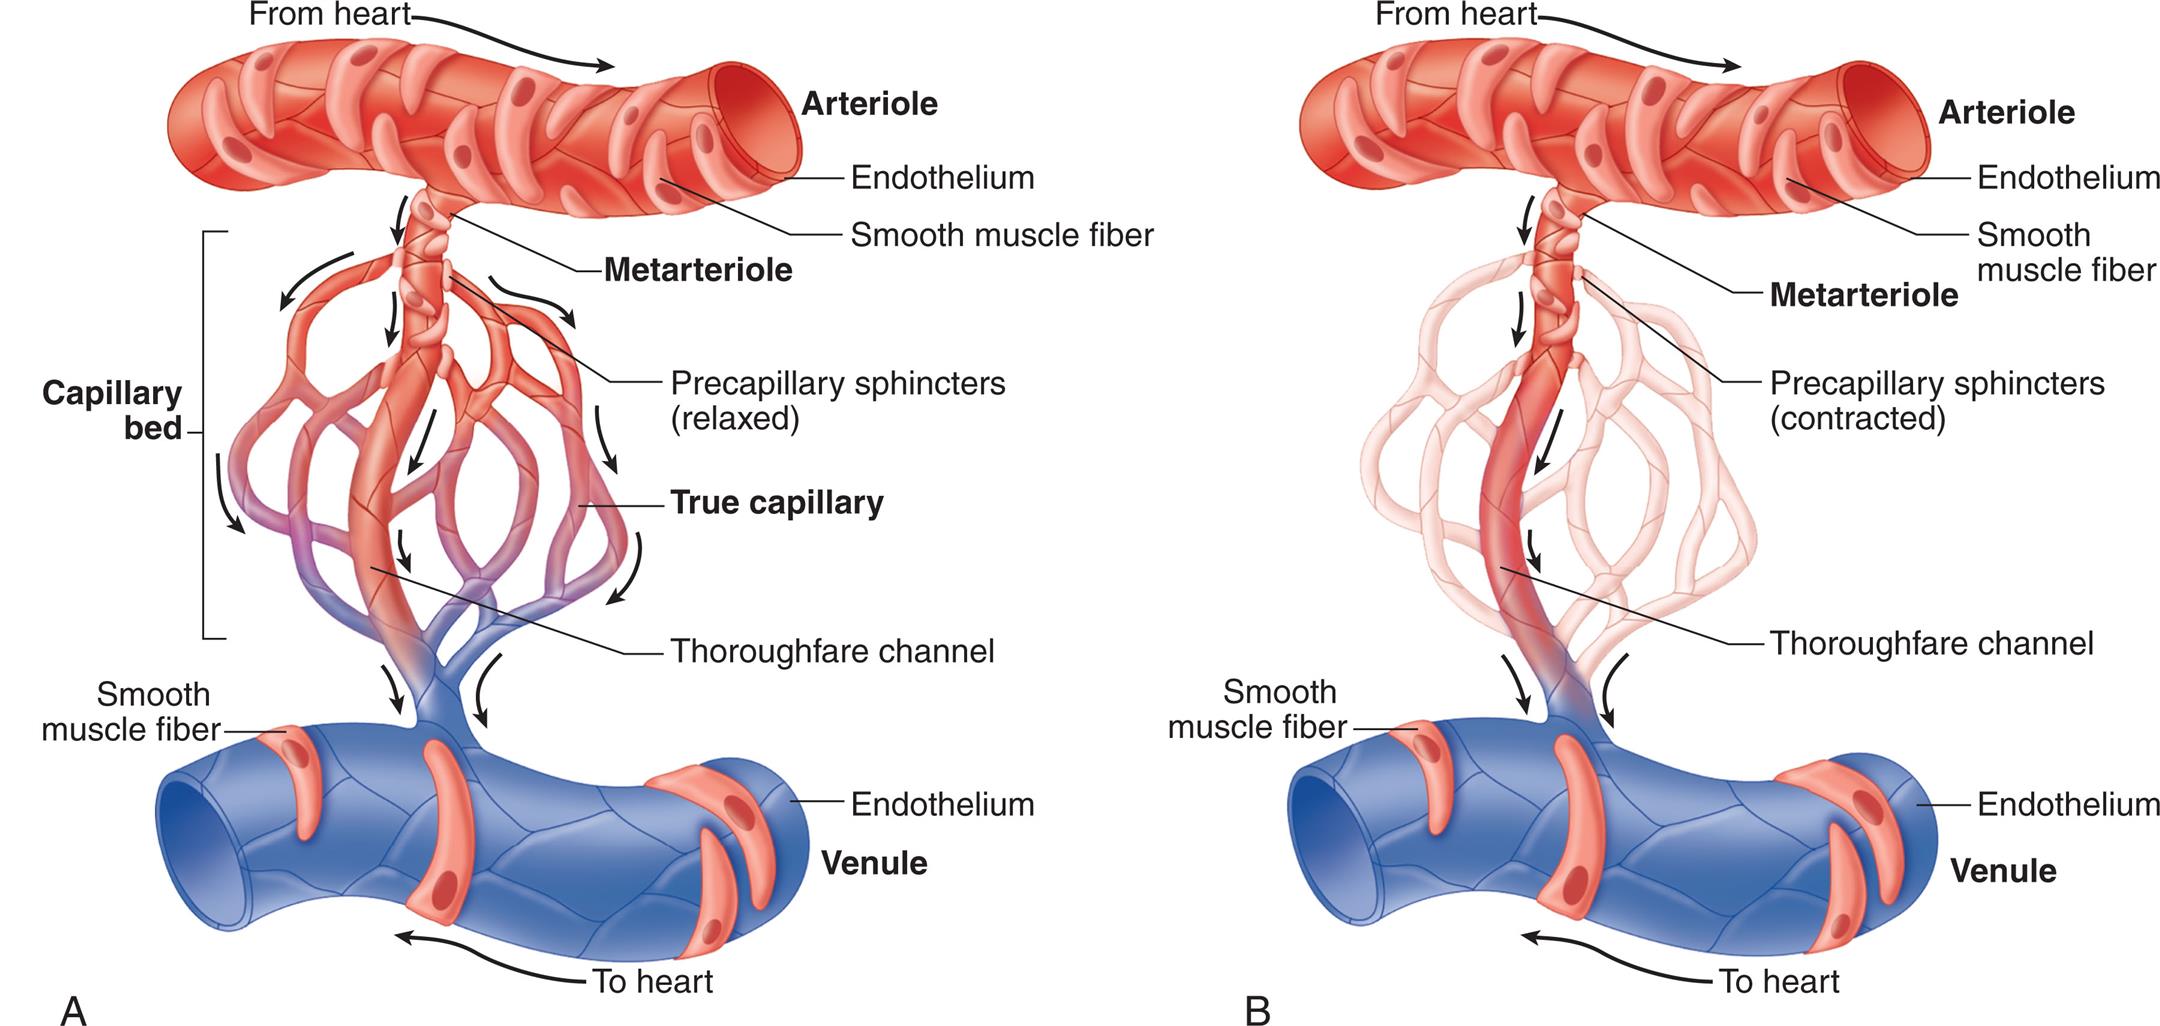
Control of local blood flow through a capillary network is regulated by altering the tone of precapillary sphincters surrounding arterioles and metarterioles. (A) Sphincters are relaxed, permitting blood flow to enter the capillary bed. (B) With sphincters contracted, blood flows from the metarteriole directly into the thoroughfare channel, bypassing the capillary bed. (From Patton KT. Anatomy & physiology, 10th edition. St. Louis: Mosby; 2019.)
Left panel, A. An illustration shows the arteriole, the capillary bed, and the venule. The endothelium and smooth muscle fiber of the arteriole are labeled. Blood flow from the heart and through the arteriole. The capillary bed comprises precapillary sphincters (relaxed), true capillary, and thoroughfare channel. The endothelium and the smooth fiber of the venule are labeled. Blood from the venule flows to the heart. Blood flows from arteriole to metarteriole followed by capillary bed. Right panel, B. An illustration shows the arteriole, the metarteriole, and the venule. The endothelium and the smooth muscle fiber of the arteriole are labeled. Blood from the heart flows through the arteriole, into the venule and to the heart. The endothelium and the smooth muscle fiber of the venule are labeled. Precapillary sphincters (contracted) and thoroughfare channel.
The capillary network is composed of connective channels called metarterioles and “true” capillaries (see Fig. 31.18). Metarterioles have discontinuous smooth muscle cells in their tunica media, whereas capillaries have no smooth muscle cells. There is a ring of smooth muscle called the precapillary sphincter at the point where capillaries branch from metarterioles. As the sphincters contract and relax, they regulate blood flow through the capillary beds. The precapillary sphincters help to maintain arterial pressure and regulate selective flow to vascular beds.
Capillaries are composed solely of a layer of endothelial cells surrounded by a basement membrane (see Fig. 31.17). Their thin walls and unique structure make possible the rapid exchange of water; small soluble molecules; some larger molecules, such as albumin; and cells of the innate and adaptive components of the immune system between the blood and the interstitial fluid. Based on their structure, three types of capillaries have been described: continuous, sinusoid, and fenestrated. In the renal glomerulus, for example, the endothelial cells contain oval windows or pores termed fenestrations, which are covered by a thin diaphragm. Sinusoid capillaries are found in the liver and bone marrow.
Substances pass between the capillary lumen and the interstitial fluid (1) through junctions between endothelial cells, (2) through fenestrations in endothelial cells, (3) in vesicles moved by active transport across the endothelial cell membrane, or (4) by diffusion through the endothelial cell membrane (Fig. 31.19B). A single capillary may be only 0.5 to 1 mm in length and 0.01 mm in diameter, but the capillaries are so numerous their total surface area may be more than 600 m2 (about 100 football fields).
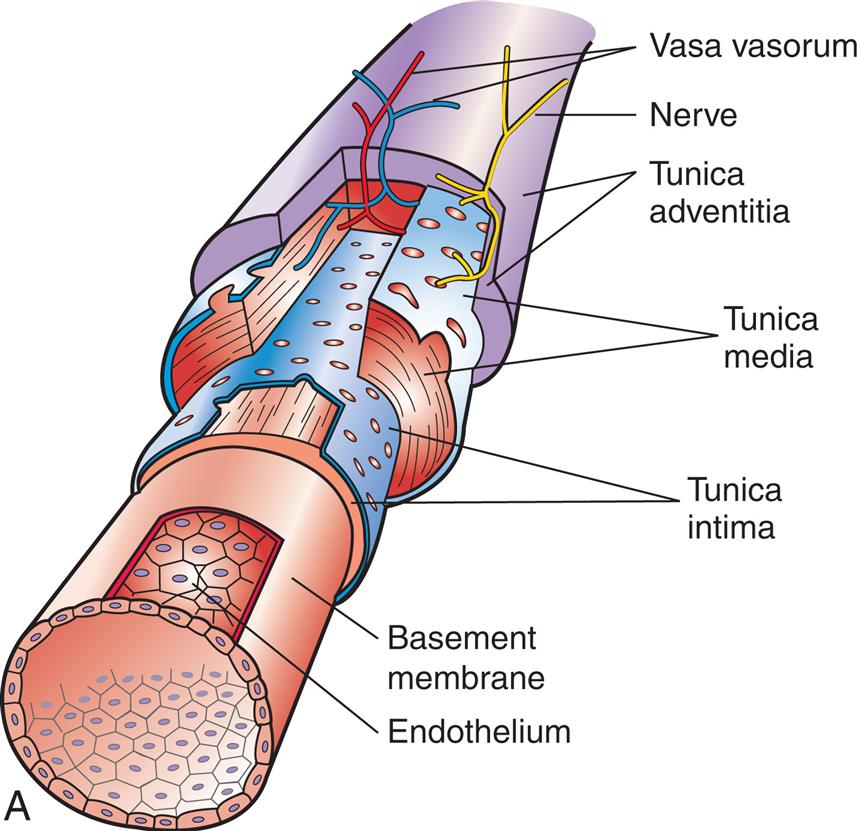
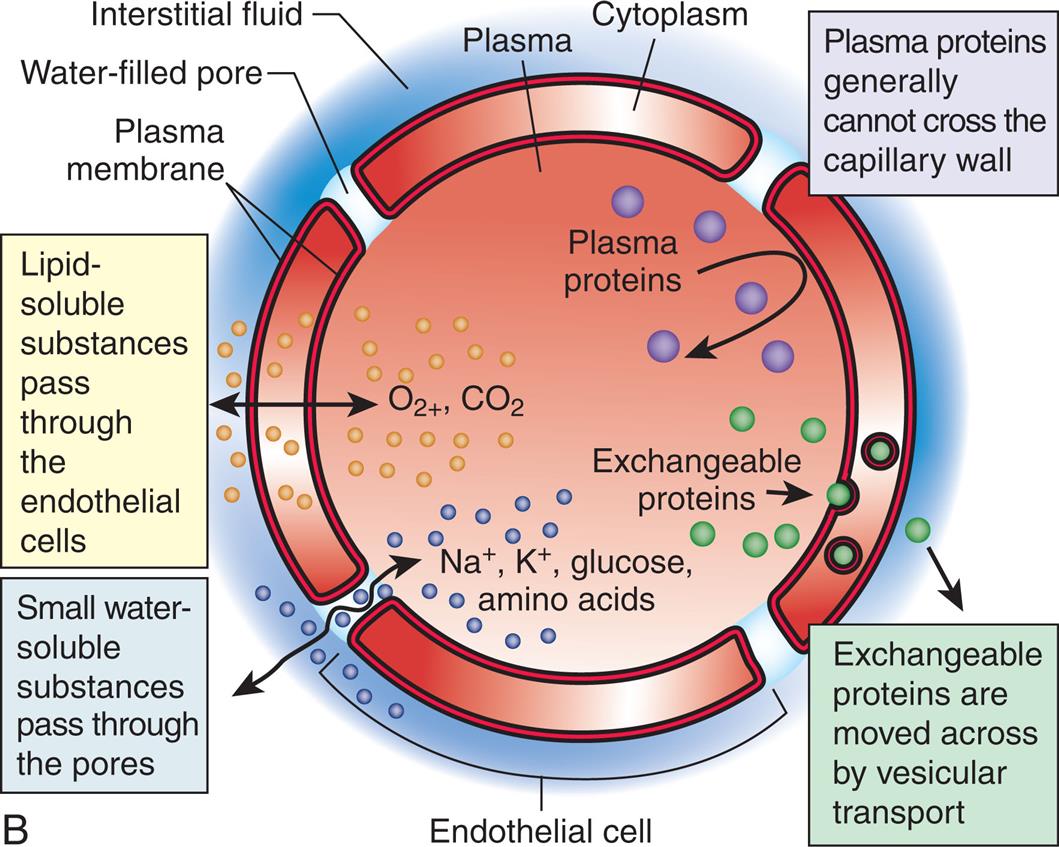
(A) This shows the endothelial cells in context with the entire blood vessel. The endothelial cells arrange themselves as a single-layer lining that has numerous critical functions (see Table 31.3). (B) The endothelium supports numerous functions through synesis and release of vasoactive fibers.
Left panel, A. The illustration shows a cutaway view of a blood vessel and identifies the following layers from the inside to the outside: endothelium, basement membrane, tunic intima, tunica media, tunica adventitia, nerve, and vasa vasorum. Right panel, B. The illustration shows a cross-section of the blood vessel. The structure identified on the illustration are as follows: plasma membrane, water-filled pore, interstitial fluid, plasma, cytoplasm, and endothelial cell. The functions of the endothelium are as follows. Plasma protein generally cannot cross the capillary wall. Exchangeable proteins are moved across by vesicular transport. Small water-soluble substances pass through the pores. Lipid-soluble substances pass through the endothelial cells.
Endothelium
The vascular endothelium, or blood vessel lining, is important to several body functions and is sometimes considered a separate endocrine organ. All tissues depend on a blood supply, and the blood supply depends on endothelial cells, which form the lining, or endothelium, of the blood vessel (see Fig. 31.19). In addition to substance transport, the vascular endothelium has important roles in coagulation, antithrombogenesis, and fibrinolysis; immune system function; tissue and vessel growth and wound healing; and vasomotion, the contraction and relaxation of vessels. Table 31.3 summarizes some of the more important endothelial functions. Because of its varying roles, the actual structure of the endothelium may vary in different vascular beds. For example, within lymph nodes the endothelial cells of specialized venules, called high endothelial venules, are uniquely structured to support the movement of lymphocytes from the blood into the lymph node.20 Endothelial injury and dysfunction are central processes in many of the most common and serious cardiovascular disorders, including hypertension and atherosclerosis (see Chapter 32).
Table 31.3
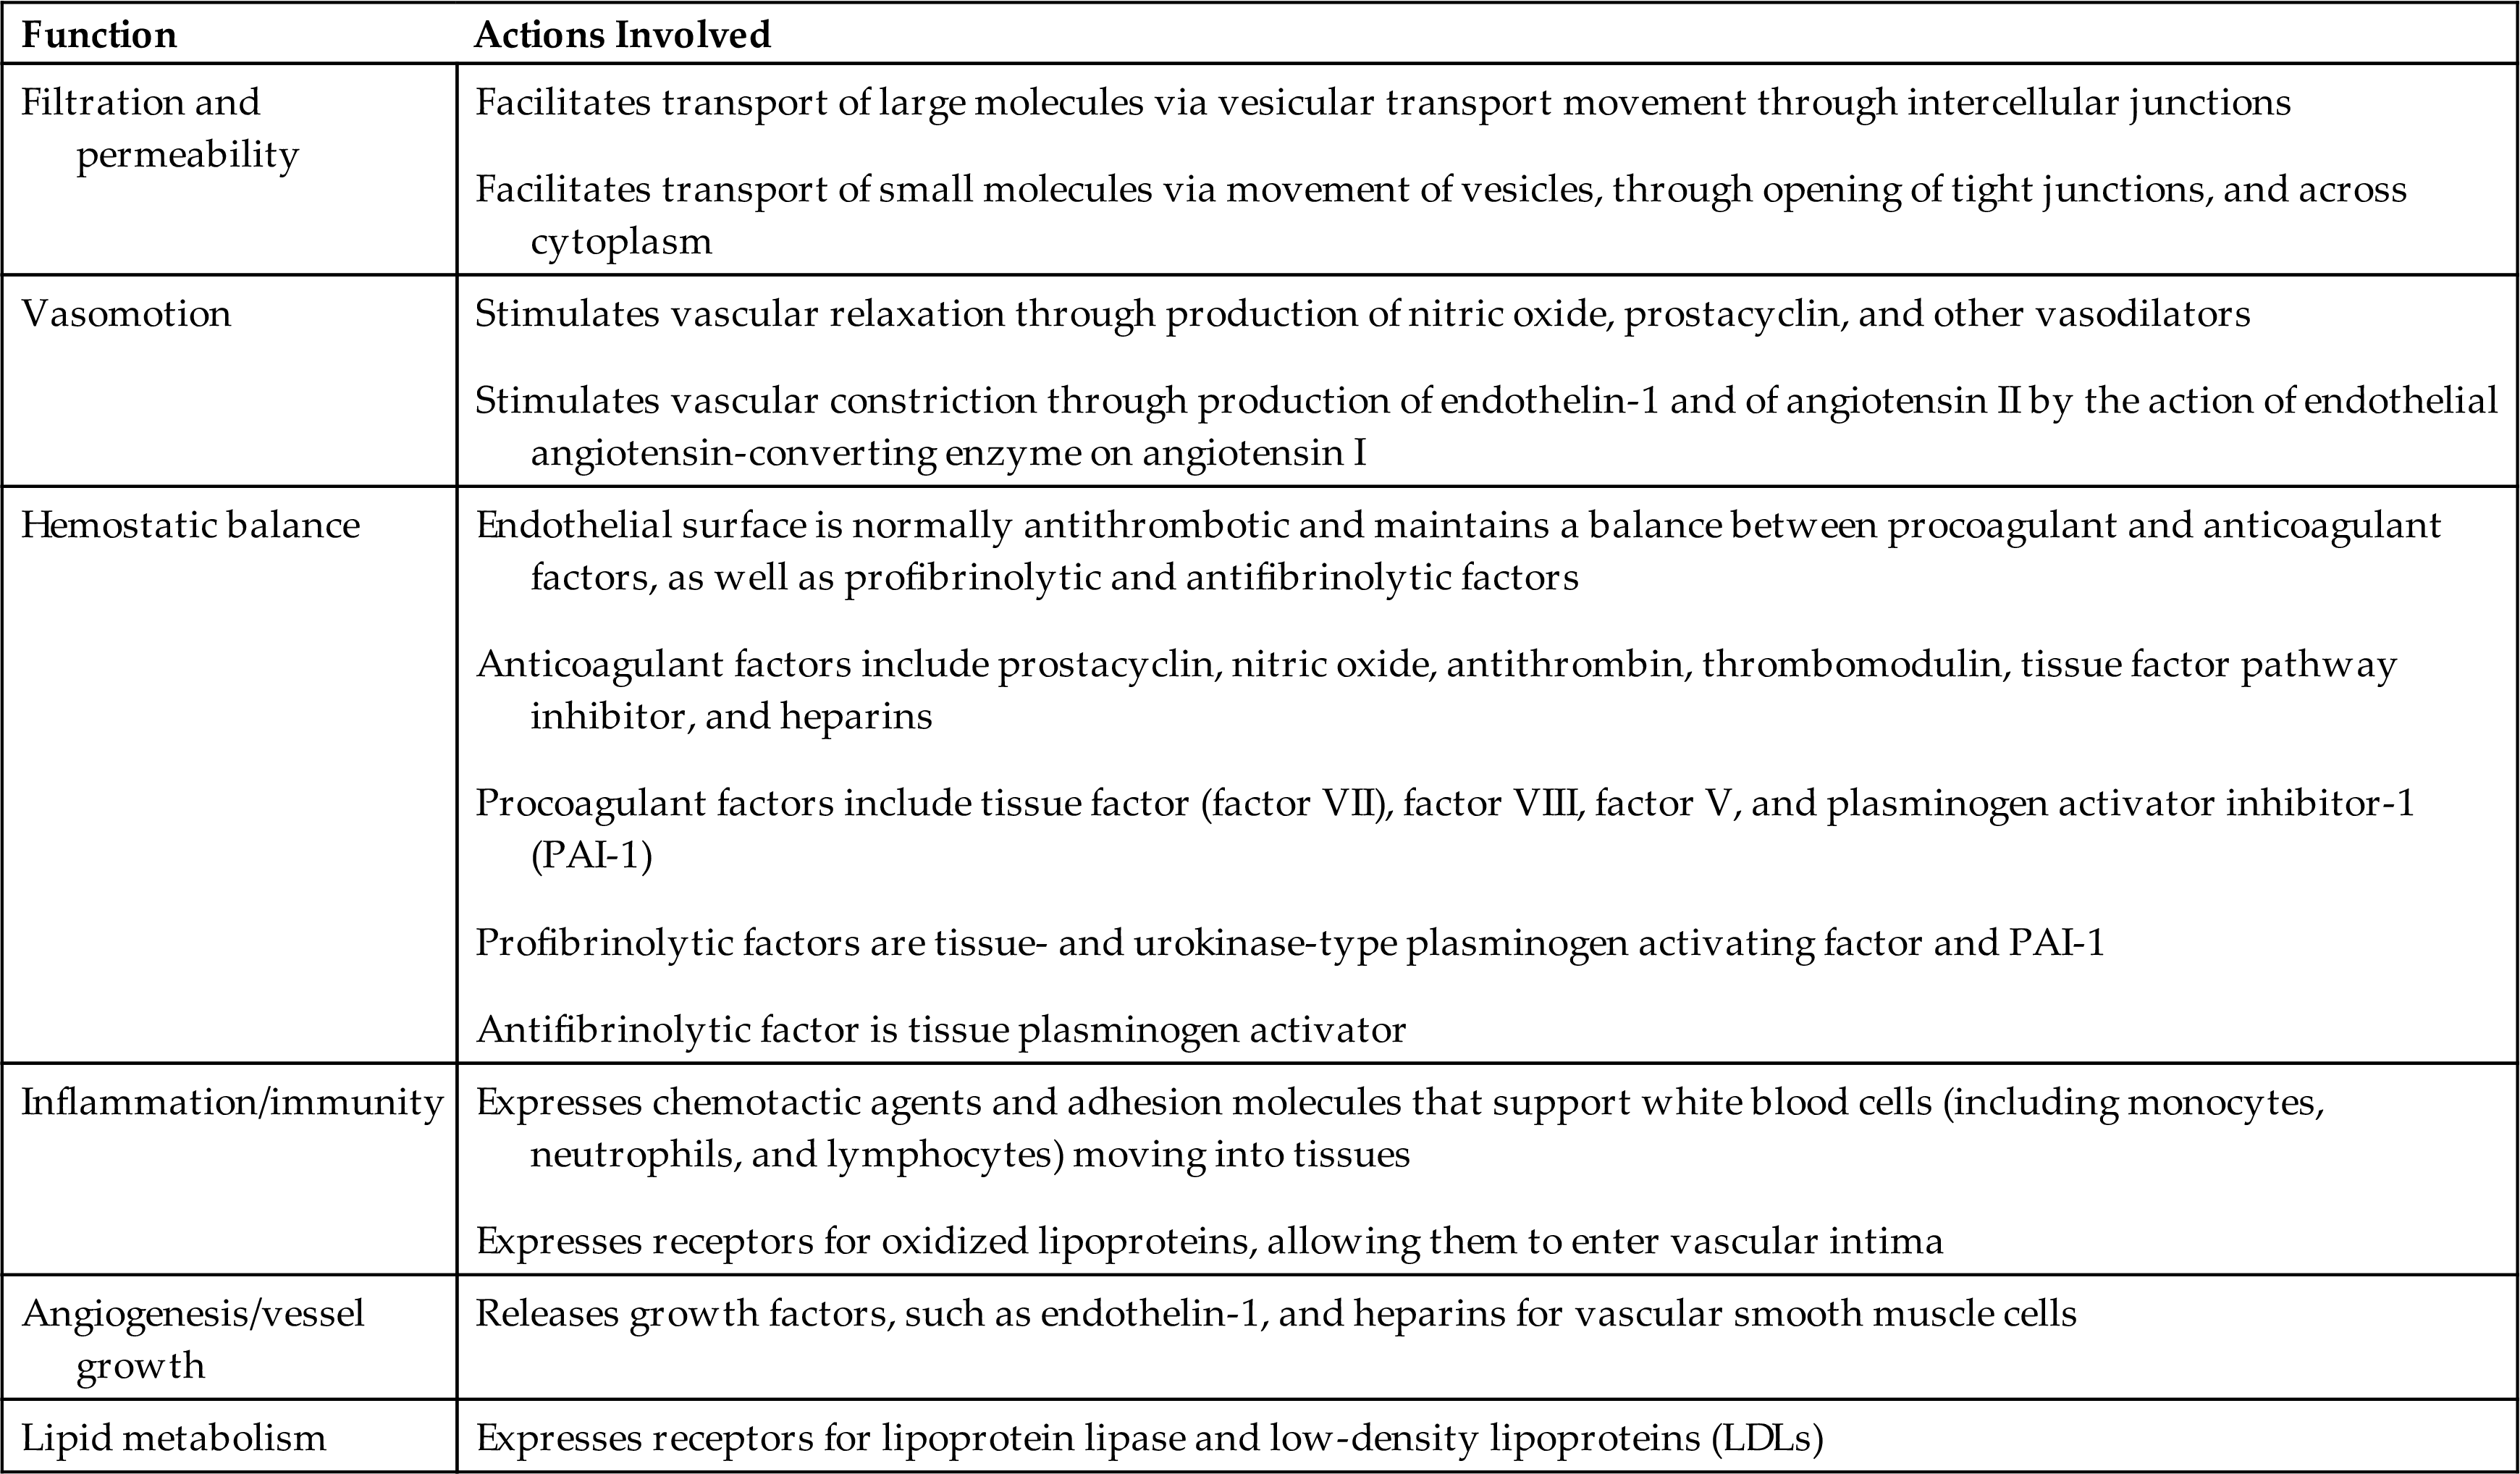
From Griendling KK., Harrison DG, Alexander RW. Biology of the vessel wall. In: Fuster V, Walsh RA, Harrington RA, eds. Hurst’s the heart, 13th edition. Philadelphia: McGraw-Hill; 2011; Rajendran P, Rengarajan T, Thangavel J, et al. The vascular endothelium and human diseases. International Journal of Biological Sciences, 2013;9(10):1057–1069.
Veins
Compared with arteries, veins are thin walled with more fibrous connective tissue and have a larger diameter (see Fig. 31.17). A given vein is larger than the artery that lies within the same sheath. Veins also are more numerous than arteries. The smallest venules downstream from the capillaries have an endothelial lining and are surrounded by connective tissue. The largest venules have some smooth muscle fibers in their thin tunica media. The venous tunica externa has less elastic tissue than that in arteries, so veins do not recoil as much or as rapidly after distention. Like arteries, veins receive nourishment from tiny vasa vasorum.
Some veins, typically in the legs, contain valves to facilitate the one-way flow of blood toward the heart (Fig. 31.20). These valves are folds of the tunica intima and resemble the semilunar valves of the heart. Backflow in veins of the legs is stopped as the flaps of the valves fill with blood and block the vessel. The position of the valves also facilitates blood flow in the proper direction during venous compression. When a person stands up, contraction of the skeletal muscles of the legs compresses the deep veins of the legs and assists the flow of blood toward the heart and against the force of gravity. This important mechanism of venous return is called the muscle pump (see Fig. 31.20B).
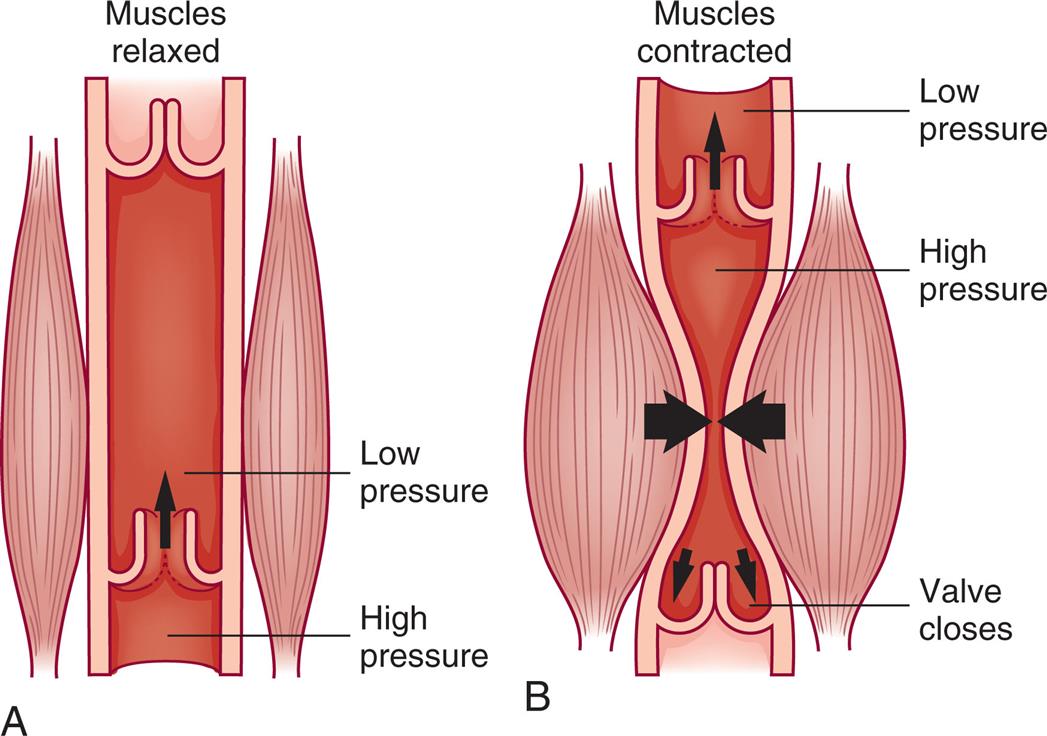
In veins, one-way valves aid circulation by preventing backflow of venous blood when pressure in a local area is low. (A) Blood is moved toward the heart as valves in the veins are forced open by pressure from volume of blood downstream and the neighboring muscles are relaxed. (B) When pressure below the valve drops, blood begins to flow backward but fills the “pockets” formed by the valve flaps, pushing the flaps together and thus blocking further backward flow. Contraction in the adjacent muscles and the valves of the systemic veins assist in the return of unoxygenated blood to the right heart.
Left panel, A. The illustration shows a vein when the muscles are relaxed. The vein is normal with blood from high-pressure zone flowing through the opening and into the low-pressure zone. Right panel, B. The illustration shows a vein when the muscles are contracted. The vein is constricted with blood from the high-pressure zone flowing through the opening and into the low-pressure zone.
Factors Affecting Blood Flow
Blood flow, the amount of fluid moved per unit of time, is usually expressed as liters or milliliters per minute (L/min or mL/min). Factors that influence blood flow include pressure, resistance, velocity, laminar versus turbulent flow, and compliance, with the most important of these being pressure and resistance.
Pressure and Resistance
Pressure in a liquid system is the force exerted on the liquid per unit area and is expressed clinically as millimeters of mercury (mm Hg), or torr (1 torr = 1 mm Hg). Blood flow to an organ depends partly on the pressure difference between the arterial and venous vessels supplying that organ. Fluid moves from the arterial “side” of the capillaries where the pressure is higher to the venous side where the pressure is lower.
Resistance is the opposition to blood flow. Most opposition to blood flow results from the diameter and length of the vessels. Changes in blood flow through an organ result from changes in the vascular resistance within the organ because of increases or decreases in vessel diameter and the opening or closing of vascular channels. Resistance in a vessel is inversely related to blood flow—that is, increased resistance leads to decreased blood flow. The Poiseuille law indicates that resistance is directly related to tube length and blood viscosity and inversely related to the radius of the tube to the fourth power (r4). Resistance to flow cannot be measured directly, but it can be calculated if the pressure difference and flow volumes are known. Resistance to blood flow in a single vessel is determined by the radius and length of the blood vessel and by the blood viscosity.
The most important factor determining resistance in a single vessel is the radius or diameter of the vessel's lumen. Small changes in the lumen's radius or diameter lead to large changes in vascular resistance. Because vessel length is relatively constant but lumen size is quite variable, length is not as important as lumen size in determining flow through a single vessel. Clinically, vasoconstriction of arterioles will decrease blood flow to organs perfused by those vessels, whereas vasodilation will increase perfusion. Vasoconstriction or vasodilation of multiple arterioles leads to changes in TPR that may cause a rise of fall in systemic blood pressure.
Blood vessel radius is usually the key factor in determining the TPR because viscosity, the consistency of the fluid, is relatively constant. Thick fluids move more slowly and cause greater resistance to flow than thin fluids—just think of honey as compared to water. The viscosity of blood depends on the red cell content. The greater the percentage of red cells in the blood, the more viscous the blood. This relationship is expressed as the hematocrit. A high hematocrit value reduces flow through the blood vessels, particularly the microcirculation (arterioles, capillaries, venules). An elevated hematocrit level is relatively rare. Conditions with elevated hematocrits include a lack of body water, cyanotic congenital heart disease (see Chapter 33), or polycythemia (see Chapter 29), and can lead to increased cardiac work as a result of increased vascular resistance.
Resistance to flow through a system of vessels, or total resistance, depends not only on characteristics of individual vessels, but also on whether the vessels are arranged in series (end to end) or in parallel (side to side) and on the total cross-sectional area of the system. Vessels arranged in parallel provide less resistance than vessels arranged in series. Blood flowing through the distributing arteries, beginning with branches off the aorta and ending at arterioles in the capillary bed, encounters more resistance than blood flowing through the capillary bed itself, where flow is distributed among many short, tiny branches arranged in parallel (Fig. 31.21). The total cross-sectional area of the arteriolar system is greater than that of the arterial system, yet the greater number of arterioles arranged in series leads to great resistance to flow in the arteriolar system. In contrast, the capillary system has a larger number of vessels arranged in parallel than the arteriolar system, and the total cross-sectional area is much greater; thus there is lower resistance overall through the capillary system. The resulting slow velocity of flow in each capillary is optimal for capillary-tissue exchange.
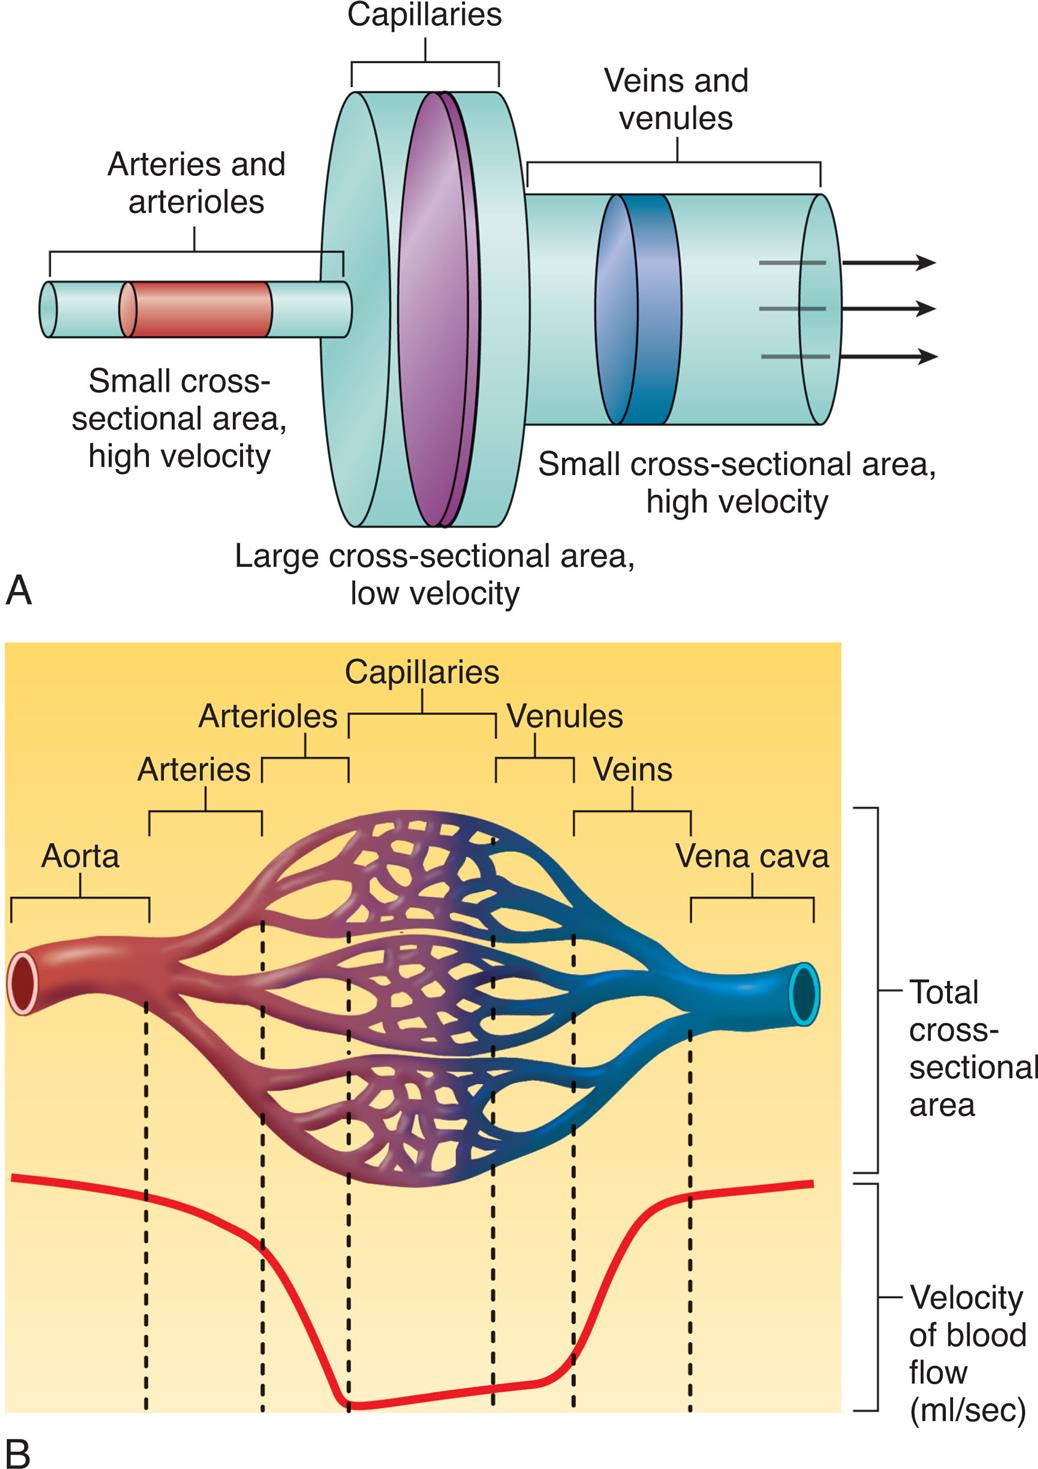
(A) Small and large cross-sectional areas and their relationship to velocity changes. (B) Total cross-sectional area of different kinds of blood vessels with velocity of blood flow (mL/s). Blood flows with great speed in the large arteries. However, branching of arterial vessels increases the total cross-sectional area of the arterioles and capillaries, reducing the flow rate. When capillaries merge into venules and venules merge into veins, the total cross-sectional area decreases, causing the flow rate to increase. (From Patton KT. Anatomy & physiology, 10th edition. St. Louis: Elsevier; 2019.)
Top panel, A. An illustration compares the size of the arteries, capillaries, and veins. Arteries and arterioles: small cross-sectional area, high velocity. Capillaries: large cross-sectional area, low velocity. Veins and venules: small cross-sectional area (larger than that of arteries and arterioles), high velocity. Arrows from the left to the right, along the vessels represent the flow. Bottom panel, B. An illustration shows and labels the following structures, from the left to the right: aorta, arteries, arterioles, capillaries, venules, veins, and vena cava. The upper part of the illustration represents total cross-sectional area. The lower part of the illustration represents velocity of blood flow in milliliters per second. The curve is high and stable initially, falls and is roughly stable for a while, and rises to stabilize at the original level.
Velocity
Blood velocity, or speed, is the distance blood travels in a unit of time, usually centimeters per second (cm/s). It is directly related to blood flow (the amount of blood moved per unit of time) and inversely related to the cross-sectional area of the vessel in which the blood is flowing (see Fig. 31.21). As blood moves from the aorta to the capillaries, the total cross-sectional area of the vessels increases and the velocity decreases.
Laminar Versus Turbulent Flow
Flow through a tubular system can be either laminar or turbulent. Blood flow through the vessels, except where vessels split or branch, is usually laminar. In laminar flow, concentric layers of molecules move “straight ahead,” with each layer flowing at a slightly different velocity (Fig. 31.22A). The cohesive attraction between the fluid and the vessel wall prevents the molecules of blood that are in contact with the wall from moving at all. The next thin layer of blood is able to slide slowly past the stationary layer and so on until, at the center, the blood velocity is greatest. Large vessels have room for a large center layer; therefore they have less resistance to flow and greater flow and velocity than smaller vessels.

(A) Laminar flow. Fluid flows in long, smooth-walled tubes as if it is composed of a large number of concentric layers. (B) Turbulent flow. Turbulent flow is caused by numerous small currents flowing crosswise or oblique to the long axis of the vessel, resulting in flowing whorls and eddy currents.
Top panel, A. The illustration shows a linear tube tracing a parabolic-shaped velocity profile. Bottom panel, B. The illustration shows a branched tube tracing a parabolic-shaped velocity profiles at the trunk and random velocity profiles in the branches.
Where flow is obstructed, the vessel turns or branches, or blood flows over rough surfaces, the flow becomes turbulent with whorls or eddy currents that produce noise, causing a bruit (vascular murmur) to be heard on auscultation (see Fig. 31.22B). Resistance increases with turbulence, which frequently occurs in areas with atherosclerotic plaque (e). Wall shear stress (WSS) is the complex interaction between the vessel wall's endothelial layer and blood hemodynamics. Much investigation is on the consequences of lower WSS and the promotion of atherosclerotic plaque development distal to an induced stenosis.21 Clarifying WSS and the perivascular changes with inflammation, macrophage activation, medial thinning, and plaque disruption is critical to understanding the pathogenesis of atherosclerosis.
Vascular Compliance
Vascular compliance is the increase in volume a vessel can accommodate with a given increase in pressure. Compliance depends on factors related to the nature of a vessel wall, such as the ratio of elastic fibers to muscle fibers in the wall. Elastic arteries are more compliant than muscular arteries. The veins are more compliant than either type of artery because they have less smooth muscle, and they can serve as storage areas for the circulatory system.
Compliance determines a vessel's response to pressure changes. For example, a large volume of blood can be accommodated by the venous system with only a small increase in pressure. In the less compliant arterial system, where smaller volumes and higher pressures are normal, even small changes in blood volume can cause significant changes in arterial pressure.
Stiffness is the opposite of compliance. Several conditions and disorders can cause stiffness, with the most common being aging and atherosclerosis (see Chapter 32). Increases in stiffness of arterial walls increases peak arterial pressure at a given volume of blood.
Regulation of Blood Pressure
Arterial Pressure
The arterial blood pressure is determined by the cardiac output multiplied by the peripheral resistance (Fig. 31.23). The systolic blood pressure is the highest arterial blood pressure after ventricular contraction or systole. The diastolic blood pressure is the lowest arterial blood pressure that occurs during ventricular filling or diastole. The mean arterial pressure (MAP), which is the average pressure in the arteries throughout the cardiac cycle, depends on the elastic properties of the arterial walls and the mean volume of blood in the arterial system. MAP can be approximated from the measured values of the systolic (Ps) and diastolic (Pd) pressures as follows:
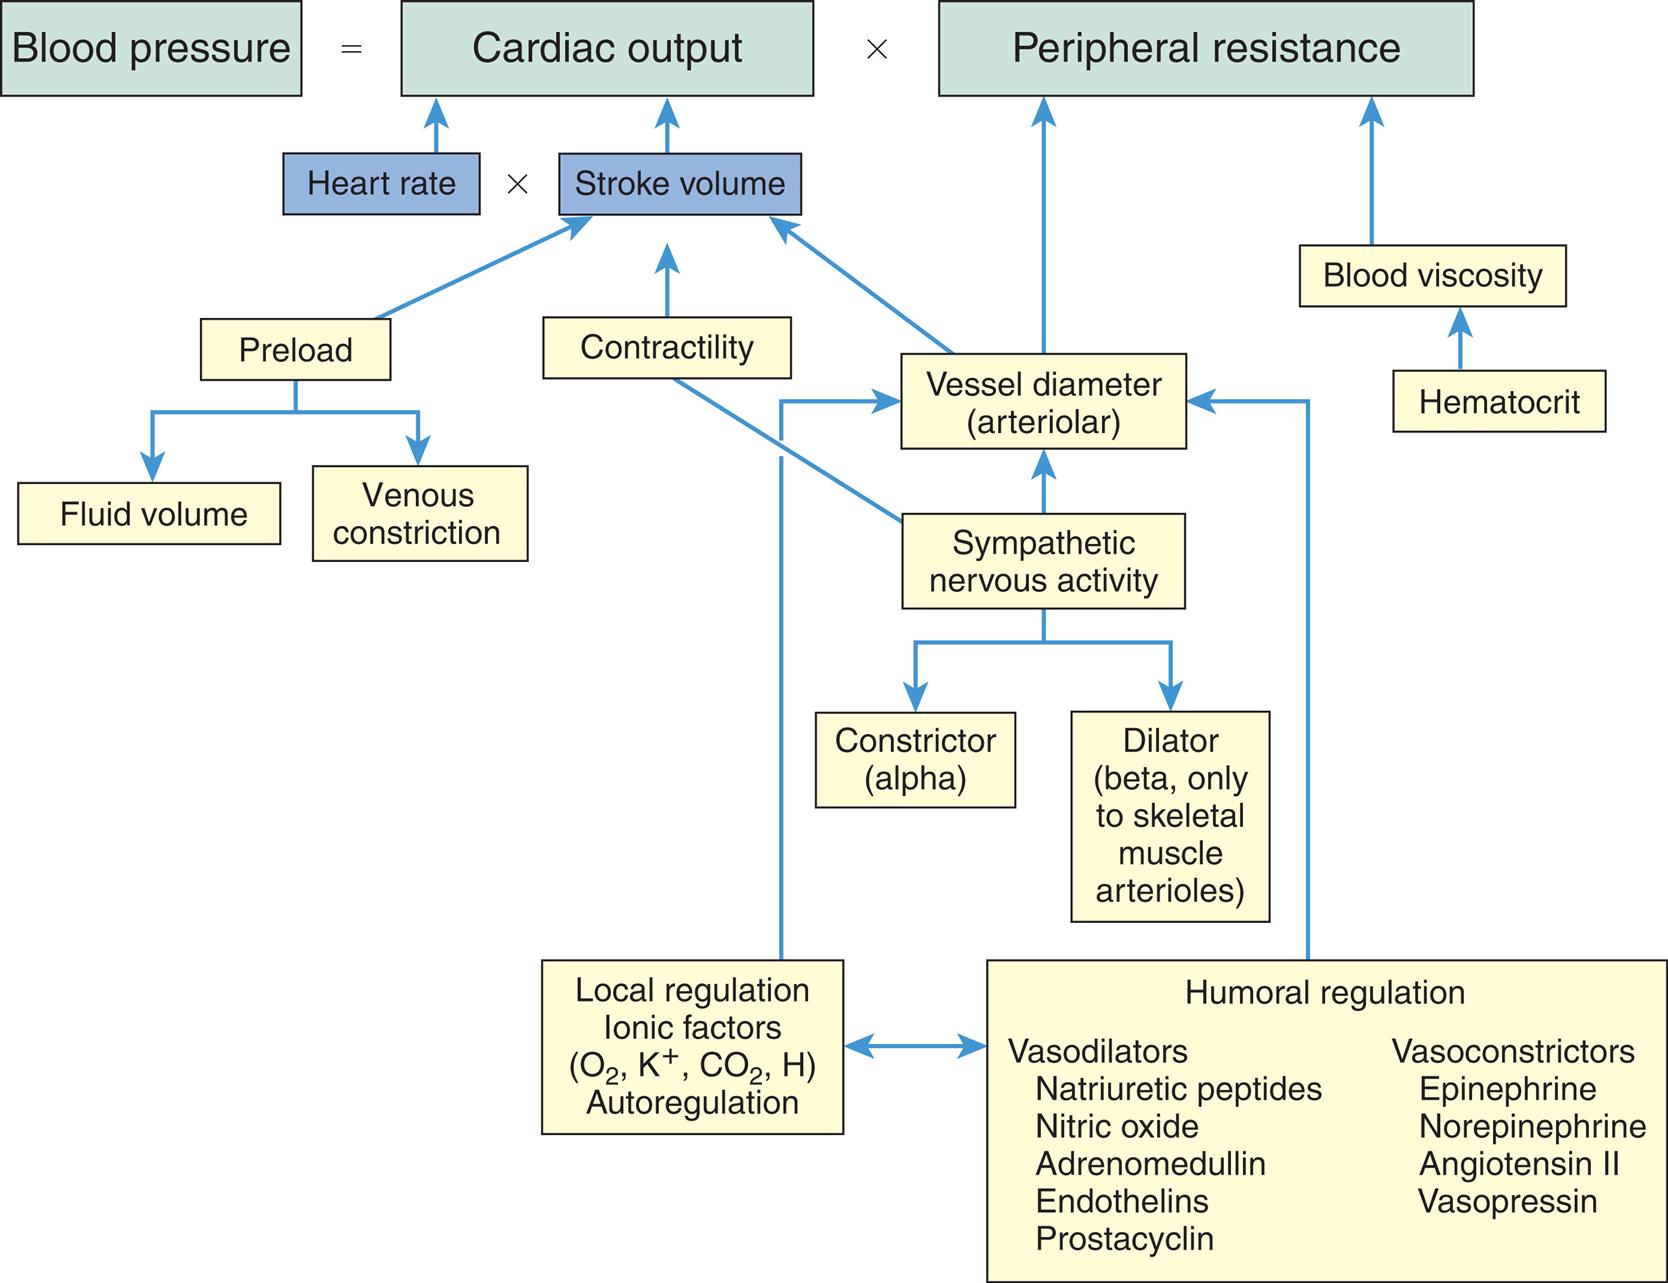
O2, Oxygen; K+, potassium; CO2, carbon dioxide; H, hydrogen.
An equation and an accompanying flowchart show the factors regulating blood pressure. The equation reads: blood pressure equals cardiac output (heart rate multiplied with stroke volume) multiplied with peripheral resistance (P R) or hypertension equals increased C O and or increased P R. • In hypertension increased preload leads to increased fluid volume and venous constriction. • Increased contractility affects the cardiac output. • Vessel diameter (arteriolar) and blood viscosity impact the peripheral resistance. The flowchart shows the following pathways. 1. Humoral regulation (vasodilators and vasoconstrictors). Interrelated with 2. Leads to 3. 2. Local regulation, ionic factors (oxygen, potassium ions, carbon dioxide, and hydrogen), autoregulation. Leads to 3. 3. Vessel diameter (arteriolar). Impacts the peripheral resistance. 4. Sympathetic nervous activity. Leads to 3, 5, and 6. 5. Constrictor (alpha). 6. Dilator (beta, only to skeletal muscle arterioles). Vasodilators include natriuretic peptides, nitric oxide, adrenomedullin, endothelins, and prostacyclin. Vasoconstrictors include epinephrine, norepinephrine, angiotensin 2, and vasopressin.
The normal range for MAP is 70 to 110 mm Hg. The difference between the systolic pressure and the diastolic pressure (Ps − Pd) is called the pulse pressure and typically is between 40 and 50 mm Hg. The pulse pressure is directly related to arterial wall stiffness and stroke volume.
During a wide range of physiologic conditions, including changes in body position, muscular activity, and circulating blood volume, arterial pressure is regulated within a fairly narrow range to maintain tissue perfusion, or blood supply to the capillary beds. The major factors and relationships that regulate arterial blood pressure are summarized in Fig. 31.23.
Effects of Cardiac Output
The cardiac output (minute volume) of the heart can be changed by alterations in the heart rate, stroke volume (volume of blood ejected during each ventricular contraction), or both. An increase in cardiac output without a decrease in peripheral resistance will cause the MAP and flow rate to increase. The higher arterial pressure increases blood flow through the arterioles. On the other hand, a decrease in the cardiac output causes a drop in the MAP and arteriolar flow if peripheral resistance stays constant (Table 31.4).
Table 31.4
| Mean Arterial Pressure | Capillary Flow | |
|---|---|---|
| Peripheral Resistancea | ||
| Increased | Increased | Decreased |
| Decreased | Decreased | Increased |
| Heart Rateb | ||
| Increased | Increased | Increased |
| Decreased | Decreased | Decreased |
| Stroke Volumec | ||
| Increased | Increased | Increased |
| Decreased | Decreased | Decreased |
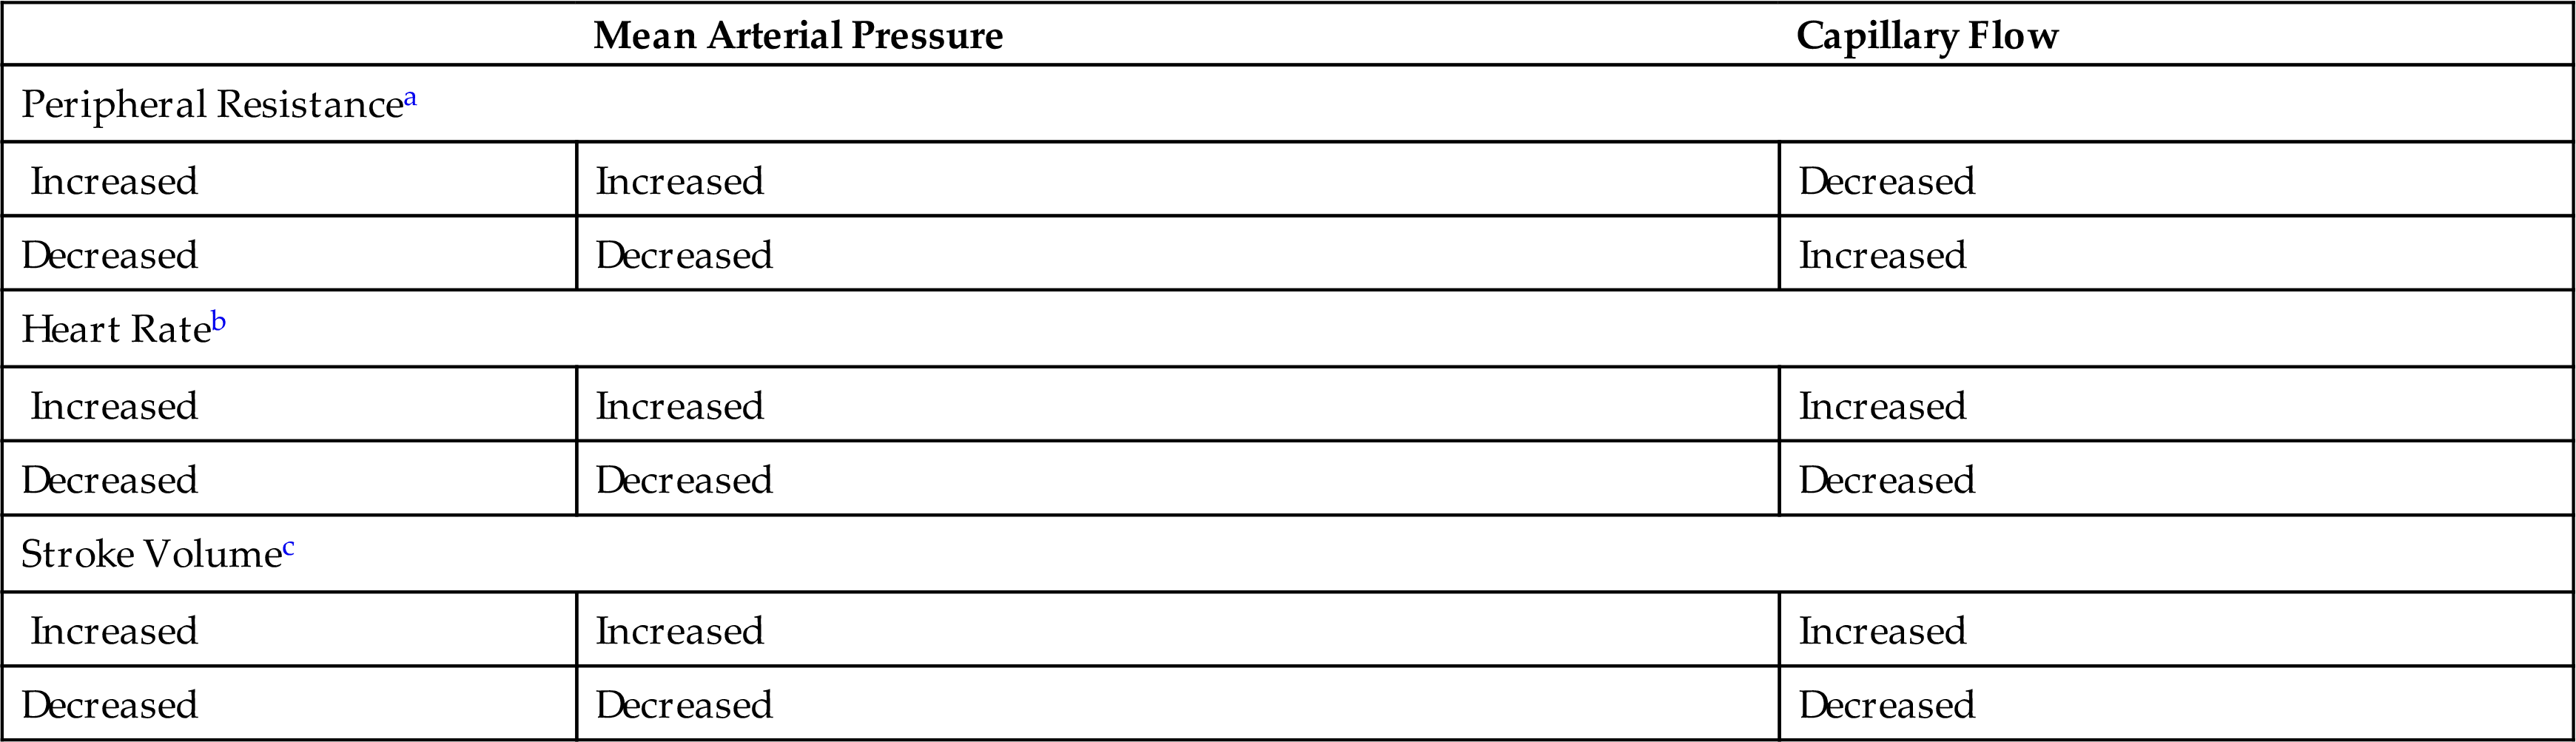
aCardiac output maintained constant.
bPeripheral resistance and stroke volume constant.
cPeripheral resistance and heart rate constant.
From Little RC. Physiology of the Heart and Circulation. 3rd ed. St Louis: Mosby; 1985.
Effects of Total Peripheral Resistance
Total resistance in the systemic circulation, known as either SVR or TPR, is primarily a function of arteriolar diameter. If cardiac output remains constant, arteriolar constriction raises the MAP by reducing the flow of blood into the capillaries, whereas arteriolar dilation has the opposite effect. Reflex control of total cardiac output and peripheral resistance includes (1) sympathetic stimulation of the heart, arterioles, and veins; and (2) parasympathetic stimulation of the heart (Fig. 31.24). The cardiovascular center in the medulla receives input from arterial baroreceptors and chemoreceptors throughout the vascular system and then modifies vagal and sympathetic output to control heart rate and contractility, plus vascular diameter. Vasoconstriction is regulated by an area of the brainstem that maintains a constant (tonic) output of norepinephrine from sympathetic fibers in the peripheral arterioles. This tonic activity is essential for maintenance of blood pressure.
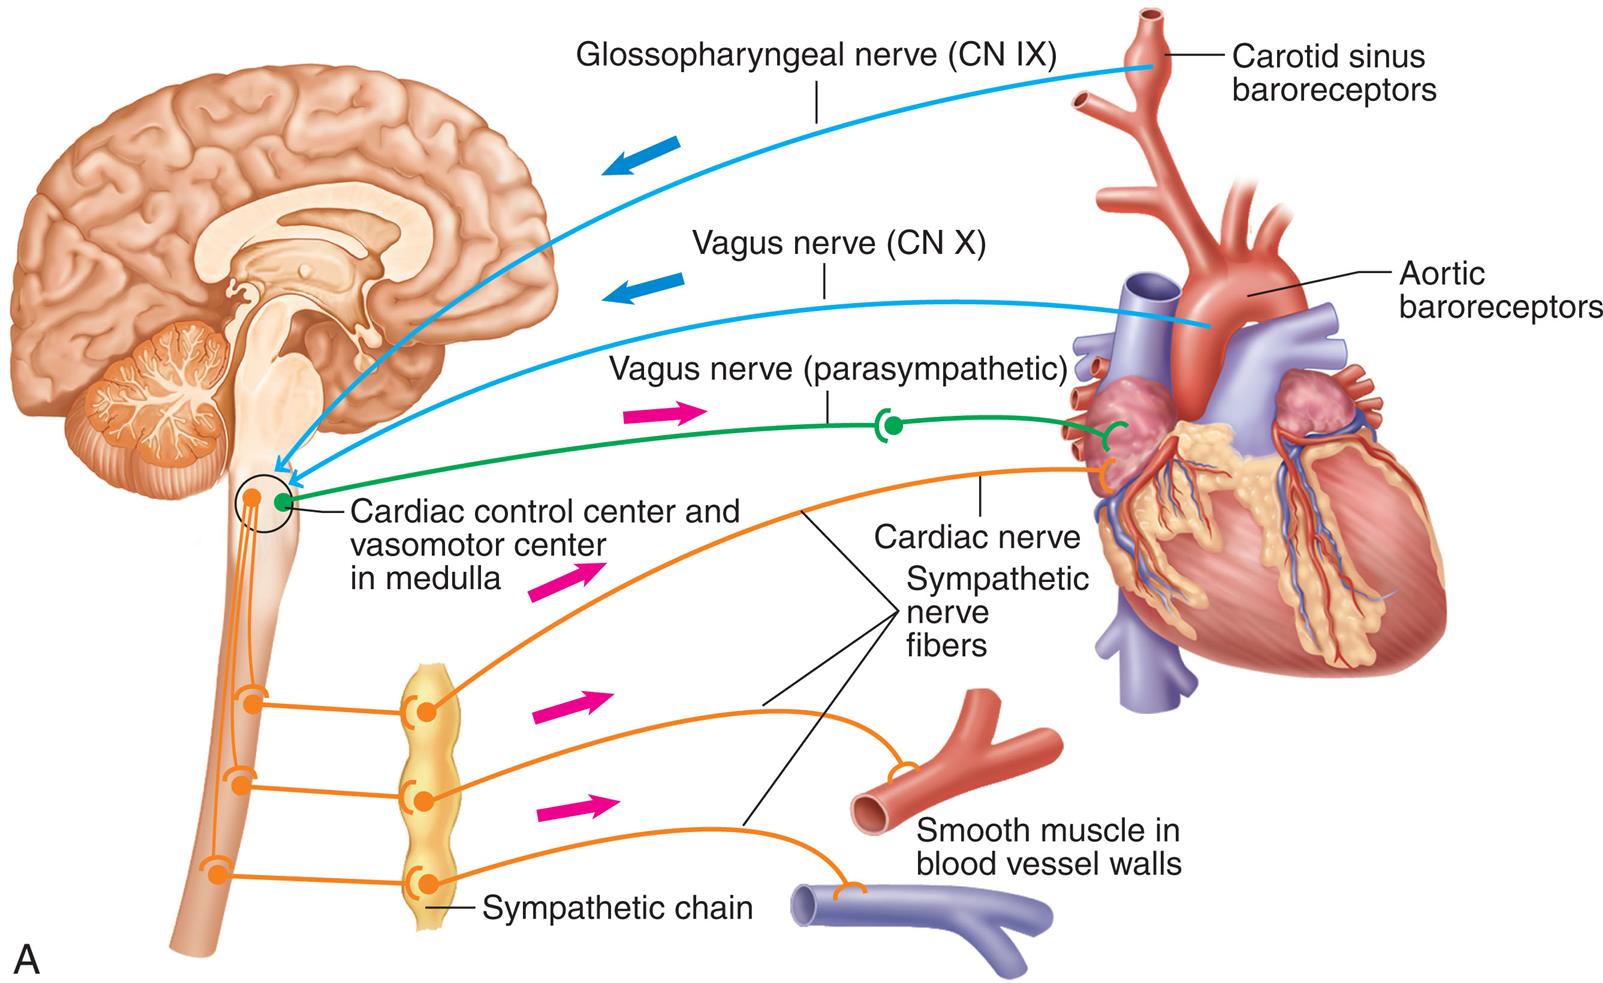
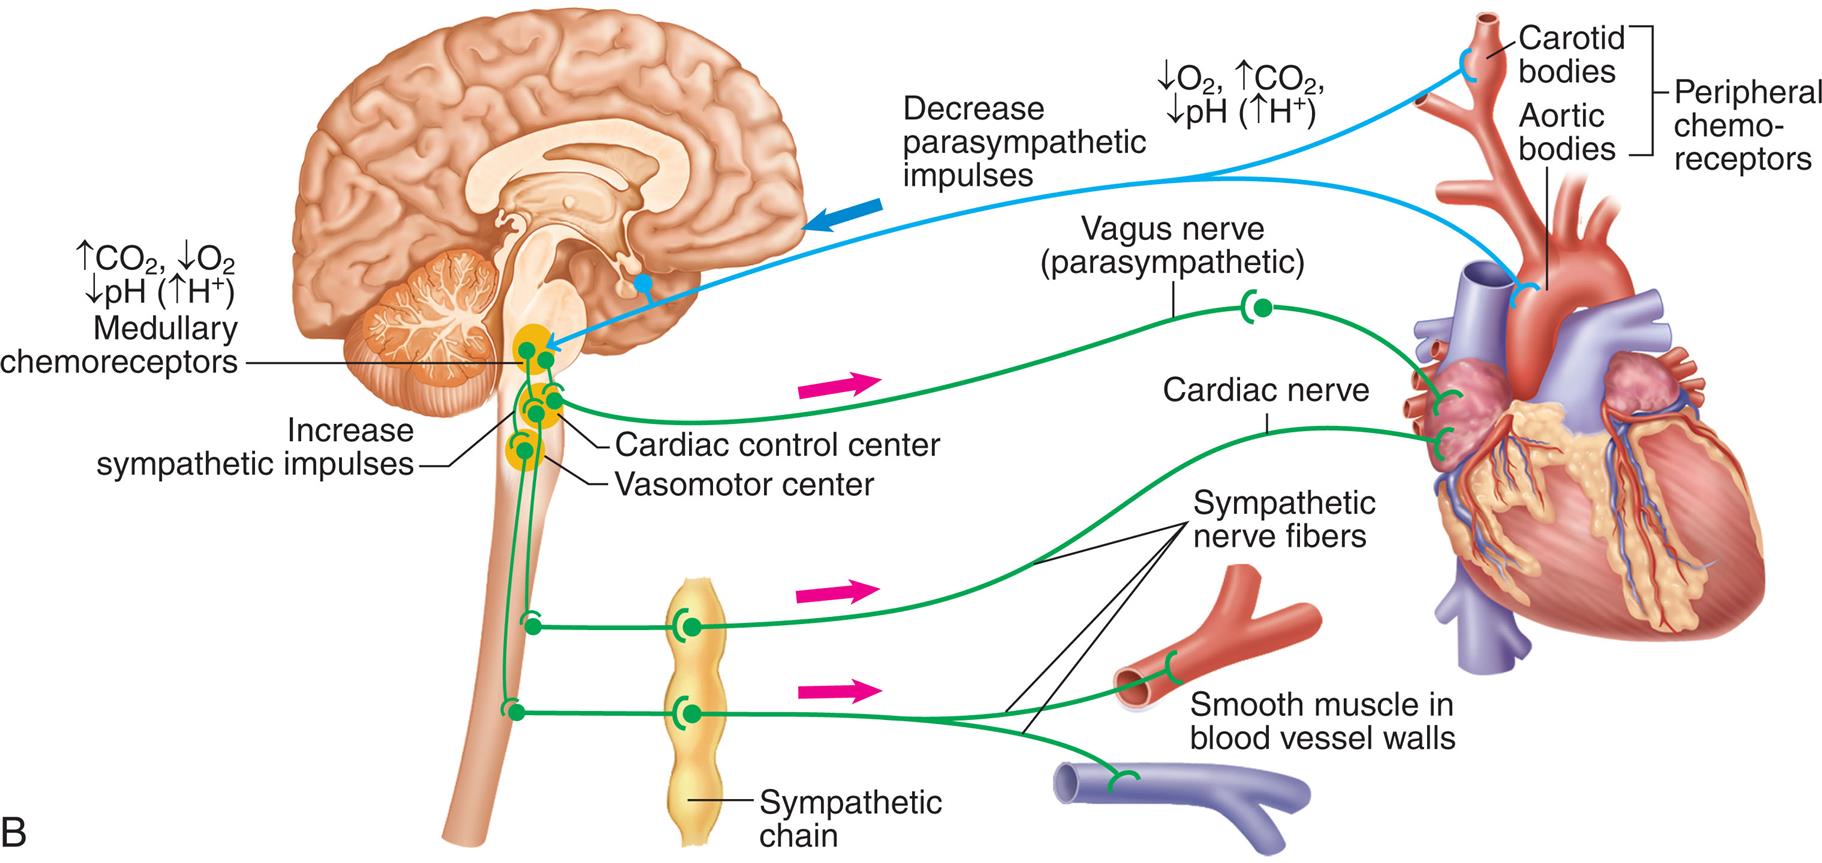
(A) Baroreceptor reflexes. (B) Vasomotor chemoreflexes. CN, Cranial nerve; O2, oxygen; CO2, carbon dioxide; H+, hydrogen. (Modified from Patton KT. Anatomy & physiology, 10th edition. St. Louis: Elsevier; 2019.)
Top panel, A. An illustration of the brain and the heart shows the baroreceptor reflexes. The reflexes are as follows. • Carotid sinus baroreceptors, through glossopharyngeal nerve (C N 9) to cardiac control center and vasomotor center in medulla. • Carotid sinus baroreceptors, through vagus nerve (C N 10) to cardiac control center and vasomotor center in medulla. • Cardiac control center and vasomotor center in medulla, through vagus nerve (parasympathetic) to heart. • Sympathetic chain to cardiac nerve, sympathetic nerve fibers, and smooth muscle in blood vessel walls. Bottom panel, B. An illustration of the brain and the heart shows the vasomotor chemoreflexes. • Peripheral chemoreceptors (carotid bodies, aortic bodies): decreased oxygen, increased carbon dioxide, decreased p H (increased hydrogen ions) result in decreased parasympathetic impulses. • Medullary chemoreceptors: increased carbon dioxide, decreased oxygen, decreased p H (increased hydrogen ions). • Increase sympathetic impulses. • Cardiac control center through vagus nerve (parasympathetic) to heart. • Sympathetic chain to cardiac nerve, sympathetic nerve fibers, and smooth muscle in blood vessel walls.
Baroreceptors
As discussed previously, baroreceptors are stretch receptors located predominantly in the aorta and in the carotid sinus (see Fig. 31.24A). They respond to pressure-related changes in smooth muscle fiber length by altering their rate of discharge and supply sensory information to the cardiovascular center in the brainstem. When activated (stretched), the baroreceptors decrease cardiac output by lowering the heart rate, stroke volume, and peripheral resistance, and thus lower blood pressure.
Arterial chemoreceptors
Specialized areas within the medulla oblongata, aortic arch, and carotid arteries are sensitive to concentrations of O2, carbon dioxide (CO2), and hydrogen ions (pH) in the blood (see Fig. 31.24B). Although these chemoreceptors are most important for respiratory control, they also transmit impulses to the medullary cardiovascular centers that regulate blood pressure. A decrease in arterial oxygen concentration (hypoxemia), an increase in arterial PaCO2 concentration, or to a lesser extent a decrease in arterial blood pH causes a reflexive increase in heart rate, stroke volume, and blood pressure.
Effects of hormones
Hormones influence blood pressure regulation through their effects on vascular smooth muscle and blood volume. By constricting or dilating the arterioles in organs, hormones can (1) increase or decrease the blood flow in response to the body's needs, (2) redistribute blood volume during hemorrhage or shock, and (3) regulate heat loss. The key vasoconstrictor hormones include angiotensin II, antidiuretic hormone (ADH; vasopressin), epinephrine, and norepinephrine. The main vasodilator hormones are the atrial natriuretic hormones, nitric oxide, adrenomedullin, and endothelins. By causing fluid retention or loss, aldosterone, ADH, and the natriuretic hormones can influence stroke volume and thus blood pressure. A variety of other hormones, including adipokines and insulin, may be related to the hypertension that occurs with chronic conditions, such as adiposity and diabetes mellitus. However, these factors have not been clearly demonstrated to play a role in blood pressure regulation in healthy individuals.
Vasoconstrictor hormones
The vasoconstrictor hormones include epinephrine; norepinephrine; angiotensin II, which is part of the renin-angiotensin-aldosterone system (RAAS) (see Chapters 5 and 32); and ADH. Epinephrine, the catecholamine hormone released from the adrenal medulla, causes vasoconstriction in most vascular beds except the coronary, liver, and skeletal muscle circulations. Norepinephrine mainly acts as a neurotransmitter; however, some also is released from the adrenal medulla. When the RAAS is activated, angiotensin II (ANG II) binds to the AT1 receptor and serves as a potent vasoconstrictor. Other RAAS pathways oppose this action (see Fig. 32.2). High levels of aldosterone also can increase vascular tone.
ADH and aldosterone also affect blood pressure by increasing blood volume through their influence on fluid reabsorption in the kidney and by stimulating thirst. ADH causes the reabsorption of water from tubular fluid in the distal tubule and collecting duct of the nephron. Aldosterone, the end product of the RAAS, stimulates the reabsorption of sodium, chloride, and water from the same locations in the kidney (Fig. 31.25; also see Chapters 3 and 22).
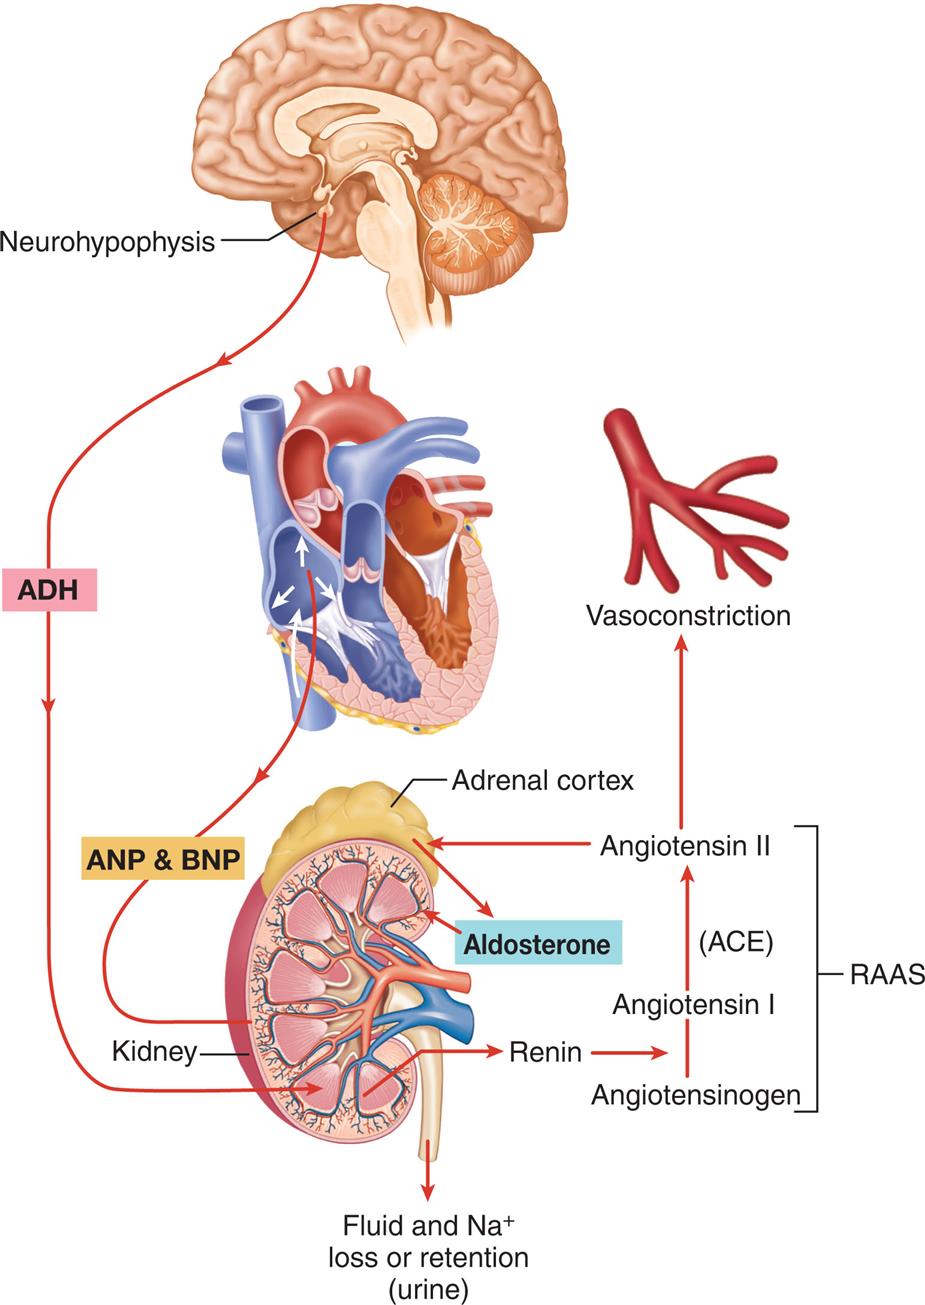
Antidiuretic hormone (ADH) mechanism and renin-angiotensin-aldosterone system (RAAS) to increase water and sodium retention by the kidney and thus increase total plasma volume. Atrial natriuretic peptide (ANP) and B-type natriuretic peptide (BNP) antagonize these mechanisms by promoting water and sodium loss, thus promoting a decrease in total plasma volume. ACE, Angiotensin-converting enzyme; Na+, sodium. (Modified from Patton, K. T. [2019]. Anatomy & physiology [10th ed.]. St Louis: Elsevier.) ACE, Angiotensin-converting enzyme; Na+, sodium. (Modified from Patton KT. Anatomy & physiology, 10th edition. St. Louis: Elsevier; 2019.)
An illustration shows the three mechanisms influencing total plasma volume. • A D H from neurohypophysis triggers the kidney. • A N P and B N P from the heart trigger the kidney. • Fluid and sodium ions loss or retention (urine). • Renin converts angiotensinogen to angiotensin 1 and angiotensin 1 is converted to angiotensin 2 in the presence of A C E which results in vasoconstriction. • R A S S: angiotensin 1 to A C E to angiotensin 2 to adrenal cortex that releases aldosterone to the kidney. • R A S S to vasoconstriction.
Vasodilator hormones
There are numerous vasodilator hormones, most of which have other important effects on blood volume and vascular function. The natriuretic peptides (NPs) include atrial natriuretic peptide (ANP), B-type natriuretic peptide (BNP), C-type natriuretic peptide (CNP), and urodilatin. These hormones function as both vasodilators and regulators of sodium and water excretion (natriuresis and diuresis) (see Chapter 3). ANP and BNP are released from myocytes in heart. Increased pressure or diastolic volume in the heart stimulates the release of these peptide hormones which then stimulate secretion of sodium and water from the kidney (see Fig. 31.25). Serum levels of BNP are increased in many types of cardiac disease including heart failure, hypertension, pulmonary embolism, valvular heart disease, and chronic coronary artery disease, and can be used to predict prognosis. Neprilysin is a drug that prevents the degradation of the natriuretic peptides and can be used in combination with other medications for the treatment of severe acute heart failure (see Chapter 32).22 Many studies are underway to develop other medications that can mimic the positive effects of the natriuretic peptides.23
Other vasodilating mediators include nitric oxide (NO), adrenomedullin (ADM), the endothelins, and prostacyclin. These mediators are being investigated to determine if they or their inhibitors might be useful drugs for the treatment of cardiovascular diseases or if their levels might be useful in determining the prognosis of persons with known disease. Nitric oxide (NO) is a soluble gas continuously synthesized in endothelial cells by the enzyme nitric oxide synthase (NOS). NO has a wide range of biologic properties that maintain vascular homeostasis, including modulation of vascular dilator tone, regulation of local cell growth, and protection of the vessel from injurious consequences of platelets and cells circulating in blood. NO plays a crucial role in the normal endothelial function. An emerging list of conditions, including those commonly associated as risk factors for atherosclerosis such as hypertension, hypercholesterolemia, smoking, diabetes mellitus, and heart failure, is associated with diminished release of nitric oxide into the arterial wall because of impaired synthesis or excessive oxidative degradation (Fig. 31.26).24,25 Adrenomedullin (ADM), a peptide with powerful vasodilatory activity, is present in numerous tissues. It has been found to have numerous cardiovascular effects, including a role in fetal cardiovascular system development and vasodilation. ADM is released by endothelial cells in conditions of vascular wall stress and plays a role in controlling vascular tone and blood pressure.26 The endothelins are a family of three structurally similar peptides (ET-1, ET-2, and ET-3) and four receptors produced in cells in the vascular smooth muscle, the endothelium, the kidneys, and other organs. Understanding the physiologic and pathologic roles of these peptides has been complicated by the fact that endothelin binding to some receptors causes vasodilation and natriuresis, whereas binding to other receptors causes the opposite response—vasoconstriction plus sodium and water retention. Inhibitors to ET-1 have been approved for the treatment of pulmonary hypertension (see Chapter 35).
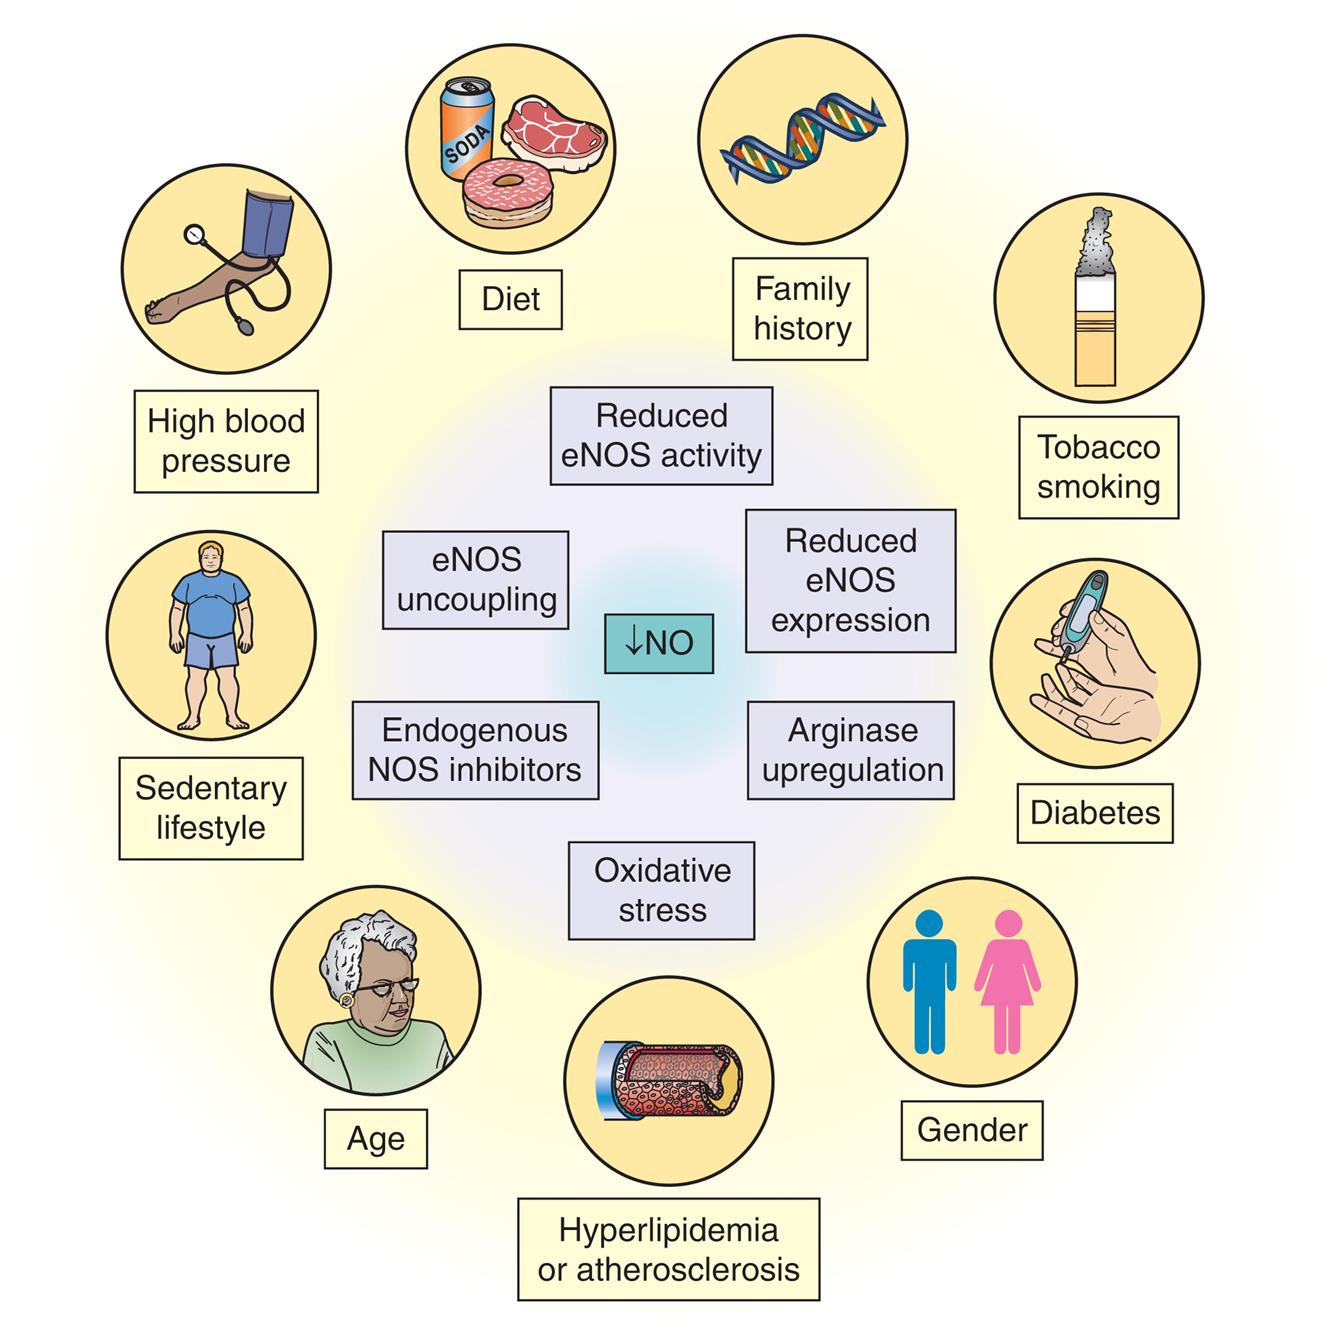
eNOS, Endothelial nitric oxide synthase. (Adapted from Lundberg JO, Gladwin MT, Weitzberg E. Strategies to increase nitric oxide signalling in cardiovascular disease. Nature Review Drug Discovery, 2015;14:623–641.)
An illustration lists the lifestyle factors associated with reduced bioavailability of nitric oxide: diet, family history, tobacco smoking, diabetes, gender, hyperlipidemia or atherosclerosis, age, sedentary lifestyle, high blood pressure. Reduced nitric oxide also leads to reduced e N O S activity, reduced e N O S expression, arginase upregulation, oxidative stress, endogenous N O S inhibitors, and e N O S uncoupling.
Prostacyclin is a vasodilator that is produced by the actions of cyclooxygenases (COX-1 and COX-2) on arachidonic acid. It has the additional properties of opposing clot formation (antithrombotic), decreasing platelet activity, and inhibiting the release of growth factors from macrophages and the endothelial cells. Nonsteroidal antiinflammatory drugs (NSAIDs) that inhibit these cyclooxygenases have been associated with cardiovascular disease risk in healthy people and in those with a known cardiovascular disease.27
Venous Pressure
The main determinants of venous blood pressure are (1) the volume of fluid within the veins and (2) the compliance (distensibility) of the vessel walls. The venous system typically accommodates about 66% of the total blood volume at any time, with venous pressure averaging less than 10 mm Hg. The systemic arteries accommodate about 11% of the total blood volume, with an average arterial pressure (blood pressure) of about 100 mm Hg; the remainder of the blood volume is within the heart, capillaries, and pulmonary circulation.
The sympathetic nervous system controls venous compliance. The walls of the veins are highly innervated by sympathetic fibers that control venous smooth muscle. Rather than constriction that would occur in the arteries, smooth muscle contraction in the veins results in stiffening of the vessel walls. This stiffening reduces venous distensibility and increases venous blood pressure, thus forcing more blood through the veins and into the right heart.
Two other mechanisms that increase venous pressure and venous return to the heart are (1) the skeletal muscle pump and (2) the respiratory pump. During skeletal muscle contraction, the veins within the muscles are partially compressed, causing decreased venous capacity and increased return to the heart (see Fig. 31.20B). The respiratory pump acts during inspiration, when the veins of the abdomen are partially compressed by the downward movement of the diaphragm. Increased abdominal pressure moves blood toward the heart.
Regulation of the Coronary Circulation
Coronary blood flow is directly proportional to the perfusion pressure and inversely proportional to the vascular resistance of the coronary bed. Coronary perfusion pressure is the difference between pressure in the aorta and pressure in the coronary vessels. Thus, aortic pressure is the driving pressure for the arteries and arterioles that perfuse the myocardium. Vasodilation and vasoconstriction maintain coronary blood flow despite stresses imposed by the constant contraction and relaxation of the heart muscle and despite shifts (within a physiologic range) of coronary perfusion pressure.
Several unique anatomic factors influence coronary blood flow. Because of their anatomic location, the aortic valve cusps can obstruct coronary blood flow by occluding the openings of the coronary arteries during systole. Also during systole, the coronary arteries are compressed by ventricular contraction. The resulting systolic compressive effect is particularly evident in the subendocardial layers of the left ventricular wall and can greatly increase resistance to coronary blood flow, with the result that most left ventricular coronary blood flow occurs during diastole. During the period of systolic compression, when flow is slowed or stopped, myoglobin, a protein in heart muscle that binds O2, provides the supply of O2 to the myocardium. Myoglobin's O2 levels are replenished during diastole.
Autoregulation
Autoregulation (automatic self-regulation) enables organs to regulate blood flow by altering the resistance (diameter) in their arterioles. Autoregulation in the coronary circulation maintains the blood flow at a nearly constant rate at perfusion pressures (MAP) between 60 and 140 mm Hg when other influencing factors are held constant. Thus autoregulation helps to ensure constant coronary blood flow despite shifts in the perfusion pressure within the stated range.
Given that blood flow is directly related to pressure and inversely related to resistance, for flow to stay constant as pressure decreases, resistance also has to decrease; therefore the mechanisms underlying autoregulation must be related to control of smooth muscle contraction in the arteriolar walls.
Autonomic Regulation
Although the coronary vessels themselves contain sympathetic (α- and β-adrenergic) and parasympathetic neural receptors, coronary blood flow during regular activity is regulated locally by the factors that cause autoregulation. During exercise, however, the vasodilating effects of β2-receptors on the smaller coronary resistance arteries are responsible for about 25% of any increase in blood flow. At the same time, α-adrenergic receptors in larger arteries cause vasoconstriction to direct the blood flow to the inner layers of the myocardium.
Lymphatic System
The lymphatic system is a one-way network of lymphatic vessels and the lymph nodes (Figs. 31.27 and 31.28) that is important for immune function, fluid balance, and transport of lipids, hormones, and cytokines and is considered to be part of the circulatory system. Every day about 3 liters of fluid filters out of venous capillaries in body tissues and is not reabsorbed (Fig. 31.29). This fluid becomes the lymph that is carried by the lymphatic vessels to the chest, where it enters the venous circulation. The lymphatic vessels run in the same sheaths with the arteries and veins. (Lymph nodes and lymphoid tissues are described in Chapters 8 and 28.) The lymphatic capillaries are closed at the distal ends, as shown in Fig. 31.29.
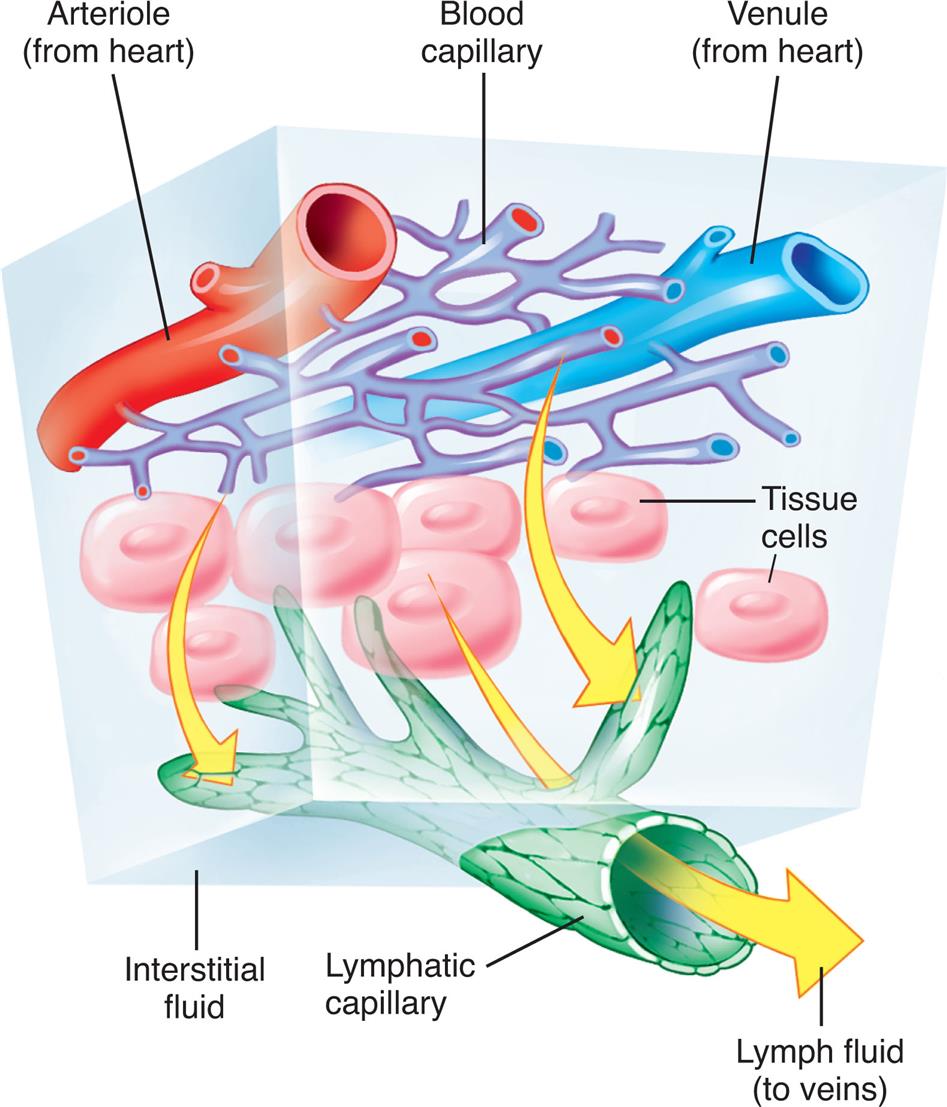
Fluid from plasma flowing through the capillaries moves into interstitial spaces. Although most of this interstitial fluid is either absorbed by tissue cells or reabsorbed by blood capillaries, some of the fluid tends to accumulate in the interstitial spaces. This lymph then diffuses into the lymphatic vessels that carry it to the lymph nodes and then into the systemic venous blood. Green is used to diagram the lymphatic vessels although the lymphatic vessels, particularly the smaller ones, are almost transparent. (Modified from Thibodeau GA, Patton KT. Structure & function of the body, 13th edition. St. Louis: Elsevier; 2008.)
An illustration of the cross-section of the lymphatic system in fluid balance shows and labels the following structures, from the top to the bottom: arteriole (from heart), blood capillary, venule (from heart), tissue cells, interstitial fluid, lymphatic capillary, and lymph fluid (to veins). Arrows from the blood capillaries flow through and out of the lymphatic capillary indicate the direction of the flow.
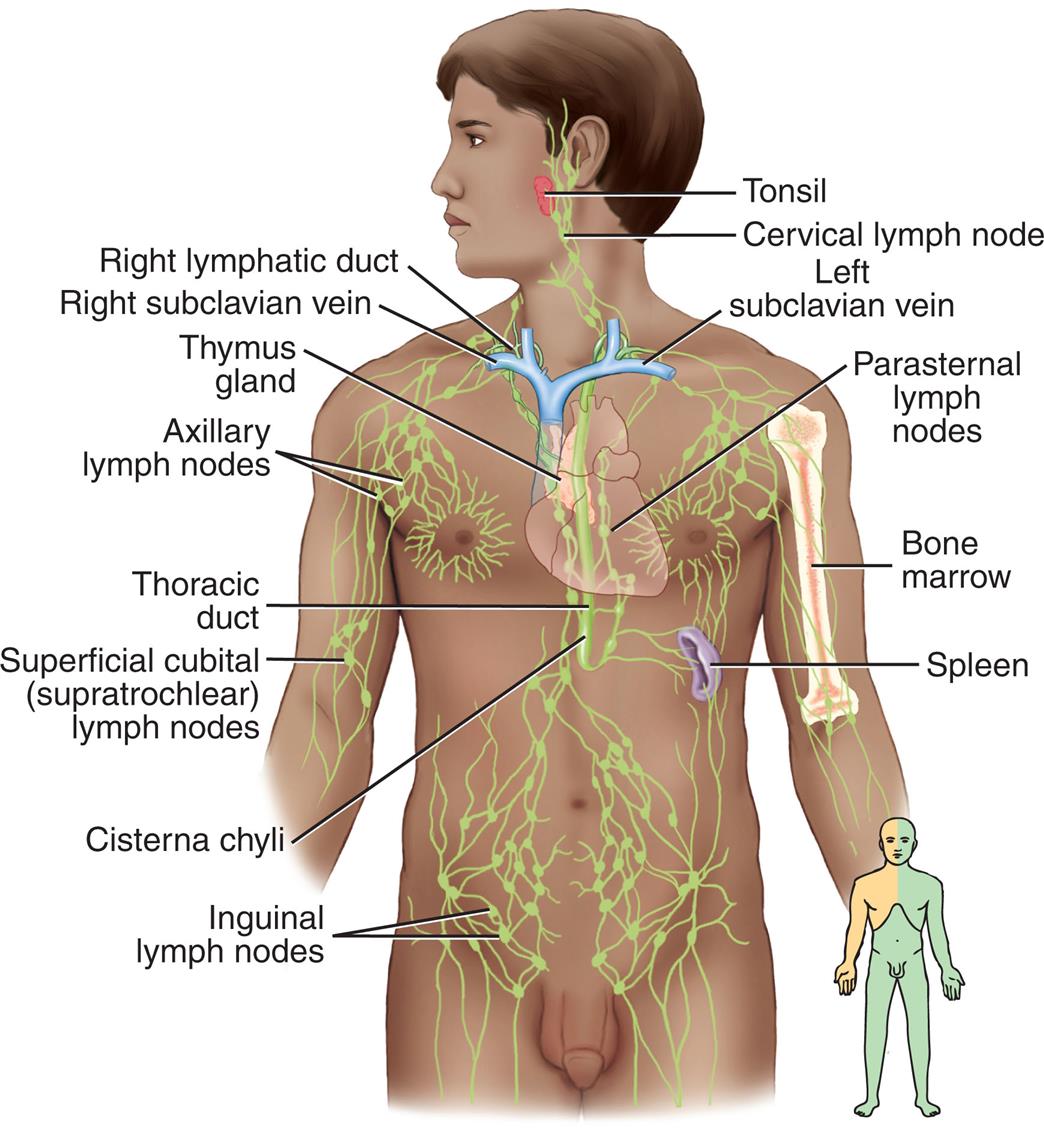
An illustration of the anterior view of a person shows and identifies the principal organs of the lymphatic system, clockwise from the top-right: tonsil, cervical lymph node, left subclavian vein, parasternal lymph nodes, bone marrow, spleen, inguinal lymph nodes, cisterna chyli, superficial cubital (supratrochlear) lymph nodes, thoracic duct, axillary lymph nodes, thymus gland, right subclavian vein, and right lymphatic duct.
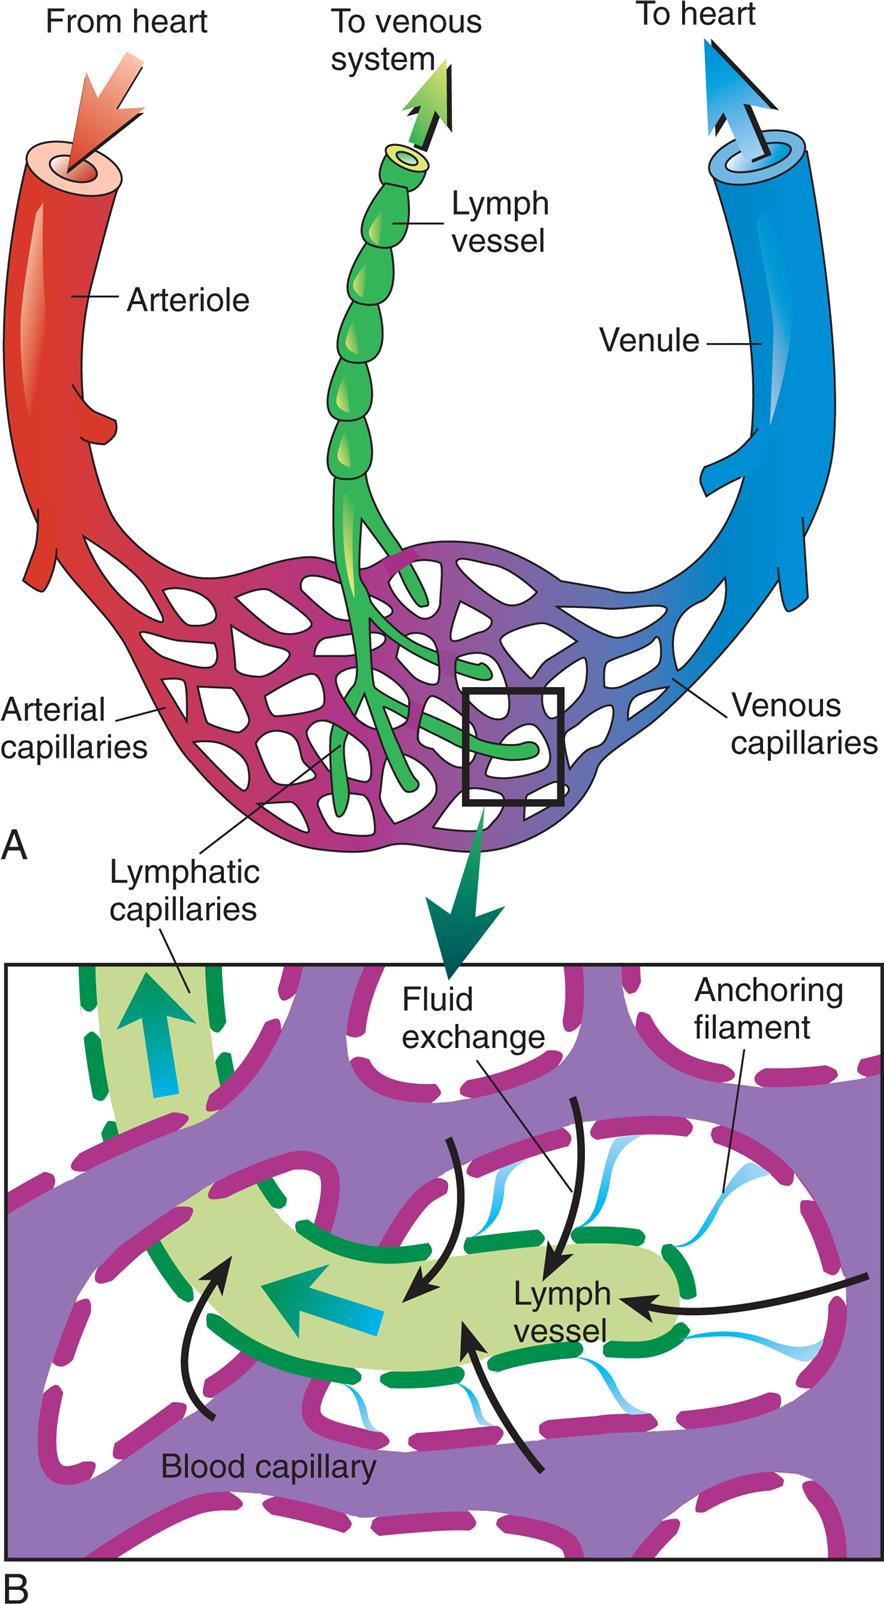
Top panel, A. The illustration shows the lymphatic capillaries. The flow of blood from heart is as follows: from heart to arteriole to arterial capillaries to venous capillaries to venule to heart. The lymphatic capillaries enmeshed with the capillaries connects to the lymph vessel, which leads to the venous system. Bottom panel, B. The illustration shows a magnified view of the microcirculation. The illustration shows anchoring filaments binding the capillaries and the lymph vessel. Fluid exchange occurs capillaries to lymph vessel.
In this pumpless system, a series of valves ensures one-way flow of the excess interstitial fluid (now called lymph) toward the heart. Lymph consists primarily of water and small amounts of dissolved proteins, mostly albumin, that are too large to be reabsorbed into the less permeable blood capillaries. Lymph also carries two types of immune system cells: lymphocytes and antigen-presenting cells. The antigen-presenting cells are carried to the next lymph node in the system, whereas lymphocytes traffic between lymph nodes. Once within the lymphatic system, lymph travels through lymphatic venules and veins that drain into one of two large ducts in the thorax: the right lymphatic duct and the thoracic duct. The right lymphatic duct drains lymph from the right arm and the right side of the head and thorax, whereas the larger thoracic duct receives lymph from the rest of the body (see Fig. 31.28). The right lymphatic duct and the thoracic duct drain lymph into the right and left subclavian veins, respectively.
Lymphatic veins are thin walled like the veins of the cardiovascular system. In larger lymphatic veins, endothelial flaps form valves similar to those in blood-carrying veins. The valves allow lymph to flow in only one direction, because lymphatic vessels are compressed intermittently by skeletal muscle contraction, pulsating expansion of the artery in the same sheath, and contraction of the smooth muscles in the walls of the lymphatic vessels.
As lymph is transported toward the heart, it is filtered through thousands of bean-shaped lymph nodes clustered along the lymphatic vessels (see Fig. 31.28). Lymph enters the nodes through afferent lymphatic vessels, filters through the sinuses in the node, and leaves by way of efferent lymphatic vessels. Lymph flows slowly through a node, allowing phagocytosis of foreign substances within the node and delivery of lymphocytes. (Phagocytosis is described in Chapter 7.)
Tests of Cardiovascular Function
Assessment of the individual with suspected cardiovascular disorders begins with a thorough history for determination of risk factors and symptoms. A careful physical examination looking for evidence of tissue ischemia, pulmonary congestion, and cardiac dysfunction is next. Blood samples are taken and sent for a variety of tests. For many individuals, these basic steps will be complemented with methods that measure heart and vascular function with greater specificity. Cardiac function can be evaluated using indicators calculated from pressures and flow rates in the heart and vessels. Table 31.5 defines the indicators most often used in the clinical setting. The normal values for several testing methods are different for men and women.
Table 31.5
| Indicator | Definitiona | Common Cause of Abnormality |
|---|---|---|
| Heart rate (HR) | Number of heartbeats (cardiac cycles) per minute | Ischemia, electrolyte disturbances, drug toxicity |
| Normal adult value: 70 beats/min | ||
| Cardiac output (CO) | Amount of blood (in L) moved by the heart in 1 min | Decrease indicates heart failure |
| Normal range: 4–8 L/min | Increase indicates decreased systemic vascular resistance, common in sepsis | |
| Cardiac index (CI) | Relationship between cardiac output and body surface area (BSA, in m2) | |
| Normal range: 2.8–4.2 L/min/m2 | ||
| Stroke volume (SV) | Amount of blood (in mL) ejected by the left ventricle during systole (i.e., per beat) | |
| Normal range: 60–100 mL/beat | ||
| Stroke volume index (SVI) | Relationship between stroke volume and body surface area | |
| Normal range: 33–47 mL/beat/m2 | ||
| Ejection Fraction (EF) | Percentage of total ventricular end-diastolic volume ejected with each beat | |
| Normal range 50%–75% | ||
| Oxygen consumption index (V2) | Amount of oxygen (in mL) consumed per minute in relation to BSA | |
| Stroke work index (SWI) | Amount of work (expressed as done) by the left or right ventricle per systole per square meter of BSA | Decreases within specific ranges indicate cardiogenic or hypovolemic shock (see Chapter 48) |
| Normal value: 35 g/m2 | Increase: elevated systemic vascular resistance | |
| Systemic mean arterial pressure (MAP) | Mean blood pressure (in mm Hg) in the systemic arteries | |
| Normal range: 70–100 mm Hg | ||
| Pulmonary vascular resistance (PVR) | Relationship among cardiac output, preload, and afterload, expressed as units of force of resistance per second per centimeter of water | |
| Normal value: <250 dynes/s/cm–5 | ||
| Systemic vascular resistance (SVR) |
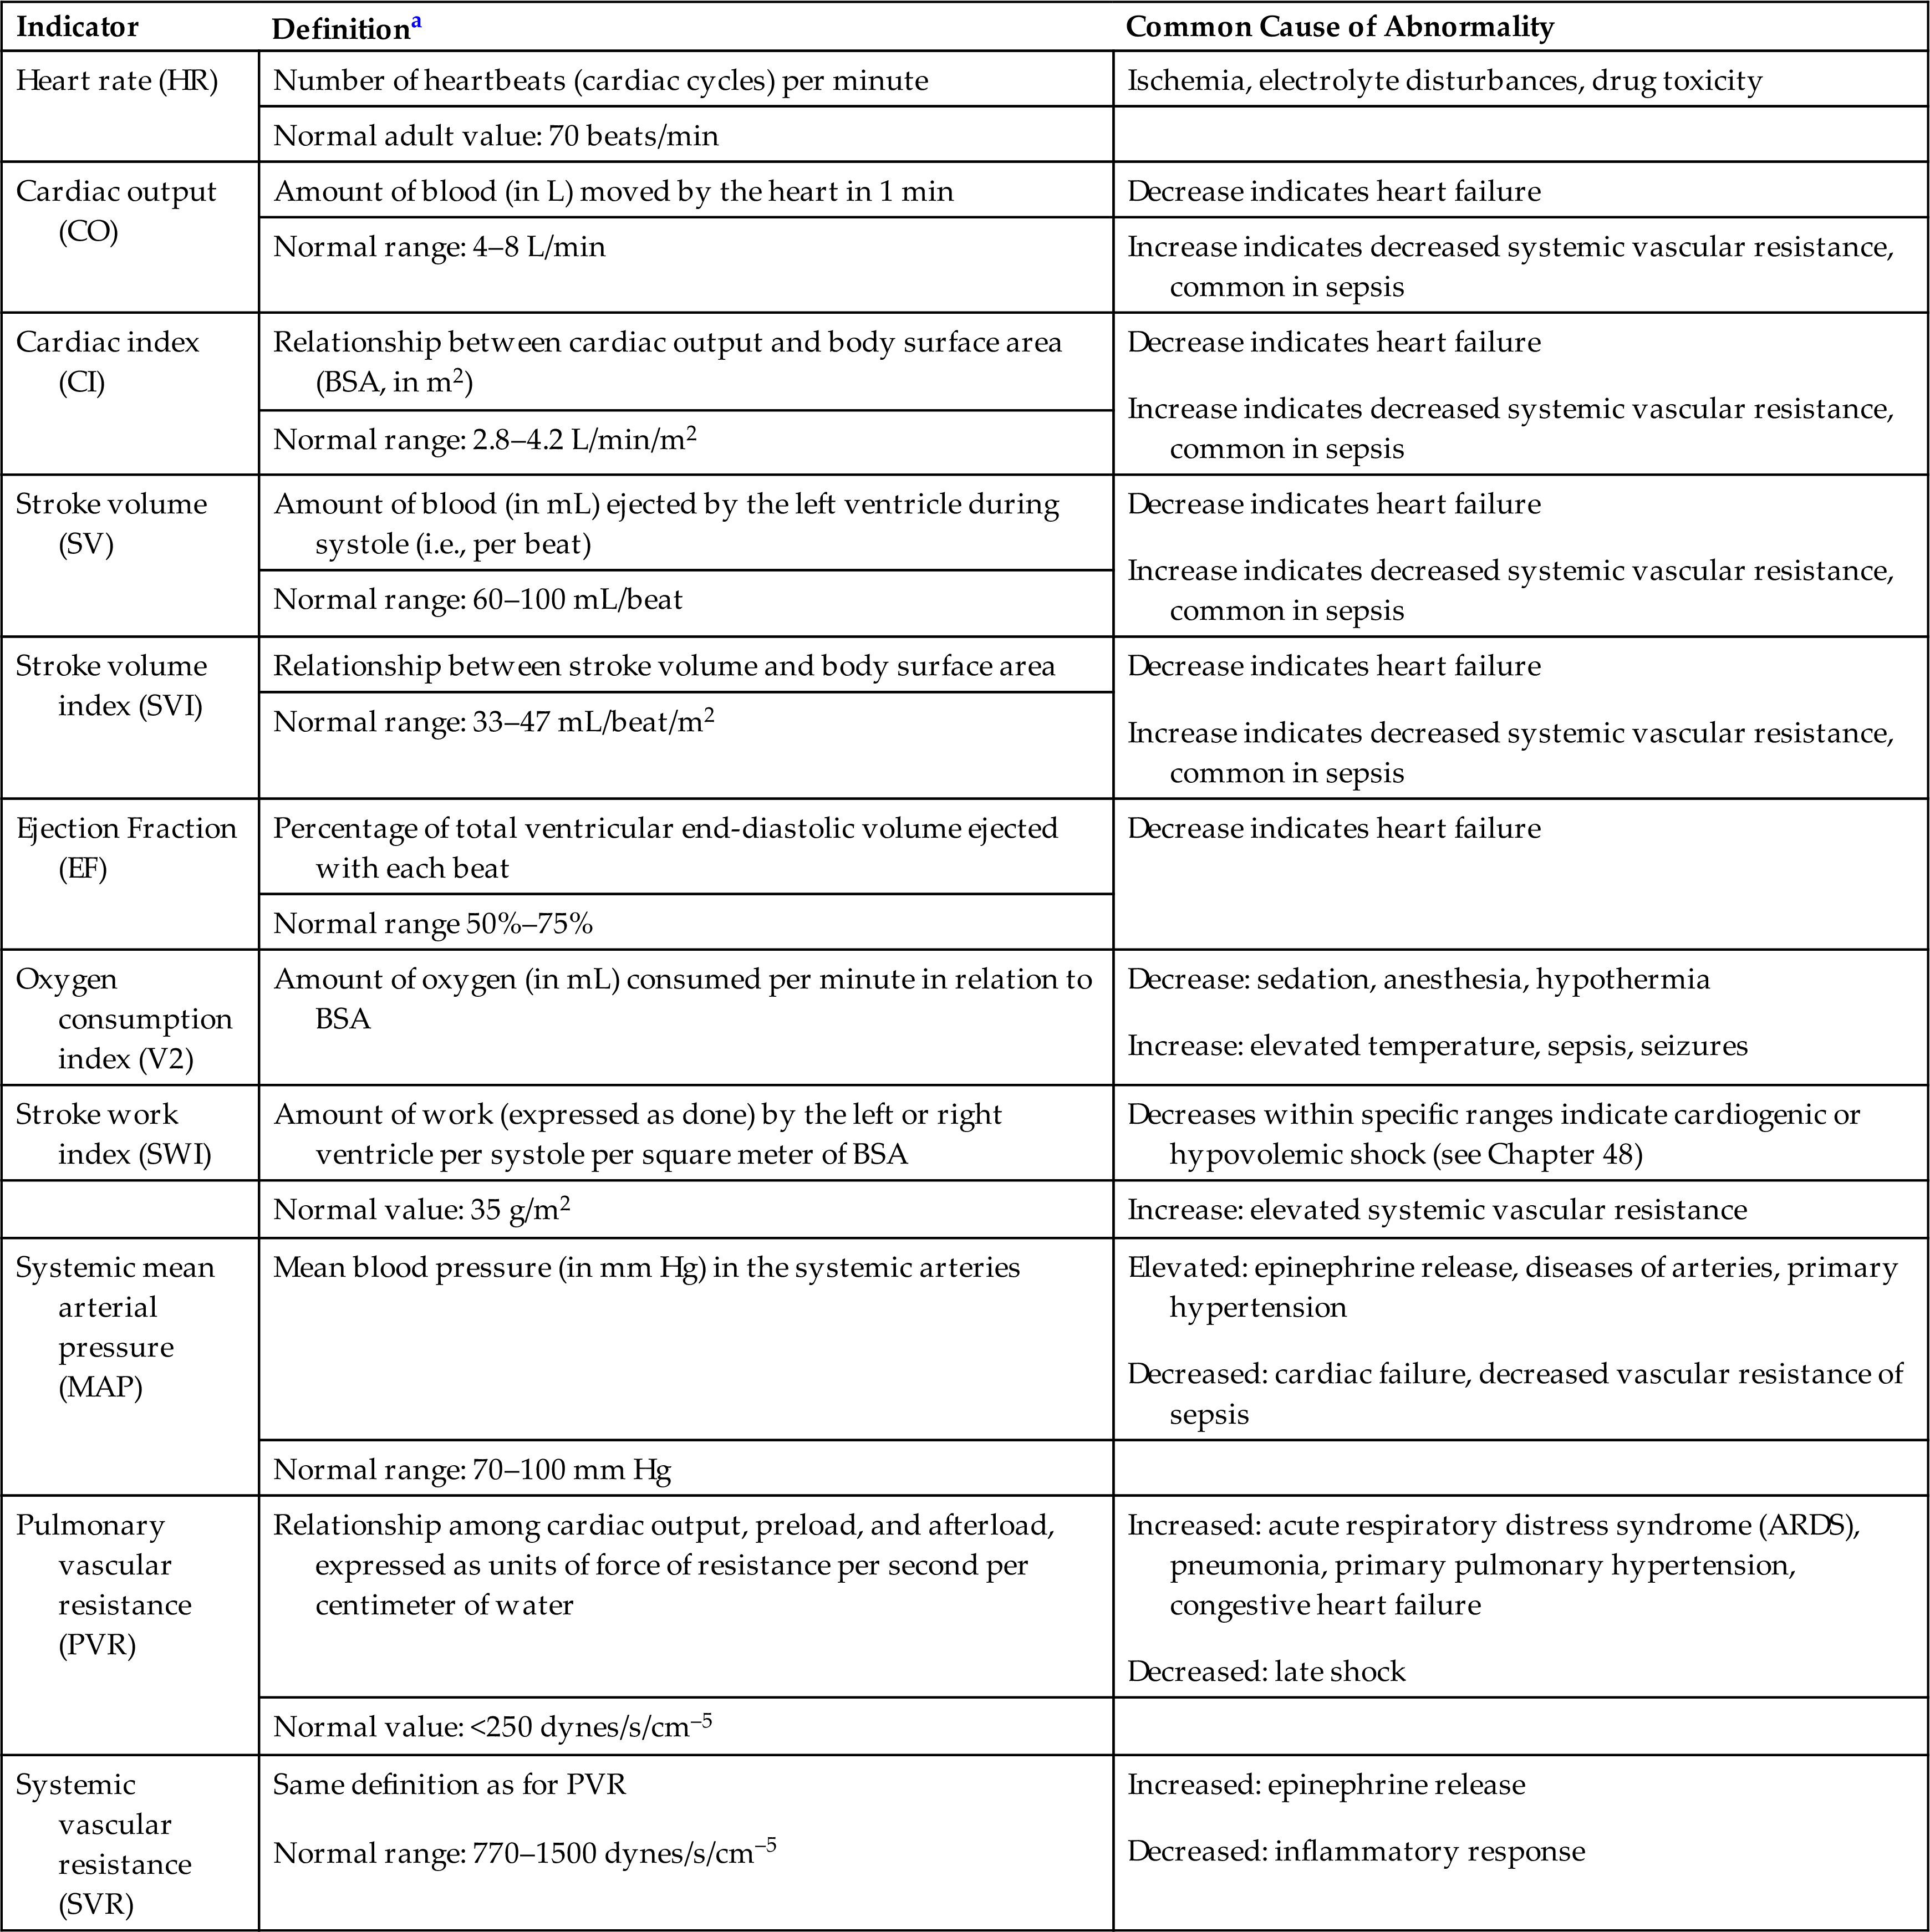
aValues given are for adults at rest.
Cardiac and Coronary Artery Evaluation
Many sophisticated tests are used to evaluate and diagnose cardiac or coronary artery diseases, and new ones are being developed each year. Some of the more commonly used modalities include chest x-ray, electrocardiography, echocardiography, stress testing, single-photon emission computed tomography (SPECT), computed tomography (CT), magnetic resonance imaging (MRI), electrophysiology studies, and catheterization with angiography.
Chest Radiograph Examination
Chest x-rays allow for the examination of the size and contour of the heart and related structures. Evidence of chamber enlargement, pericardial disease, pulmonary edema, valvular calcification, ventricular hypertrophy, and pathology of the great vessels may be visualized. Chest x-ray also is useful to assess for appropriate placement of invasive cardiac conduction devices and for any complications caused by these devices (e.g., pneumothorax or hemothorax; see Chapter 35). A chest x-ray examination is a routine part of a cardiac examination.
Electrocardiography
Electrocardiography, typically a 12-lead electrocardiogram (ECG), gives information about heart rate and rhythm; the effects of activities of daily life, exercise, electrolytes, drugs, and disease on electrical activity in the heart; and the electrical orientation of the cardiac muscle (see Fig. 31.9). An ECG provides no direct information about the contractile state or mechanical performance of the heart.
Serial 12-lead ECGs are of primary importance in establishing the presence of myocardial ischemia and infarction or conduction defects and dysrhythmias. This examination has become part of the routine hospital preadmission/admission assessment, even when the admitting diagnosis is not cardiac in nature, because it establishes baseline information about the electrical function of the heart. Also, recent ECGs can be compared with ECGs obtained from the same individual in the past. Changes in the ECG over time assist in determining the cause, amount, or nature of changes in cardiac anatomy and physiology. Ambulatory electrocardiographic or Holter monitoring is used to evaluate rhythm changes that may occur in persons during activities of daily living. Cell phone technology also is rapidly advancing to enable ECG recording and relaying to healthcare providers.
Echocardiography
Echocardiography is the most widely used noninvasive modality for evaluating the structures of the heart. Ultrasound beams reflected by cardiovascular structures produce shapes that can be visualized and can allow for recognition of altered cardiac anatomy. It is used to evaluate for suspected coronary artery disease, heart failure, valvular disease, infective endocarditis, cardiomyopathies, pericardial disease, prosthetic valve function, congenital heart disease, and aortic diseases. Through the use of one-dimensional (M-mode), two-dimensional, and three-dimensional echocardiographic techniques and combining them with Doppler and color flow imaging, accurate assessments of cardiac output, ejection fraction, and valvular function can be obtained.28 Advances in technology now allow both intracardiac and transesophageal echocardiography for evaluation of the heart anatomy and physiology.
Exercise or Stress Testing
Cardiac activity during exercise is examined during a stress test when an intervention is used to increase myocardial work. Stress testing elicits signs and symptoms of heart disease and coronary artery disease that may not appear at rest. Echocardiography or continuous 12-lead ECG and blood pressure measurements are obtained before, during, and after the study. Cardiac stress from exercise is usually induced by having the individual walk on a treadmill. Other, less frequently used forms of exercise include static exercise (hand ergometry or chemical stress), stair climbing (the Stairmaster's double two-step), arm ergometry, and bicycle ergometry. The individual exercises until the maximal heart rate for gender and age is reached or until other subjective or objective indicators of cardiac dysfunction or distress appear. Subjective indicators include chest pain, extreme fatigue, extreme dyspnea, leg pain, or the individual's request to stop the test. Objective criteria include ST-segment elevation or depression, SA node or atrial dysrhythmias, AV node dysrhythmias, ventricular dysrhythmias, elevated or decreased blood pressure, signs of cerebral hypoxia, and signs of circulatory insufficiency.29 One limitation of this test is that it cannot be used in persons whose capacity for exercise is limited.
Stress testing also may be used to evaluate either fitness for noncardiac surgery or progress in recovery after myocardial infarction or cardiac surgery. Graded exercise in individuals with low- to moderate-risk chest pain evaluated in an emergency department can be used as a prognostic indicator of adverse cardiac events. When a differential diagnosis for chest pain has been difficult to determine, stress testing may help distinguish coronary artery insufficiency from other causes of pain. The risks associated with stress testing include dysrhythmias, myocardial infarction, and death. The risk is greater when the test is performed soon after an acute ischemic event.
Stress testing with ECG monitoring may not be sensitive enough to detect and localize areas of the myocardium at risk for ischemia and infarction. Currently, most stress testing includes the injection of a radiotracer that is absorbed by active heart cells. When the heart is scanned, during and after stress testing, areas where the radiotracer is not taken up by ischemic cells can be seen and those locations indicate areas of myocardial damage.
Single-Photon Emission Computed Tomography
Single-photon emission computed tomography (SPECT) is typically used to evaluate individuals for coronary artery disease and myocardial ischemia during stress testing. A radiotracer (usually thalium-201 or technetium) is injected intravenously and is absorbed and retained for a while by healthy myocytes.30 Photons are emitted from the radiotracer in the myocardium in proportion to perfusion of the tissue. A gamma camera visualizes the photons, and views are taken from 360 degrees by CT, which digitizes the information and provides a three-dimensional view of myocardial perfusion. Data about where the myocardium absorbs the tracer normally, slowly, or not at all can be correlated with existing myocardial disease and can help quantify ischemic risk. A new development, high-speed SPECT, has the advantage of taking less time and, thereby, requiring less radiotracer, which decreases radiation exposure for the person being examined Positron emission tomography (PET) scanning also can be used to assess myocardial perfusion and metabolism.30
Computed Tomography and Magnetic Resonance Imaging
Computed tomography (CT) and magnetic resonance imaging (MRI) are used to evaluate cardiac anatomy and physiology. Techniques such as ECG gating (timing of data gathering to the cardiac cycle), electron beam CT, and spiral CT have improved the ability of tomography to visualize cardiac structures.31 The high resolution of CT can provide information about calcification of coronary vessels and cardiac valves. Information about coronary artery calcification is being used to improve risk classification for coronary artery disease. It also is a tool for evaluating large-vessel disease. Concerns and debate continue, however, about the radiation risks and use of variable protocols.
MRI is based on the principle that the frequency of energy (resonant frequency) given up by a nucleus is exactly proportional to the surrounding magnetic field. The anatomy and physiology of the great blood vessels and myocardium are depicted in three dimensions with excellent resolution. Ventricular function can be evaluated using indexes of ventricular function, such as ejection fraction. Rapidly moving sequences (MRI) can determine regional wall motion and myocardial deformation. Flow direction and velocity also can be quantitatively determined. Stress testing also can be done with MRI using the drug dobutamine to increase the cardiac workload instead of exercise.32
Electrophysiology Studies
In-depth evaluation of electrical conduction within the heart can provide important information about the nature and causes of dysrhythmias, such as atrial and ventricular tachycardias and heart block. This evaluation is often referred to as electrophysiologic mapping of the myocardium. There are many types of electrophysiology studies that are specific to certain conduction disorders but they have the common goal of documenting abnormal conduction pathways.33 Furthermore, the techniques used may also allow for ablation of unwanted pathways or the appropriate placement of pacemakers and implantable defibrillators. Mapping can include the use of echocardiography and CT scanning.
One example of an electrophysiology study is AV bundle electrocardiography. Two electrode-tipped catheters are inserted percutaneously into the femoral vein, floated up the inferior vena cava, and positioned in or near the right atrium during AV bundle (His bundle) electrocardiography. AV bundle electrocardiography can detect secondary sites of impulse generation (ectopic foci), as well as accessory pathways of conduction. Other conduction defects and the effects of drugs on conduction also can be illuminated. Risks related to this procedure can be grave and include dysrhythmias, death, vessel or heart perforation, clot or plaque embolization, and kidney failure.
Cardiac Catheterization and Angiography
One or both sides of the heart can be examined using cardiac catheterization. This invasive procedure requires the use of fluoroscopy and strict sterile techniques and takes place in a specially equipped catheterization laboratory. Local anesthetic is administered, and a catheter is introduced percutaneously into the vasculature and passed caudally into the atrium and ventricle. For a right-heart catheterization, the catheter is placed in either the jugular, subclavian, brachial, or femoral veins. The femoral artery is commonly used for a left-heart study. Once the catheter has been guided into the heart chambers, pressures are recorded, blood samples are obtained to examine oxygen content, and a contrast medium is injected to visualize chamber function and valve patency.
Cardiac catheterization provides a means to visualize the chambers of the heart continuously, although for a short time. A great deal of information can be obtained about heart structure and function.34 Pressures in each chamber and across heart valves can be precisely measured, along with timing of events in the cardiac cycle. Of particular value is the ability to compare the oxygen content of blood in each heart chamber. Risks for this procedure that have decreased over time include the development of dysrhythmias. Death can occur secondary to cardiac arrest after ventricular fibrillation.
Fluoroscopic visualization of the coronary arteries and left-heart structures using contrast dye is called coronary angiography or arteriography. Like cardiac catheterization, this study takes place in a catheterization laboratory using local anesthesia and a sterile field. A catheter is threaded into the left ventricle through the femoral artery. A ventriculogram generally is performed first. Contrast dye is injected into the apex of the ventricle, and the next few cardiac cycles are visualized and filmed. Like cardiac catheterization, coronary angiography is used to gain information about the structure and function of the ventricles and related valves. After the ventriculogram, catheters are introduced individually into the ostia of the coronary arteries. When the catheter is in position, a small volume of contrast dye is mechanically and rapidly injected into the artery and the results are visualized and filmed. Dye injection is repeated with the individual tilted at various angles to afford views of the artery other than the anteroposterior view.
The risks of coronary angiography are similar to those of cardiac catheterization, with exceptions. As the blood supply to the cardiac muscle is briefly interrupted when dye is introduced into the coronary arteries, angina (chest pain) caused by ischemia (lack of oxygen) is much more common. Coronary artery spasms also can occur. Interrupted flow also causes decreased heart rate (bradycardia), as well as some tachydysrhythmias, hypotension, and ST-segment depression.
Systemic Vascular Evaluation
The systemic vascular system can be studied by a variety of techniques in order to evaluate for adequate flow rates, vascular obstruction, and structural defects. These techniques include Doppler ultrasonography, CT and MRI, venography, and arteriography.
Arterial Pressure Pulse Waveform Analysis
Pulsation, described by the flow of blood through an artery during the cardiac cycle, can be drawn as a waveform plotting pressure against time (Fig. 31.30). The waveform can be obtained noninvasively by placing a transducer on the skin over the carotid artery while the individual's head is turned slightly away from the transducer. The amplitude and shape of arterial waveforms can provide information about the elasticity of the arterial wall, or its inverse—the stiffness of the wall.
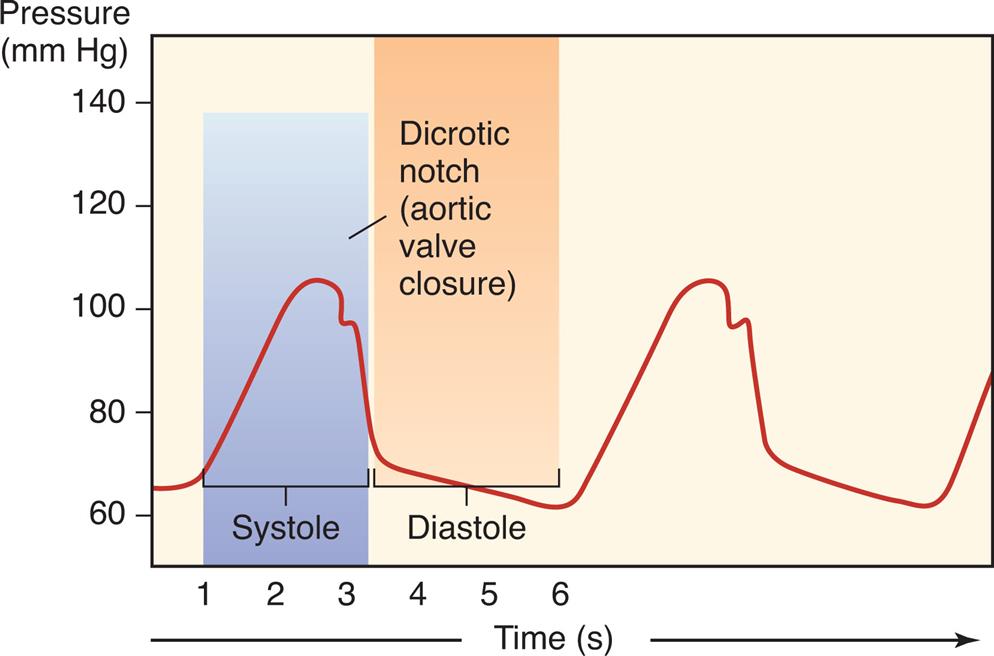
A graph shows the arterial pressure pulse waveform plotting pressure against time, indicating the dicrotic notch within the systole. The horizontal axis represents time in seconds. The vertical axis represents the pressure in millimeters of mercury. The waveform shows an alternating upstroke and downstroke with the dicrotic notch in a regular pattern.
Doppler Ultrasonography Studies
A Doppler study is done using a microphone that amplifies and records the sounds made by blood flowing in peripheral vessels. The Doppler microphone is placed over the vessel to be studied, and sounds related to obstructions to flow, vessel wall mobility, and heart murmurs are transmitted through a lubricating gel to the microphone. The audio findings can be digitized into visual findings that can be analyzed for flow velocity and volume. These studies are useful in the evaluation for abnormalities of venous flow (e.g., deep venous thrombosis) and arterial flow (e.g., embolism). Ultrasound also is used to calculate the thickness of arterial walls, yielding a reading called intimal-medial thickness. Carotid intimal-medial thickness is used to assess for atherosclerosis.28
Computed Tomography and Magnetic Resonance Imaging
CT and MRI are used to evaluate the systemic circulation, providing information about the structure of the great vessels. Either can be used to evaluate for aneurysms and dissections of the thoracic or abdominal aorta. CT also is used to assess for vessel calcification and provide some insights into the risk for stroke and myocardial infarction through evaluation of the carotid and coronary vessels.
Venography and Arteriography
Radiopaque dye can be injected through intravenous or intraarterial catheters to allow for visualization of the internal structure, diameter, and patency of veins and arteries. Venography is performed primarily in the lower extremity to assess for the presence of thrombi in the large veins of the leg. Arteriography (angiography) can be used in almost any vascular system, including the great vessels and the pulmonary, coronary (see previously in this chapter), cerebral, mesenteric, renal, hepatic, and peripheral arteries. Risks include rupture, dissection, thrombosis, embolization, or organ infarction involving the arterial system being studied.
Aging and the Cardiovascular System
Cardiovascular disease is the most common cause of morbidity and mortality in older adults in Western society and in much of the rest of the world (see Chapter 32). Age is a key driver of cardiovascular risk, in large measure due to the increased prevalence of risk factors such as hypertension, hyperlipidemia, and sedentary lifestyle in older individuals. For example, lipoprotein removal from tissues is decreased with aging, contributing to the risk of cardiovascular disease.35 The most relevant age-associated physiologic changes in cardiovascular performance include myocardial and blood vessel stiffening, changes in neurogenic control over vascular tone, increased occurrence of atrial fibrillation, and loss of exercise capacity plus left ventricular hypertrophy and fibrosis. These changes pose considerable consequences with increased demand for flow, with changes in posture, or with disease. Cardiovascular aging occurs at the cellular level and includes genomic instability, epigenetic changes, inflammation and mitochondrial oxidative stress, and endothelial senescence.36
Arterial stiffening occurs with aging even in the absence of clinical hypertension. It can, however, be an important contributor to systolic hypertension and its associated risks for cardiovascular events, dementia, and death. These changes result from alterations within the vascular media, including age-associated changes in cross-linking of collagen, an increase in the amount of collagen, deposition of calcium, and changes in the nature of elastin, the extracellular matrix, inflammatory molecules, endothelial cell function, and reactive oxygen species. The increased arterial stiffness may not be related strictly to an age-associated change in vascular structure but may be caused by changes in baroreceptor activity. Baroreceptor activity may decrease with age, slowing physiologic adjustment to changes in blood pressure and posture. In persons older than age 60, pulse pressure, which is directly influenced by arterial stiffness, is a better predictor of cardiovascular disease than either diastolic or systolic blood pressure (see Chapter 32).
Left ventricular hypertrophy and fibrosis also are more common in the aging population, even in the absence of high blood pressure. As the arterial system becomes stiffer the ventricles must work harder to pump blood throughout the body, thus contributing to hypertrophy. Fibrosis, calcification, and increase in stiffness also impact valvular function, particularly the function of the atrioventricular valves. These changes make valvular disease a greater risk for the elderly, along with an increased risk of heart failure related to the left ventricular hypertrophy and stiffness.
Stress testing is used to uncover functional capacity losses that are not apparent at rest. In contrast to the subtle age effects on resting cardiac tests, more dramatic changes occur during exercise. Table 31.2 summarizes age-associated changes at rest and during exercise. Overall, long-term exercise conditioning in older individuals increases aerobic capacity, improves left ventricular function, and decreases arterial stiffness so that cardiovascular diseases may be prevented or delayed in older adults. Although the risks and benefits of pharmacologic and invasive strategies must always be assessed carefully, lack of cardiovascular health is a strong predictor of disability in the elderly,37 and many older adults can live longer and healthier lives if appropriate preventive and treatment regimens are offered, even quite late in life.
The advent of genomic medicine and a deeper exploration of molecular changes with aging continue to enhance understanding of the myriad changes in people's bodies as they age.36 The ongoing hope is that as understanding of the causative factors related to cardiovascular decline with aging improves, therapeutics that arrest or slow these changes may be developed.
Summary Review
Circulatory System
- 1. The circulatory system is part of the body's transport and communication systems. It delivers O2, nutrients, metabolites, hormones, neurochemicals, proteins, and blood cells, including lymphocytes and leukocytes, throughout the body and carries metabolic wastes to the kidneys, lungs, and liver for excretion.
- 2. The circulatory system consists of the heart and the blood and lymphatic vessels and is made up of two separate but conjoined, serially connected pump systems: the pulmonary circulation and the systemic circulation. The lymphatic system is a one-way network consisting of lymphatic vessels and lymph nodes.
- 3. The low-pressure pulmonary circulation is driven by the right side of the heart; its function is to deliver blood to the lungs for oxygenation.
- 4. The higher-pressure systemic circulation is driven by the left side of the heart and functions to provide oxygenated blood, nutrients, and other key substances to body tissues and transport waste products to the lungs, kidneys, and liver for excretion.
- 5. The lymphatic vessels collect fluids from the interstitium and return the fluids to the circulatory system; lymphatic vessels also deliver antigens, microorganisms, and cells to the lymph nodes.
Heart
- 1. The heart consists of four chambers (two atria and two ventricles), four valves (two atrioventricular valves and two semilunar valves), a muscular wall, a fibrous skeleton, a conduction system, nerve fibers, systemic vessels (the coronary circulation), and openings where the great vessels enter the atria and ventricles.
- 2. The heart wall, which encloses the heart and divides it into chambers, is made up of three layers: the epicardium (outer layer), the myocardium (muscular layer), and the endocardium (inner lining). The heart lies within the pericardium, a double-walled sac.
- 3. The myocardial layer of the two atria, which receive blood entering the heart, is thinner than the myocardial layer of the ventricles, which have to be stronger to squeeze blood out of the heart.
- 4. The right and left sides of the heart are separated by portions of the heart wall called the interatrial septum and the interventricular septum.
- 5. Deoxygenated (venous) blood from the systemic circulation enters the right atrium through the superior and inferior venae cavae. From the right atrium, the blood passes through the right atrioventricular (tricuspid) valve into the right ventricle. In the ventricle, the blood flows from the inflow tract to the outflow tract and then through the pulmonary semilunar valve (pulmonary valve) into the pulmonary artery, which delivers it to the lungs for oxygenation.
- 6. Oxygenated blood from the lungs enters the left atrium through the four pulmonary veins (two from the left lung and two from the right lung). From the left atrium, the blood passes through the left atrioventricular valve (mitral valve) into the left ventricle. In the ventricle, the blood flows from the inflow tract to the outflow tract and then through the aortic semilunar valve (aortic valve) into the aorta, which delivers it to systemic arteries of the entire body.
- 7. There are four heart valves. The atrioventricular valves ensure one-way flow of blood from the atria to the ventricles. The semilunar valves ensure one-way blood flow from the right ventricle to the pulmonary artery and from the left ventricle to the aorta. The valves are supported by a fibrous skeleton.
- 8. The pumping action of the heart consists of two phases: diastole, during which the myocardium relaxes and the ventricles fill with blood; and systole, during which the myocardium contracts, forcing blood out of the ventricles. A cardiac cycle consists of one systolic contraction and the diastolic relaxation that follows it. Each cardiac cycle represents one heartbeat.
- 9. Coronary circulation provides O2 and nutrients to the myocardium and other heart structures. Oxygenated blood enters the coronary arteries through openings from the aorta, and deoxygenated blood from the coronary veins enters the right atrium through the coronary sinus.
- 10. The conduction system of the heart generates and transmits electrical impulses (cardiac action potentials) that stimulate systolic contractions. The autonomic nerves (sympathetic and parasympathetic fibers) can adjust heart rate and force of contraction, but they do not originate the heartbeat.
- 11. The normal electrocardiogram is the sum of all cardiac action potentials. The P wave represents atrial depolarization; the QRS complex is the sum of all ventricular cell depolarizations. The ST interval occurs when the entire ventricular myocardium is depolarized.
- 12. Cardiac action potentials are generated by the sinoatrial node at a rate of 60 to 100 impulses per minute. The impulses can travel through the conduction system of the heart, stimulating myocardial contraction as they go.
- 13. Each cardiac action potential travels from the SA node to the AV node to the bundle of His (atrioventricular bundle), through the bundle branches, and finally to the Purkinje fibers and ventricular myocardium, where the impulse stops. It is prevented from reversing its path by the refractory period of cells that have just been polarized. The refractory period ensures that diastole (relaxation) will occur, thereby completing the cardiac cycle.
- 14. Cells of the cardiac conduction system have the properties of automaticity and rhythmicity. Automatic cells return to threshold and depolarize rhythmically without an outside stimulus. The cells of the sinoatrial node depolarize faster than other automatic cells, making it the natural pacemaker of the heart. If the SA node is disabled, the next fastest pacemaker, the AV node, takes over.
- 15. Adrenergic receptor number, type, and function govern autonomic (sympathetic) regulation of heart rate, contractile force, and the dilation or constriction of coronary arteries. The presence of specific receptors on the myocardium and coronary vessels determines the effects of the neurotransmitters norepinephrine and epinephrine.
- 16. Unique features that distinguish myocardial cells from skeletal cells enable myocardial cells to transmit action potentials faster (through intercalated discs), synthesize more ATP (because of a large number of mitochondria), and have readier access to ions in the interstitium (because of an abundance of transverse tubules). These combined differences enable the myocardium to work constantly, which is not required by skeletal muscle.
- 17. Cross-bridges between actin and myosin enable contraction. Calcium ions interacting with the troponin complex help initiate the contraction process. Subsequently, myocardial relaxation begins as troponin releases calcium ions.
- 18. Cardiac performance is affected by preload, afterload, myocardial contractility, and heart rate.
- 19. Preload, or pressure generated in the ventricles at the end of diastole, depends on the amount of blood in the ventricle. Afterload is the resistance to ejection of the blood from the ventricle. Afterload depends on pressure in the aorta.
- 20. Myocardial stretch determines the force of myocardial contraction; thus the greater the stretch, the stronger the contraction up to a certain point. This relationship is known as the Frank-Starling law of the heart.
- 21. Contractility is the potential for myocardial fiber shortening during systole. It is determined by the amount of stretch during diastole (i.e., preload) and by sympathetic stimulation of the ventricles.
- 22. The heart rate is determined by the sinoatrial node and by components of the autonomic nervous system, including cardiovascular control centers in the brain, receptors in the aorta and carotid arteries, and hormones, including catecholamines (epinephrine, norepinephrine).
Systemic Circulation
- 1. Blood flows from the left ventricle into the aorta and from the aorta into arteries that eventually branch into arterioles and capillaries, the smallest of the arterial vessels. O2, nutrients, and other substances needed for cellular metabolism pass from the capillaries into the tissues, where they are taken up by the cells. Capillaries also absorb metabolic waste products from the tissues.
- 2. Venules, the smallest veins, receive capillary blood. From the venules, the venous blood flows into larger and larger veins until it reaches the venae cavae, through which it enters the right atrium.
- 3. Vessel walls have three layers: the tunica intima (inner layer), the tunica media (middle layer), and the tunica externa (the outer layer).
- 4. Layers of the vessel wall differ in thickness and composition from vessel to vessel, depending on the vessel's size and location within the circulatory system. In general, the tunica media of arteries close to the heart has more elastic fibers (elastic arteries) because these arteries must be able to distend during systole and recoil during diastole. Arteries farther from the heart contain more smooth muscle fibers (muscular arteries) because they constrict and dilate to control blood pressure and volume within specific capillary beds.
- 5. Blood flow into the capillary beds is controlled by the contraction and relaxation of smooth muscle bands (precapillary sphincters) at junctions between metarterioles and capillaries.
- 6. Endothelial cells line the blood vessels. The endothelium is a life-support tissue; it functions as a filter (altering permeability), changes in vasomotion (constriction and dilation), and is involved in clotting and inflammation.
- 7. Blood flow through the veins is assisted by the contraction of skeletal muscles (the muscle pump), and backward flow is prevented by one-way valves, which are particularly important in the deep veins of the legs.
- 8. Blood flow is affected by blood pressure, resistance to flow within the vessels, velocity of the blood, anatomic features that may cause turbulent or laminar flow, and compliance (distensibility) of the vessels.
- 9. The Poiseuille law states that resistance is directly related to tube length and blood viscosity, and inversely related to the radius of the tube.
- 10. Total resistance, or the resistance to flow within the entire systemic circulatory system, depends on the combined lengths and radii of all the vessels within the system and on whether the vessels are arranged in series (greater resistance) or in parallel (lesser resistance).
- 11. Blood flow is also influenced by neural stimulation (vasoconstriction or vasodilation) and by autonomic features that cause turbulence within the vascular lumen (e.g., protrusions from the vessel wall, twists and turns, vessel branching).
- 12. Arterial blood pressure is influenced and regulated by factors that affect cardiac output (heart rate, stroke volume), total resistance within the system, and blood volume.
- 13. ADH, the RAAS system, and NPs can all alter blood volume and thus blood pressure.
- 14. Venous blood pressure is influenced by blood volume within the venous system and compliance of the venous walls.
- 15. Blood flow through the coronary circulation is governed by the same principles as flow through other vascular beds plus two adaptations dictated by cardiac dynamics. First, blood flows into the coronary arteries during diastole rather than systole, because during systole the cusps of the aortic semilunar valve block the openings of the coronary arteries. Second, systolic contraction inhibits coronary artery flow by compressing the coronary arteries.
- 16. Autoregulation enables the coronary vessels to maintain optimal perfusion pressure despite systolic compression.
- 17. Myoglobin in heart muscle stores O2 for use during the systolic phase of the cardiac cycle.
The Lymphatic System
- 1. The vessels of the lymphatic system run in the same sheaths as the arteries and veins.
- 2. Lymph (interstitial fluid) is absorbed by lymphatic venules in the capillary beds and travels through ever larger lymphatic veins until it empties through the right lymphatic duct or thoracic duct into the right or left subclavian veins, respectively.
- 3. As lymph travels toward the thoracic ducts, it passes through thousands of lymph nodes clustered around the lymphatic veins. The lymph nodes are sites of immune function and are ideally placed to sample antigens and cells carried by the lymph from the periphery of the body into the central circulation.
Tests of Cardiovascular Function
- 1. The evaluation of an individual with known or suspected cardiovascular disease must include a careful history and physical examination including assessment of risk factors, symptoms, vital signs, level of consciousness, mucous membrane color, and cardiopulmonary functioning.
- 2. Important tests for cardiac disorders are ECG and Holter monitoring, which detect disturbances of impulse generation or conduction.
- 3. Stress tests elicit clinical manifestations of cardiovascular disease that might not be present at rest.
- 4. The sensitivity of stress testing is improved by the use of radiotracer imaging techniques such as SPECT.
- 5. Echocardiography detects structural and functional cardiac abnormalities over time.
- 6. Cardiac catheterization is used to measure the oxygen content and pressure of blood in the heart's chambers and to inject contrast media for x-ray examination of the size and shape of the chambers and valves. Injection of contrast medium into the coronary arteries (coronary angiography), on the other hand, permits visualization of the coronary circulation and every tissue perfused by the coronary arteries.
- 7. Evaluation of the systemic vascular system can include arterial pressure pulse waveform analysis, Doppler ultrasonography, venography, and arteriography.
Aging and the Cardiovascular System
- 1. Cardiovascular disease is the most common cause of morbidity and mortality in older adults in Western society and in much of the rest of the world. In addition, age is a key driver of cardiovascular risk, which explains why it is the primary cause of death in persons older than age 65.
- 2. The most common cardiovascular disease condition is hypertension followed by coronary atherosclerosis, for which hypertension is a risk factor.
- 3. It is challenging to determine the normal physiologic changes in cardiac function with aging because many pathologic changes are usually present and physical fitness is variable in older people as well.
- 4. The most relevant age-associated physiologic changes in cardiovascular performance include myocardial and blood vessel stiffening, changes in neurogenic control over vascular tone, increased occurrence of atrial fibrillation, and loss of exercise capacity plus left ventricular hypertrophy and fibrosis.
- 5. With active risk reduction, physical activity, and disease management, older adults can have markedly improved cardiovascular health.