Structure and Function of the Pulmonary System
Karen C. Turner and Valentina L. Brashers
 http://evolve.elsevier.com/Rogers/pathophysiology/
The primary function of the pulmonary system is the exchange of gases between the environmental air and the blood. The three steps in this process are (1) ventilation, the movement of air into and out of the lungs; (2) diffusion, the movement of gases between air spaces in the lungs and the bloodstream; and (3) perfusion, the movement of blood into the capillary beds of the lungs and out to body organs and tissues. The first two functions are carried out by the pulmonary system, and the third by the cardiovascular system (see Chapter 31). Normally the pulmonary system functions efficiently under a variety of conditions and with little energy expenditure.
Structures of the Pulmonary System
The pulmonary system includes two lungs, the upper and lower airways, the blood vessels that serve these structures (Fig. 34.1), the diaphragm, and the chest wall (thoracic cage). The lungs are divided into lobes: three in the right lung (upper, middle, lower) and two in the left lung (upper, lower). Each lobe is further divided into segments and lobules. The mediastinum is the space between the lungs and contains the heart, great vessels, and esophagus. A set of conducting airways, or bronchi, delivers air to each section of the lung. The lung tissue that surrounds the airways supports them, preventing distortion or collapse of the airways as gas moves in and out during ventilation. The diaphragm is a dome-shaped muscle that separates the thoracic and abdominal cavities and is involved in ventilation.
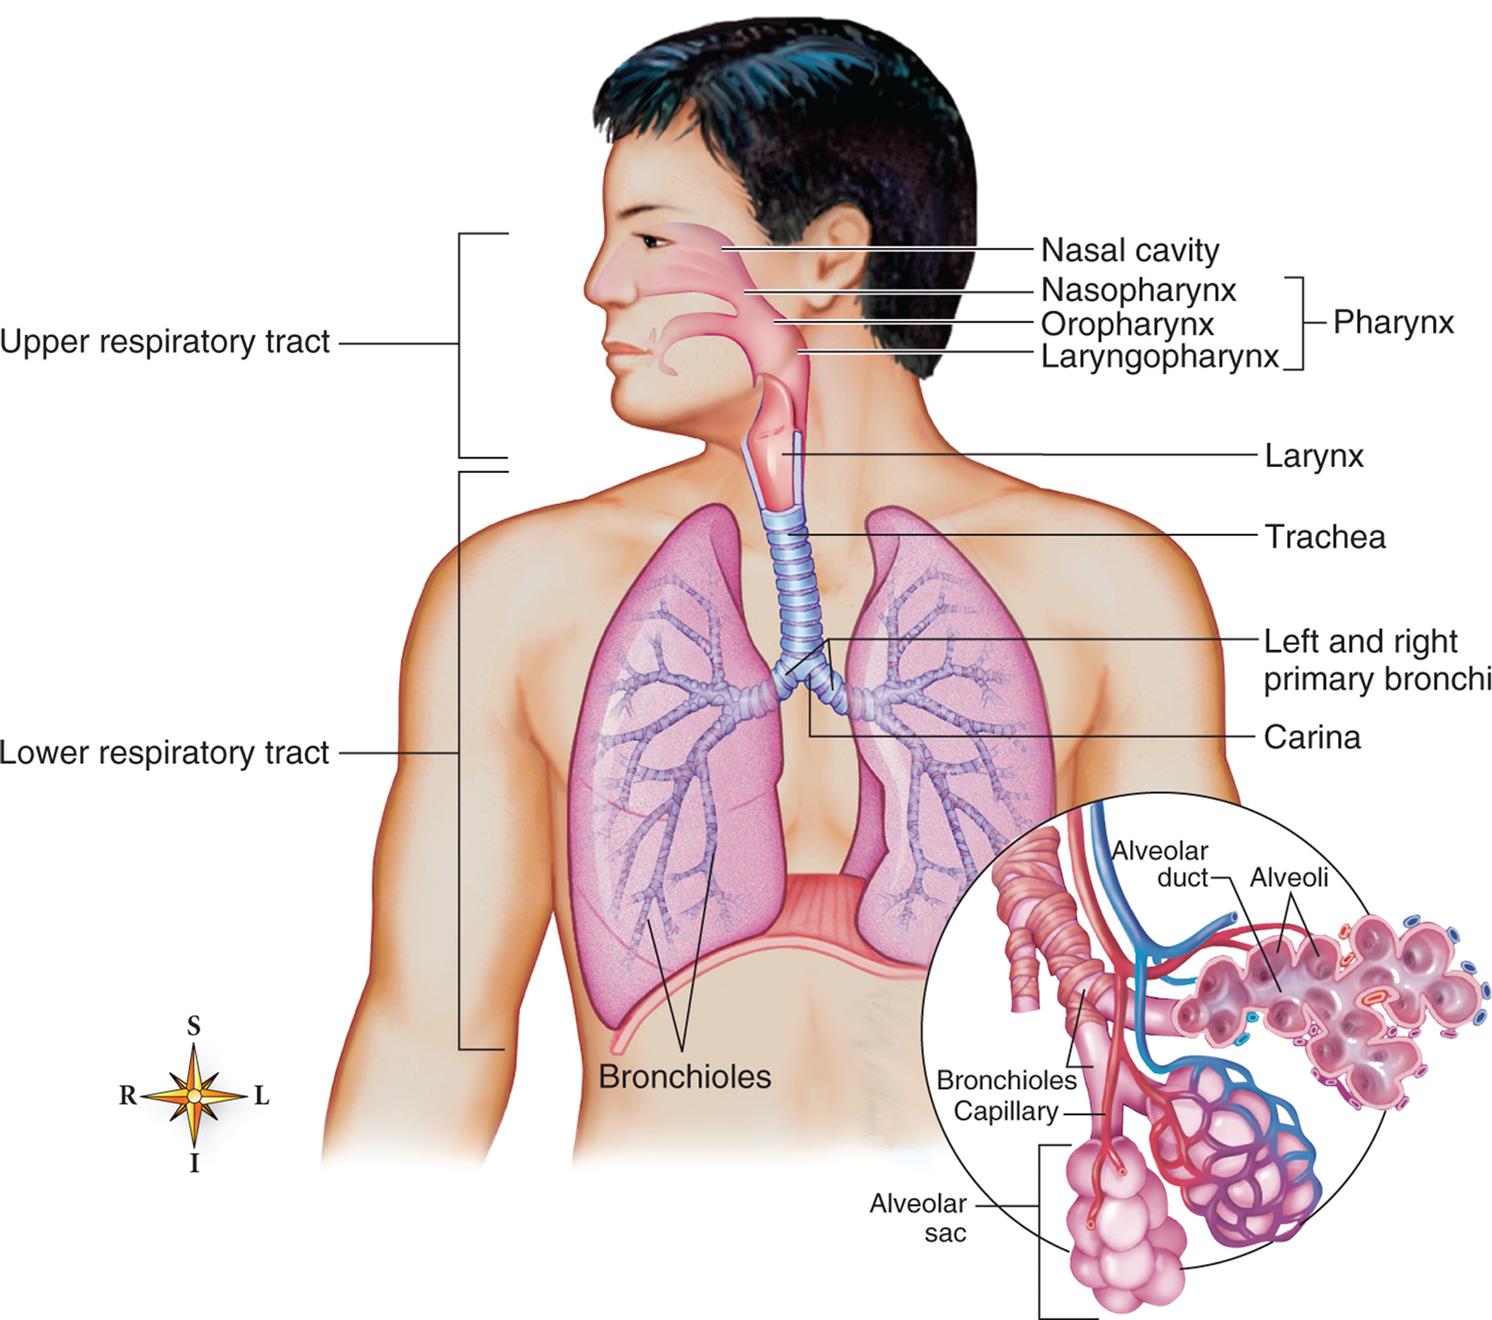
The upper and lower respiratory tracts (airways) are illustrated. The enlargement in the circle depicts the acinus, where oxygen and carbon dioxide are exchanged. (From Patton KT, Thibodeau GA. Structure & function of the body, 15th edition. St. Louis: Mosby; 2016.)
An illustration of a person’s torso shows and labels the different parts of the upper and lower respiratory tracts. The upper respiratory tract comprises the pharynx and includes the following structures from the top to the bottom: nasal cavity, nasopharynx, oropharynx, and laryngopharynx. The lower respiratory system comprises the larynx, trachea, left and right primary bronchi, carina, and bronchioles. An accompanying illustration shows a magnified view of the bronchioles and identifies the following parts: alveolar duct, alveoli, bronchioles capillary, and alveolar sac.
The lungs are protected from a variety of exogenous contaminants in inspired air by a series of mechanical and cellular defenses (Table 34.1). These defense mechanisms are so effective that, in the healthy individual, contamination of the lung tissue itself, particularly by infectious agents, is relatively uncommon.
Table 34.1
Conducting Airways
The conducting airways allow air into and out of the gas-exchange structures of the lung. The nasopharynx, oropharynx, and related structures are often called the upper airway (Fig. 34.2). These structures are lined with a ciliated mucosa with a rich vascular supply that warms and humidifies inspired air and removes foreign particles from it before it passes into the lungs. The mouth and oropharynx are used for ventilation when the nose is obstructed or when increased flow is required (e.g., during exercise). Filtering and humidifying are not as efficient with mouth breathing.
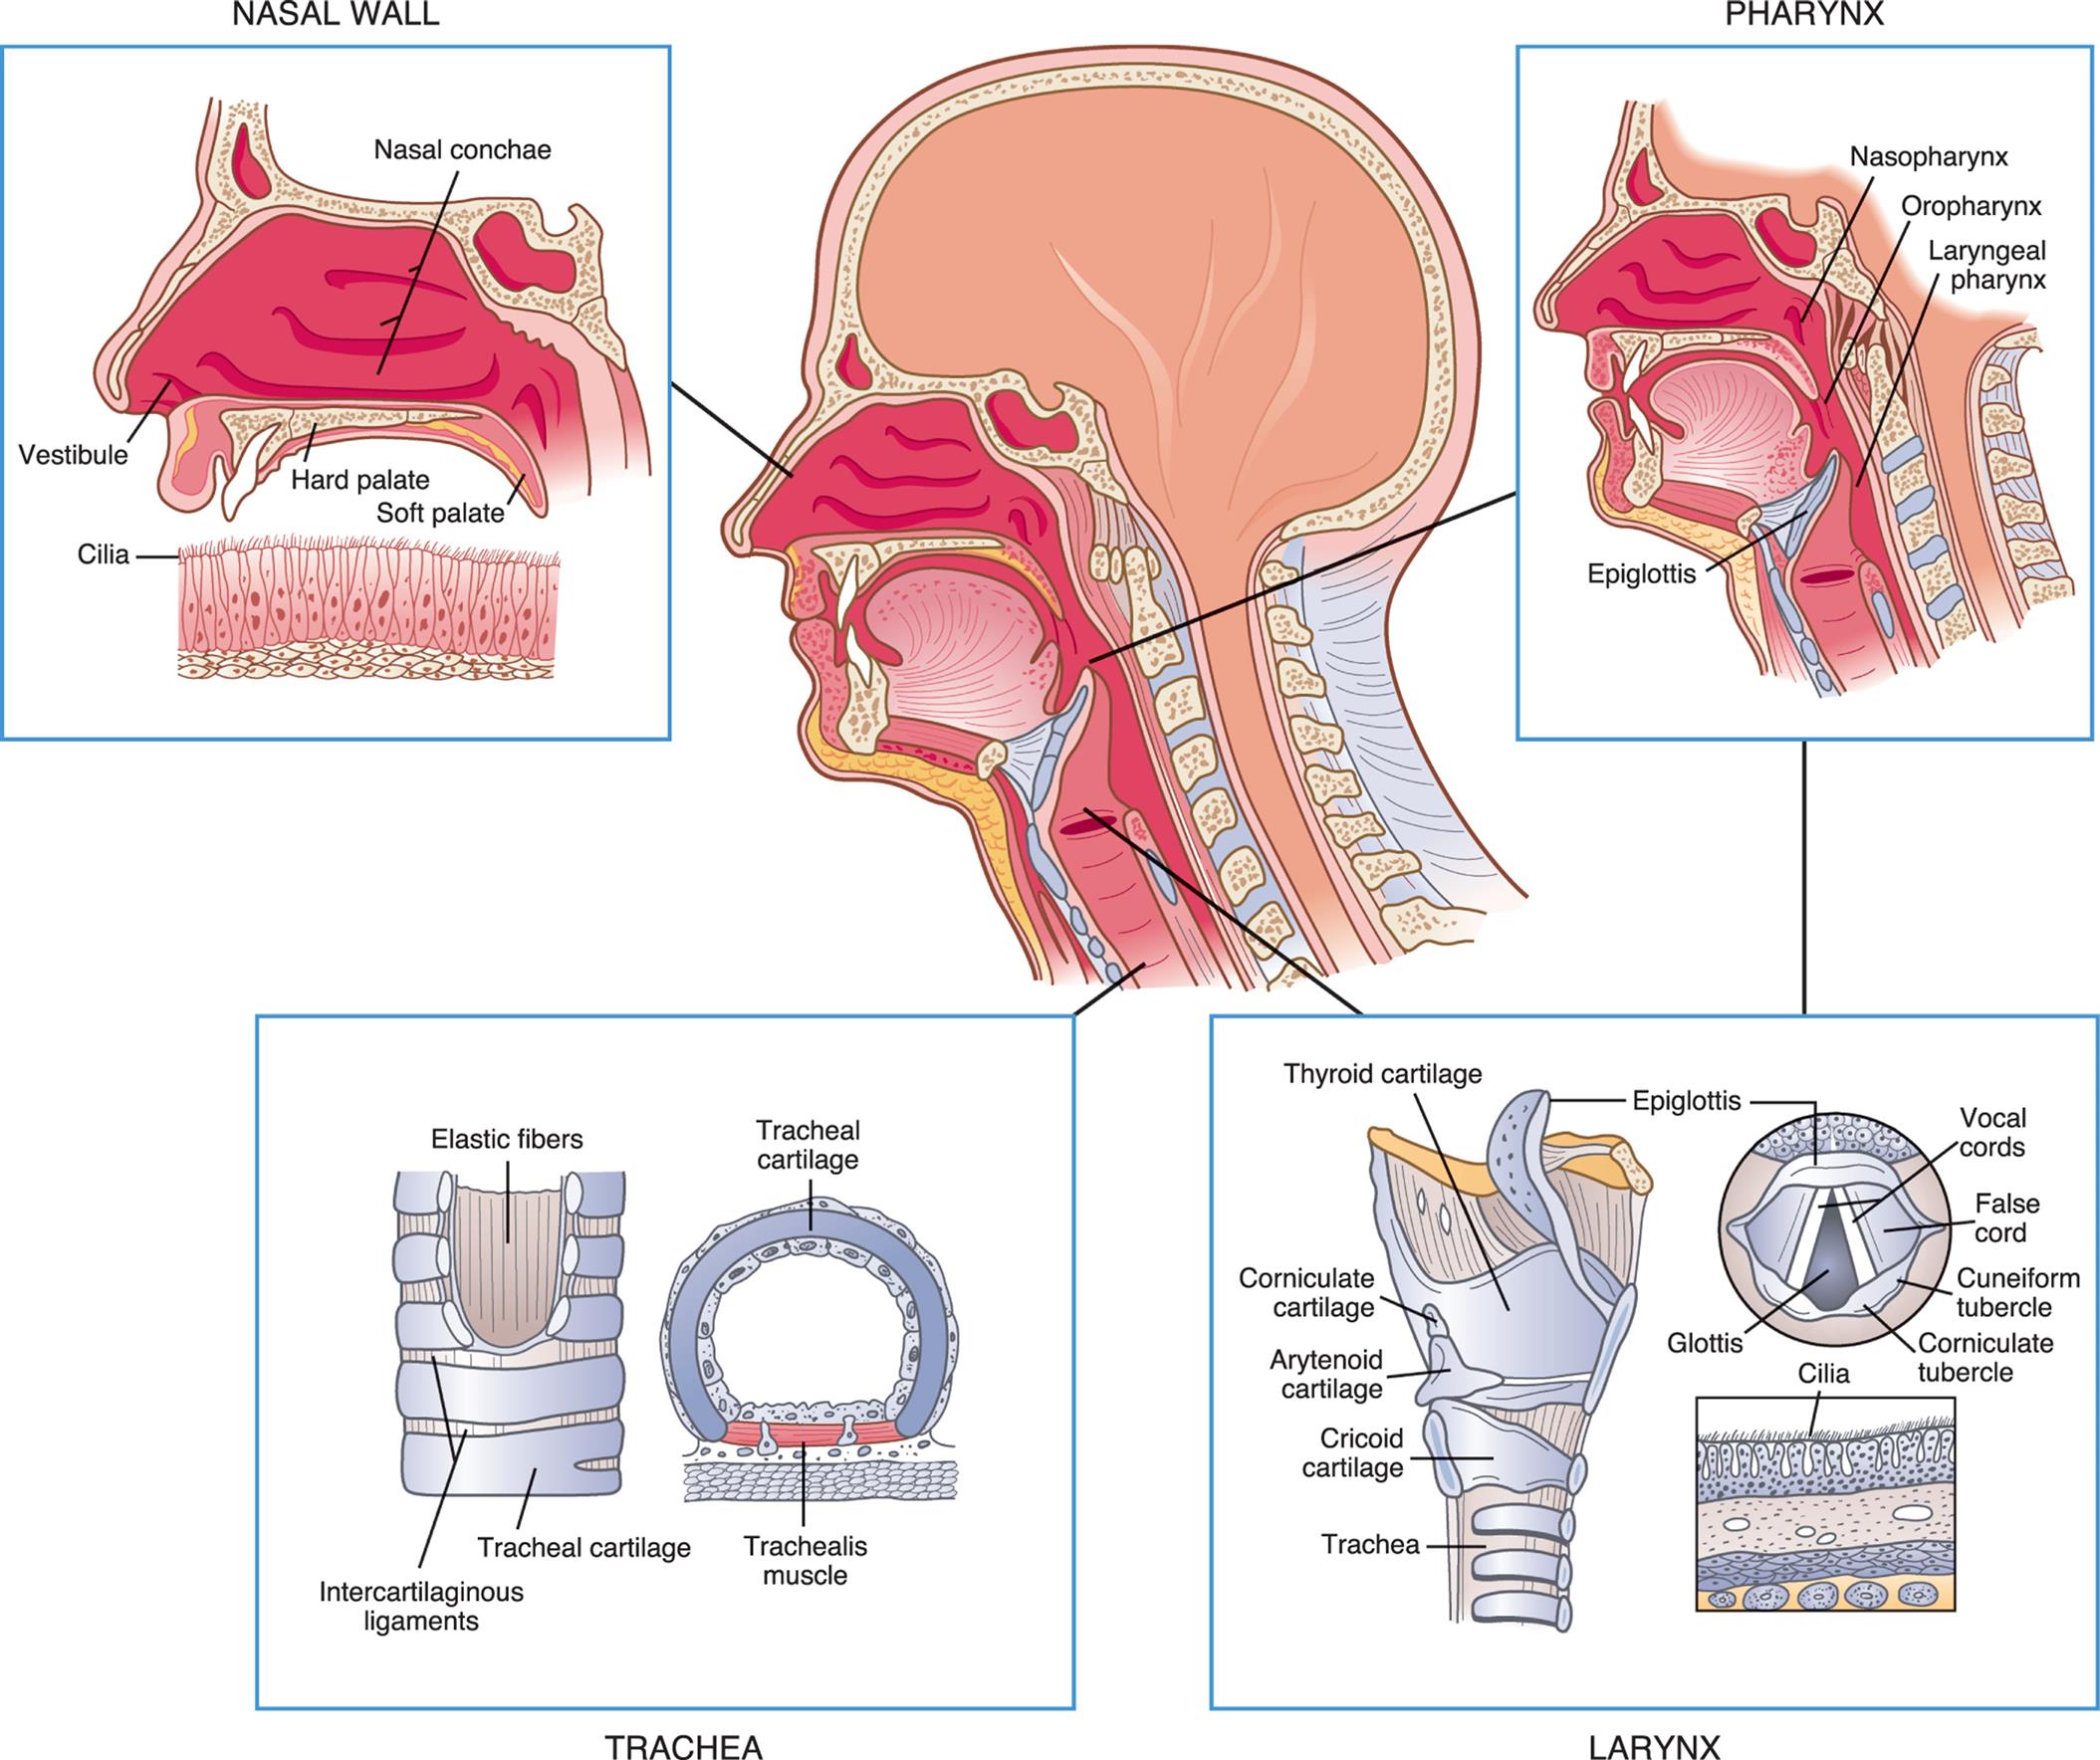
An illustration of the left lateral view of a persons head is accompanied by magnified views of the different structures of the upper airway. The illustration of a magnified view of the nasal wall identifies the following structures: vestibule, cilia, hard palate, nasal conchae, and soft palate. The illustration of a magnified view of the pharynx identifies the following structures: nasopharynx, oropharynx, laryngeal pharynx, and epiglottis. The illustration of a magnified view of the larynx shows a cutaway view and a cross-sectional view, identifying the following structures: thyroid cartilage, corniculate cartilage, arytenoid cartilage, traches, epiglottis, vocal cords, false cord, cuneiform tubercle, corniculate tubercle, glottis, and cilia. The illustration of a magnified view of the trachea shows a cutaway view and a cross-sectional view, identifying the following structures: elastic fibers, intercartilaginous ligaments, tracheal cartilage, and tracheal muscle.
The larynx connects the upper and lower airways and consists of the endolarynx and its surrounding triangular-shaped bony and cartilaginous structures. The endolarynx is formed by two pairs of folds: the false vocal cords (supraglottis) and the true vocal cords. The slit-shaped space between the true cords forms the glottis (see Fig. 34.2). The vestibule is the space above the false vocal cords. The laryngeal box is formed of three large cartilages (epiglottis, thyroid, cricoid) and three smaller cartilages (arytenoid, corniculate, cuneiform) connected by ligaments. The supporting cartilages prevent the collapse of the larynx during inspiration and swallowing. The internal laryngeal muscles control vocal cord length and tension, and the external laryngeal muscles move the larynx as a whole. Both sets of muscles are important to swallowing, ventilation, and vocalization. The internal muscles contract during swallowing to prevent aspiration into the trachea. These muscles also contribute to voice pitch.
The trachea, which is supported by U-shaped cartilage, connects the larynx to the bronchi (sing., bronchus), the conducting airways of the lungs. The trachea branches into two bronchi at the carina (see Fig. 34.1). The carina is very sensitive and, when stimulated, can cause coughing and airway narrowing.1 The left mainstem bronchus branches from the trachea at about a 45-degree angle. The right mainstem bronchus is slightly larger and more vertical than the left. Aspirated fluids or foreign particles thus tend to enter the right lung rather than the left. The right and left main bronchi enter the lungs at the hila (sing., hilum), or “roots” of the lungs, along with the pulmonary blood and lymphatic vessels. From the hila, the main bronchi branch into lobar bronchi and then to segmental and subsegmental bronchi, and finally end in the smallest of the conducting airways, the terminal bronchioles (Fig. 34.3). With these multiple divisions, the cross-sectional area of the airways increases to 20 times that of the trachea. This results in a decreased velocity of airflow into the gas-exchange portion of the lung and allows for optimal gas diffusion.
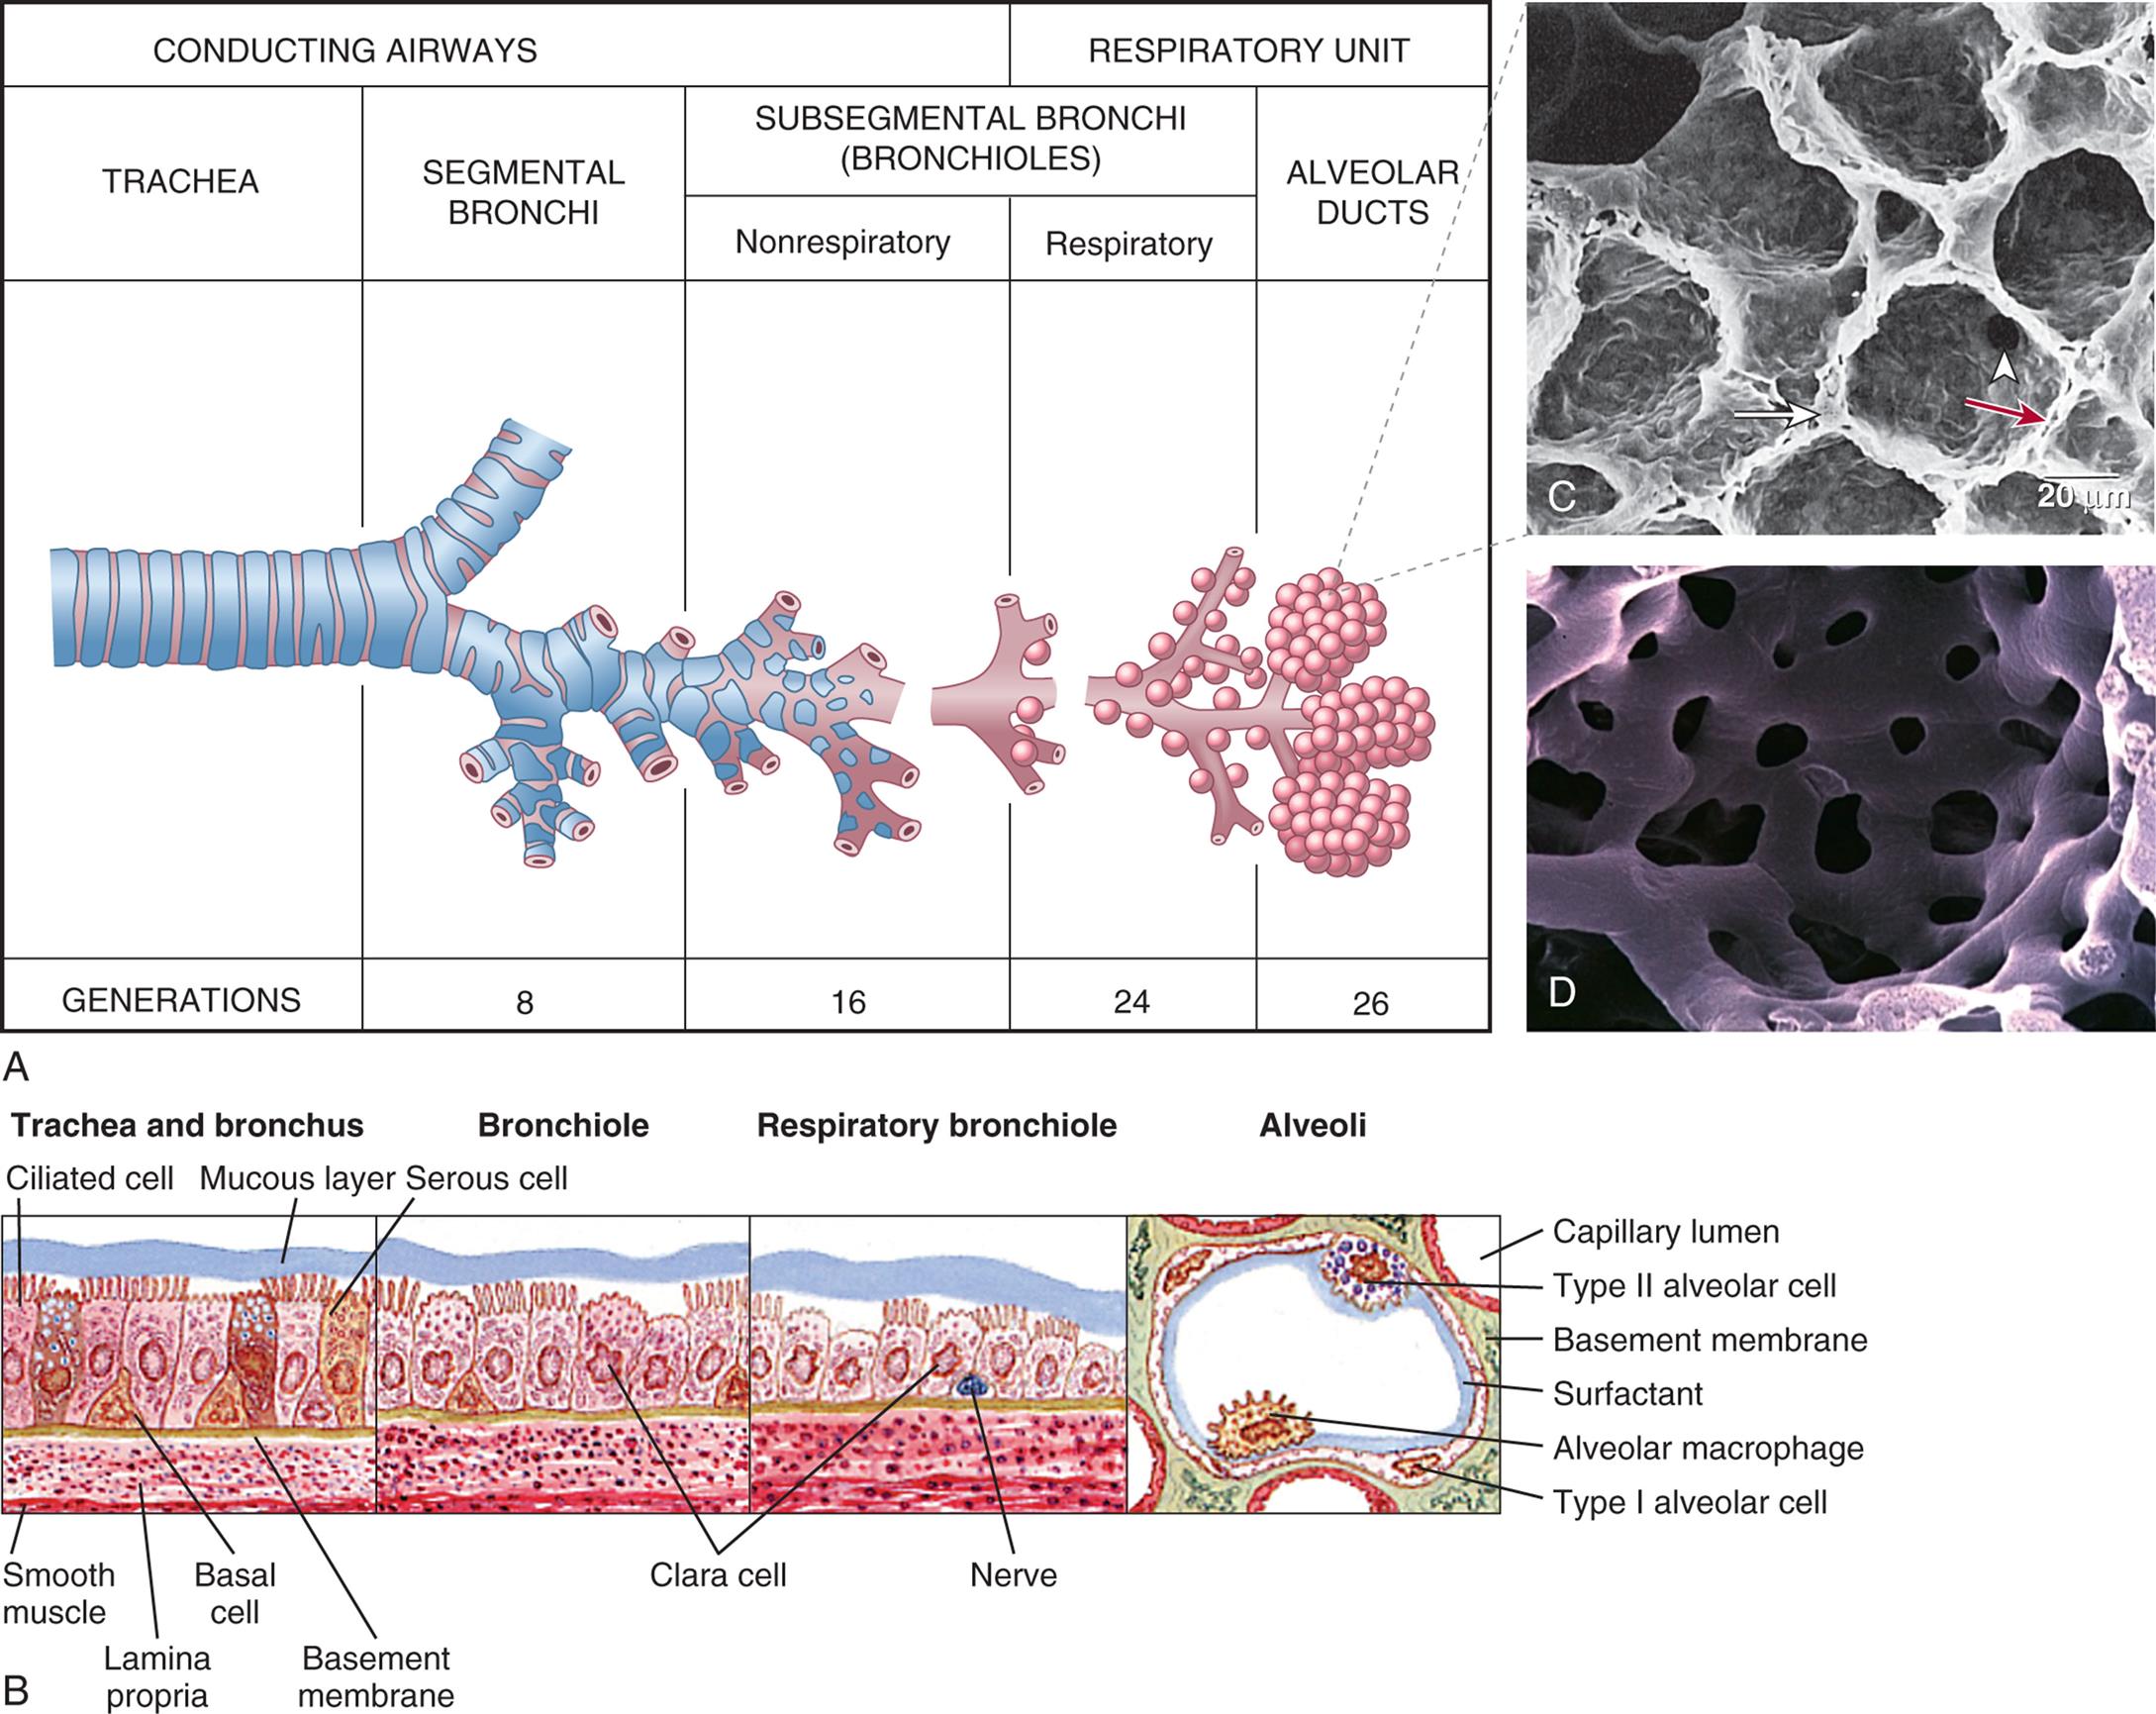
(A) Structures of the lower respiratory airway. (B) Changes in the bronchial wall with progressive branching. Clara (club) cells secrete protective surfactant-type proteins. (C) Electron micrograph of alveoli: long white arrow identifies type II pneumocyte (secretes surfactant); white arrowhead identifies pores of Kohn; red arrow identifies alveolar capillary. (D) Plastic cast of pulmonary capillaries at high magnification. (A, Redrawn from Thompson JM, McFarland GK, Hirsch JE, et al. Mosby’s clinical nursing, 5th edition. St. Louis: Mosby; 2002; B, From Wilson SF, Thompson JM. Respiratory disorders, St. Louis: Mosby; 1990; C, From Mason RJ, et al. Murray and Nadel’s textbook of respiratory medicine, 5th edition. Philadelphia: Saunders; 2010; D, Courtesy A. Churg, MD, and J. Wright, MD, Vancouver, Canada. From Leslie, K. O., & Wick, M. R. Practical pulmonary pathology: A diagnostic approach, 2nd ed. Philadelphia: Saunders; 2011.)
Table A shows the differentiation in the conducting airways and the respiratory units. The conducting airway begins with the trachea, branches into segmental bronchi (generation 8), and the nonrespiratory subsegmental bronchi (bronchioles, generation 16). The respiratory unit comprises the respiratory subsegmental bronchi (bronchioles, generation 24) and the alveolar ducts (generation 26). Illustration B shows the structure bronchial wall. • Trachea and bronchus: mucous layer, ciliated cell, serous cell, basement membrane, basal cell, lamina propria, and smooth muscle. • Bronchiole: Clara cell. • Respiratory bronchiole: Clara cell and nerve. • Alveoli: capillary lumen, type 2 alveolar cell, basement membrane, surfactant, alveolar macrophage, and type 1 alveolar cell. Photomicrograph C shows the porous structure of the alveoli. Photomicrograph D shows the network structure of capillaries.
The bronchial walls have three layers: an epithelial lining, a smooth muscle layer, and a connective tissue layer. In the large bronchi, the connective tissue layer contains cartilage. High columnar pseudostratified epithelium lines the larger airways and becomes progressively thinner, changing to columnar cuboidal epithelium in the bronchioles and squamous epithelium in the alveoli. The epithelial lining of the bronchi contains single-celled mucous-secreting goblet cells and ciliated cells. The goblet cells produce a mucous blanket that protects the airway epithelium. The mucus blanket is composed of periciliary fluid and airway liquid surface layers. When goblet cells detect microbes invading the bronchial tree, they secrete enzymes that improve the ability of the mucus they produce to trap the microbes in the mucous blanket.2 Ciliated epithelial cells rhythmically beat this mucous blanket toward the trachea and pharynx, where it can be swallowed or expectorated by coughing. Toward the terminal bronchioles, ciliated cells and goblet cells become sparser, and smooth muscle and connective tissue layers thin (see Fig. 34.3).
Gas-Exchange Airways
The conducting airways terminate in the gas-exchange airways, including the respiratory bronchioles, alveolar ducts, and alveoli (sing., alveolus). A cluster of these three structures distal to a single terminal bronchiole is called an acinus (see Figs. 34.1 and 34.3). The alveoli are the primary gas-exchange units of the lung, where oxygen (O2) enters the blood and carbon dioxide (CO2) is removed (Fig. 34.4). Tiny passages called pores of Kohn permit some air to pass through the septa from alveolus to alveolus, promoting collateral ventilation and even distribution of air among the alveoli. The lungs contain approximately 50 million alveoli at birth and 480 million by adulthood.
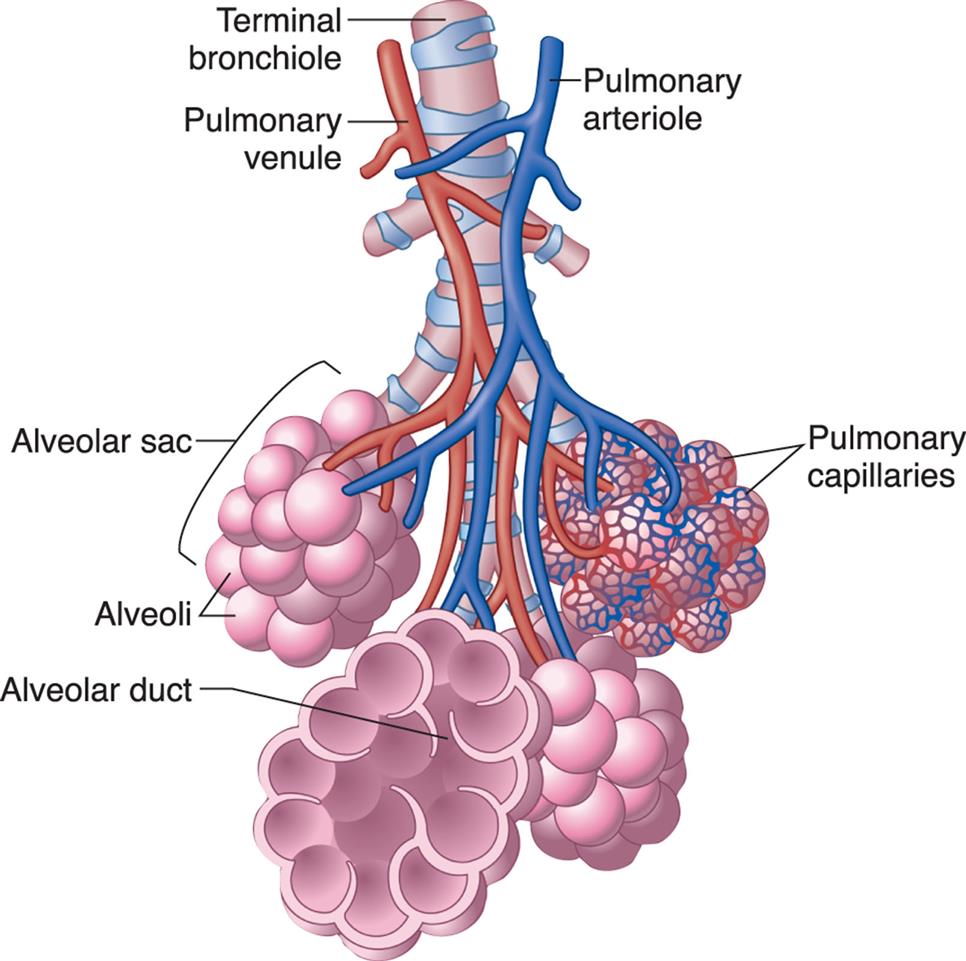
Bronchioles subdivide to form tiny tubes called alveolar ducts, which end in clusters of alveoli called alveolar sacs. (Modified from Patton KT, Thibodeau GA. The human body in health & disease, 6th edition. St. Louis: Mosby; 2014.)
An illustration of the alveoli shows and labels the following structures from the top: terminal bronchiole, pulmonary venule, pulmonary arteriole, alveolar sac, alveoli, pulmonary capillaries, and alveolar duct.
Alveolar cells provide a protective interface with the environment and are essential for adequate gas exchange, preventing entry of foreign agents, regulating ion and water transport, and maintaining the mechanical stability of the alveoli. The alveolar septa consist of an epithelial layer and a thin, elastic basement membrane but no muscle layer. Two major types of epithelial cells appear in the alveolus. Type I alveolar cells provide structure and are large, thin cells that comprise 95% of the surface across which gas exchange occurs.3 Type II alveolar cells secrete surfactant, a lipoprotein that coats the inner surface of the alveolus and facilitates its expansion during inspiration, which lowers alveolar surface tension at end-expiration, thereby preventing lung collapse (atelectasis). Surfactant also plays a role in defending against infection.
Macrophages are the most numerous immune cells present in the lung environment and provide defense of the airway from the bronchi to the alveoli. Humans breathe over 10,000 L of non-sterile air per day, and potentially pathogenic microorganisms must be removed in order to prevent infection. In the alveoli, alveolar macrophages move through the pores of Kohn and patrol the alveoli, where they detect and ingest inhaled microorganisms without activating neutrophils and other elements of innate immunity.4 They also provide protection by clearing surfactant from the lung and ingesting foreign materials that reach the alveolus, preparing these substances for removal through the lymphatics.5 Phagocytosis and the mononuclear phagocyte system are described in Chapters 7 and 8. Surfactant and alveolar macrophages work together with the normal pulmonary microbiota to prevent lower lung infection. Pathogens must overcome these defense mechanisms in order to cause lower respiratory tract infection. Changes in the pulmonary microbiome are associated with many pulmonary diseases (see Emerging Science Box: The Pulmonary Microbiome).
Pulmonary and Bronchial Circulation
The pulmonary circulation facilitates gas exchange, delivers nutrients to lung tissues, acts as a blood reservoir for the left ventricle, and serves as a filtering system that removes clots, air, and other debris from the circulation. The pulmonary vasculature is composed of three compartments connected in series: arteries, capillaries, and veins (Fig. 34.5).
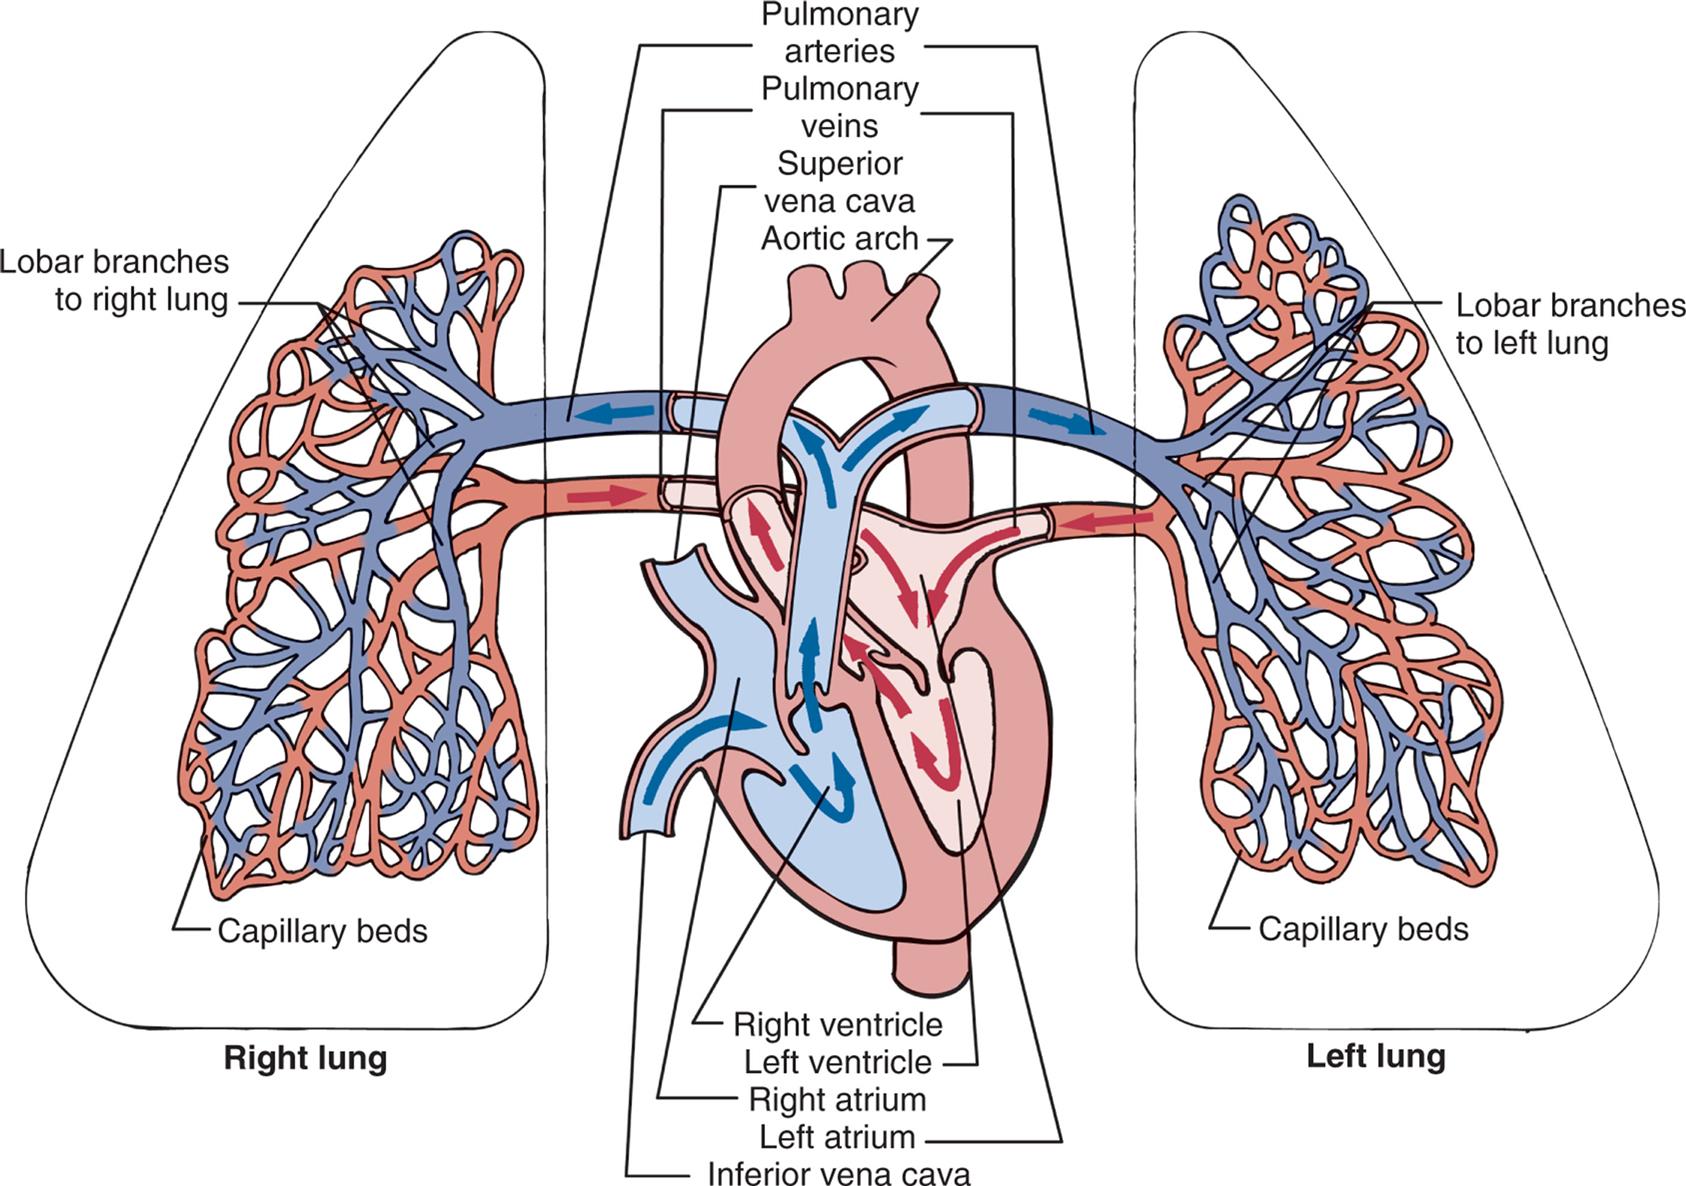
The right and left pulmonary veins and arteries and the branching capillaries are illustrated. Note the pulmonary artery carries venous blood, and the pulmonary vein carries arterial blood.
An illustration of the left lung, the heart, and the right lung shows the pulmonary circulation. The following structures on the right lung are identified: lobar branches to right lung and capillary beds. The followings structures on the left lung are identified: lobar branches to left lung and capillary beds. The following structures on the heart are identified: pulmonary arteries, pulmonary veins, superior vena cava, aortic arch, right ventricle, left ventricle, right atrium, left atrium, and inferior vena cava. Blood flows from the capillary beds of both lungs into the heart and from the heart into the pulmonary arteries leading to the lungs.
Although the entire cardiac output from the right ventricle goes into the lungs, the pulmonary circulation has a lower pressure and resistance than the systemic circulation. Pulmonary arteries are exposed to about one-fifth the pressure of the systemic circulation and have a much thinner muscle layer. Pulmonary artery pressure is about 18 mm Hg, compared to 90 mm Hg in the aorta. Usually, about one-third of the pulmonary vessels are filled with blood (perfused) at any given time. More vessels become perfused when right ventricular cardiac output increases. Therefore, increased delivery of blood to the lungs does not normally increase the mean pulmonary artery pressure significantly. During intense exercise, pulmonary arterial pressure may increase as much as 30 to 50 mm Hg, although the threshold above which the diagnosis of exercise pulmonary hypertension has not been fully established.6 The pulmonary artery divides and enters the lung at the hila, branching with each main bronchus and with all bronchi at every division. Thus, every bronchus and bronchiole has an accompanying artery or arteriole. The arterioles divide at the terminal bronchioles to form a network of pulmonary capillaries around the acinus (see Fig. 34.4). Capillary walls consist of an endothelial layer and a thin basement membrane. The capillary endothelium is composed of two cell types. One type is composed of aerocytes specialized for gas exchange and allows leukocytes to enter the alveolus during inflammation. The other type is termed gCap and is specialized to regulate vasomotor tone and as progenitor cells for capillary repair.3 The shared alveolar and capillary walls compose the alveolocapillary membrane, a very thin membrane made up of the alveolar epithelium, the alveolar basement membrane, an interstitial space, the capillary basement membrane, and the capillary endothelium (Fig. 34.6). Gas exchange occurs across this membrane. The extremely thin alveolar walls are easily damaged and can leak plasma and blood into the alveolar space. Any disorder that thickens the membrane impairs gas exchange.
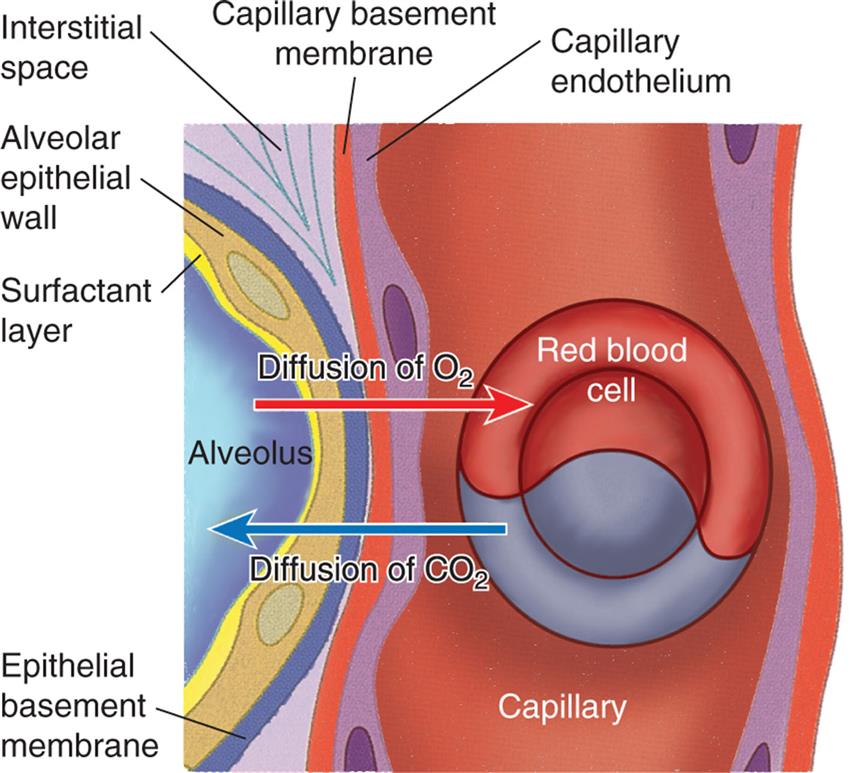
The dense network of capillaries forms an almost continuous sheet of blood in the alveolar walls, providing a very efficient arrangement for gas exchange. CO2, Carbon dioxide; O2, oxygen. (Adapted from Montague SE, Watson R, Herbert R. Physiology for nursing practice, 3rd edition. London: Elsevier; 2005.)
An illustration of the cross-section of the alveolus shows and labels the following structures: surfactant layer, alveolar epithelial wall, epithelial basement membrane, interstitial space, capillary basement membrane, capillary endothelium, capillary, and red blood cell. Diffusion of oxygen is traced from the alveolus to the red blood cell. Diffusion of carbon dioxide is traced from the red blood cell to the alveolus.
Each pulmonary vein drains several pulmonary capillaries. Unlike the pulmonary arteries, which follow the branching bronchi, pulmonary veins are dispersed randomly throughout the lung and then leave the lung at the hila and enter the left atrium. They are similar to veins in the systemic circulation, but they have no valves.
The bronchial circulation is part of the systemic circulation, and it both moistens inspired air and supplies nutrients to the conducting airways, large pulmonary vessels, lymph nodes, and membranes (pleurae) that surround the lungs. The bronchial arteries supply blood to the trachea, bronchi and its branches, esophagus, visceral pleura, the vasa vasorum of the thoracic aorta, and the pulmonary arteries and to the nerves, pulmonary veins, and lymph nodes. The bronchial circulation does not participate in gas exchange.
The lung vasculature also includes deep and superficial pulmonary lymphatic capillaries through which fluid and alveolar macrophages can leave the alveoli to the terminal bronchioles, where they enter the lymphatic system. The superficial lymphatic capillaries drain the membrane that surrounds the lungs. Both deep and superficial lymphatic vessels leave the lung at the hilum through a series of mediastinal lymph nodes; thus many infectious or malignant processes in the lung also affect these nodes.7 The lymphatic system plays an important role in both providing immune defense and keeping the lung free of fluid. (The lymphatic system is described in Chapter 31.)
Control of the Pulmonary Circulation
The caliber of pulmonary artery lumina decreases as smooth muscle in the arterial walls contracts. Contraction increases pulmonary artery pressure. Caliber increases as these muscles relax, decreasing blood pressure. Contraction (vasoconstriction) and relaxation (vasodilation) primarily occur in response to both local humoral conditions and the autonomic nervous system (ANS), as is the systemic circulation.
The most important cause of pulmonary artery constriction is a low alveolar partial pressure of oxygen (PAO2), often termed hypoxic pulmonary vasoconstriction. This results from an increase in intracellular calcium levels in vascular smooth muscle cells in response to a low O2 concentration and the presence of charged O2 molecules, called oxygen radicals.8 It can affect only one segment of the lung (i.e., one lobe that is obstructed, decreasing its PAO2) or the entire lung. If only one segment of the lung is involved, the arterioles to that segment constrict, shunting blood to other, well-ventilated portions of the lung. This reflex improves the lung's efficiency by better matching ventilation and perfusion. If all segments of the lung are affected, however, vasoconstriction occurs throughout the pulmonary vasculature, and pulmonary hypertension (elevated pulmonary artery pressure) can result. The pulmonary vasoconstriction caused by a low PAO2 values is reversible if the PAO2 level is corrected. Chronic alveolar hypoxia can result in inflammation and structural changes in pulmonary arterioles, causing permanent pulmonary artery hypertension, which eventually leads to right heart failure (cor pulmonale) (see Chapter 35).
Acidemia also causes pulmonary artery constriction. If the acidemia is corrected, the vasoconstriction is reversed. (Respiratory acidosis and metabolic acidosis are described in Chapter 3.) An elevated partial pressure of carbon dioxide (PaCO2) in the arterial blood value without a drop in pH does not cause pulmonary artery constriction. Other biochemical factors that affect the caliber of vessels in the pulmonary circulation are histamine, prostaglandins, endothelin, serotonin, nitric oxide, and bradykinin.
Chest Wall and Pleura
The chest wall (skin, ribs, intercostal muscles) protects the lungs from injury. The intercostal muscles of the chest wall, along with the diaphragm, accessory muscles, and abdominal muscles, perform the muscular work of breathing. The thoracic cavity is contained by the chest wall and encases the lungs (Fig. 34.7). A serous membrane called the pleura adheres firmly to the lungs and then folds over itself and attaches firmly to the chest wall. The membrane covering the lungs is the visceral pleura; that lining the thoracic cavity is the parietal pleura. The area between the two pleurae is called the pleural space, or pleural cavity. Normally, only a thin layer of fluid secreted by the pleura (pleural fluid) fills the pleural space, lubricating the pleural surfaces and allowing the two layers to slide over each other without separating. Pressure in the pleural space is usually negative or subatmospheric (−4 to −10 mm Hg).
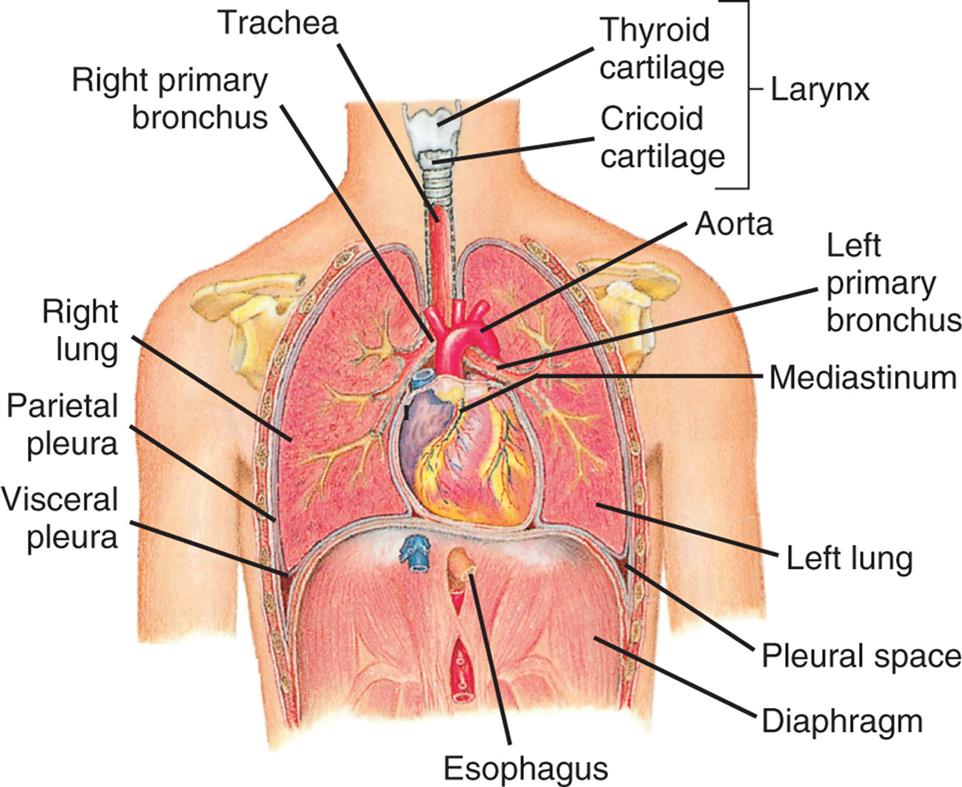
The thoracic (chest) cavity is divided into three subdivisions (left and right pleural divisions and mediastinum) by a partition formed by a serous membrane called the pleura. (From Thibodeau GA, Patton KT. Anatomy & physiology, 3rd edition. St. Louis: Mosby; 1996.)
Function of the Pulmonary System
The pulmonary system (1) ventilates the alveoli, (2) diffuses gases into and out of the blood, and (3) perfuses the lungs so that the organs and tissues of the body receive blood that is rich in O2 and deficient in CO2. Each component of the pulmonary system contributes to one or more of these functions (Fig. 34.8).
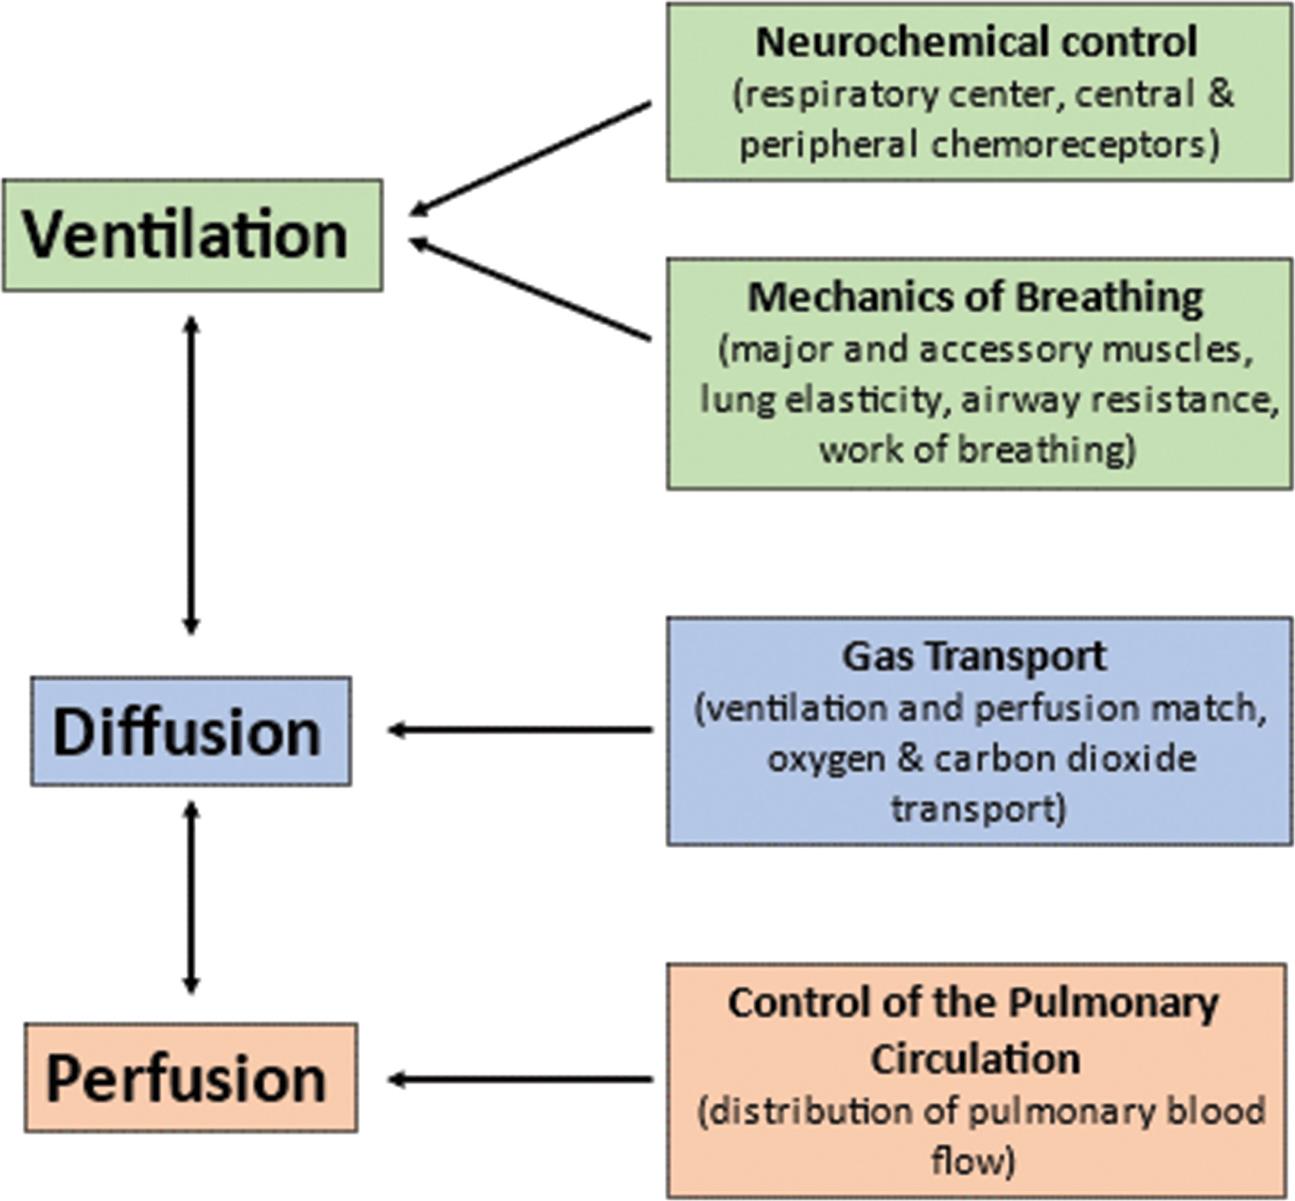
The central nervous system responds to neurochemical stimulation of ventilation and sends signals to the chest wall musculature. The response of the respiratory system to these impulses is influenced by several factors that affect the mechanisms of breathing and, therefore, the adequacy of ventilation. Gas transport between the alveoli and pulmonary capillary blood depends on a variety of physical and chemical activities. Finally, the control of the pulmonary circulation plays a role in the appropriate distribution of blood flow.
A flowchart shows the functional components of the respiratory system. 1. Ventilation (interrelated with 2): Neurochemical control (respiratory center, central and peripheral chemoreceptors) and mechanics of breathing (major and accessory muscles, lung elasticity, airway resistance, and work of breathing. 2. Diffusion (interrelated with 3): Gas transport (ventilation and perfusion match, oxygen and carbon dioxide transport). 3. Perfusion: Control of the pulmonary circulation (distribution of pulmonary blood flow).
Ventilation
Ventilation is the mechanical movement of gas or air into and out of the lungs. It is often misnamed respiration, which is actually the exchange of O2 and CO2 during cellular metabolism. The “respiratory rate” is actually the ventilatory rate, or the number of times gas is inspired and expired per minute. The volume of ventilation is calculated by multiplying the ventilatory rate (breaths per minute) by the volume or amount of air per breath (liters per breath, or tidal volume). This is called the minute volume (or minute ventilation [V˙]) and is expressed in liters per minute. The effective ventilation is calculated by multiplying the ventilatory rate by the tidal volume minus the dead space. Dead-space ventilation (VD) is the volume of air per breath that does not participate in gas exchange. It is ventilation without perfusion. Anatomic dead-space is the volume of air in the conducting airways. Alveolar dead-space is the volume of air in unperfused alveoli.
CO2, the gaseous form of carbonic acid (H2CO3), is produced by cellular metabolism. The lung eliminates about 10,000 milliequivalents (mEq) of H2CO3 per day in the form of CO2, which is produced at the rate of approximately 200 mL/min. CO2 is eliminated to maintain a normal partial pressure of arterial CO2 (PaCO2) of 40 mm Hg and normal acid-base balance (see Chapter 3 for a discussion of acid-base regulation). Adequate ventilation is necessary to maintain normal PaCO2 levels. Diseases that limit the ventilatory rate or tidal volume, or both, decrease ventilation and result in CO2 retention. The adequacy of alveolar ventilation cannot be accurately determined by observation of the ventilatory rate, pattern, or effort. If a healthcare professional needs to determine the adequacy of ventilation, an arterial blood gas analysis or capnography must be performed to determine if there is CO2 retention.
Neurochemical Control of Ventilation
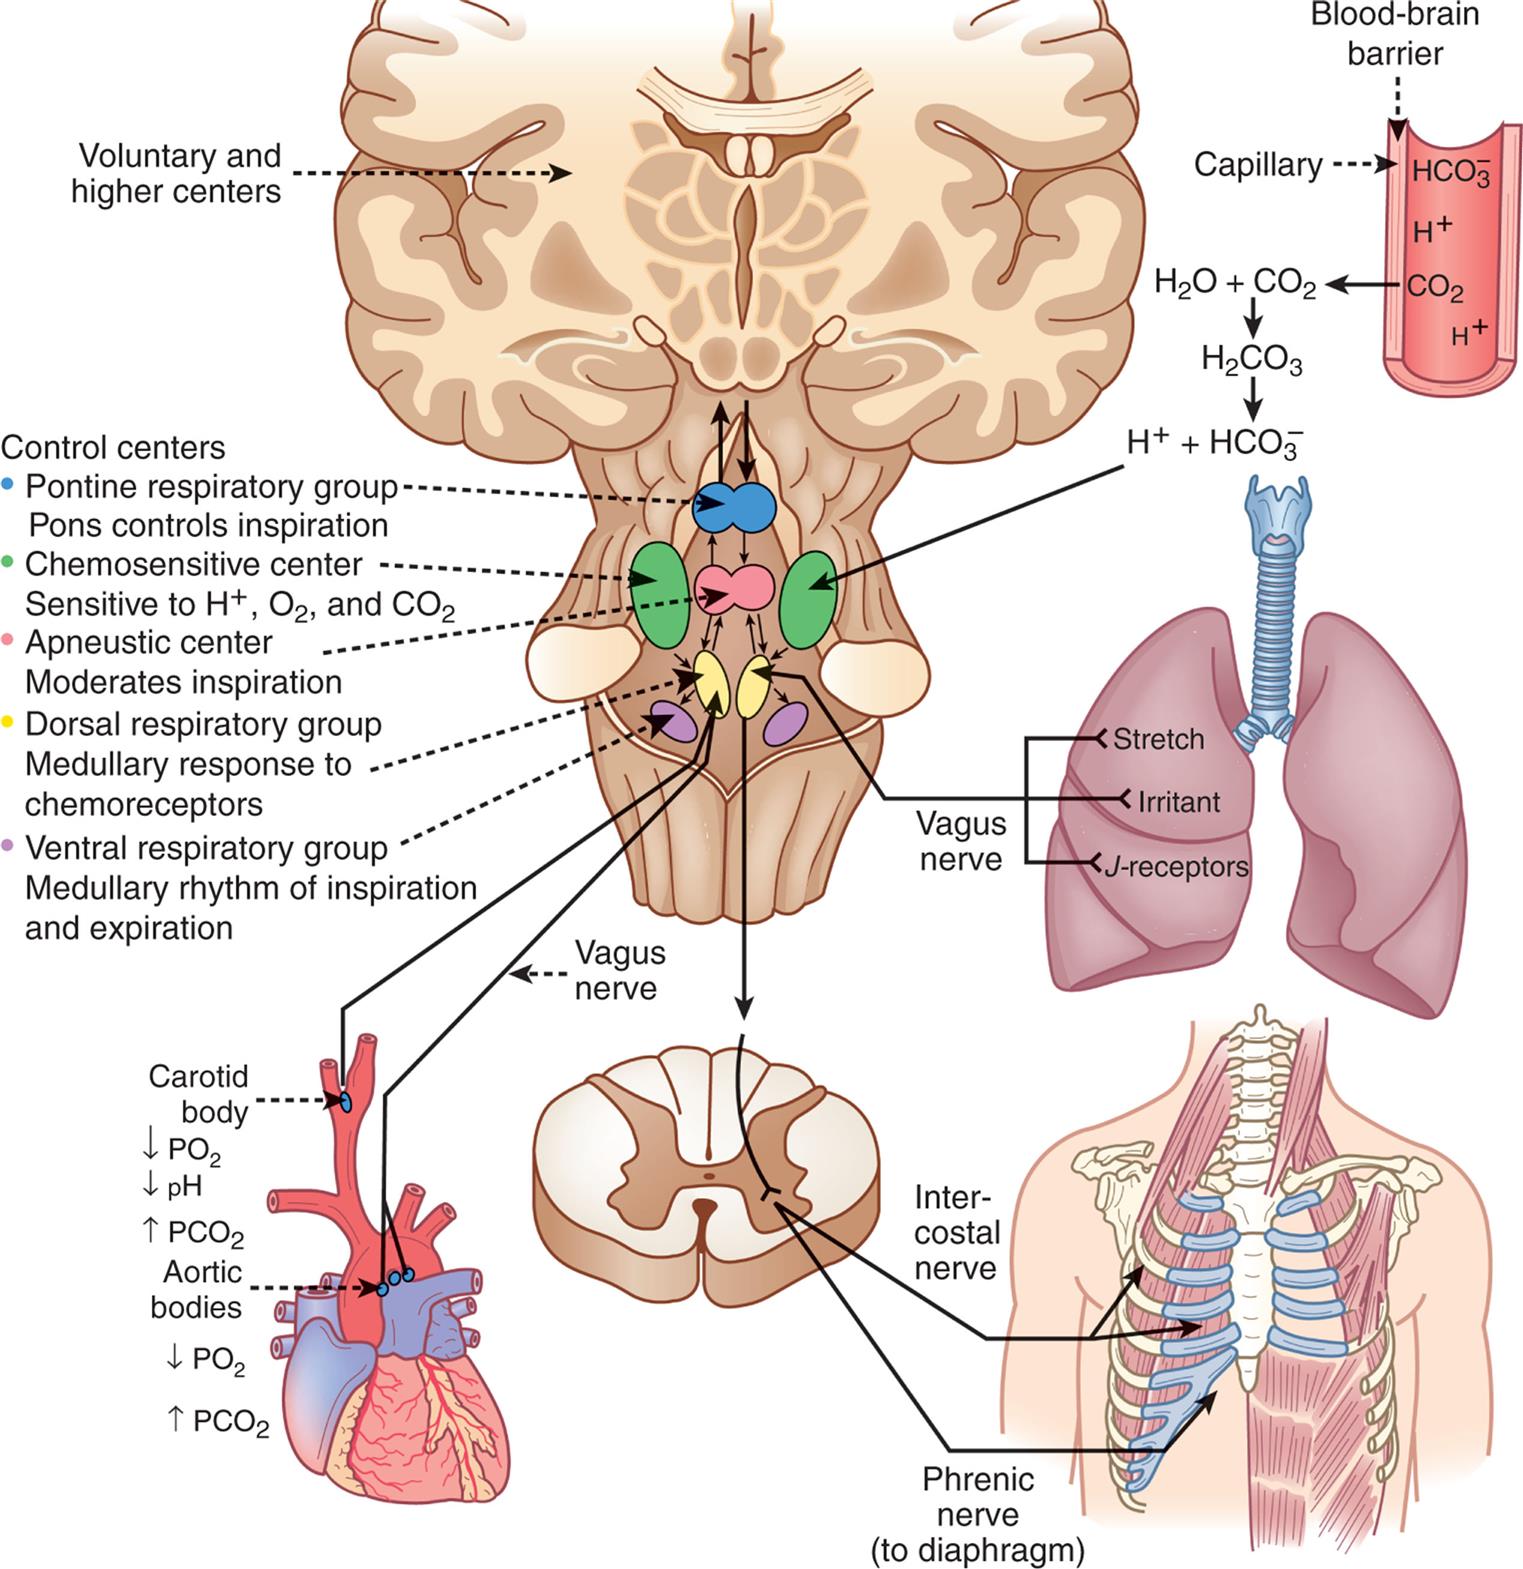
Breathing is usually involuntary because homeostatic changes in the ventilatory rate and volume are adjusted automatically by the nervous system to maintain normal gas exchange. Voluntary breathing is necessary for talking, singing, laughing, and deliberately holding one's breath. The mechanisms that control respiration are complex (Fig. 34.9).
 , bicarbonate; PO2, partial pressure of oxygen.
An illustration of the brain, capillary, lung, torso, cartilage, and heart shows the neurochemical respiratory control system. The illustration of the capillary shows bicarbonate ions, hydrogen ions, and carbon dioxide. Carbon dioxide from the capillary mixes with water to form carbonic acid, which breaks down into hydrogen ions and bicarbonate ions. Hydrogen ions acts on chemosensitive center. The illustration of the brain shows the voluntary and higher centers and the control centers. • Pontine respiratory group. Pons controls inspiration. • Chemosensitive center. Sensitive to hydrogen ions, oxygen, and carbon dioxide. • Apneustic center. Moderates inspiration. • Dorsal respiratory group. Medullary response to chemoreceptors. • Ventral respiratory group. Medullary rhythm of inspiration and expiration. An illustration of the lung shows the stretch, irritant, and J-receptors that connect through the vagus nerve to the brain stem. An illustration of the rib cage shows the intercostal nerve and the phrenic nerve (to diaphragm). An illustration of the heart shows the carotid body and the aortic bodies connected to the vagus nerve in the brain. The carotid body relates to decreased partial pressure of oxygen, decreased p H, and increased partial pressure of carbon dioxide. The aortic bodies represent decreased partial pressure of oxygen and increased partial pressure of carbon dioxide.
The respiratory center in the brainstem controls respiration by transmitting impulses to the respiratory muscles, causing them to contract and relax. The respiratory center is composed of several groups of neurons located bilaterally in the brainstem: the pontine respiratory group (pneumotaxic and apneustic centers), the dorsal respiratory group (DRG), the ventral respiratory group (VRG), the pontine respiratory center, and the apneustic center.
The basic automatic rhythm of respiration is set by the VRG, a cluster of inspiratory nerve cells located in the medulla that sends efferent impulses to the diaphragm and inspiratory intercostal muscles. The DRG receives afferent input from peripheral chemoreceptors in the carotid and aortic bodies; from mechanical, neural, and chemical stimuli; and from receptors in the lungs, and it alters breathing patterns to restore normal blood gases. This is usually accompanied by a sensation of dyspnea (breathing discomfort) (see Emerging Science Box: Silent Hypoxemia in COVID-19). The pontine respiratory group does not generate primary rhythm but, rather, acts as a modifier of the rhythm established by the VRG. Breathing can be modified by input from the cortex, the limbic system, and the hypothalamus, and the pattern of breathing can be influenced by emotion, pain, and disease.
Chemoreceptors
Chemoreceptors monitor the pH, PaCO2, and PaO2 of arterial blood. Central chemoreceptors are located near the respiratory center and monitor arterial blood indirectly by sensing changes in the pH of cerebrospinal fluid (CSF) (see Fig. 34.9). As CO2 accumulates in the blood because of decreased ventilation, it diffuses across the blood-brain barrier (the capillary wall separating the blood from the cells of the central nervous system) into the CSF until the partial pressure of CO2 (PCO2) is equal on both sides. CO2 that has entered the CSF combines with water (H2O) to form H2CO3, which subsequently dissociates into hydrogen ions (H+) that are capable of stimulating acid-activated central chemoreceptors (the retrotrapezoid nucleus).9
As the central chemoreceptors sense the decrease in pH, they stimulate the respiratory center to increase the depth and rate of ventilation. Increased ventilation causes the partial pressure of carbon dioxide (PaCO2) in the arterial blood to decrease below that of the CSF, and CO2 diffuses out of the CSF, returning its pH to normal. In this way, PaCO2 regulates ventilation through its effect on the pH (hydrogen ion content) of the CSF.
The central chemoreceptors are sensitive to very small changes in the pH of the CSF (equivalent to a 1 to 2 mm Hg change in PCO2) and can maintain a normal PaCO2 under many different conditions, including strenuous exercise. If inadequate ventilation, or hypoventilation, is long term (e.g., in chronic obstructive pulmonary disease [COPD]), these receptors become insensitive to small changes in PaCO2 (“reset”) and regulate ventilation poorly. In addition, prolonged increases in PaCO2 result in renal compensation through bicarbonate ( ) retention. This
  gradually diffuses into the CSF, where it normalizes the pH and limits the effect on the ventilatory drive.
The peripheral chemoreceptors are located in aortic bodies, the aortic arch, and carotid bodies at the bifurcation of the carotids, near the baroreceptors. They are only somewhat sensitive to changes in pH and instead are sensitive primarily to PaO2 levels. As the PaO2 and pH decrease, peripheral chemoreceptors, particularly in the carotid bodies, send signals to the respiratory center to increase ventilation. However, the PaO2 must drop well below normal (to approximately 60 mm Hg) before the peripheral chemoreceptors have much influence on ventilation. If the pH is decreased as well, ventilation increases much more than it would in response to either abnormality alone. The peripheral chemoreceptors become the major stimulus to ventilation when the central chemoreceptors are reset by chronic hypoventilation.
Lung receptors
Three types of lung sensory receptors send impulses from the lungs to the DRG:
- 1. Irritant receptors (rapidly adapting receptors) are found in the epithelium of all conducting airways. They are sensitive to noxious aerosols (vapors), gases, and particulate matter (e.g., inhaled dust), which cause them to initiate the cough reflex. Transient receptor potential (TRP) channels respond to irritant receptor activation and inflammatory stimuli and induce cough via the vagus nerve.10 When stimulated, irritant receptors also cause bronchoconstriction and increased ventilatory rate. These receptors are located primarily in the proximal larger airways and are nearly absent in the distal airways; thus, it is possible for secretions to accumulate in the distal respiratory tree without initiating cough.
- 2. Stretch receptors (slowly adapting receptors) are located in the smooth muscles of the airways and are sensitive to increases in the size or volume of the lungs. They decrease the ventilatory rate and volume when stimulated, an occurrence sometimes referred to as the Hering-Breuer expiratory reflex. This reflex is active in newborns and assists with ventilation. In adults, this reflex is active only at high tidal volumes (e.g., with exercise and mechanical ventilation) and may protect against excess lung inflation.
- 3. Pulmonary C-fiber receptors (also known as J-receptors [juxtapulmonary capillary receptors]) are located near the capillaries in the alveolar septa and in other airway locations as nociceptors. They are sensitive to increased pulmonary capillary pressure, which stimulates them to initiate rapid, shallow breathing; laryngeal constriction on expiration; and mucus secretion; hypotension; and bradycardia. They may be associated with the sensation of dyspnea.11
Autonomic nervous system
The lung is innervated by the ANS (The structures and function of the ANS are discussed in detail in Chapter 15). Fibers of the sympathetic division of the ANS in the lung branch out from the upper thoracic and cervical ganglia (stellate ganglia) of the spinal cord. The primary sympathetic neurotransmitter in the lung is norepinephrine. Fibers of the parasympathetic division of the ANS travel in the vagus nerve to the lung, where they release acetylcholine. The parasympathetic and sympathetic divisions of the ANS control airway caliber (interior diameter of the airway lumen) by stimulating the bronchial smooth muscle to contract or relax. Bronchial smooth muscle tone depends on equilibrium, that is, equal stimulation of contraction and relaxation. The sympathetic nervous system’s release of norepinephrine stimulates airway β-adrenergic receptors causing airway smooth muscle to relax (bronchodilation). The parasympathetic nervous system’s release of acetylcholine stimulates two types of muscarinic receptors in the lung, M2 and M3. Stimulation of M2 receptors limits the further release of acetylcholine, whereas stimulation of M3 receptors causes airway smooth muscle to contract (bronchoconstriction) and increases mucous secretion. M3 activation and associated bronchoconstriction occur if receptors in the airway epithelium are stimulated by irritants in inspired air, by inflammatory mediators (e.g., histamine, serotonin, prostaglandins, leukotrienes), by many drugs, and by humoral substances.12 Muscarinic receptor antagonists are used to promote bronchodilation and reduce mucous secretion in conditions such as asthma and COPD (see Chapter 35).13
Mechanics of Breathing
The mechanical aspects of inspiration and expiration are known collectively as the mechanics of breathing and involve (1) major and accessory muscles of inspiration and expiration, (2) elastic properties of the lungs and chest wall, and (3) resistance to airflow through the conducting airways. Alterations in any of these properties increase the work of breathing or the metabolic energy needed to achieve adequate ventilation and oxygenation of the blood.
Major and accessory muscles
The major muscles of inspiration are the diaphragm and the external intercostal muscles (muscles between the ribs) (Fig. 34.10). The diaphragm is the primary muscle of ventilation and provides the anatomic separation between the thorax and the abdomen. It is a dome-shaped muscle that separates the abdominal and thoracic cavities. It has multiple intrathoracic attachments and is innervated by the paired phrenic nerves. When it contracts and flattens downward, it increases the volume of the thoracic cavity, creating a negative pressure that draws gas into the lungs through the upper airways and trachea. The phrenic nerves have both sensory and motor functions. They originate from the C3 to C5 spinal nerves and descend through the thorax to innervate the right and left hemidiaphragms. They provide sensory input from the pleura and upper peritoneum. They provide the only motor innervation of the diaphragm and are essential for stimulating adequate ventilation. Trauma to the cervical spine above C4, central nervous system disorders, neuropathies, and neuromuscular diseases (see Chapter 18) may lead to diaphragmatic paralysis and respiratory failure.14 The right and left phrenic nerves pass close to the right hilum and left hila of the lung, respectively, and may be impacted by diseases such as tumors or trauma that damage the hilar regions causing hemiparalysis of the diaphragm. Prolonged mechanical ventilation can inhibit the function of the phrenic nerve making it more difficult to return to normal ventilation.15 Contraction of the external intercostal muscles elevates the anterior portion of the ribs and increases the volume of the thoracic cavity by increasing its front-to-back (anterior-posterior [AP]) diameter. Although the external intercostal muscles may contract during quiet breathing, inspiration at rest is usually assisted by the diaphragm only.
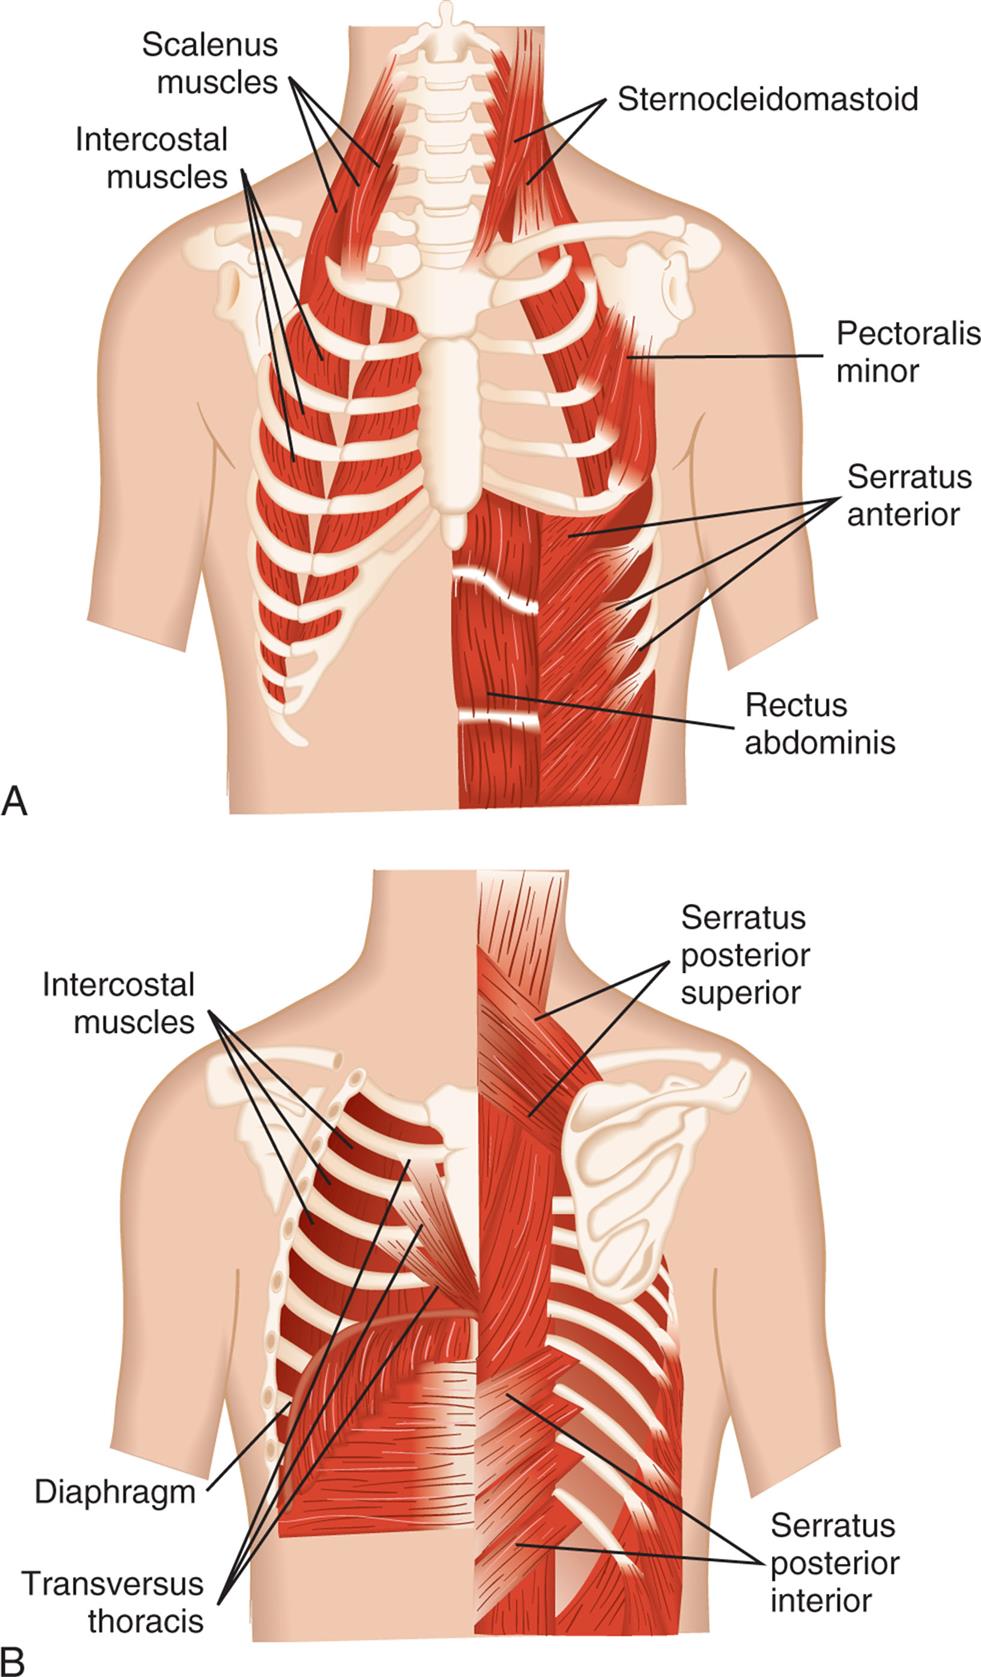
(A) Anterior view. (B) Posterior view. (Modified from Thompson JM, McFarland GK, Hirsch JE, et al. Mosby’s clinical nursing, 5th edition. St. Louis: Mosby; 2002.)
Illustration A is the anterior view of the muscles in the rib cage. The following structures are labeled: scalenus muscles, sternocleidomastoid, intercostal muscles, pectoralis minor, serratus anterior, and rectus abdominis. Illustration B is the posterior view of the muscles in the rib cage. The following structures are labeled: serratus posterior superior, intercostal muscles, diaphragm, serratus posterior inferior, and transversus thoracis.
The accessory muscles of inspiration are the sternocleidomastoid and scalene muscles. Like the external intercostal muscles, these muscles enlarge the thorax by increasing its AP diameter. The accessory muscles assist inspiration when the minute volume (volume of air inspired and expired per minute) is very high, such as during strenuous exercise or when the work of breathing is increased because of disease. The accessory muscles do not increase the volume of the thorax as efficiently as the diaphragm does.
There are no major muscles of expiration because normal, relaxed expiration is passive and requires no muscular effort. The accessory muscles of expiration, the abdominal and internal intercostal muscles, assist expiration when the minute volume is high, during coughing, or when airway obstruction is present. When the abdominal muscles contract, intra-abdominal pressure increases, pushing up the diaphragm and decreasing the volume of the thorax. The internal intercostal muscles pull down the anterior ribs, decreasing the AP diameter of the thorax.
Alveolar surface tension
Surface tension occurs at any gas-liquid interface and refers to the tendency for liquid molecules that are exposed to air to adhere to one another. This phenomenon can be seen in the way liquids “bead” when splashed on a waterproof surface.
Within a sphere, such as an alveolus, surface tension tends to make expansion difficult. According to the law of Laplace, the pressure (P) required to inflate a sphere is equal to two times the surface tension (2 T) divided by the radius (r) of the sphere, or P = 2 T/r. As the radius of the sphere (or alveolus) becomes smaller, more and more pressure is required to inflate it. If the alveoli were lined with a water-like fluid, taking breaths would be extremely difficult.
Alveolar ventilation, or distention, is made possible by surfactant, which lowers the surface tension by coating the air-liquid interface in the alveoli. Surfactant, a lipoprotein (90% lipids and 10% protein) produced by type II alveolar cells, includes two groups of surfactant proteins. One group consists of small hydrophobic molecules called surfactant B and C that have a detergent-like effect that separates the liquid molecules, thereby decreasing alveolar surface tension. These surfactant proteins line the alveolar side of the alveolocapillary membrane and, in effect, reverse the law of Laplace. As the radius of a surfactant-lined sphere (alveolus) becomes smaller, the surface tension decreases, and as the radius grows larger, the surface tension increases. This occurs because the surfactant molecules have much weaker intermolecular attraction than do liquid molecules. The surfactant molecules occupy most of the air-fluid interface and disrupt the intermolecular forces that tend to collapse the alveoli. Therefore, the alveoli are much easier to inflate at low lung volumes (i.e., after expiration) than at high volumes (i.e., after inspiration). The decrease in surface tension caused by surfactant also is responsible for keeping the alveoli free of fluid. If surfactant is not produced in adequate quantities, alveolar surface tension increases, causing alveolar collapse, decreased lung expansion, increased work of breathing, and severe gas-exchange abnormalities. Surfactant replacement therapy is used for a number of pulmonary diseases in which alveolar collapse (atelectasis) occurs.16
The other group of surfactant proteins is crucial in lung defense. Surfactant proteins A and D contribute to the control of lung inflammation by decreasing the release of proinflammatory mediators, preventing oxidative injury, and regulating the role of fibroblasts in airway remodeling.17 These surfactant proteins have important antimicrobial effects, and defects in these proteins are linked to several lung disorders, including pneumonia, asthma, and COPD.18
Elastic properties of the lung and chest wall
The lung and chest walls have elastic properties that permit expansion during inspiration and return to resting volume during expiration. The elasticity of the lungs is caused both by elastin fibers in the alveolar walls surrounding the small airways and pulmonary capillaries and by surface tension at the alveolar air-liquid interface. The elasticity of the chest wall is the result of the configuration of its bones and musculature.
Elastic recoil is the tendency of the lungs to return to the resting state after inspiration. Normal elastic recoil permits passive expiration, eliminating the need for major muscles of expiration. Passive elastic recoil may be insufficient during labored breathing (high minute volume) when the accessory muscles of expiration may be needed. The accessory muscles are also used if disease compromises elastic recoil (e.g., in emphysema) or blocks the conducting airways.
Normal elastic recoil depends on an equilibrium between opposing forces of recoil in the lungs and chest wall. Under normal conditions, the chest wall tends to recoil by expanding outward. When the sternum is split to open the thoracic cavity, the chest wall moves outward laterally. The tendency of the chest wall to recoil by expanding is balanced by the tendency of the lungs to recoil or inward collapse around the hila. This reaction is caused by elastic recoil and surface tension in the alveoli. The opposing forces of the chest wall and lungs create the small negative intrapleural pressure.
A balance between the outward recoil of the chest wall and the inward recoil of the lungs occurs at the resting level, at the end of expiration. During inspiration, the diaphragm and intercostal muscles contract, air flows into the lungs, and the chest wall expands. Muscular effort is needed to overcome the resistance of the lungs to expansion. During expiration, the muscles relax, and the elastic recoil of the lungs causes the thorax to decrease in volume until a balance between the chest wall and lung recoil forces is reached (Fig. 34.11).
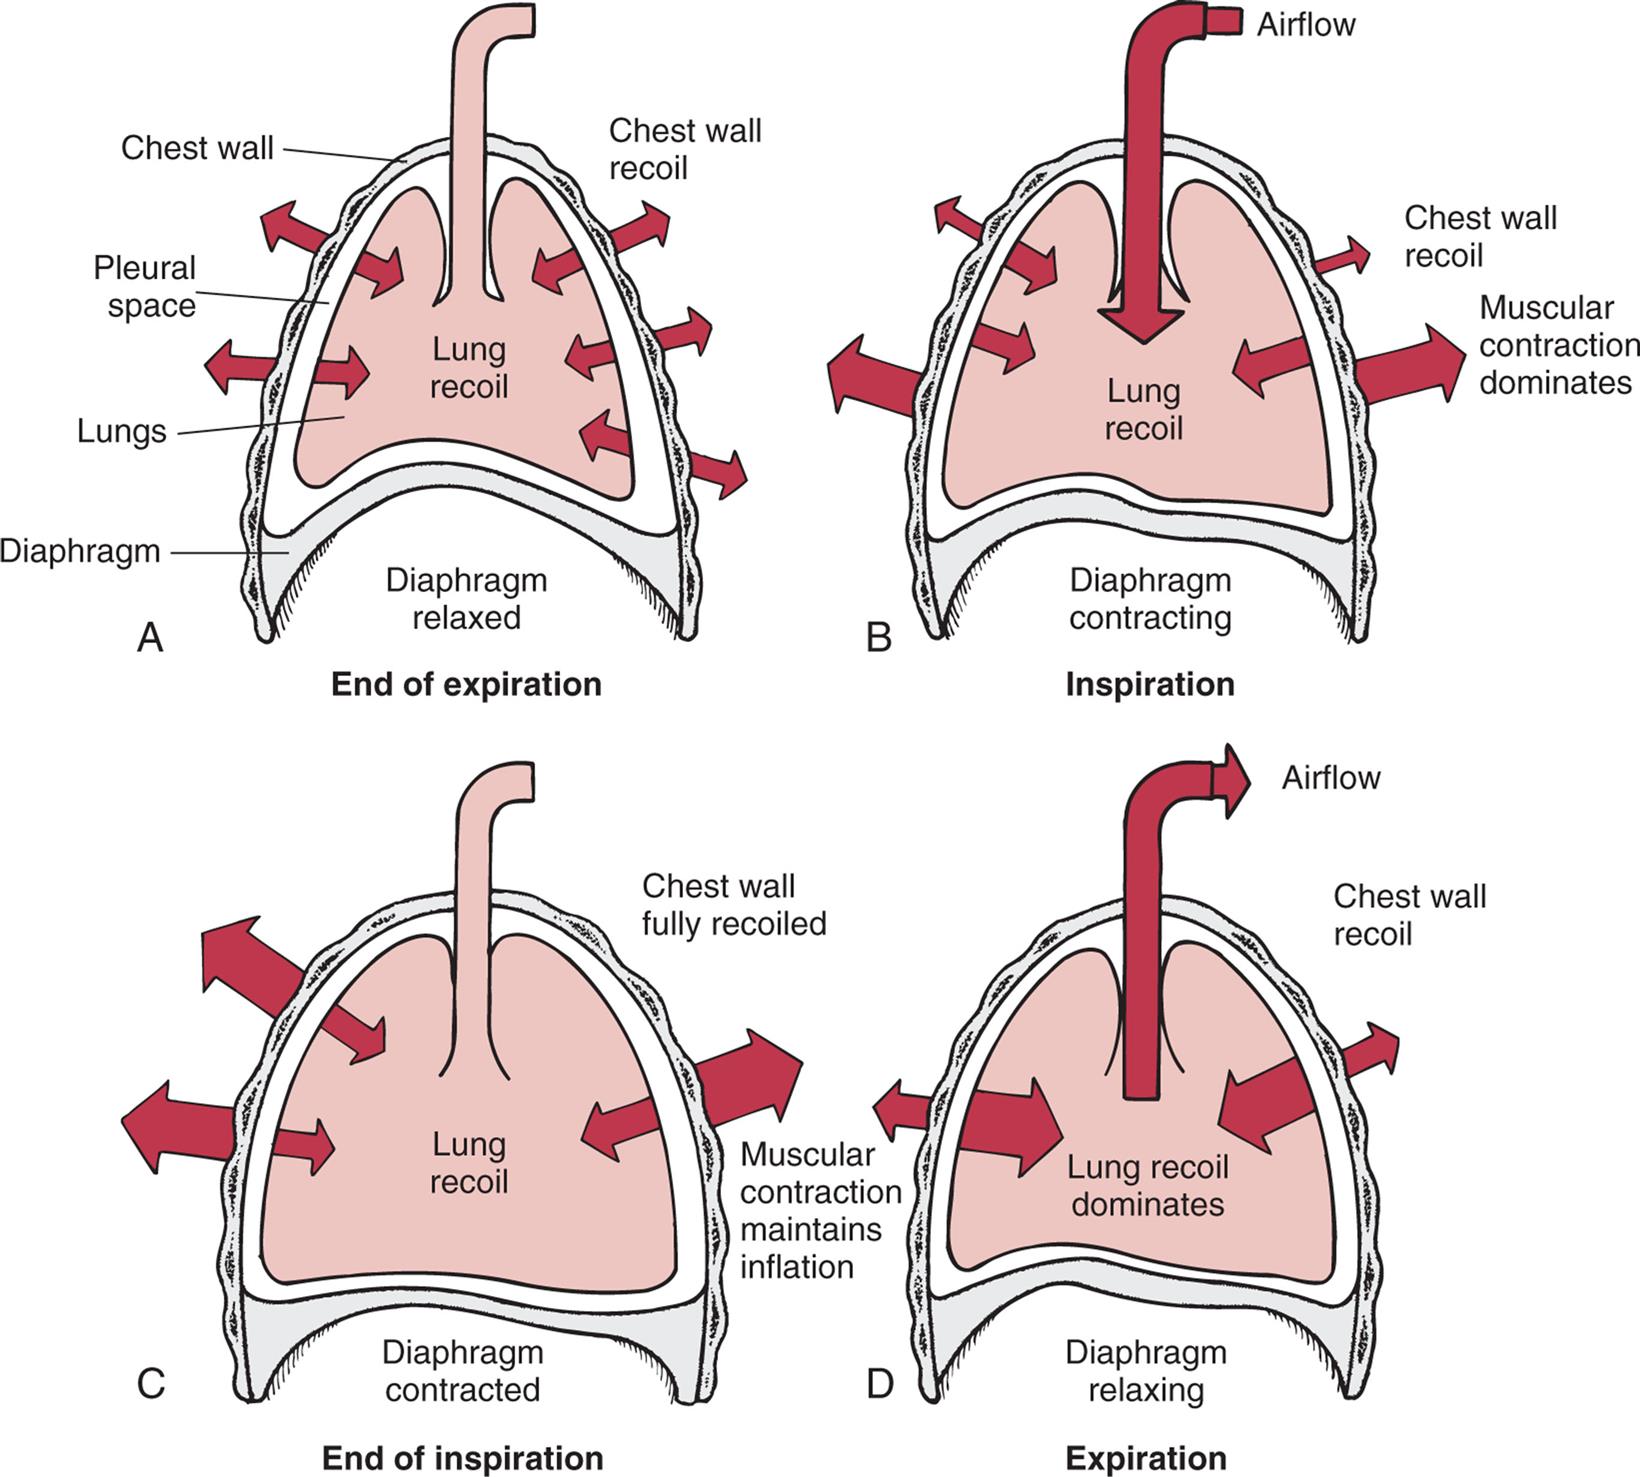
(A) Outward recoil of the chest wall equals inward recoil of the lungs at the end of expiration. (B) During inspiration, contraction of respiratory muscles, assisted by chest wall recoil, overcomes the tendency of lungs to recoil. (C) At the end of inspiration, respiratory muscle contraction maintains lung expansion. (D) During expiration, respiratory muscles relax, allowing elastic recoil of the lungs to deflate the lungs.
Four illustrations, A, B, C, and D, shoe interaction of forces during inspiration and expiration. Illustration A represents the end of expiration. The chest wall, pleural space, lungs, and diaphragm are identified. The diaphragm is relaxed. Chest wall recoil is traced along the wall both inward and outward. Illustration B represents inspiration. The air flows into the lungs and expands the chest as the muscular contraction dominates. The diaphragm is contracting. Chest wall recoil is outward and minimal; muscular contraction dominates; and lung recoil is medium. Airflow is inward. Illustration C represents end of inspiration. The lung is fully inflated, the diaphragm is contracted, and the muscular contraction maintains inflation. Chest wall is fully recoiled. Illustration D represents expiration. The air flows out of the lung as the lung recoil dominates. Chest wall recoil is minial. Airflow is outward.
Compliance is the measure of lung and chest wall distensibility and is defined as volume change per unit of pressure change. It represents the relative ease with which these structures can be stretched and is, therefore, the opposite of elasticity. Compliance is determined by the alveolar surface tension and the elastic recoil of the lung and chest wall.
Increased compliance indicates that the lungs or chest wall is abnormally easy to inflate and has lost some elastic recoil. A decrease in compliance indicates that the lungs or chest wall is abnormally stiff or difficult to inflate. Compliance increases with normal aging and with disorders such as emphysema; it decreases in individuals with acute respiratory distress syndrome, pneumonia, pulmonary edema, and fibrosis. (These disorders are described in Chapter 35.)
Airway resistance
Airway resistance, which is similar to resistance to blood flow (described in Chapter 31), is determined by the length, radius, and cross-sectional area of the airways and by the density, viscosity, and velocity of the gas (Poiseuille's law). Resistance is computed by dividing the change in pressure (P) by the rate of flow (F), or R = P/F (Ohm's law), and can easily be measured in the pulmonary function laboratory. Airway resistance is normally very low. One-half to two-thirds of total airway resistance occurs in the nose. The next highest resistance is in the oropharynx and larynx. Airway resistance also is affected by the diameter of the airways, and there is very little resistance in the conducting airways of the lungs because of their large cross-sectional area. Bronchodilation, which decreases resistance to airflow, is caused by β2-adrenergic receptor stimulation. Bronchoconstriction, which increases airway resistance, can be caused by the stimulation of parasympathetic receptors in the bronchial smooth muscle and by numerous irritants and inflammatory mediators. Airway resistance can also be increased by edema of the bronchial mucosa and by airway obstructions, such as mucus, tumors, or foreign bodies. Pulmonary function tests (PFTs) measure lung volumes and flow rates and can be used to measure airway resistance and help diagnose certain lung diseases (see Tests of Pulmonary Function section).
Work of breathing
The work of breathing is determined by the muscular effort (and therefore oxygen and energy) required for ventilation. Normally very low, the work of breathing may increase considerably in diseases that disrupt the equilibrium between forces exerted by the lung and chest wall. More muscular effort is required when lung compliance decreases (e.g., in pulmonary edema), chest wall compliance decreases (e.g., in spinal deformity or obesity), or airways are obstructed by bronchospasm or mucous plugging (e.g., in asthma or bronchitis). An increase in the work of breathing can result in a marked increase in O2 consumption and an inability to maintain adequate ventilation.
Gas Transport
Gas transport is the delivery of O2 to the cells of the body and the removal of CO2. Delivery of O2 has four steps: (1) ventilation of the lungs, (2) diffusion of O2 from the alveoli into the capillary blood, (3) perfusion of systemic capillaries with oxygenated blood, and (4) diffusion of O2 from systemic capillaries into the cells. Steps in the transport of CO2 occur in reverse order: (1) diffusion of CO2 from the cells into the systemic capillaries, (2) perfusion of the pulmonary capillary bed by venous blood, (3) diffusion of CO2 into the alveoli, and (4) removal of CO2 from the lung by ventilation. If any step in gas transport is impaired by a respiratory or cardiovascular disorder, gas exchange at the cellular level is compromised.
Measurement of Gas Pressure
The properties of air, once it enters the body, are determined by interactions among gas molecules at a given temperature. The millions of gas molecules are moving randomly, colliding with each other and with the wall of the space in which they are contained. These collisions exert pressure. If the same number of gas molecules is contained in a small and a large container, the pressure is greater in the small container because more collisions occur in the smaller space (Fig. 34.12). Heat increases the speed of the molecules, which increases the number of collisions and, therefore, the pressure.
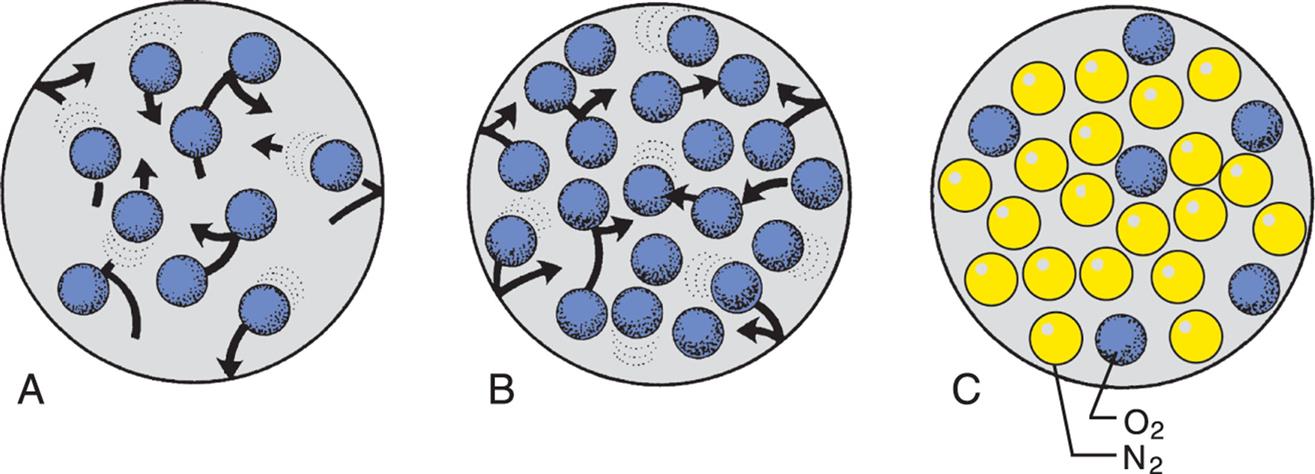
(A) Theoretically, 10 molecules of the same gas exert a total pressure of 10 mm Hg within the space. (B) If the number of molecules is increased to 20, the total pressure is 20 mm Hg. (C) If there are different gases in the space, each gas exerts a partial pressure: here, the partial pressure of nitrogen (yellow) is 18, the partial pressure of oxygen (blue) is 6, and the total pressure is 24 mm Hg.
Illustration A shows ten oxygen molecules in an enclosed space moving in different directions. Illustration B shows twenty oxygen molecules in an enclosed space moving in different directions. Illustration C shows six oxygen molecules and nineteen nitrogen molecules packed in an enclosed space.
Barometric pressure (PB) (atmospheric pressure) is the pressure exerted by gas molecules in air at specific altitudes. At sea level, barometric pressure is 760 mm Hg, which is the sum of the pressures exerted by each gas in the air at sea level. The portion of the total pressure exerted by any individual gas is its partial pressure. At sea level, the air consists of O2 (20.9%), nitrogen (78.1%), and a few other trace gases. The partial pressure of oxygen (PO2) is equal to the percentage of O2 in the air (20.9%) times the total PB (760 mm Hg at sea level), or 159 mm Hg. At higher elevations, the PB falls, and the amount of gases in the air decreases.
The amount of water vapor contained in a gas mixture is determined by the temperature of the gas and is unrelated to the barometric pressure. Gas that enters the lungs becomes saturated with water vapor (humidified) as it passes through the upper airway. At body temperature (37°C [98.6°F]), water vapor exerts a pressure of 47 mm Hg regardless of the total PB. The partial pressure of water vapor (PH2O) must be subtracted from the PB before the partial pressure of other gases in the mixture can be determined. In air saturated with water at sea level, the partial pressure of oxygen is (760 − 47) × 0.209 = 149 mm Hg. All pressure and volume measurements made in pulmonary function laboratories specify the temperature and humidity of a gas at the time of measurement.
The percentage of O2 in the inspired air is equal to the PO2 (20.9%) and is called the fraction of inspired oxygen (FiO2) in room air. The adequacy of ventilation to deliver O2 to the alveoli cannot be measured directly but can be estimated by measuring the removal of CO2 from the blood, as calculated by dividing the PaCO2 by the respiratory quotient. The respiratory quotient describes the relationship between ventilation and perfusion of the lung and is considered to be 0.8.
The amount of oxygen in the alveoli (PAO2) depends on the barometric pressure, the water vapor pressure, the amount of oxygen in the inspired air, the adequacy of ventilation as measured by the PaCO2, and the respiratory quotient. The calculation of PAO2 using these parameters is called the alveolar gas equation:PAO2 = (PB − PH2O) × FiO2 − (PaCO2/respiratory quotient). For example, at sea level in an individual with normal ventilation, the amount of oxygen in the alveoli available for gas diffusion into the blood is calculated as PAO2 = (760 − 47) × 0.209 − (40/0.8) = 99 mm Hg (Fig. 34.13). Different values for PAO2 can be calculated if there are changes in the inspired oxygen content or the PaCO2, which are common occurrences in clinical settings. All pressure and volume measurements made in pulmonary function laboratories specify the temperature and humidity of a gas at the time of measurement. Symbols used in the measurement of gas pressures and pulmonary ventilation are defined in Table 34.2.
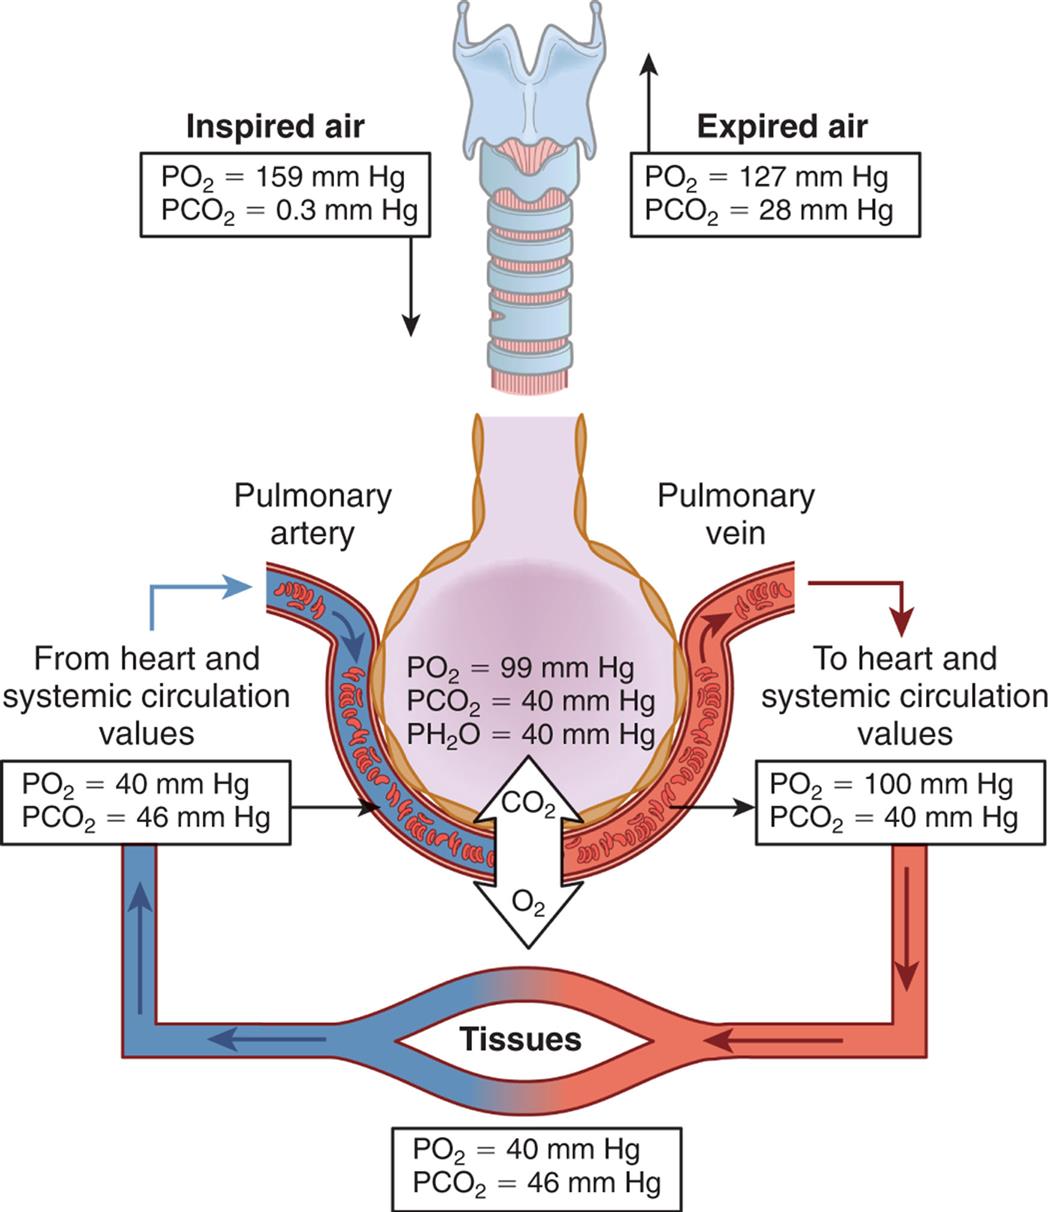
An illustration shows the partial pressure of respiratory gasses in normal respiration. Alveoli pressure quantities are as follows: partial pressure of oxygen at 99 millimeters of mercury, partial pressure of carbon dioxide at 40 millimeters of mercury, and partial pressure of water at 40 millimeters of mercury. Inspired air (partial pressure of oxygen equals 159 millimeters of mercury and partial pressure of carbon dioxide equals 0.3 millimeters of mercury) flows into the respiratory system. Expired air (partial pressure of oxygen equals 127 millimeters of mercury and partial pressure of carbon dioxide equals 28 millimeters of mercury) flows out of the respiratory system. Blood flows from heart (systemic circulation values: partial pressure of oxygen equals 40 millimeters of mercury and partial pressure of carbon dioxide equals 46 millimeters of mercury) through the pulmonary vein to the heart (partial pressure of oxygen equals 100 millimeters of mercury and partial pressure of carbon dioxide equals 40 millimeters of mercury) to the tissues (partial pressure of oxygen equals 40 millimeters of mercury and partial pressure of carbon dioxide equals 46 millimeters of mercury) and back to the heart.
Table 34.2
| Symbola | Definition |
|---|---|
| V | Volume or amount of gas |
| Q | Perfusion or blood flow |
| P | Pressure (usually partial pressure) of a gas |
| PiO2 | Partial pressure of inspired oxygen (varies with altitude) |
| PaO2 | Partial pressure of oxygen in arterial blood |
| PAO2 | Partial pressure of oxygen in alveolar blood |
| PaCO2 | Partial pressure of carbon dioxide in arterial blood |
| PH2O | Partial pressure of water vapor |
| PN2 | Partial pressure of nitrogen |
| PvO2 | Partial pressure of oxygen in mixed venous or pulmonary artery blood |
| P(A–a)O2 | Difference between alveolar and arterial partial pressure of oxygen (A–a gradient) |
| PB | Barometric or atmospheric pressure |
| SaO2 | Saturation of hemoglobin (in arterial blood) with oxygen |
 |
Saturation of hemoglobin (in mixed venous blood) |
| VA | Alveolar ventilation—effective total lung capacity |
| VD | Dead-space ventilation |
| VE | Minute capacity |
| VT | Tidal volume or average breath |
 |
Ratio of ventilation to perfusion |
| FiO2 | Fraction (percent) of inspired oxygen (0.21) |
| FRC | Functional residual capacity |
| FVC | Forced vital capacity |
| FEV1 | Forced expiratory volume in 1 second |
| ERV | Expiratory reserve volume |
| IRV | Inspiratory reserve volume |
| IC | Inspiratory capacity |
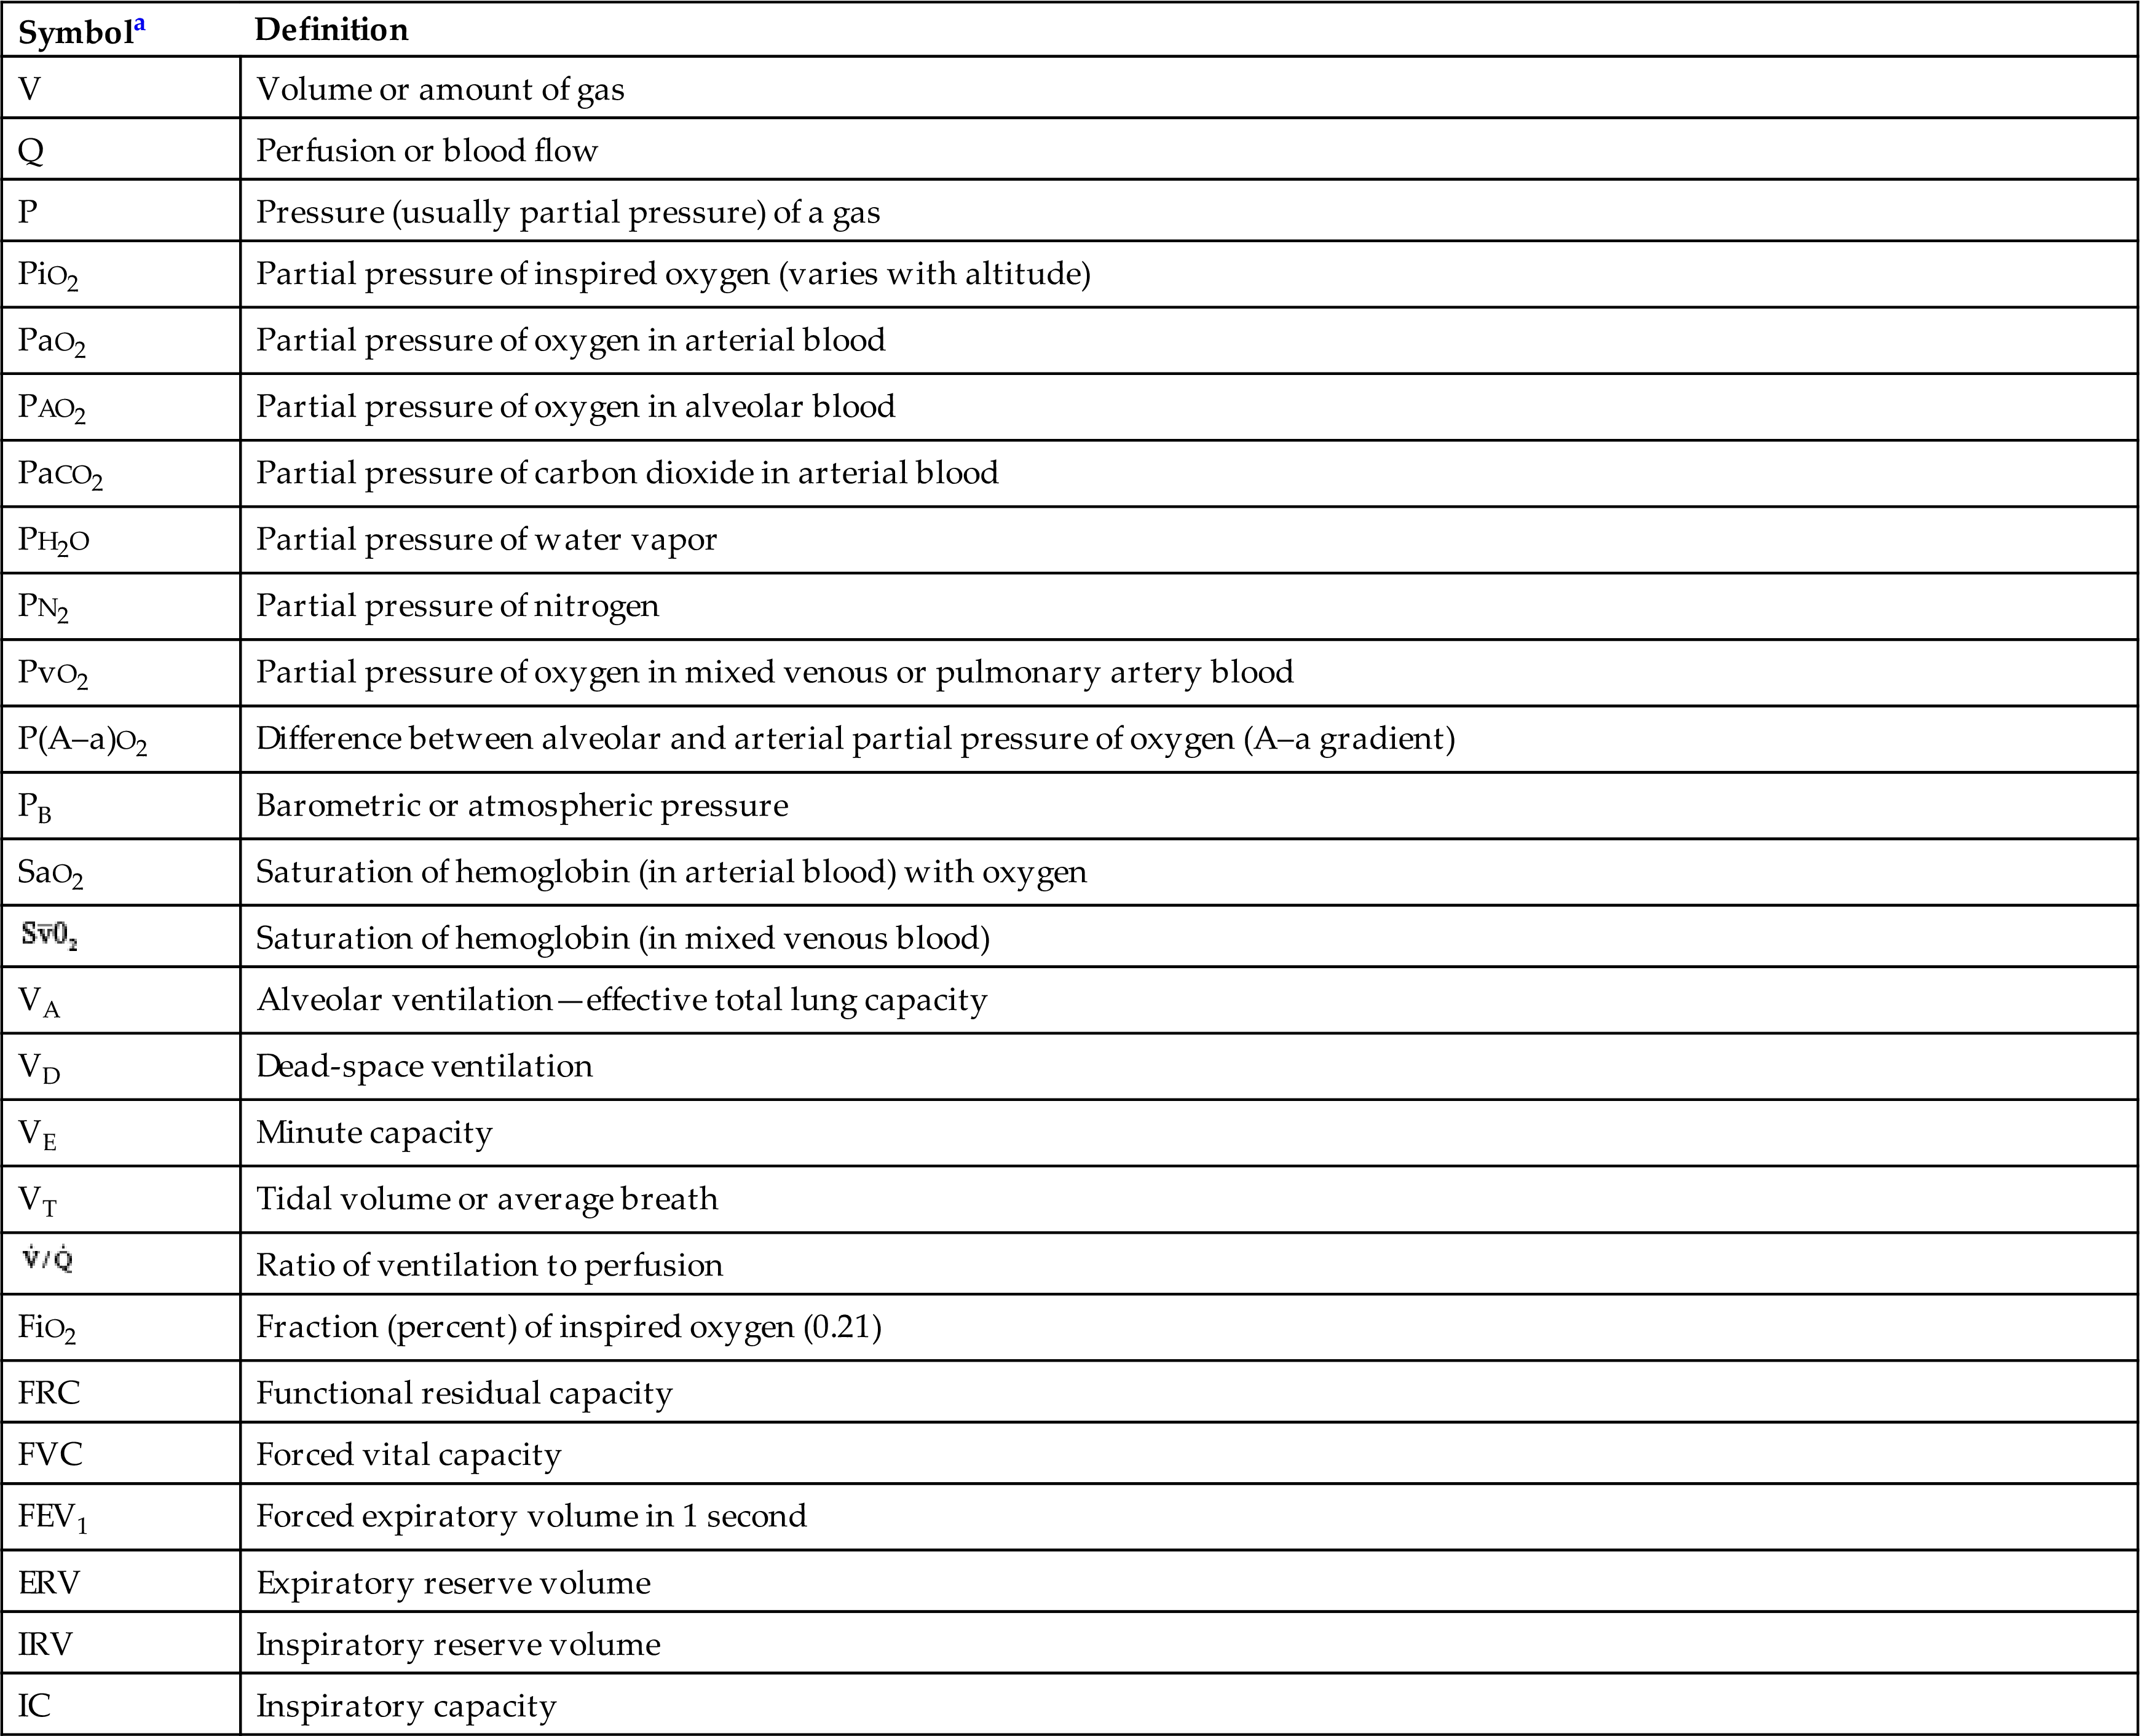
aSubscripts identify the particular gas, volume, or pressure being discussed. An overhead dot, such as in V˙/Q˙, means measurement over time, usually 1 minute.
Distribution of Ventilation and Perfusion
Effective gas exchange depends on an approximately even distribution of gas (ventilation) and blood (perfusion) in all portions of the lungs. The lungs are suspended from the hila in the thoracic cavity. When an individual is in an upright position (sitting or standing), gravity pulls the lungs down toward the diaphragm and compresses their lower portions, or bases. The alveoli in the upper portions, or apices, of the lungs contain a greater residual volume of gas and are larger and less numerous than those in the lower portions. Because surface tension increases as the alveoli become larger, the larger alveoli in the upper portions of the lung are more difficult to inflate (less compliant or less distensible) than the smaller alveoli in the lower portions of the lung. Therefore, during ventilation, most of the tidal volume is distributed to the bases of the lungs, where compliance is greater.
The heart pumps against gravity to perfuse the pulmonary circulation. As blood is pumped into the lung apices of a sitting or standing individual, some blood pressure is dissipated in overcoming gravity. As a result, blood pressure at the apices is lower than that at the bases. Because greater pressure causes greater perfusion, the bases of the lungs are better perfused than the apices (Fig. 34.14). Thus, ventilation and perfusion are greatest in the same lung portions—the lower lobesin the upright position. If a standing individual assumes a supine or side-lying position, the areas of the lungs that are then most dependent become the best ventilated and perfused.
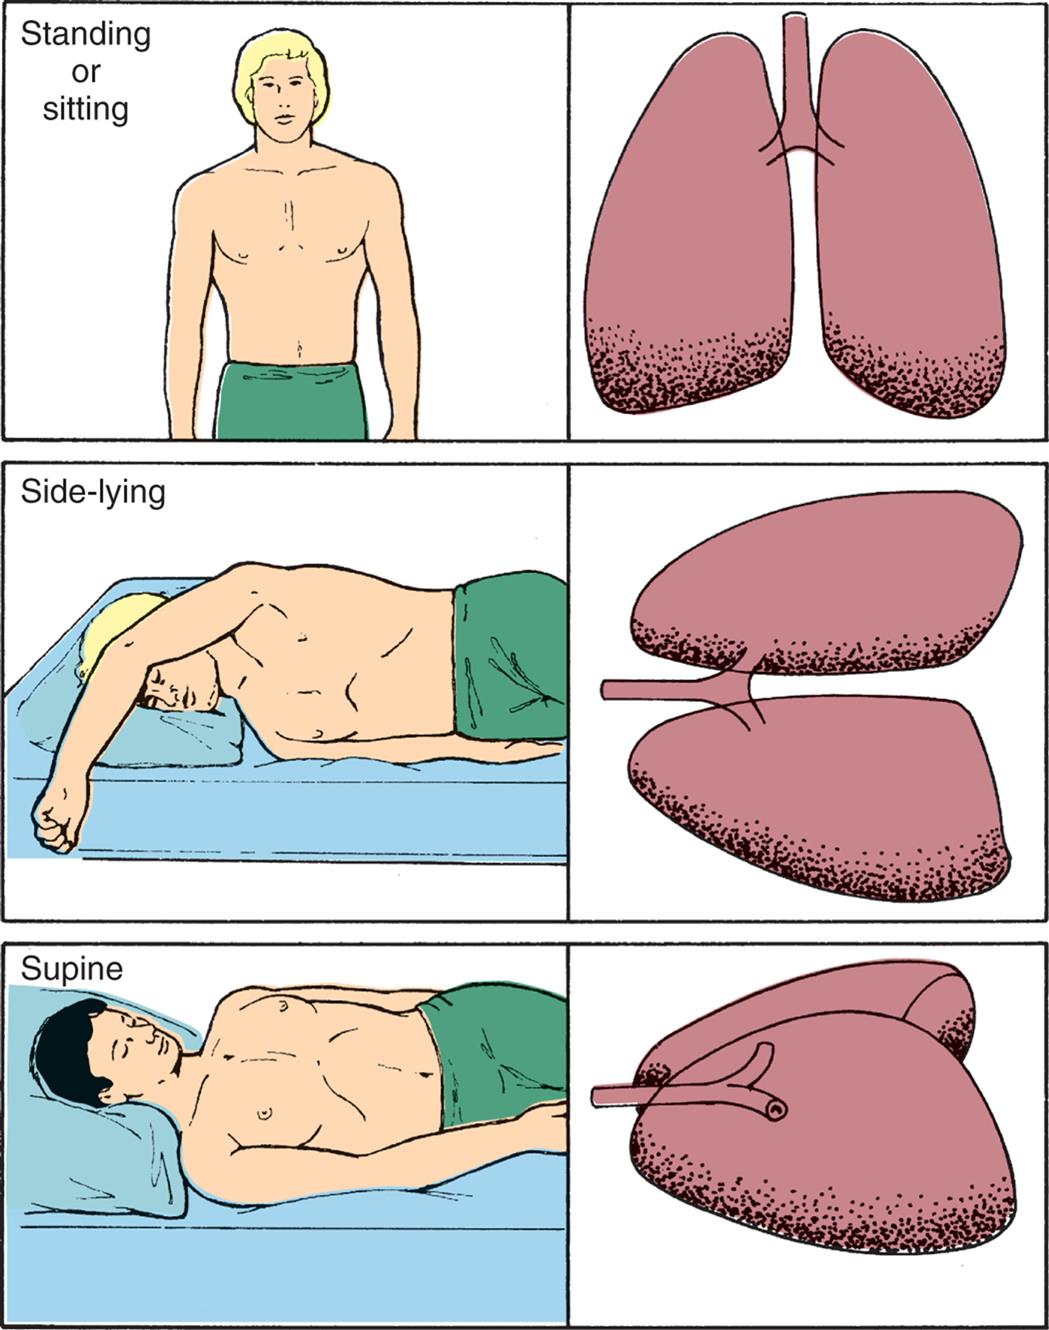
The greatest volume of pulmonary blood flow normally will occur in the gravity-dependent areas of the lung. Body position has a significant effect on the distribution of pulmonary blood flow. The shaded areas represent gravity-dependent pulmonary blood flow.
Three pairs of illustrations show the upper body and lungs of a person, respectively. Top panel. The illustration on the left shows the anterior view of a person standing (or sitting). The illustration on the right shows the anterior view of the lungs. Middle panel. The illustration on the left shows a person lying on their side (side-lying). The illustration on the right shows the anterior view of the lungs on the side. Bottom panel. The illustration on the left shows a person in supine position. The illustration on the right shows a lateral view of the lungs on the side.
The distribution of perfusion in the pulmonary circulation also is affected by the alveolar pressure (gas pressure in the alveoli). The pulmonary capillary bed differs from the systemic capillary bed in that it is surrounded by gas-containing alveoli. If the gas pressure in the alveoli exceeds the blood pressure in the capillary, the capillary collapses, and flow ceases. This is most likely to occur in portions of the lung where blood pressure is lowest and alveolar gas pressure is greatest—that is, at the apex of the lung.
The lungs are divided into three zones on the basis of relationships among all the factors affecting pulmonary blood flow. Alveolar pressure and the forces of gravity, arterial blood pressure, and venous blood pressure affect the distribution of perfusion, as shown in Fig. 34.15.
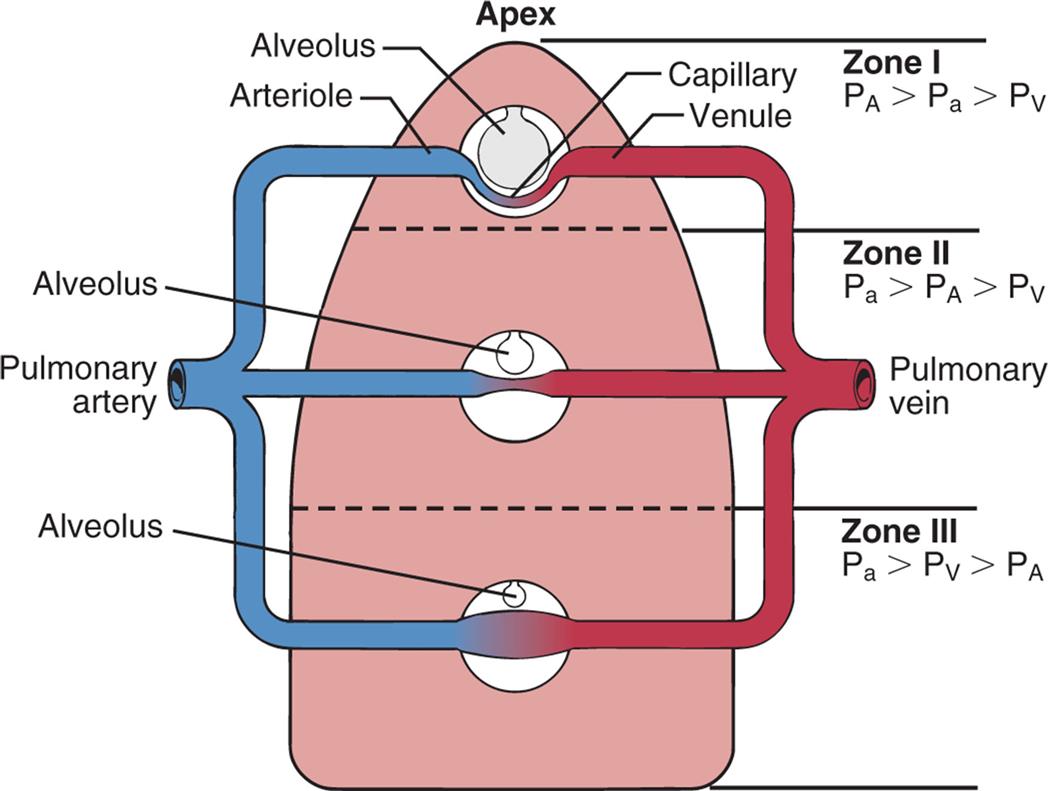
Effects of gravity and alveolar pressure on pulmonary blood flow in the three lung zones. In zone I, the alveolar pressure (PA) is greater than the arterial pressure (Pa) and the venous pressure (PV), and no blood flow occurs. In zone II, the Pa exceeds the PA, but the PA exceeds the PV. Blood flow occurs in this zone, but the PA compresses the venules (venous ends of the capillaries). In zone III, both the Pa and PV are greater than the PA, and blood flow fluctuates, depending on the difference between the PA arterial pressure and the PV.
An illustration shows gravity and alveolar pressure. The following structures are labeled from the top to the bottom: apex, alveolus (zone one), arteriole, capillary, venule, alveolus (zone two), pulmonary artery, pulmonary vein, alveolus (zone three). • Zone one: Alveolar pressure is greater than arterial pressure, which is greater than venous pressure. • Zone two: Arterial pressure is greater than alveolar pressure, which is greater than venous pressure. • Zone three: Arterial pressure is greater than venous pressure, which is greater than alveolar pressure.
In zone I, the alveolar pressure exceeds the pulmonary arterial and venous pressures. The capillary bed collapses, and normal blood flow ceases. Normally zone I is a very small part of the lung at the apex. In zone II, the alveolar pressure is greater than the venous pressure but not the arterial pressure. Blood flows through zone II, but it is impeded to a certain extent by the alveolar pressure. Zone II is normally above the level of the left atrium. In zone III, both the arterial and venous pressures are greater than the alveolar pressure, and blood flow is not affected by the alveolar pressure. Zone III is in the base of the lung. Blood flow through the pulmonary capillary bed increases in regular increments from the apex to the base.
Although both blood flow and ventilation are greater at the base of the lungs than at the apices, they are not perfectly matched in any zone. Perfusion exceeds ventilation in the bases, and ventilation exceeds perfusion in the apices of the lung. The relationship between ventilation and perfusion is expressed as a ratio called the ventilation-perfusion ratio (V˙/Q˙). The normal V˙/Q˙ is called the respiratory quotient and is 0.8. This is the amount by which perfusion exceeds ventilation under normal conditions.
As described previously in this chapter, a low alveolar partial pressure of oxygen causes a reflex called hypoxic pulmonary vasoconstriction. Increases in carbon dioxide also contribute to pulmonary vasoconstriction.19 If a segment of the lung experiences decreased alveolar oxygen and increased carbon dioxide, arterioles to that segment constrict, so that appropriate matching of ventilation and perfusion is restored.
Oxygen Transport
Approximately 1000 mL (1 L) of O2 is transported to the cells of the body each minute. O2 is transported in the blood in two forms: a small amount dissolves in plasma, and the remainder binds to hemoglobin molecules. Without hemoglobin, O2 would not reach the cells in amounts sufficient to maintain normal metabolic function. (Hemoglobin is discussed in detail in Chapter 28, and cellular metabolism is explored in Chapter 1.)
Diffusion across the alveolocapillary membrane
The alveolocapillary membrane is ideal for O2 diffusion because it has a large total surface area (70 to 100 m2) and is very thin (0.5 μm). In addition, the PAO2 (approximately 99 mm Hg at sea level) is much greater than that in capillary blood (approximately 40 mm Hg), a condition that promotes rapid diffusion down the concentration gradient from the alveolus into the capillary. Therefore, a pressure gradient of nearly 60 mm Hg facilitates the diffusion of O2 from the alveolus into the capillary (see Fig. 34.13).
Blood remains in the pulmonary capillary for about 0.75 seconds, but only 0.25 seconds is required for the O2 concentration to equilibrate (equalize) across the alveolocapillary membrane. Therefore, O2 has ample time to diffuse into the blood, even during increased cardiac output, which speeds blood flow and shortens the time the blood remains in the capillary.
Determinants of arterial oxygenation
As O2 diffuses across the alveolocapillary membrane, it dissolves in the plasma, where it exerts pressure (PaO2). As the PaO2 increases, O2 moves from the plasma into the red blood cells (erythrocytes) and binds with hemoglobin molecules. O2 continues to bind with hemoglobin until the hemoglobin-binding sites are filled, or saturated. O2 then continues to diffuse across the alveolocapillary membrane until the PaO2 (oxygen dissolved in plasma) and PAO2 (oxygen in the alveolus) equilibrate, eliminating the pressure gradient across the alveolocapillary membrane. At this point, diffusion ceases (see Fig. 34.13).
The majority (97%) of the O2 that enters the blood is bound to hemoglobin. The remaining 3% stays in the plasma and creates the PaO2. The PaO2 can be measured in the blood by obtaining an arterial blood gas measurement. The oxygen saturation (Sao2) is the percentage of the available hemoglobin that is bound to O2 and can be measured using a device called an oximeter. The total amount of oxygen carried in the blood is the oxygen content and is measured in milliliters per deciliter (1 dL = 100 mL) of blood. It is the combined value of the O2 in oxygen-saturated hemoglobin and the O2 dissolved in the blood.
To calculate the total arterial O2 content, one must know (1) the hemoglobin concentration, or the amount of hemoglobin that is available to bind with oxygen (hemoglobin [Hb] in grams per deciliter); (2) the oxygen saturation, or the percentage of available hemoglobin that is bound to oxygen (SaO2); and (3) the partial pressure of oxygen (PaO2). The maximum amount of oxygen that can be transported by hemoglobin is 1.34 mL/g. The amount of oxygen that can be physically dissolved in blood is 0.003 mL/dL per mm Hg. With the specific values known, the oxygen content of arterial blood can be calculated. To calculate the oxygen content of venous blood, the partial pressure of mixed venous blood (Pvo2) and venous oxygen saturation (Svo2) are substituted for the arterial values in the basic formula. Normal venous oxygen content is 15 to 16 mL/dL.
Because hemoglobin transports all but a small fraction of the O2 carried in arterial blood, changes in the hemoglobin concentration affect the O2 content of the blood. Decreases in the hemoglobin concentration below the normal value of approximately 15 g/dL of blood reduce the O2 content, and increases in the hemoglobin concentration may increase O2 content. An increased hemoglobin concentration is a major compensatory mechanism in pulmonary diseases that impair gas exchange. For this reason, measurement of the hemoglobin concentration is important in assessing individuals with pulmonary disease. If cardiovascular function is normal, the body's initial response to low O2 content is to accelerate cardiac output. In individuals who also have cardiovascular disease, this compensatory mechanism is ineffective. An elevated hemoglobin level can compensate for an inability to accelerate cardiac output, making an increased hemoglobin concentration an even more important compensatory mechanism.
Oxyhemoglobin association and dissociation
When hemoglobin molecules bind with O2, oxyhemoglobin (HbO2) forms. Binding occurs in the lungs and is called oxyhemoglobin association or hemoglobin saturation with oxygen (SaO2). The reverse process, in which O2 is released from hemoglobin, occurs in the body tissues at the cellular level and is called hemoglobin desaturation. When hemoglobin saturation and desaturation are plotted on a graph, the result is a distinctive S-shaped curve known as the oxyhemoglobin dissociation curve (Fig. 34.16). For PaO2 values less than 60 mm Hg, oxygen is readily unloaded to peripheral tissues, and hemoglobin's affinity for oxygen diminishes, reflecting the steep part of the curve. For PaO2 values greater than 60 mm Hg, the curve becomes relatively flat, reflecting the maximum saturation of hemoglobin with oxygen in the lungs.
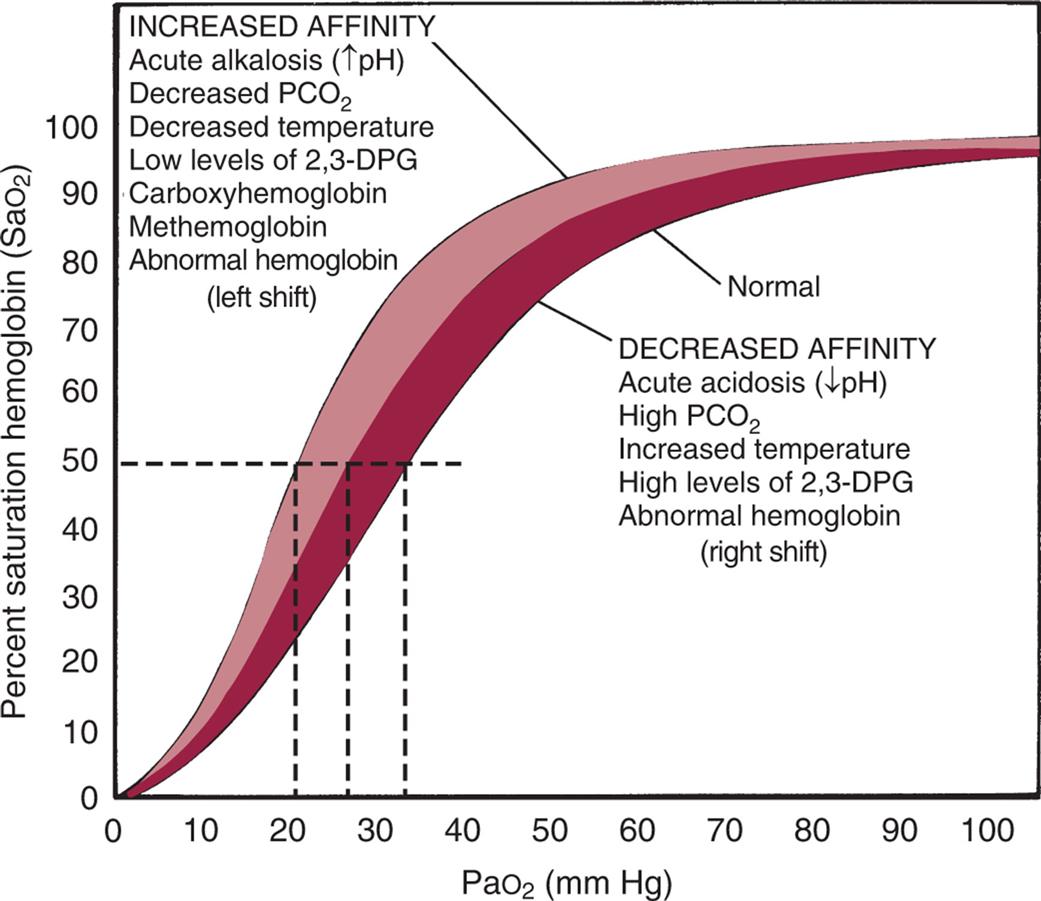
The horizontal or flat segment of the curve at the top of the graph is the arterial or association portion, or that part of the curve where oxygen (O2) is bound to hemoglobin and occurs in the lungs. This portion of the curve is flat because partial pressure changes of O2 between 60 and 100 mm Hg do not significantly alter the percentage saturation of hemoglobin with O2 and allow adequate hemoglobin saturation at a variety of altitudes. If the relationship between the oxygen saturation of hemoglobin in arterial blood (SaO2) and the partial pressure of oxygen in the arterial blood (PaO2) were linear (in a downward sloping straight line) instead of flat between 60 and 100 mm Hg, there would be inadequate saturation of hemoglobin with O2. The steep part of the oxyhemoglobin dissociation curve represents the rapid dissociation of O2 from hemoglobin that occurs in the tissues. During this phase, there is rapid diffusion of O2 from the blood into tissue cells. The P50 is the PaO2 at which hemoglobin is 50% saturated, normally 26.6 mm Hg. A lower than normal P50 represents increased affinity of hemoglobin for O2; a high P50 is seen with decreased affinity. Note that variation from the normal is associated with decreased (low P50) or increased (high P50) availability of O2 to tissues (dashed lines). The shaded area shows the entire oxyhemoglobin dissociation curve under the same circumstances. 2,3-DPG, 2,3-Diphosphoglycerate; PaO2, arterial pressure of oxygen; PCO2, partial pressure of carbon dioxide. (From Lane EE, Walker JF. Clinical arterial blood gas analysis. St. Louis: Mosby; 1987.)
A graph plots the oxyhemoglobin dissociation curve. The vertical axis, representing percent saturation hemoglobin (saturation of hemoglobin in arterial blood), ranges from 0 to 100 in increments of 10. The horizontal axis, representing partial pressure of oxygen (millimeters of mercury), ranges from 0 to 100 in increments of 10. Two thick concave-down curves are plotted on the graph rise from (0, 0), curve at about (50, 70) and (50, 80), and flatline through (100, 90). The lower curve is normal and represents decreased affinity: acute acidosis (decreased p H), high partial pressure of carbon dioxide, increased temperature, high levels of 2, 3-D P G, and abnormal hemoglobin (right shift). The upper curve represents increased affinity: acute alkalosis (decreased p H), decreased partial pressure of carbon dioxide, decreased temperature, low levels of 2, 3-D P G, carboxyhemoglobin, methemoglobin, and abnormal hemoglobin (left shift).
Several factors can change the relationship between the PaO2 and the SaO2, causing the oxyhemoglobin dissociation curve to shift to the right or left (see Fig. 34.16). At a PaO2 of 26.6 mm Hg, hemoglobin is 50% saturated, known as P50. An increase in the P50 value shifts the curve to the right, indicating hemoglobin's decreased affinity for O2 or an increase in the ease with which oxyhemoglobin dissociates and O2 moves into the cells. A larger partial pressure is necessary to maintain 50% oxygen saturation. A shift to the left depicts hemoglobin's increased affinity for O2, which promotes association in the lungs and inhibits dissociation in the tissues. Lower partial pressure is necessary to maintain 50% oxygen saturation.
The oxyhemoglobin dissociation curve is shifted to the right by acidosis (low pH) and hypercapnia (increased PaCO2). In the tissues, the increased levels of CO2 and H+ produced by metabolic activity decrease the affinity of hemoglobin for O2, and O2 is released into the tissues. The curve is shifted to the left by alkalosis (high pH) and hypocapnia (decreased PaCO2). In the lungs, as CO2 diffuses from the blood into the alveoli, the blood CO2 level is reduced, and the affinity of hemoglobin for O2 is increased so that more O2 can be transported from the lungs into the tissues. The shift in the oxyhemoglobin dissociation curve caused by changes in the CO2 and hydrogen ion concentrations in the blood is called the Bohr effect.
The oxyhemoglobin curve is also shifted by changes in body temperature and increased or decreased levels of 2,3-diphosphoglycerate (2,3-DPG), a substance normally present in erythrocytes. Hyperthermia and increased 2,3-DPG levels shift the curve to the right so that more O2 is released into the tissues. Hypothermia and decreased 2,3-DPG levels shift the curve to the left.
Carbon Dioxide Transport
Approximately 200 mL of CO2 is produced by the tissues per minute at rest as a byproduct of cellular metabolism. This CO2 equilibrates with carbonic acid (H2CO3) and must be eliminated continuously to prevent acidosis. The elimination of CO2 by the lungs plays an important role in the regulation of acid-base balance (see Chapter 3).
CO2 is carried in the blood in three ways: (1) dissolved in plasma, (2) transported as bicarbonate, and (3) combined with blood proteins to form carbamino compounds. As CO2 diffuses out of the cells into the blood, it dissolves in the plasma. Approximately 10% of the total CO2 in venous blood and 5% of the CO2 in arterial blood are carried dissolved in the plasma. As CO2 moves into the blood, it diffuses into the red blood cells. Within the red blood cells, CO2, with the help of the enzyme carbonic anhydrase, combines with water to form carbonic acid and then quickly dissociates into H+ and  . As carbonic acid dissociates, the H+ binds to hemoglobin, where it is buffered, and the moves out of the red blood cell into the plasma. Approximately 60% of the CO2 in venous blood and 90% of the CO2 in arterial blood are carried in the form of bicarbonate. The remainder combines with blood proteins, hemoglobin, in particular, to form carbamino compounds.
CO2 is 20 times more soluble than O2 and diffuses quickly from the tissue cells into the blood. The amount of CO2 able to enter the blood is enhanced by the diffusion of O2 out of the blood and into the cells. Reduced hemoglobin (hemoglobin that is dissociated from O2) can carry more CO2 than can hemoglobin saturated with O2. Therefore, the drop in O2 saturation at the tissue level increases the ability of hemoglobin to carry CO2 back to the lung.
The diffusion gradient for CO2 in the lung is only approximately 6 mm Hg (PvCO2 = 46 mm Hg; PACO2 = 40 mm Hg) (see Fig. 34.13). Yet CO2 is so soluble in the alveolocapillary membrane that the CO2 in the blood quickly diffuses into the alveoli, where it is removed from the lung with each expiration. Diffusion of CO2 in the lung is so efficient that diffusion defects that cause hypoxemia (low O2 content of the blood) do not as readily cause hypercapnia (excessive CO2 in the blood).
The diffusion of CO2 out of the blood and into the lungs also is enhanced by O2 binding with hemoglobin. As hemoglobin binds with O2, the amount of CO2 carried by the blood decreases, and it is released into the alveoli. Thus, in the tissue capillaries, O2 dissociation from hemoglobin facilitates the pickup of CO2, and the binding of O2 to hemoglobin in the lungs facilitates the release of CO2 from the blood. This effect of O2 on CO2 transport is called the Haldane effect.
Tests of Pulmonary Function
Several laboratory tests aid in the diagnosis and evaluation of pulmonary system abnormalities. Most of them are easy to perform at hospitals and clinics. They provide valuable information about the possible cause of a respiratory abnormality and evaluate the progression or resolution of disease.20
Pulmonary function testing includes spirometry, which measures the volume and flow of air inhaled and exhaled and is plotted against time (flow rate) during different breathing maneuvers. Several different types of spirometers are available. It is essential that these devices meet current standards and that they are used properly in order to achieve accurate results.21 The procedure produces a spirogram, which is a record of the individual's ventilation in relation to time (Fig. 34.17). Clinically the most important spirometric tests are the forced vital capacity (FVC) and the forced expiratory volume in 1 second (FEV1). (These tests and other important measurements are described in Table 34.3.) Spirometry enables clinicians to detect restrictive or obstructive deficits early in the course of disease. Restrictive lung diseases restrict the lungs' volume; the lungs are unable to expand normally, diminishing the amount of gas that can be inspired and reducing the FVC. Obstructive lung diseases affect gas flow; airflow into and out of the lungs is obstructed, reducing the FEV1 (see Chapter 35).
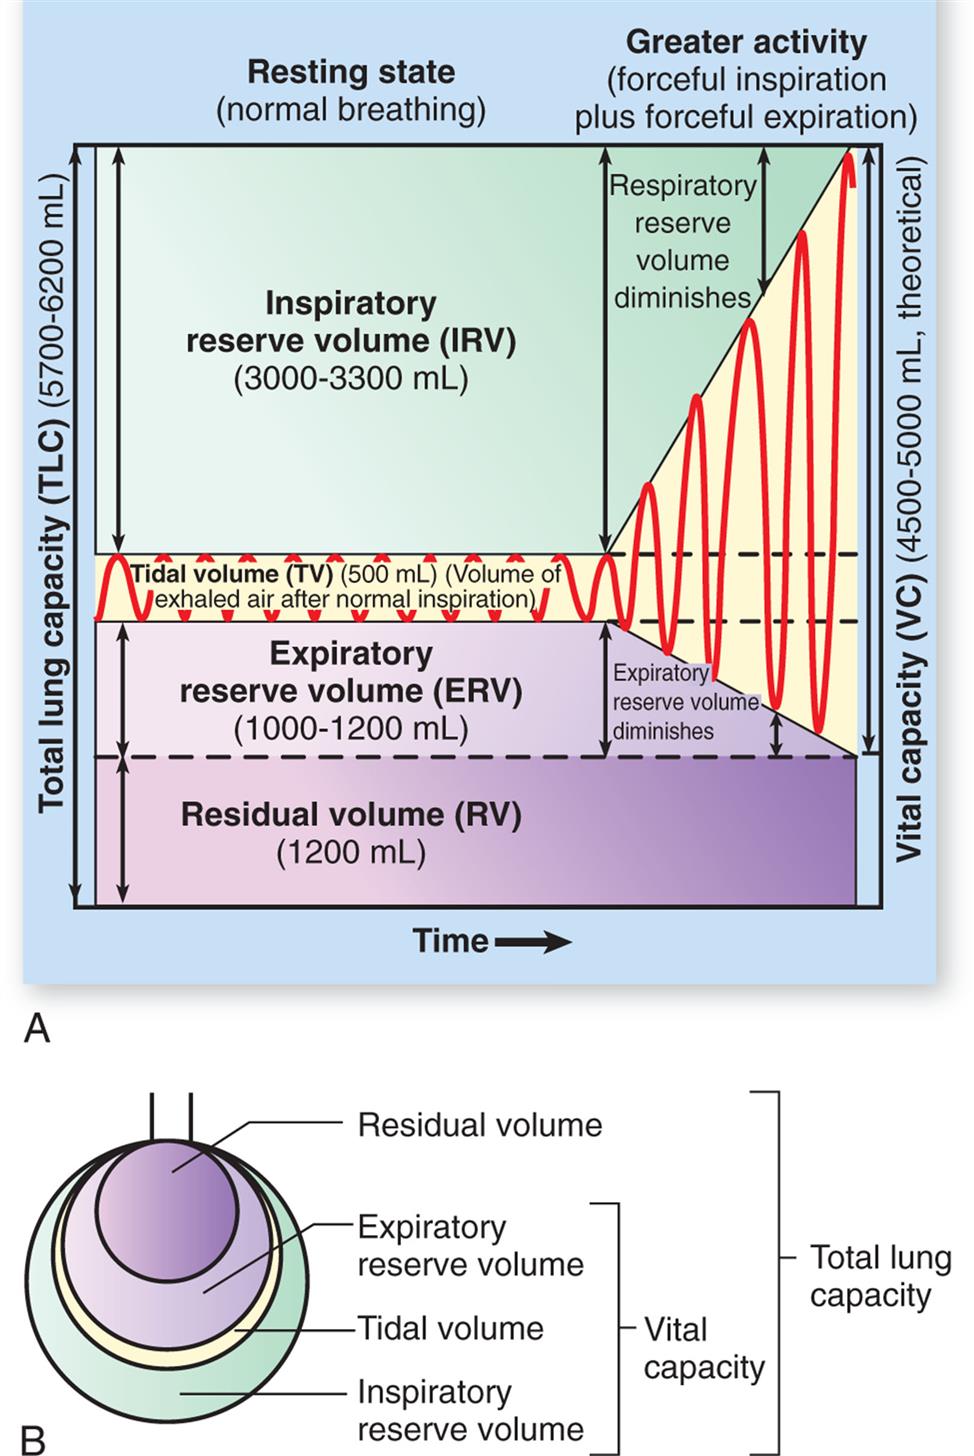
(A) Spirogram. During normal, quiet respiration, the atmosphere and lungs exchange about 500 mL of air (VT). With a forcible inspiration, about 3300 mL more air can be inhaled (IRV). After a normal inspiration and normal expiration, approximately 1000 mL more air can be forcibly expired (ERV). Vital capacity is the amount of air that can be forcibly expired after a maximal inspiration and indicates, therefore, the largest amount of air that can enter and leave the lungs during respiration. Residual volume (RV) is the air that remains trapped in the alveoli. (B) Lung capacities. (From Patton KT, Thibodeau GA. The human body in health & disease, 7th edition. St. Louis: Mosby; 2018.)
Illustration A shows a spirogram indicating changes in lung volume under different conditions of breathing. Illustration B depicts total lung capacity with the labels of vital capacity and total lung capacity. The labels with the volumes in decreasing order are as follows. Residual volume, expiratory reserve volume, inspiratory reserve volume, and tidal volume.
Table 34.3
Lung capacities, such as vital capacity (sum of inspiratory reserve volume, tidal volume, and expiratory reserve volume) and total lung capacity (sum of the vital capacity and the residual capacity), are always the sum of two or more volumes. Norms for volumes and capacities are based on age, sex, and height and are referred to as predicted values. Differences from predicted or changes from baseline values are taken into account in diagnosing and assessing respiratory disorders.
Pulmonary diffusing capacity (transfer factor) is a measure of the rate of gas diffusion across the alveolocapillary membrane. O2, or more commonly carbon monoxide (CO), is used to measure diffusing capacity. CO has a high affinity for hemoglobin and is not limited by pulmonary blood flow and therefore is an excellent measure of diffusion. The measurement is made by determining how much CO is taken up by the blood and dividing this amount by the pressure gradient across the alveolocapillary membrane. Helium (an inert gas poorly soluble in alveolar blood and lung tissue) often is added to the gas mixture to obtain a simultaneous measurement of residual volume (RV), functional residual capacity (FRC), and total lung capacity (TLC). Individuals are asked to perform ventilatory maneuvers similar to those used in spirometry testing. A decreased diffusing capacity can be the result of an abnormal ventilation-perfusion ratio or an actual diffusion defect. For example, diffusing capacity is decreased in individuals with emphysema, where there is a decrease in the surface area of pulmonary capillaries available for gas exchange.
Oximetry is commonly performed for individuals with suggested or diagnosed pulmonary disease. It indirectly measures hemoglobin oxygen saturation and can suggest that the PaO2 is low. However, it is prone to inaccurate measurements, particularly in individuals with poor peripheral circulation, and does not measure the PaCO2 or pH of the blood. Capnography measures the amount of CO2 in expired air and thus estimates PaCO2, but this test is also prone to inaccuracy. Arterial blood gas analysis is the direct measurement of the pH and gas concentrations in arterial blood and provides more accurate and complete information about an individual's gas exchange and acid-base status. Acidosis (low pH), alkalosis (high pH), ventilatory alterations, and decreased PaO2 can be diagnosed accurately only by arterial blood gas analysis. A blood gas report may be divided into an acid-base/ventilation portion and an oxygenation portion. (Normal values for arterial blood gases are given in Table 34.4; acid-base alterations are described in Chapter 3.)
Table 34.4
| Measurement | Arterial Blood | Mixed Venous Blooda | Clinical Notes |
|---|---|---|---|
| Acid-base status (pH) | 7.35–7.45 | 7.33–7.43 | Most important acid-base value; detects acidosis or alkalosis |
| Partial pressure of carbon dioxide (PCO2) | 35–45 mm Hg | 41–57 mm Hg | Measures adequacy of ventilation and respiratory contribution of acid-base abnormality (respiratory acidosis) |
Bicarbonate concentration ( ) ) |
22–26 mEq/L | 24–28 mEq/L | Measures metabolic contribution to acid-base abnormality (metabolic acidosis); calculated from pH and PCO2 |
| Base excess (BE) | −2 to +2 | 0 to +4 | Reflects deviation of bicarbonate concentration from normal |
| Partial pressure of oxygen (PO2) (sea level) | 80–100 mm Hg | 35–40 mm Hg | Indicates driving pressure that causes oxyhemoglobin binding; varies with age and barometric pressure |
| Saturation of hemoglobin with oxygen (SO2) | 96%–98% | 70%–75% | Indicates abnormalities of oxyhemoglobin association and dissociation; may be measured directly or calculated from PCO2, pH, and body temperature |
| Concentration of hemoglobin in the blood | 15 g/dL | 15 g/dL | Detects alterations of gas transport caused by anemia |
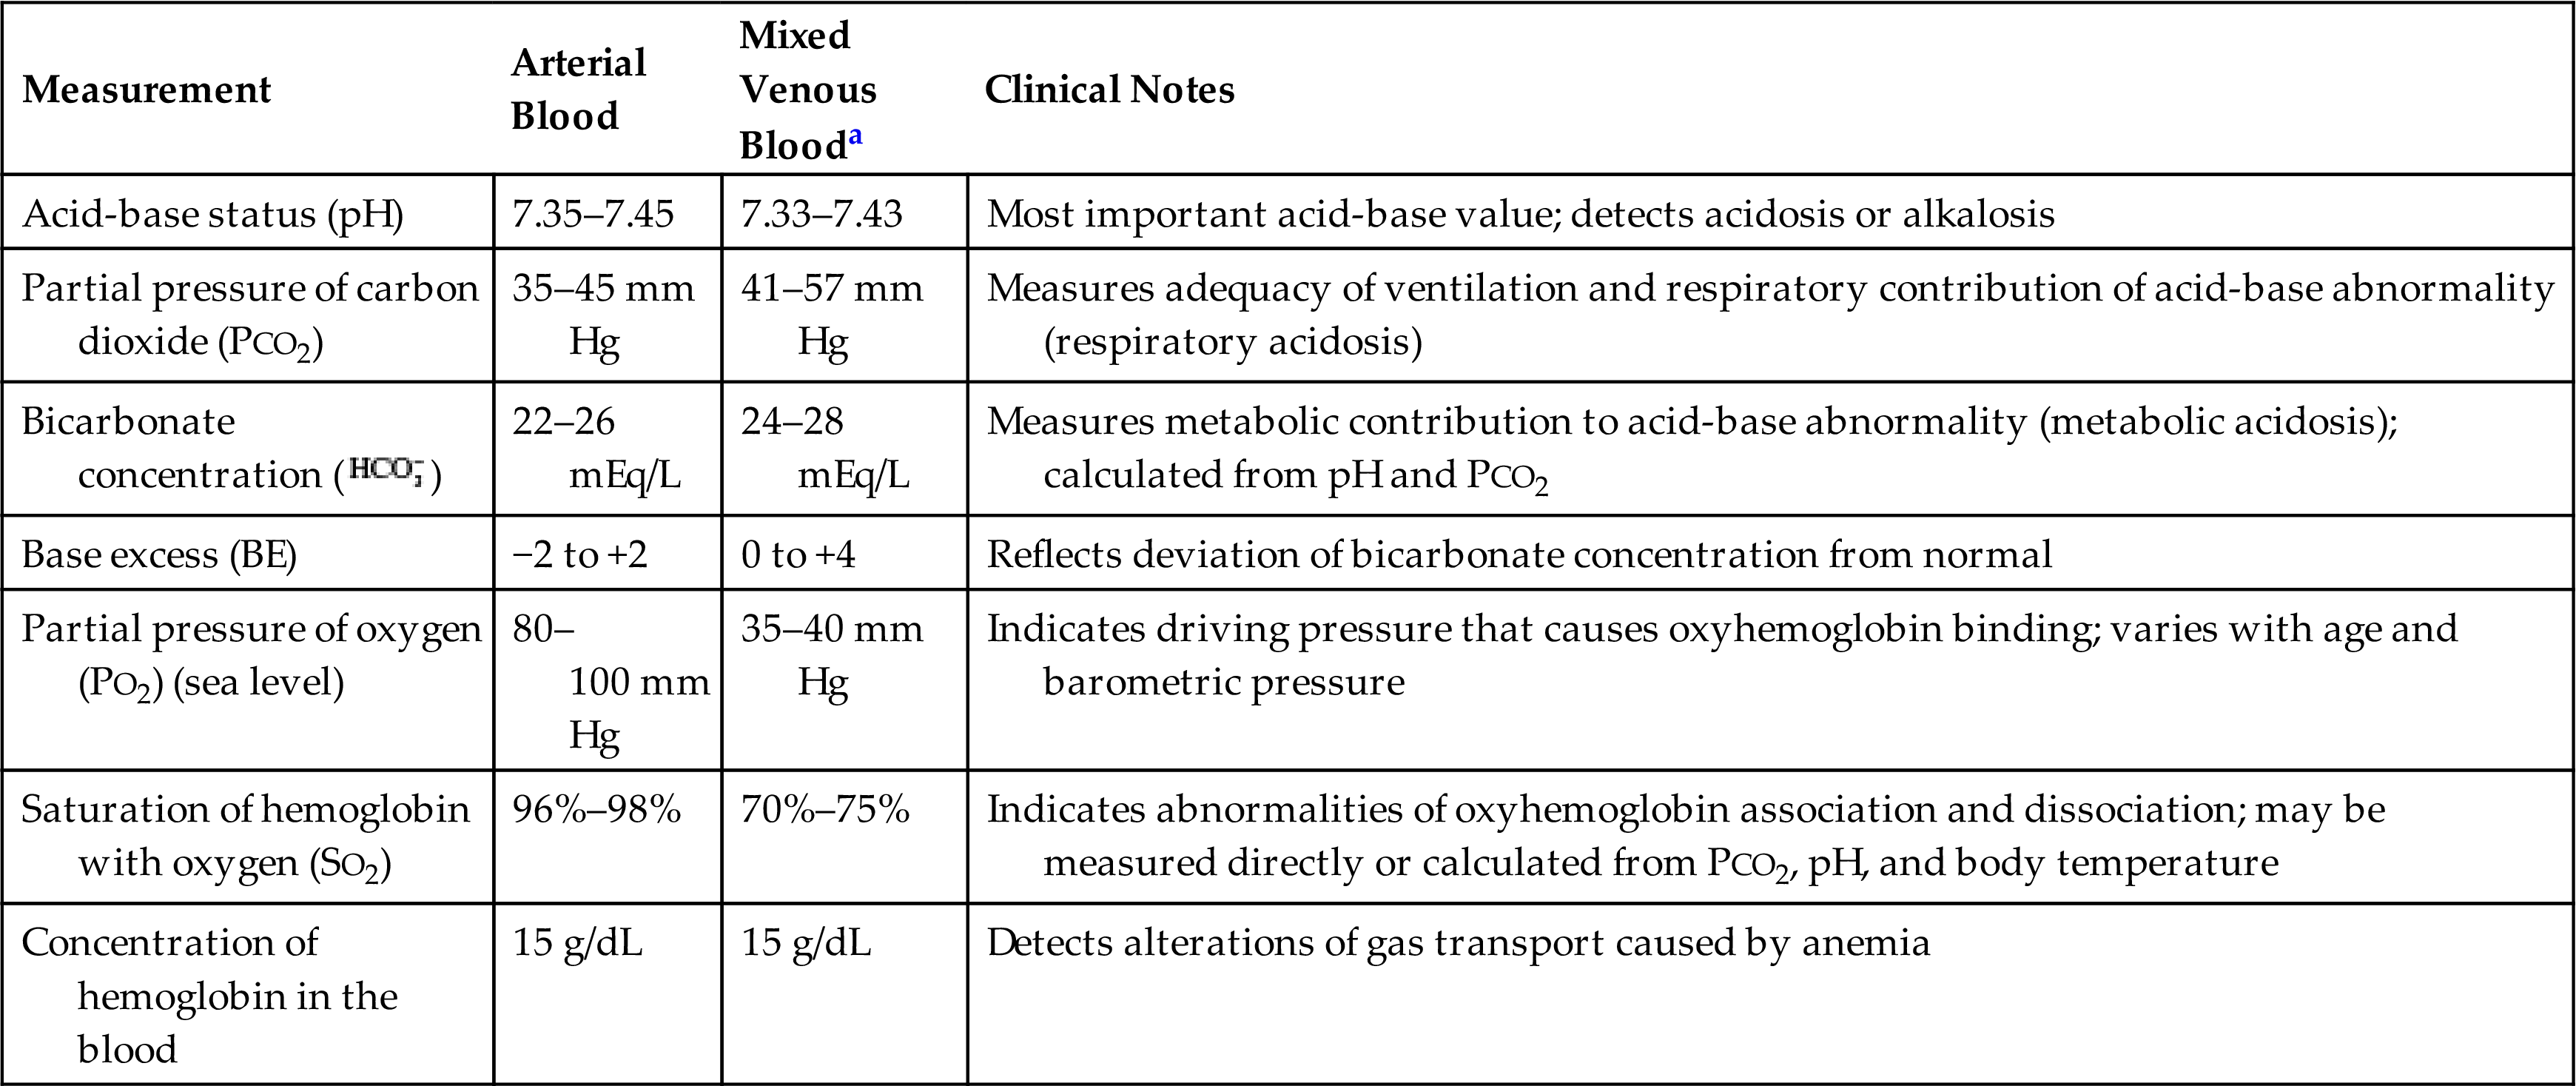
aMixed venous (pulmonary artery) blood is analyzed for critically ill individuals and those undergoing cardiac catheterization (it is not practical to withdraw samples except from a pulmonary artery catheter). Mixed venous blood gas analysis, in conjunction with arterial analysis, provides important information about the adequacy of cardiac output and tissue oxygenation.
Signs and symptoms of most respiratory abnormalities first appear when the system is stressed during exercise. Therefore, if pulmonary disease is suspected, the individual is evaluated at rest and during exercise. Evaluation during exercise usually entails spirometry and oximetry to monitor hemoglobin saturation. The exercise usually consists of riding a stationary bicycle or walking on a treadmill. Exercise testing enables clinicians to detect early changes in respiratory function and thus begin treatment. Exercise tests also are used in planning and evaluating exercise and rehabilitation programs.
Thoracic imaging techniques are among the most common examinations for diagnosis and detection of pulmonary disease and tumors and for evaluation of disease progression. Numerous techniques are available and include chest radiography, computed tomography (CT), magnetic resonance imaging (MRI), positron emission tomography, and ultrasonography. Pulmonary angiography is used for the detection of pulmonary embolism and pulmonary arteriovenous malformations. Techniques may be combined for the best evaluation of pulmonary structure and function.
Geriatric Considerations
Aging and the Pulmonary System
Most knowledge about pulmonary structure and function is based on norms for the middle-age years. Less is known about structure and function in the very young (see Chapter 36) and in older adults, but a few normal physiologic (developmental and degenerative) changes are known to occur from birth to old age. An understanding of these changes is needed to provide appropriate care and to differentiate between age-associated alterations and disease. Normal alterations in the pulmonary system that occur with aging include (1) loss of elastic recoil, (2) stiffening of the chest wall, (3) changes in gas exchange, and (4) increases in flow resistance. These changes, which affect lung volumes, are gradual and usually without adverse consequences in healthy individuals (Fig. 34.18). They are influenced by genetics, sociocultural factors, nutritional status, exercise, decreased immune function, respiratory disease, body size, sex, and race. Exposure to environmental toxins, such as some respiratory tract infections, tobacco smoke, air pollution, and occupational dusts, also contributes to decreased lung function with aging. These changes contribute to increased lung disease morbidity and mortality in older adults, including chronic obstructive lung disease, lung cancer, pulmonary fibrosis, and infection.

In aging, vital capacity decreases, and residual volume increases.
An illustration of the lung depicts the relative changes in lung volume associated with aging and normal lung showing the inspiratory reserve volume, tidal volume, and expiratory reserve volume decreases and residual volume increases in aging lung.
During adulthood and as age advances, the alveoli tend to lose alveoli wall tissue and capillaries. This process increases alveolar size, diminishes the alveolar surface area available for gas diffusion, and decreases airway support provided by normal lung tissues. These changes are similar to those seen in emphysema and diminish the elasticity of the lungs. Chest wall compliance decreases with age because the ribs become ossified (less flexible), and the joints become stiffer. As a result, the chest wall loses some of its ability to expand. In addition, respiratory muscle strength and endurance decrease by up to 20% by age 70. These mechanical changes in the lung and chest wall, along with structural changes in the alveoli, reduce the ventilatory capacity in older adults. Vital capacity decreases and residual volume increases; however, total lung capacity remains unchanged. These changes decrease ventilatory reserves and lead to decreased ventilation-perfusion ratios. With advancing age, there is also increased immune dysregulation, asymptomatic low-grade inflammation (“inflamm-aging”), and increased risk of infection.
Alterations in gas exchange are reflected by blood gas analysis. With advancing age, pH and PaCO2 levels do not change much, even though it has been documented that the chemoreceptors become less sensitive to gas partial pressures with age. Older adults have a decreased compensatory response to hypercapnia and hypoxemia; however, the perception of dyspnea remains intact and is even enhanced. PaO2 declines with age as a result of structural and mechanical changes, such as loss of alveolar surface area, thickening of plural septa, loss of lung elasticity, and increase in ventilation-perfusion mismatch. The maximum PaO2 value in an older adult at sea level can be estimated by multiplying the person's age by 0.3 and subtracting the product from 100. For example, an 80-year-old individual would have an estimated maximum PaO2 of 76 mm Hg (0.3 × 80 = 24; 100 − 24 = 76).
The decrease in PaO2 and the diminished ventilatory reserve in an older adult lead to a decrease in exercise tolerance. Respiratory muscle strength and endurance decrease with age. Furthermore, older adults are at greater risk for respiratory depression caused by medications. Changes in respiratory structure and function can vary considerably from person to person, however. Changes also are affected by activity and fitness earlier in life.
Data from Bowdish DME. The aging lung: Is lung health good health for older adults? Chest. 2019;155(2):391–400; Brandenberger C, Muhfield C. Mechanics of lung aging. Cell Tissue Res. 2017;367:469–480; Hardie JA, et al. Reference values for arterial blood gases in the elderly. Chest. 2004;125:2053–2060; Kim J, Im JS, Choi YH. Objectively measured sedentary behavior and moderate-to-vigorous physical activity on the health-related quality of life in US adults: the National Health and Nutrition Examination Survey 2003–2006. Qual Life Res. 2017;25:1315– 1326.
Summary Review
Structures of the Pulmonary System
- 1. The pulmonary system consists of the lungs, upper and lower airways, chest wall, and pulmonary and bronchial circulation.
- 2. Air is inspired and expired through the conducting airways: nasopharynx, oropharynx, trachea, bronchi, and bronchioles.
- 3. Gas exchange occurs in structures beyond the respiratory bronchioles: in the alveolar ducts and the alveoli. Together these structures compose the acinus.
- 4. The chief gas exchange units of the lungs are the alveoli. The membrane that surrounds each alveolus and contains the pulmonary capillaries is called the alveolocapillary membrane.
- 5. The gas-exchange airways are perfused by the pulmonary circulation, a separate division of the circulatory system. The bronchi and other lung structures are perfused by a branch of the systemic circulation called the bronchial circulation.
- 6. The pulmonary circulation is innervated by the autonomic nervous system (ANS), but vasodilation and vasoconstriction are controlled mainly by local and humoral factors, particularly arterial oxygenation and acid-base status.
- 7. The chest wall, which contains and protects the contents of the thoracic cavity, consists of the skin, ribs, and intercostal muscles, which lie between the ribs.
- 8. The chest wall is lined by a serous membrane called the parietal pleura; the lungs are encased in a separate membrane called the visceral pleura. The pleural space is the area where these two pleurae contact and slide over one another.
Function of the Pulmonary System
- 1. The pulmonary system (1) ventilates the alveoli, (2) diffuses gases into and out of the blood, and (3) perfuses the lungs so that the organs and tissues of the body receive blood that is rich in oxygen and deficient in carbon dioxide.
- 2. Ventilation is the process by which air flows into and out of the gas-exchange airways.
- 3. Most of the time, ventilation is involuntary. It is controlled by the sympathetic and parasympathetic divisions of the autonomic nervous system, which adjust airway caliber (by causing the bronchial smooth muscle to contract or relax) and control the rate and depth of ventilation.
- 4. Neuroreceptors in the lungs (lung receptors) monitor the mechanical aspects of ventilation. Irritant receptors sense the need to expel unwanted substances, stretch receptors sense lung volume (lung expansion), and J-receptors sense pulmonary capillary pressure.
- 5. Chemoreceptors in the circulatory system and brainstem sense the effectiveness of ventilation by monitoring the pH status of cerebrospinal fluid and the oxygen content (PO2) of arterial blood.
- 6. Successful ventilation involves the mechanics of breathing: the interaction of forces and counterforces involving the muscles of inspiration and expiration, alveolar surface tension, elastic properties of the lungs and chest wall, and resistance to airflow.
- 7. The major muscle of inspiration is the diaphragm. When the diaphragm contracts, it moves downward in the thoracic cavity, creating a vacuum that causes air to flow into the lungs.
- 8. The type II alveolar cells produce surfactant, a lipoprotein that lines the alveoli. Surfactant reduces alveolar surface tension and permits the alveoli to expand as air enters.
- 9. Elastic recoil is the tendency of the lungs and chest wall to return to their resting state after inspiration. The elastic recoil forces of the lungs and chest wall are in opposition and pull on each other, creating the normally negative pressure of the pleural space.
- 10. Compliance is the ease with which the lungs and chest wall expand during inspiration. Lung compliance is ensured by an adequate production of surfactant, whereas chest wall expansion depends on elasticity.
- 11. The work of breathing is determined by the muscular effort required for ventilation and is normally very low. Work increases when lung or chest wall compliance decreases or airways are obstructed.
- 12. Gas transport depends on ventilation of the lungs, diffusion of oxygen across the alveolocapillary membrane, perfusion of systemic capillaries with oxygenated blood, and diffusion between systemic capillaries and tissue cells.
- 13. Efficient gas exchange depends on an even distribution of ventilation (gas) and perfusion (blood) within the lungs. Both ventilation and perfusion are greatest in the bases of the lungs because the alveoli in the bases are more compliant (their resting volume is low), and perfusion is greater in the bases as a result of gravity.
- 14. Almost all the oxygen that diffuses into pulmonary capillary blood is transported by hemoglobin, a protein contained within red blood cells. The remainder of the oxygen is transported dissolved in plasma.
- 15. Oxygen enters the body by diffusing down the concentration gradient, from high concentrations in the alveoli to lower concentrations in the capillaries. Diffusion ceases when alveolar and capillary oxygen pressures equilibrate.
- 16. Oxygen is loaded onto hemoglobin by the driving pressure exerted by Pao2 in the plasma. As pressure decreases at the tissue level, oxygen dissociates from hemoglobin and enters tissue cells by diffusion, again down the concentration gradient.
- 17. Compared with oxygen, carbon dioxide is more soluble in plasma. Therefore carbon dioxide diffuses readily from tissue cells into plasma and from plasma into the alveoli. Carbon dioxide returns to the lungs dissolved in plasma, as bicarbonate, or in carbamino compounds (e.g., bound to hemoglobin).
Tests of Pulmonary Function
- 1. Spirometry measures the volume and flow rate of air during forced expiration.
- 2. The alveolar-arterial oxygen gradient is used to evaluate the cause of hypoxia.
- 3. Diffusing capacity is a measure of the gas diffusion rate at the alveolocapillary membrane.
- 4. Arterial blood gas analysis can be used to determine pH, oxygen, and CO2 concentrations.
- 5. Thoracic imaging techniques are used to detect pulmonary disease and tumors and to evaluate disease progression.
Aging and the Pulmonary System
- 1. Aging affects the mechanical aspects of ventilation by decreasing chest wall compliance and elastic recoil of the lungs. Changes in these elastic properties reduce ventilatory reserve.
- 2. Aging causes loss of alveolar wall tissue and alveolar enlargement, thus diminishing the surface area available for gas diffusion.
- 3. Aging can cause the PaO2 level to decrease but does not affect the PaCO2 level.
- 4. Vital capacity decreases, and residual volume increases with age; however, total lung capacity remains unchanged.