185: Colloid osmotic pressure and osmolality
Lori S. Waddell, DVM, DACVECC
Key points
- • Colloid osmotic pressure (COP) is determined by the osmotic pressure exerted by colloids and their associated cations across a semipermeable membrane.
- • Estimation of COP via equations using the patient’s albumin and globulin concentrations is unreliable, particularly in critically ill patients that may have altered albumin/globulin ratios.
- • Direct measurement via a colloid osmometer is the only way to accurately monitor COP.
- • A whole blood COP of 15 mm Hg or higher in both dogs and cats reduces the risk of edema formation and associated secondary organ dysfunction.
- • Plasma osmolality can be estimated using an equation or measured directly via a freezing point depression osmometer; the latter is the gold standard.
- • Diagnosis of an osmolal gap (measured plasma osmolality − estimated plasma osmolality) of more than 10 mOsm/kg indicates the presence of an unmeasured osmole(s), such as ethanol or ethylene glycol and its metabolites, and may be clinically useful in diagnosing these toxicities.
Colloid osmotic pressure (COP) is the physiochemical phenomenon that occurs when two solutions with different colloid concentrations are separated by a semipermeable membrane. Oncotic pressure is defined as the osmotic pressure exerted by colloids in solution, so the terms colloid osmotic pressure and oncotic pressure can be used interchangeably.
The particles contributing to COP (and the particles they may hold with them because of their electrical charge) do not pass readily through the semipermeable membrane. This is in contrast to small crystalloid particles (less than 10,000 Daltons) such as electrolytes, glucose, and other metabolites, which pass readily through the membrane. COP is determined using a patient’s blood sample and is referenced to normal saline rather than pure water because normal saline is more representative of the fluid in the interstitial space. COP should be thought of as the osmotic pressure exerted by plasma proteins and their associated electrolytes because the electrolytes contribute significantly to the COP. Albumin and its associated cations provide approximately 60% to 70% of the plasma oncotic pressure and globulins provide the remaining 30% to 40%.
Osmolality is the concentration of osmotically active particles (solute) per kilogram of solution. The size and charge of the particles do not matter when determining the osmolality; only the number of particles in solution is relevant.
Colloid osmotic pressure
Starling’s hypothesis
Starling’s hypothesis states that fluid flux at the capillary level is controlled by a balance between hydrostatic pressure and osmotic pressure gradients between the capillaries and interstitial space.
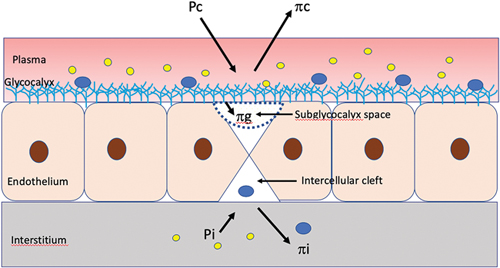
where Jv = the net rate of capillary filtration; kfc = the capillary filtration coefficient; Pc = capillary hydrostatic pressure; Pi = interstitial hydrostatic pressure; σ = the osmotic reflection coefficient; πp = plasma oncotic pressure; and πi = interstitial oncotic pressure.
In this traditional model, plasma COP helps to maintain a normal fluid balance between the intravascular space and the interstitial space. If the COP in the capillaries drops lower than the COP in the interstitium, fluid will move out of the vessels and edema formation will be favored. Interstitial forces were considered negligible, and fluid filtration occurred in the first part of the capillaries with fluid resorption in the second half. However, the classic Starling–Landis principle has been challenged as researchers gain a better understanding of the endothelium and fluid movement. In the revised Starling model, intravascular volume comprises circulating red blood cell volume, plasma volume, and glycocalyx volume instead of only the plasma and cellular elements. Ultrafiltrate is produced due to filtration across the glycocalyx without venous reabsorption at the venous end; instead the lymphatic system is the major route for return of fluid from the interstitial space back into the intravascular space.
The revised Starling equation:
Jv = kfc ([Pc− Pi] − σ [πp – πg])
in which πg (oncotic pressure of the subglycocalyx) has replaced πi.
The revised Starling model recognizes the essential role of the endothelial glycocalyx plays in fluid movement. In particular, the COP of the subglycocalyx space impacts fluid movement across capillary endothelial membranes (see Chapter 9, Endothelial Glycocalyx). The colloid osmotic pressure of the fluid in the subglycocalyx space can be substantially lower than that of the free interstitial fluid because of the combined effects of protein sieving by the endothelial glycocalyx and the convective flow of filtered fluid through the endothelial clefts. This space below the glycocalyx limits fluid reabsorption by the microvasculature (Fig. 185.1).1
Of all the variables included in the Starling hypothesis, only the COP of plasma and the capillary hydrostatic pressure can be manipulated clinically. Increasing capillary hydrostatic pressure by administering intravenous fluids tends to increase edema formation. By measuring a patient’s COP and using colloid fluid therapy to help maintain a normal COP, one can reduce transvascular fluid efflux and the clinical problems associated with it, including interstitial edema, organ dysfunction, and cavitary effusions (see Chapter 11, Interstitial Edema).
Calculated versus measured values
Equations have been developed to try to predict COP. In humans, the Landis–Pappenheimer equation is often used:
where P = plasma protein.
This equation is unreliable in other species, including cats, dogs, cattle, and horses, because they have different albumin/globulin ratios. Species-specific equations have been derived2 but are not reliable in critically ill patients that often have altered protein concentrations (specifically the albumin/globulin ratio may be altered.)3
Although total solids certainly give an indication of hypoproteinemia and therefore a low COP, refractometry cannot accurately predict COP. Furthermore, if artificial colloids have been administered, the measurement of total solids via refractometry will be inaccurate. The artificial starches available in the United States have a refractometry reading of 4 to 4.2 mg/dl, so the patient’s total solids level will appear to approach this range, even if it is actually lower. The only way to predict COP accurately, particularly in critically ill patients and those receiving artificial colloids, is direct measurement via a colloid osmometer. Few hospitals currently have the technology to measure COP; therefore, clinical judgement is more commonly used to guide therapeutic decisions.
Normal colloid osmotic pressure values
Normal values for COP are species-, sample-, and laboratory-specific. Published normal plasma values are 23 to 25 mm Hg for cats and 21 to 25 mm Hg for dogs.4 For whole blood, normal values are 24.7 ± 3.7 mm Hg for cats and 19.95 ± 2.1 for dogs.5 A study in 2011 showed a significant difference between COP measured on whole blood and that measured on plasma in healthy dogs.6 The COP was slightly higher in whole blood (mean magnitude of 0.5 mm Hg) due to the presence of red blood cells, which make a minor contribution to the COP. However, the individual values obtained were all within the expected reference intervals, so either sample may be used clinically. It is recommended that clinicians use the same sample type for comparison in an individual patient.6 When whole blood is used for COP measurement, samples should be collected with lyophilized heparin, which is commonly available in green-top tubes. Slight variability does occur from one laboratory to another, so normal values should be established for each machine.
Samples of plasma or serum that cannot be processed immediately may be frozen and later thawed for determination of COP with little effect on the accuracy of the values obtained. This practice was evaluated in the study mentioned earlier, which showed COP changes in frozen samples stored up to 7 days that were minor and would not affect clinical decision making.6 Whole blood samples can also be refrigerated and processed within 24 hours without any significant effect on the COP. Care should be taken to prevent hemolysis of the sample because free hemoglobin can increase COP. Dilution of the COP due to anticoagulants in the collection tube or syringe can occur; thus, lyophilized heparin is preferred (as mentioned for whole blood above). It is provided in a dry form, has a high molecular weight, and is used in a very low concentration so it will have a minimal effect on COP measurements.
Colloid osmotic pressure in critically ill patients
COP has been measured in whole blood in 124 critically ill cats and dogs. Mean values obtained were 13.9 ± 3.1 mm Hg (range, 7.6 to 23.8).7 The normal values for this laboratory were as listed earlier for whole blood. Critically ill cats and dogs can have substantial decreases in their COP values and may benefit from COP monitoring and therapy aimed at correcting a low COP.
How colloid osmotic pressure is measured
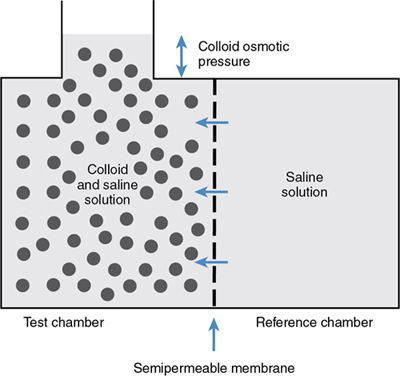
The colloid osmometer determines the COP of a solution using a semipermeable membrane. The membrane has a uniform pore size that allows only molecules with a molecular weight of 30,000 Da or less to pass through, simulating the capillary endothelium in veterinary patients. This membrane separates two chambers, a reference chamber filled with 0.9% saline and a test chamber into which the patient sample is injected. The sample tested can be serum, plasma, or whole blood (normal ranges vary slightly depending on which is used, as described earlier).
The membrane is relatively impermeable to the proteins because of their large size. Water migrates from the reference chamber into the test chamber as a result of differences in the colloid concentration and COP (Fig. 185.2). The COP as determined by the membrane depends not only on the colloid concentration but also on the Gibbs–Donnan effect, which takes into account the negative charge of the proteins. Electroneutrality must be maintained on each side of the membrane. The negative charge of the proteins causes retention of positively charged ions, primarily Na+, which increases the concentration of these normally diffusible ions in the test chamber.
Because osmotic pressure is proportional to the number of molecules present, not the size of the molecules, the cations contribute significantly to the COP. The actual contribution of these ions to the COP can be determined by the square of the electrical charge carried by the colloid component. Because the total measured COP is determined by both the colloid and the associated positive ions, the COP is related nonlinearly to the colloid concentration. The charge of the proteins in a sample depends on the pH of the sample and the electrophoretic pattern of the proteins. These may be very abnormal in critically ill patients, which makes direct measurement of the COP all the more essential.
After equilibrium has been established between the two chambers (within 30 to 90 seconds), a negative pressure gradient exists in the reference chamber. A sensing diaphragm next to the fluid in the reference chamber is attached to a pressure transducer. Minute pressure changes in the reference chamber are converted into alterations in electrical impedance, which is measured, amplified, and then converted into a display on the osmometer that is reported in mm Hg.
Indications for colloid osmotic pressure measurement
COP measurement should be considered in any patient receiving artificial colloids, in patients with edema, and in patients that are treated with aggressive crystalloid therapy or have low serum albumin concentration. Critically ill patients may have hypoalbuminemia and a decreased COP due to dilution from crystalloid therapy, decreased albumin production caused by anorexia, liver insufficiency and/or a shift to production of acute-phase proteins, and increased loss via blood loss, into effusions, via the kidneys or gastrointestinal tract, or into the interstitium associated with increased vascular permeability. Monitoring COP may help prevent edema formation in these patients by directing therapy toward correcting a low COP. Fortunately, COP measurement requires a very small sample of blood or serum (less than 0.5 ml). COP can change rapidly in patients receiving large amounts of crystalloid or colloid fluid therapy; therefore, daily measurement may be indicated. In a study, healthy isoflurane-anesthetized dogs received lactated Ringer’s solution at a rate of 0, 10, 20, or 30 ml/kg/hr for 1 hour. In those given the solution at rates of 20 or 30 ml/kg/hr, significant decreases in COP were measured at 30 and 60 minutes compared with baseline.8 Whether this information translates into predictable clinical sequelae is not well studied and most likely depends on the health of the endothelial glocalyx and other Starling’s forces.
Edema of organs such as the heart (which causes increased ventricular stiffness and decreased end-diastolic volume, stroke volume, and cardiac output) and of the lungs (which causes interstitial edema and increased work of breathing) can lead to multiple organ dysfunction long before clinically appreciable peripheral edema is present. By correcting low COP in critically ill patients, some of these secondary problems that contribute to patient morbidity and mortality may be prevented.
A low COP in a critically ill patient can be managed with the administration of albumin solutions (human or canine), plasma, or potentially artificial colloids. In human patients, a lower COP has been associated with decreased survival.9 However, in a more recent study, COP was not significantly different between survivors and nonsurvivors in patients with critical illness of at least 7 days’ duration. Colloids were used at the physicians’ discretion, and the mean COP in all patients was 16.1 mm Hg,10 a value above the cutoff that had previously been associated with increased mortality. Artificial colloids are no longer recommended in human patients due to the risk for kidney injury, but albumin solutions are commonly used to increase COP. Research in small animals is ongoing and inconclusive thus far (see Chapter 66, Colloid Solutions).
Osmolality
Definition
Osmolality is the number of particles of solute per kilogram of solvent, and osmolarity is the number of particles of solute per liter of solvent. Both are purely dependent on the number of particles in solution; the particle size, shape, density, or electrical charge has no relevance. In body fluids, they are almost exactly equal because the solvent is primarily water, and 1 kg of water is equal to 1 L of water. Normal values for osmolality are 290 to 310 mOsm/kg in dogs and 290 to 330 mOsm/kg in cats.11
Determination of osmolality
Plasma osmolality can be estimated by using the following equation:
where BUN = blood urea nitrogen and Na+ = sodium concentration.12-14
The sodium concentration is multiplied by a factor of 2 to include the chloride and bicarbonate ions that are present to maintain electroneutrality. Concentrations of urea and glucose are measured in milligrams per deciliter and must be converted to millimoles per liter by the conversion factor of 2.8 for BUN and 18 for glucose. Common causes of increased calculated plasma osmolality include hypernatremia, hyperglycemia secondary to diabetes mellitus, and azotemia (Box 185.1; see later section on effective osmolality). The most common cause of decreased calculated plasma osmolality is hyponatremia (see Chapter 55, Sodium Disorders).
Serum osmolality can be determined indirectly by using a freezing point depression osmometer or determining the vapor point depression of the solution.11,13 Freezing point depression is the more common and accurate method because it measures volatile substances in solution (e.g., alcohol) that would be missed using the calculated method.12 For every 1 mol of nondissociating molecules dissolved in 1 kg (or 1 L) of water, the freezing point depression is decreased by 1.86°C. The osmolality of this solution would be 1 Osm/kg or 1000 mOsm/kg.11
Canine serum samples can be frozen and stored for up to 7 days without affecting the accuracy of the measurement.15
Osmolal gap
The difference between the measured and calculated serum osmolality is referred to as the osmolal gap. Recent evidence has shown a nearly zero osmolal gap in dogs and cats (−5 to 2 with a median of −2 in dogs and −3 to 6 with a median of 2 in cats).13,14 A measured value that is more than 10 mOsm/kg higher than the calculated plasma value11 indicates that an unmeasured solute is present in a large amount in the plasma. This could be any solute that is not accounted for in the equation and can include lactic acid, sulfates, phosphates, acetylsalicylic acid, mannitol, ethylene glycol and its metabolites, ethanol, isopropyl alcohol, methanol, radiographic contrast solution, paraldehyde, sorbitol, glycerol, propylene glycol, or acetone (see Box 185.1).11,16
It has been reported that commercially available activated charcoal suspensions that contain propylene glycol or glycerol can cause increased serum osmolality in healthy dogs.17 This may result in difficulty in interpreting serum osmolality when evaluating for some toxins (e.g., ethylene glycol) if activated charcoal is administered before blood samples are obtained for measurement of serum osmolality. An increased osmolal gap can also occur with pseudohyponatremia secondary to hyperlipidemia, marked hyperglycemia, or hyperproteinemia.11,18 Newer methods of measuring plasma electrolytes with ion-selective electrodes have helped to circumvent this problem.
Effective osmolality
Because some molecules such as urea are freely diffusible across cell membranes, changes in their concentrations do not cause fluid shifts between the intracellular and extracellular compartments. Other molecules—most importantly sodium, but also glucose, chloride, and others—do not readily cross cell membranes and therefore cause water movement. Effective osmolality, also known as tonicity, can be estimated as follows:
This is the same as the previous equation for calculated plasma osmolality without BUN, which is an ineffective osmole. Tonicity is an important concept when comparing solutions. A solution is hypertonic if it contains a higher concentration of impermeant solutes than a reference solution and hypotonic if it contains a lower concentration of impermeant solutes. Solutions are isotonic if they have equal numbers of impermeant solutes.
Effective osmolality is especially relevant when evaluating azotemic patients. With a very elevated BUN level, the calculated osmolality will be increased, but the effective osmolality or tonicity may be normal or even decreased. The calculated osmolality should be used to evaluate these patients and assess risk following abrupt changes; direct measurement of osmolality using the freezing point depression method cannot distinguish between effective and ineffective osmoles.11
Evaluation of osmolality, both calculated and measured, can be important for recognition and treatment of several clinical conditions, including sodium disorders, hyperglycemia, and certain toxicities (see Box 185.1). Therapy should be aimed at preventing rapid changes in osmolality because adverse reactions, especially neurologic, may result if the serum osmolality is changed abruptly.
Urine osmolality
Urine osmolality is the number of molecules (unaffected by the size of the molecules) per kilogram of water and must be measured by an osmometer. It is used to assess the concentrating ability of the kidney and should be interpreted along with the hydration and volume status of the patient. Normal values for dogs have been reported to be 369–2416 mOsm/kg in young and adult dogs and 366-2178 mOsm/kg in dogs 7 years and older.19 Healthy cats can reach a maximal urine osmolality of greater than 3000 mOsm/kg. Canine urine samples can be frozen and stored up to 7 days before measuring osmolality with no significant effect on accuracy.15 Urine specific gravity (USG) is more commonly used to assess renal concentrating ability because it is easier to measure using a handheld refractometer. Specific gravity is a ratio of the density of a substance compared to water, so it is affected by the number of molecules and their molecular weights. Normally, the urine osmolality and USG are linearly correlated. If many high-molecular-weight molecules are present in the urine, USG will overestimate the urine solute concentration, whereas the urine osmolality remains accurate. A study evaluating the association between urine osmolality and specific gravity in dogs found that proteinuria, glucosuria, bilirubinuria, and hemoglobinuria did not significantly affect the relationship between USG and osmolality, and ketonuria had a small negative association between them.20 Some of the molecules that can interfere with USG include albumin, synthetic colloids, and iohexal.21 Interpretation of urine osmolality requires knowledge of the hydration and intravascular volume status of the patient. This allows for differentiation of an appropriate versus an abnormal physiologic response of the kidneys. The urine osmolality is useful for differentiating sodium disorders, identifying the syndrome of inappropriate antidiuretic hormone (see Chapter 62, Urine Osmolality and Electrolytes), differentiating prerenal from renal causes of azotemia, and diagnosing diabetes insipidus.
References
1. Levick JR & Michel CC. Microvascular fluid exchange and the revised Starling principle Cardiovasc Res 2010;87: 198.
2. Brown SA, Dusza K & Boehmer J. Comparison of measured and calculated values for colloid osmotic pressure in hospitalized animals Am J Vet Res 1994;55: 910.
3. Thomas LA & Brown SA. Relationship between colloid osmotic pressure and plasma protein concentration in cattle, horses, dogs, and cats Am J Vet Res 1992;53: 2241.
4. Rudloff E & Kirby R. Colloid osmometry Clin Tech Small Anim Pract 2000;15: 119.
5. Culp AM, Clay ME, Baylor IA, et al: Colloid osmotic pressure (COP) and total solid (TS) measurement in normal dogs and cats, Proceedings of the IVECCS September 7-11, 1994; San Antonio [Abstract].
6. Odunayo A & Kerl ME. Comparison of whole blood and plasma colloid osmotic pressure in healthy dogs J Vet Emerg Crit Care 2011;21: 236-241.
7. King LG, Culp AM, Clay ME, et al: Measurement of colloid osmotic pressure (COP) in a small animal intensive care unit, Proceedings of the IVECCS September 7-11, 1994; San Antonio [Abstract].
8. Muir WW, Kijtawornrat A, Ueyama Y, et al: Effects of intravenous administration of lactated Ringer’s solution on hematologic, serum biochemical, rheological, hemodynamic, and renal measurements in healthy isoflurane-anesthetized dogs J Am Vet Med Assoc 2011;239: 630.
9. Weil MH, Henning RJ & Puri VK. Colloid oncotic pressure: clinical significance Crit Care Med 1979;7: 113.
10. Blunt MC, Nicholson JP & Park GR. Serum albumin and colloid osmotic pressure in survivors and nonsurvivors of prolonged critical illness Anaesthesia 1998;53: 755.
11. DiBartola SP. Disorders of sodium and water: hypernatremia and hyponatremia DiBartola & SP. Fluid, electrolyte and acid-base disorders in small animal practice ed 4 2012; Saunders St. Louis 45-79.
12. Barr JW & Pesillo-Crosby SA. Use of the advanced micro-osmometer model 3300 for determination of a normal osmolality and evaluation of different formulas for calculated osmolarity and osmole gap in adult dogs J Vet Emerg Crit Care 2008;18: 270.
13. Dugger DT, Mellema MS, Hopper K.et al: Estimated osmolality of canine serum: a comparison of the clinical utility of several published formulae, J Vet Emerg Crit Care (in press).
14. Dugger DT, Epstein SE, Hopper K, et al: Comparative accuracy of several published formulae for the estimation of serum osmolality in cats J Small Anim Pract 2013;54: 184.
15. Reinhart JM, Whate BJ, Pohlman LM & Schermerhorn T. Stability of osmolality in previously frozen canine serum and urine samples Vet Clin Path 2016;45: 665.
16. Feldman BF & Rosenberg DP. Clinical use of anion gap and osmolal gap in veterinary medicine J Am Vet Med Assoc 1981;178: 396.
17. Burkitt JM, Haskins SC, Aldrich J, et al: Effects of oral administration of a commercial activated charcoal suspension on serum osmolality and lactate concentration in the dog J Vet Intern Med 2005;19: 683.
18. Wellman ML, DiBartola SP & Kohn CW. Applied physiology of body fluids in dogs and cats DiBartola & SP. Fluid, electrolyte and acid-base disorders in small animal practice? ed 4 2012; Saunders St. Louis 2-25.
19. Guerrero S, Pastor J, Tvarijonaviciute A, et al: Analytical validation and reference intervals for freezing point depression osmometer measurements of urine osmolality in dogs Vet Diagn Invest. 2017;29: 791.
20. Ayoub JA, Beaufrere H & Acierno MJ. Association between urine osmolality and specific gravity in dogs and the effect of commonly measured urine solutes on that association Am J Vet Res 2013;74: 1542.
21. Smart L, Hopper K, Aldrich J, et al: The effect of hetastarch (670/0.75) on urine specific gravity and osmolality in the dog J Vet Intern Med 2009;23: 388.