9: Introduction to the 12-lead ECG
Learning objectives
After reading this chapter, you should be able to:
- 1. Give examples of indications for using a 12-lead electrocardiogram (ECG).
- 2. Explain the term electrical axis and its significance.
- 3. Discuss the determination of electrical axis using leads I and aVF.
- 4. Recognize the changes on the ECG that may reflect evidence of myocardial ischemia, injury, or infarction.
- 5. Describe the appearance of right and left bundle branch block as seen in lead V1.
- 6. Discuss the ECG changes characteristic of right atrial, left atrial, right ventricular, and left ventricular enlargement.
- 7. Identify the ECG changes characteristically produced by hyperkalemia, hypokalemia, hypercalcemia, and hypocalcemia.
- 8. Describe a systematic method for analyzing a 12-lead ECG.
Key terms
bundle branch block (BBB): A disruption in impulse conduction from the bundle of His through the right or left bundle branch to the Purkinje fibers; a BBB may be intermittent or permanent.
electrical axis: Net direction, or angle in degrees, where the main vector of depolarization is pointed.
vector: Quantity having direction and magnitude, usually depicted by a straight arrow whose length represents magnitude and whose head represents direction.
Introduction
A standard 12-lead electrocardiogram (ECG) provides views of the heart in both the frontal and horizontal planes and views the surfaces of the left ventricle from 12 different angles. Multiple views of the heart can provide helpful information including the following:
Indications for obtaining a 12-lead ECG are shown in Box 9.1.
Layout of the 12-lead electrocardiogram
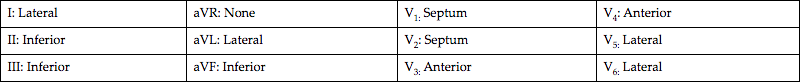
Most 12-lead ECGs are displayed in a conventional three-row by four-column format. The standard limb leads are recorded in the first column, the augmented limb leads in the second column, and the chest leads in the third and fourth columns (Table 9.1).
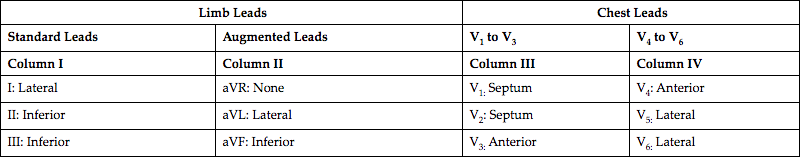
| Limb Leads | Chest Leads | ||
| Standard Leads | Augmented Leads | V1 to V3 | V4 to V6 |
| Column I | Column II | Column III | Column IV |
| I: Lateral | aVR: None | V1: Septum | V4: Anterior |
| II: Inferior | aVL: Lateral | V2: Septum | V5: Lateral |
| III: Inferior | aVF: Inferior | V3: Anterior | V6: Lateral |
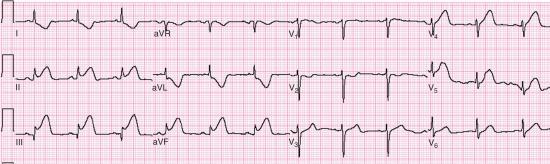
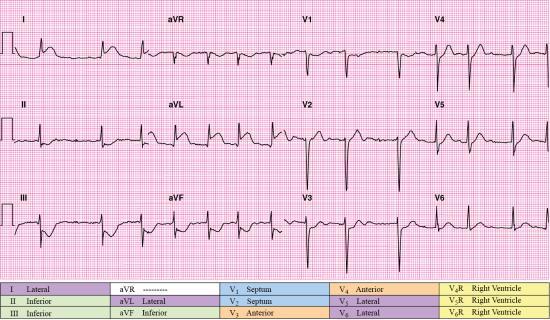
The 12-lead ECG provides a 2.5-second view of each lead because it is assumed that 2.5 seconds is long enough to capture at least one representative complex. Although most 12-lead ECG machines obtain the signals for all leads at the same time, other machines obtain the signals sequentially (i.e., all limb leads, then the augmented limb leads followed by leads V1 through V3, and finally leads V4 through V6). The 12-lead computer’s interpretive program provides measurements of intervals and duration in milliseconds (msec). An example of a 12-lead ECG is shown in Fig. 9.1.

Vectors
Leads have a negative (−) and positive (+) electrode pole that senses the magnitude and direction of the electrical force caused by the spread of waves of depolarization and repolarization throughout the myocardium. A vector (arrow) is a symbol representing this force. A vector points in the direction of depolarization. Leads that face the tip or point of a vector record a positive deflection on ECG paper. A mean vector identifies the average of depolarization waves in one portion of the heart. The mean P vector represents the average magnitude and direction of both right and left atrial depolarization. The mean QRS vector represents the average magnitude and direction of both right and left ventricular depolarization. The average direction of a mean vector is called the mean axis and is only identified in the frontal plane.
Axis
An imaginary line joining the positive and negative electrodes of a lead is called the axis of the lead. Electrical axis refers to the net direction, or angle in degrees, where the main vector of depolarization is pointed. When axis is used by itself, it refers to the QRS axis.
During normal ventricular depolarization, the left side of the interventricular septum is stimulated first. The electrical impulse then crosses the septum to stimulate the right side. The left and right ventricles are then depolarized simultaneously. Because the left ventricle is considerably larger than the right, right ventricular depolarization forces are overshadowed on the ECG. As a result, the mean QRS vector points down (i.e., inferior) and to the left.
The axes of leads I, II, and III form an equilateral triangle with the heart at the center (i.e., Einthoven’s triangle) (Fig. 9.2A). Einthoven’s law states that the sum of the electrical currents recorded in leads I and III equals the sum of the electrical current recorded in lead II, which can be expressed as lead I + lead III = lead II.

If the augmented limb leads are added to the equilateral triangle, and the axes of the six leads are moved in a way in which they bisect each other, the result is the hexaxial reference system (Fig. 9.2B). The hexaxial reference system represents all of the frontal plane (limb) leads with the heart in the center and is the means used to express the location of the frontal plane axis. This system forms a 360-degree circle surrounding the heart. The positive end of lead I is designated at 0 degrees. The six frontal plane leads divide the circle into segments, each representing 30 degrees. All degrees in the upper hemisphere are labeled as negative degrees, and all degrees in the lower hemisphere are labeled as positive degrees (Fig. 9.2C).
The axes of some leads are perpendicular to each other in the hexaxial reference system. For example, lead I is perpendicular to lead aVF. Lead II is perpendicular to aVL, and lead III is perpendicular to lead aVR. If the electrical force moves toward a positive electrode, a positive (i.e., upright) deflection will be recorded. If the electrical force moves away from a positive electrode, a negative (i.e., downward) deflection will be recorded. If the electrical force is parallel to a given lead, the largest deflection in that lead will be recorded. If the electrical force is perpendicular to a lead axis, the resulting ECG complex will be isoelectric, equiphasic, or both in that lead. Notice that leads III and aVL are positioned on opposite (i.e., reciprocal) sides of the hexaxial reference system (Fig. 9.3). Axis determination can provide clues in the differential diagnosis of wide QRS tachycardia and localization of accessory pathways.

To determine the electrical axis, look at the 12-lead ECG in Fig. 9.1. Because the hexaxial reference system is derived from the limb leads, we will be focusing on the leads shown in the two columns on the left side of the figure (leads I, II, III, aVR, aVL, and aVF). Look for the most equiphasic or isoelectric QRS complexes in these leads. Lead aVL shows QRS complexes that most closely reflect our criteria. The patient’s QRS axis is perpendicular to the positive electrode in lead aVL.
Look at the hexaxial reference system diagram (see Fig. 9.3) to determine which ECG lead is perpendicular to lead aVL. Lead II is perpendicular to lead aVL. Now we know that the patient’s QRS axis is moving along the same vector as lead II. Note that the values associated with lead II in the hexaxial reference system diagram are −120 degrees and +60 degrees. To determine if the QRS axis is moving positively or negatively, look at lead II in Fig. 9.1 and determine if the QRS complex is primarily positive or negative in this lead. You will see that the QRS is primarily positive in lead II; therefore, this patient’s QRS axis is about +60 degrees. At the top of Fig. 9.1, you will see the computer’s calculation of the patient’s P-QRS-T axes. The computer calculated the patient’s QRS axis at +56 degrees. Our estimate of +60 degrees was very close!
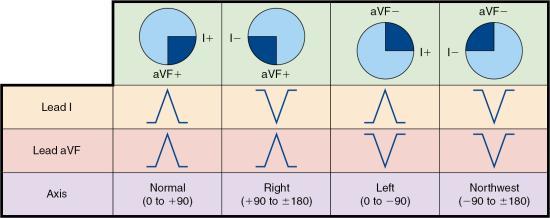
In adults, the normal QRS axis is considered to be between −30 and +90 degrees in the frontal plane. Current flow to the right of normal is called right axis deviation (between +90 and ±180 degrees). Current flow in the direction opposite of normal is called indeterminate, “no man’s land,” northwest, or extreme right axis deviation (between −90 and ±180 degrees). Current flow to the left of normal is called left axis deviation (between −30 and −90 degrees).
Shortcuts exist to determine axis deviation. Leads I and aVF divide the heart into four quadrants. These two leads can be used to quickly estimate the electrical axis. In leads I and aVF, the QRS complex is normally positive. If the QRS complex in either or both of these leads is negative, axis deviation is present (Fig. 9.4).
Right axis deviation may be a normal variant, particularly in the young and in thin individuals. Other causes of right axis deviation include mechanical shifts associated with inspiration or emphysema, right ventricular hypertrophy (RVH), chronic obstructive pulmonary disease (COPD), Wolff-Parkinson-White syndrome, and pulmonary embolism.
Left axis deviation may be a normal variant, particularly in older and obese individuals. Other causes of left axis deviation include mechanical shifts associated with expiration; a high diaphragm caused by pregnancy, ascites, or abdominal tumors; hyperkalemia; emphysema; left atrial hypertrophy; and dextrocardia.
Acute coronary syndromes
Recall that acute coronary syndromes (ACSs) are conditions caused by an abrupt reduction in coronary artery blood flow. Partial or intermittent blockage of a coronary artery may result in no clinical signs and symptoms (silent ischemia), unstable angina (UA), non–ST-elevation MI (NSTEMI), or possibly, sudden death. Complete blockage of a coronary artery may result in ST-elevation MI (STEMI) or sudden death. UA and NSTEMI are often grouped as non–ST-elevation acute coronary syndromes (NSTE-ACS) because ECG changes associated with these conditions usually include ST-segment depression and T-wave inversion in the leads that face the affected area. Cardiac biomarkers (e.g., troponins) are elevated when an infarction is present. Biomarkers are not elevated in patients with UA because there is no tissue death.
The diagnosis of an ACS is made based on the patient’s clinical presentation, history, ECG findings, and cardiac biomarker results. If ST segments are elevated in two contiguous leads, and elevated cardiac biomarkers are present, the diagnosis is STEMI. If ST-segment elevation (STE) is not present, but biomarker levels are elevated, the diagnosis is NSTEMI. If the ST segments and cardiac biomarkers are not elevated, the diagnosis is UA.
Time is muscle when caring for any patient with an ACS. The region of the heart supplied by the blocked artery is called the area at risk (Fig. 9.5). The longer the area at risk is deprived of oxygen and nutrients, the greater the likelihood of permanent damage. Therefore, if myocardium is to be saved, the blockage must be removed before irreversible tissue death occurs. If blood flow is quickly restored, the area at risk can potentially be salvaged. Of the patients experiencing ACSs, those experiencing a STEMI are most likely to benefit from reperfusion therapy. The benefits of reperfusion therapy are often time dependent. The primary choices for reperfusion therapy are fibrinolysis and percutaneous coronary intervention (PCI). Fibrinolytics are medications that are administered to break up blood clots. A PCI is a procedure in which a catheter is used to open a coronary artery blocked or narrowed by coronary artery disease.

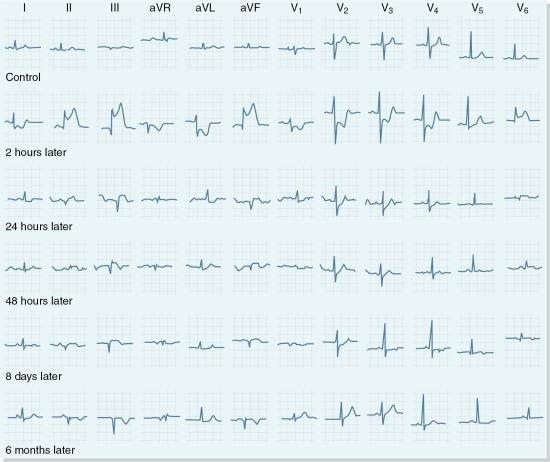
The area supplied by a blocked coronary artery goes through a sequence of events that have been identified as zones of ischemia, injury, and infarction. Each zone is associated with characteristic ECG changes that affect the shape of the QRS complex, the ST segment, and the T wave (Fig. 9.6).
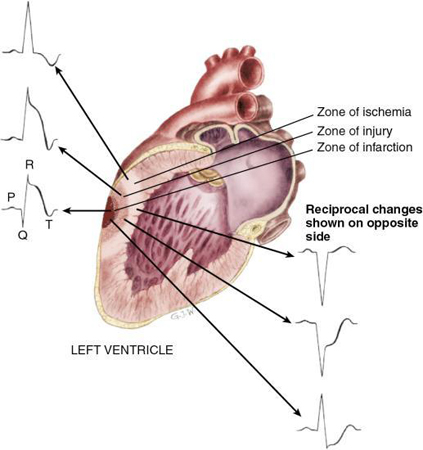
Because most infarctions occur in the left ventricle and a standard 12-lead ECG views the surfaces of the left ventricle from multiple angles, obtaining and reviewing a 12-lead ECG are essential components of the initial care provided to a patient presenting with ischemic chest discomfort. The first 12-lead ECG should be obtained with 10 minutes of patient contact in all patients with symptoms of suspected ACS. Obtain a repeat 12-lead ECG when the patient’s condition changes and as often as necessary. After the 12-lead ECG has been obtained, carefully review it for signs of ischemia, injury, and infarction. Look closely at each lead for STE or ST-segment depression. If present, compare the ST segment deviation to the isoelectric line using the TP segment for this comparison and document the degree of displacement in millimeters. Examine the T waves for any changes in orientation, shape, and size. Next, look at each lead for the presence of a Q wave. If a Q wave is present, measure its duration.
Anatomic location of a myocardial infarction
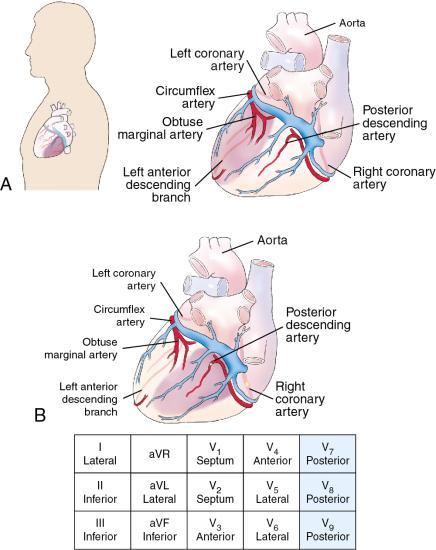
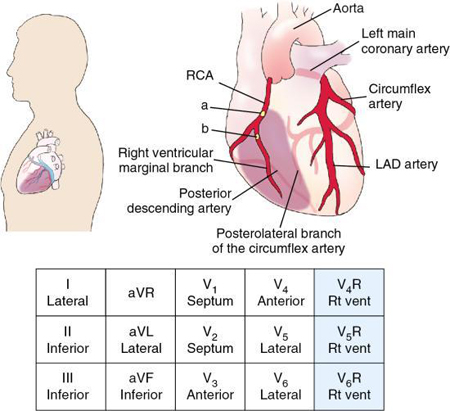
The left ventricle has been divided into regions where a myocardial infarction (MI) may occur: septal, anterior, lateral, inferior, and inferobasal (i.e., posterior). You will recall that ECG changes are considered significant if viewed in two or more anatomically contiguous leads (Fig. 9.7). Color has been added to Table 9.2 so you can quickly recognize contiguous lead groups.
| I: Lateral | aVR: None | V1: Septum | V4: Anterior |
| II: Inferior | aVL: Lateral | V2: Septum | V5: Lateral |
| III: Inferior | aVF: Inferior | V3: Anterior | V6: Lateral |
In the standard 12-lead ECG, leads II, III, and aVF view the inferior wall of the left ventricle, which is supplied by the right coronary artery (RCA) in most people. Therefore, if an ECG shows STE in these leads, it is reasonable to suppose that these ECG changes are caused by a partial or complete blockage of the RCA. Likewise, when indicative changes appear in the leads viewing the septal, anterior, and/or lateral walls of the left ventricle (i.e., V1 to V6, I, and aVL), it is reasonable to suspect that the left coronary artery is partially or entirely blocked.
 ECG Pearl
I See All Leads is a commonly used mnemonic to recall the lead groupings when localizing an infarction and predicting which coronary artery is occluded. I (inferior) = II, III, aVF; S (septal) = V1, V2; A (anterior) = V3, V4; L (lateral) = I, aVL, V5, V6.
To evaluate the relative extent or size of an infarction, determine how many leads show indicative changes. An ECG showing changes in only a few leads suggests a smaller infarction than one that produces changes in many leads. In general, the more proximal the blockage in the vessel, the larger the infarction and the greater the number of leads showing indicative changes. Table 9.3 summarizes the pattern in which coronary arteries most commonly supply the myocardium.
| MI Location | ECG Leads | Probable Culprit Coronary Artery |
|---|---|---|
| Anterior wall |
Indicative changes: V3, V4 Reciprocal changes: III, aVF |
LAD |
| Ventricular septum | Indicative changes: V1, V2 |
LAD |
| Lateral wall |
Indicative changes: I, aVL, V5, V6 Reciprocal changes: II, III, aVF (if high lateral MI) |
Cx, LAD, or RCA |
| Inferior wall |
Indicative changes: II, III, aVF Reciprocal changes: I, aVL |
RCA (most common) or Cx |
| Inferobasal (posterior) wall |
Indicative changes: V7, V8, V9 Reciprocal changes: V1, V2, V3 |
RCA or Cx |
| Right ventricle |
Indicative changes: V1R to V6R Reciprocal changes: I, aVL |
RCA |
Cx, Circumflex artery; ECG, electrocardiogram; LAD, left anterior descending artery; MI, myocardial infarction; RCA, right coronary.
It is important to emphasize that the approach discussed here concerning the localization of an infarction (i.e., determining which and how many coronary arteries are affected) works reasonably well for STEMI. However, ST-segment depression and T-wave changes that suggest the presence of myocardial ischemia, as in NSTE-ACS, are less reliable in localizing the culprit vessel because these ECG changes reflect subendocardial rather than transmural ischemia (Halim et al., 2010). Furthermore, recognition of STEMI can be tricky in the presence of right BBBs (RBBBs) and left BBBs (LBBBs), left ventricular hypertrophy (LVH), pericarditis, and paced ventricular rhythms because these conditions can cause STE, mimicking STEMI. Factors including the anatomic position and size of the heart, the patient’s unique pattern of coronary artery distribution, the location of the occlusion along the length of the coronary artery, the presence of collateral circulation, previous infarctions, and related drug- and electrolyte-related ECG changes may also affect the perceived location of an infarction versus its actual location.
ECG Pearl
It is important to remember that some areas of the heart are not shown on a standard 12-lead ECG. It is also essential to recall that some infarctions do not show changes on the 12-lead ECG. Therefore, if infarct changes are seen on the 12-lead ECG, the greater the number of leads showing indicative changes, the larger the infarction. But if the patient presents with signs and symptoms suggestive of an ACS and the 12-lead ECG does not show indicative changes, an MI cannot be ruled out based solely on the ECG findings.
Anterior infarction
The left main coronary artery supplies the left anterior descending (LAD) artery and the circumflex (Cx) artery (Fig. 9.8). Blockage of the proximal portion of the LAD artery (i.e., the “widow maker”) often leads to cardiogenic shock and death if reperfusion does not occur promptly.

An anterior myocardial infarction occurs when the blood supply to the LAD artery is disrupted (Fig. 9.9). Evidence of an anterior MI can be seen in leads V3 and V4, which face the anterior wall of the left ventricle. Septal involvement is evidenced by changes in leads V1 and V2 (Fig. 9.10). If an infarction involves the anterior wall and septum, ECG changes will be visible in V1, V2, V3, and V4, and the descriptive name anteroseptal MI is used (Fig. 9.11).


Because the LAD artery supplies a large portion of the left ventricle, a blockage in this area can lead to more widespread myocardial damage and complications (e.g., heart failure, cardiogenic shock) than infarctions involving other areas of the heart. Increased sympathetic nervous system activity is common with anterior MIs with resulting sinus tachycardia, hypertension, or both. A blockage in the septal area may result in BBBs, second-degree atrioventricular (AV) block type II, and third-degree AV block. BBBs are discussed later in this chapter.
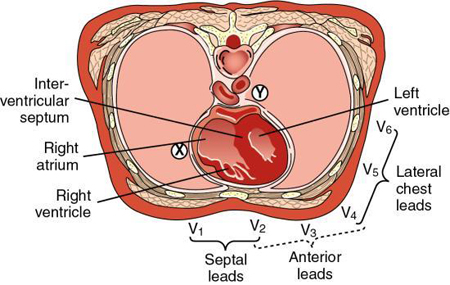
R-wave progression
The wave of ventricular depolarization in the major portions of the ventricles is normally from right to left and in an anterior to posterior direction. When viewing the chest leads in a normal heart, the R wave becomes taller (i.e., increases in amplitude), and the S wave becomes smaller as the electrode is moved from right to left (Fig. 9.12). This pattern is called R-wave progression. In V1 and V2, the QRS deflection is predominantly negative (i.e., moving away from the positive chest electrode), reflecting depolarization of the septum and right ventricle (small R wave) and the left ventricle (large S wave). As the chest electrode is placed farther left, the wave of depolarization is moving toward the positive electrode. The transition zone is where the R wave amplitude begins to exceed the amplitude of the S wave. Transition usually occurs in the area of leads V3 and V4. The phrase early transition is used when the transition is seen in V2. Late transition describes a delay in transition until leads V4 and V5. Electrode placement in the correct intercostal space is critical when evaluating R-wave progression.

Poor R-wave progression, a phrase used to describe R waves that decrease in size from V1 to V4 (Fig. 9.13), may be a nonspecific indicator of an anterior infarction or a normal variant in young people, particularly in young women. Other causes of poor R-wave progression include LBBB, RVH or LVH, and severe COPD (particularly emphysema).

Lateral infarction
Leads I, aVL, V5, and V6 view the lateral wall of the left ventricle. Because the lateral wall of the left ventricle may be supplied by the Cx artery, the LAD artery, or a branch of the RCA, a lateral infarction may be associated with an anterior, inferior, or posterior infarction (Fig. 9.14). An example of an infarction involving the lateral wall is shown in Fig. 9.15.


Inferior infarction
Leads II, III, and aVF view the inferior surface of the left ventricle. In most individuals, the inferior wall of the left ventricle is supplied by the posterior descending branch of the RCA (Fig. 9.16). Increased parasympathetic nervous system activity is common with inferior MIs, resulting in bradydysrhythmias. Conduction delays (e.g., first-degree AV block, second-degree AV block type I) are common and are usually transient. An example of an infarction involving the inferior wall is shown in Fig. 9.17.

Inferobasal infarction
Inferobasal (i.e., posterior) infarctions usually occur in conjunction with an inferior or lateral infarction. The inferobasal wall of the left ventricle is supplied by the Cx artery in most patients; however, in some patients, it is supplied by the RCA (Fig. 9.18). Because no leads of a standard 12-lead ECG directly view the posterior wall of the left ventricle, additional chest leads (V7 to V9) may be used to view the heart’s posterior surface. Indicative changes of a posterior wall infarction include STE in these leads. If the placement of posterior chest leads is not feasible, the mirror test may be helpful in recognizing the ECG changes suggesting an inferobasal MI (Fig. 9.19).

Complications of a posterior wall MI may include left ventricular dysfunction. In addition, if the RCA supplies the posterior wall, complications may include dysrhythmias involving the sinoatrial (SA) node, the AV node, and the bundle of His. An example of an inferobasal MI is shown in Fig. 9.20.
Right ventricular infarction
A right ventricular infarction (RVI) is usually the result of an RCA occlusion (Fig. 9.21). However, the Cx artery supplies a significant proportion of the right ventricle in some patients. Although RVI may occur by itself, it has been estimated that about one-third of patients with inferior MI experience an RVI (O’Gara et al., 2013). Use right-sided chest leads to look for evidence of RVI in all patients with inferior STEMI. Of the right chest leads, V4R has the highest sensitivity. It is essential to record leads V3R and V4R as soon as possible after the patient’s onset of ischemic symptoms. In addition, leads aVR or V1 may show STE of 1 mm or more in patients with inferior and suspected RVI (Thygesen et al., 2018). An example of an infarction involving the right ventricle is shown in Fig. 9.22.

Because patients experiencing an RVI are often preload sensitive, they can develop hypotension of varying degrees in response to medications that reduce preload, such as nitrates and diuretics. Other complications associated with RVI include bradycardias, AV blocks, and ventricular dysrhythmias.
Intraventricular conduction delays
Structures of the intraventricular conduction system
After passing through the AV node, the electrical impulse enters the bundle of His, which is normally the only electrical connection between the atria and the ventricles. The bundle of His conducts the electrical impulse to the right and left bundle branches (Fig. 9.23). A bundle branch block (BBB) is a disruption in impulse conduction from the bundle of His through either the right or left bundle branch to the Purkinje fibers. A BBB may be intermittent or permanent, complete or incomplete.

The right bundle branch travels down the right side of the interventricular septum to conduct the electrical impulse to the right ventricle. Structurally, the right bundle branch is long, thin, and more fragile than the left. Because of its structure, a relatively small lesion in the right bundle branch can result in delays or interruptions in electrical impulse transmission.
The left bundle branch begins as a single structure that is short and thick and then divides into two subdivisions called the anterior fascicle and the posterior fascicle. The anterior fascicle spreads the electrical impulse to the anterior portions of the left ventricle. This fascicle is thin and vulnerable to disruptions in electrical impulse transmission. The posterior fascicle relays the impulse to the posterior portions of the left ventricle. It is short, thick, and rarely disrupted because of its structure and dual blood supply from both the LAD artery and the RCA. In some people, a third fascicle, called the medial fascicle or septal fascicle, emerges from the left bundle itself or its posteroinferior division (Latcu & Nadir, 2010).
Bundle branch activation
The wave of normal ventricular depolarization moves from the endocardium to the epicardium. The left side of the interventricular septum, which is stimulated by the left posterior fascicle, is stimulated first. The electrical impulse (i.e., wave of depolarization) then traverses the septum to stimulate the right side. The left and right ventricles are then depolarized at the same time (Fig. 9.24).

A delay or block can occur in any part of the intraventricular conduction system. If a delay or block occurs in one of the bundle branches, the ventricles will not be depolarized simultaneously. Instead, the electrical impulse travels first down the unblocked branch and stimulates that ventricle. Because of the block, the impulse must then travel from cell to cell through the myocardium, rather than through the normal conduction pathway, to stimulate the other ventricle. Thus, the ventricle with the blocked bundle branch is the last to be depolarized.
How do I recognize it?
Essentially, two conditions must exist to suspect BBB. First, the QRS complex must have an abnormal duration (i.e., 0.12 second or more in duration if a complete BBB). Second, the QRS complex must arise due to supraventricular activity (this excludes paced beats and beats originating from the ventricles). If these two conditions are met, delayed ventricular conduction is assumed to be present, and BBB is the most common (but not the only) cause of this abnormal conduction.
When one of the bundles becomes blocked, the impulse that is normally conducted by that bundle branch is interrupted, and it does not depolarize the intended ventricle. Meanwhile, the other bundle branch is conducting its impulse and depolarizing its respective ventricle. For the second ventricle to depolarize, the electrical impulses must trudge through myocardial cells, which are not specialized for electrical conduction. Thus, the impulses from one ventricle must be transmitted, cell by cell, to the other ventricle. Because the impulses are not traveling down the normal conduction pathway, ventricular depolarization takes longer to occur. This delay is evidenced in the form of a wide QRS complex.
Variation in QRS duration from lead to lead is often seen and may produce confusion about whether the complex is or is not wide. As a rule, use the widest QRS complex to determine width. However, trying to pinpoint the exact beginning and end of the QRS complex can be challenging and sometimes impossible. Therefore, when measuring for BBB, select the widest QRS complex with a discernible beginning and end.
The criteria for BBB recognition may be identified in any lead of the ECG. However, in differentiating RBBB from LBBB, pay particular attention to the QRS morphology (i.e., shape) in specific leads. Lead V1 is probably the single best lead to use in differentiating between RBBB and LBBB.
ECG Pearl
To be considered a BBB, the following ECG criteria must be met:
- • QRS duration of 0.12 second or more in adults (if a complete RBBB or LBBB); if a BBB pattern is discernible and the QRS duration is between 0.11 and 0.119 second in adults, it is called an incomplete RBBB or LBBB (Surawicz et al., 2009). (If the QRS is wide but there is no BBB pattern, the term wide QRS or intraventricular conduction delay is used to describe the QRS)
- • Visible QRS complexes are produced by supraventricular activity (i.e., the QRS complex is not a paced beat and does not originate in the ventricles).
Differentiating right bundle branch block from left bundle branch block
When BBB is suspected, an examination of V1 can reveal whether the block affects the right or the left bundle branch. Following are descriptions of how each type of block affects the direction of electrical current and produces its own, distinct QRS morphology (Phalen & Aehlert, 2019).
Right bundle branch block
With RBBB, the electrical impulse travels through the AV node and down the left bundle branch into the interventricular septum. The septum is activated by the left posterior fascicle and is depolarized in a left-to-right direction (Fig. 9.25), which is toward V1, producing an initial small R wave. As the left bundle continues to conduct impulses, the entire left ventricle is depolarized from right to left, producing movement away from V1 and resulting in a negative deflection (i.e., an S wave). Now the impulses that depolarized the left ventricle conduct through the myocardial cells and depolarize the right ventricle. This depolarization creates a movement of electrical activity in the direction of V1, so a second positive deflection is recorded (R′). The rSR′ pattern is characteristic of RBBB. The rSR′ pattern is sometimes referred to as an “M” or “rabbit ear” pattern.

Left bundle branch block
With LBBB, the septum is depolarized by the right bundle branch, as is the right ventricle. The septum is part of the left ventricle and is normally depolarized by the left bundle branch. Because the left bundle branch is blocked, depolarization of the septum by the right bundle branch occurs in an abnormal direction (i.e., from right to left); thus, the wave of myocardial depolarization begins with the net movement of current going away from V1 and is recorded as an initial negative deflection (Fig. 9.26). The right ventricle is depolarized next. Because the wave of depolarization moves briefly toward the positive electrode in lead V1, a small upright notch in the QRS complex is seen on the ECG. As the remainder of the left ventricle is depolarized, the QRS complex is inscribed in lead V1 as a deep, negative deflection (i.e., an S wave), reflecting the left ventricle’s large muscle mass. Sometimes depolarization of the left ventricle overshadows that of the right ventricle on the ECG. When this occurs, a QS deflection is inscribed in lead V1, and the small upright notch that is usually seen with right ventricular depolarization is absent.

Unfortunately, not every BBB presents a clear pattern as previously described, making the differentiation between RBBB and LBBB less clear. Variant patterns of BBB as seen in lead V1 appear in Fig. 9.27.

An easier way
Remember that in the setting of BBB, the ventricles are not depolarized in their usual simultaneous manner. Instead, they are depolarized sequentially. The last ventricle to be depolarized is, of course, the ventricle with the blocked bundle branch. Therefore, if it is possible to determine which ventricle was depolarized last, it becomes possible to determine which bundle branch was blocked. For example, if the right ventricle was depolarized last, the impulse traveled down the left bundle branch, depolarized the left ventricle first, and then marched through and depolarized the right ventricle. Thus, it stands to reason that if one ventricle is depolarized late, its depolarization makes up the last portion of the QRS complex.
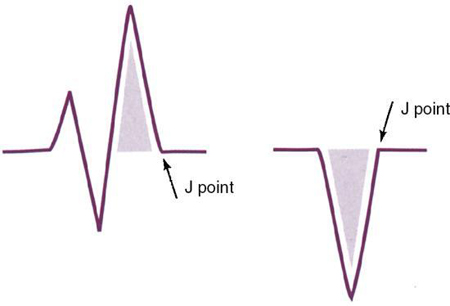
The final portion of the QRS complex is referred to as the terminal force. Examination of the terminal force of the QRS complex reveals the ventricle that was depolarized last and the bundle that was blocked. To identify the terminal force, first locate the J point. Then, from the J point, move backward into the QRS and determine whether the last electrical activity produced an upward or downward deflection.
An example of the terminal force in both RBBB and LBBB is illustrated in Fig. 9.28. If the right bundle branch is blocked, then the right ventricle will be depolarized last. As a result, the current will be moving from the left ventricle to the right, creating a positive deflection of the terminal force of the QRS complex in V1. On the other hand, if the left bundle branch is blocked, the left ventricle will be depolarized last. As a result, the current will flow from right to left, producing a negative deflection of the terminal force of the QRS complex seen in V1. Therefore, to differentiate RBBB from LBBB, look at V1 and determine whether the terminal force of the QRS complex is a positive or negative deflection. If it is directed upward, an RBBB is present (i.e., the current is moving toward the right ventricle and toward V1). Conversely, an LBBB is present when the terminal force of the QRS complex is directed downward (i.e., the current is moving away from V1 and toward the left ventricle). This rule is beneficial when rSR′ and QS variants are present.
A simple way to remember this rule has been suggested by Mike Taigman and Syd Canan and is demonstrated in Fig. 9.29. They recognized the similarity between this rule and the turn signal on a car. For example, to indicate a right turn, you lift the arm of the turn signal. Likewise, when an RBBB is present, the terminal force of the QRS complex points up. Conversely, left turns and LBBB move downward.

Exceptions
Two notable exceptions must be mentioned to complete the discussion of BBB. The first involves the criteria used to recognize BBB, and the second relates to differentiating LBBB from RBBB.
The criteria used to recognize BBB are valid but lack some sensitivity and specificity. The sensitivity can be limited by junctional rhythms because there may be no discernible P waves when the AV junction is the pacemaker site. The AV junction is a supraventricular pacemaker, but this presents an exception to the two-part rule of BBB recognition. Specificity is limited by Wolff-Parkinson-White (WPW) syndrome and other conditions that produce wide QRS complexes resulting from atrial activity. If the characteristic delta wave and shortened PR interval are recognized, WPW syndrome should be suspected.
As for differentiating LBBB from RBBB, a third category exists: nonspecific intraventricular conduction delay (NSIVCD). These blocks do not display the typical V1 morphologies generally produced by BBB. Their origin may not result from a complete BBB but are often the result of several factors, of which incomplete BBB may be one. Atypical patterns of BBB can be attributed to NSIVCD.
What causes it?
RBBB can occur in individuals with no underlying heart disease, but it occurs more commonly in the presence of organic heart disease, with coronary artery disease being the most common cause. Acute RBBB may occur secondary to an RVI. LBBB may result from an anteroseptal or inferior MI, conduction system degeneration, acute heart failure, acute pericarditis or myocarditis, or following cardiac procedures (Tan et al., 2020).
Other causes of BBBs include aortic valve disease; congenital, hypertensive, and rheumatic heart disease; and trauma (e.g., cardiac surgery). Sometimes the ECG will show occasional QRS complexes that have an RBBB or LBBB morphology interspersed with normal QRS complexes. When a BBB occurs intermittently and is related to the patient’s heart rate, it is referred to as a rate-related BBB. Nonischemic diseases are also capable of producing a BBB.
What do I do about it?
Because the LAD artery supplies much of the bundle branches, patients experiencing septal and anteroseptal infarctions are most likely to develop BBB. Of course, a patient experiencing an infarction and presenting with BBB may have had it as a preexisting condition. Unless a previous ECG is available for comparison or the BBB develops during the infarction, it can be challenging to determine which came first, the infarction or the BBB. BBB in the setting of infarction also identifies patients with a higher likelihood of developing third-degree AV block.
The presence of a BBB in an asymptomatic patient requires no specific treatment. RBBB generally requires no specific treatment; however, when RBBB occurs in the setting of an acute MI, close ECG monitoring for the development of symptomatic AV conduction system disturbances is essential.
For the patient experiencing chest discomfort, the presence of LBBB can complicate the diagnosis of an acute MI because LBBB can produce STE and wide Q waves that look remarkably similar to infarction. Therefore, close ECG monitoring and frequent patient reassessment are essential. Because of its association with organic heart disease, patients with LBBB should be evaluated for cardiomyopathies, coronary disease, hypertension, valvular heart disease, and other conditions associated with LBBB. Insertion of a permanent pacemaker is generally required for patients with LBBB who develop second-degree AV block type II or third-degree AV block.
ECG Pearl
When BBB is present, STE is often seen in leads with negatively deflected QRS complexes. RBBB rarely produces STE because most of the leads remain positively deflected. Occasionally, when the inferior leads (II, III, and aVF) happen to be negatively deflected, an RBBB may produce STE in those leads and may occasionally mimic an inferior wall infarction. Although this combination is possible, LBBB is by far the more common cause of STE.
Chamber abnormalities
Cardiomyopathy is a general term used to describe different heart diseases involving the heart muscle, resulting in abnormal enlargement. Cardiac enlargement refers to either dilation of a heart chamber or hypertrophy of the heart muscle (Goldberger et al., 2018). With dilation, stretching of a chamber of the heart muscle occurs, resulting in enlargement of that chamber. Dilation may be acute or chronic. Cardiac hypertrophy refers to thickening of the heart muscle, with resultant enlargement of a heart chamber. Hypertrophy is commonly accompanied by dilation. When evaluating the ECG for indications of chamber enlargement, it is essential to check the calibration marker to ensure that it is 10 mm (1 mV) tall.
Cardiomyopathies can be classified into three physiologic categories: (1) dilated cardiomyopathy (DCM) (most common), (2) hypertrophic cardiomyopathy (HCM), and (3) restrictive cardiomyopathy (least common) (Fig. 9.30).

DCM is characterized by enlargement of all heart chambers with progressive dilation of both the right and left ventricles, resulting in impaired contractile (systolic) function. As a result, patients may present with fatigue, dyspnea, jugular venous distention, pedal edema, and pulmonary congestion. Possible causes of DCM include poorly controlled hypertension, ischemic heart disease, valvular disease, diabetes, alcohol or drug abuse, renal failure, hyperthyroidism, exposure to heavy metals (e.g., lead, arsenic, cobalt, mercury), or infection. Peripartum cardiomyopathy occurs in previously healthy women in the last month of pregnancy or within 5 months after delivery.
HCM is characterized by thickening of the septal wall without ventricular dilation, resulting in a reduced stroke volume because of impaired diastolic filling. Patients with HCM may be asymptomatic or present with dysrhythmias, syncope on exertion, angina, palpitations, left heart failure, or sudden death. Because most cases have a genetic origin, screening of first-degree family members of patients with HCM is recommended.
Restrictive cardiomyopathy is characterized by increased ventricular wall stiffness that impedes ventricular filling, reduced diastolic volume of either or both ventricles, and normal or nearly normal systolic function. Although the ventricles are typically of normal size or are only slightly enlarged, dilation of both atria is common because of poor ventricular filling and pressure overload (Kumar et al., 2018). Restrictive cardiomyopathy may be caused by amyloidosis, myocardial fibrosis, scleroderma, or an unknown cause. Patients often present with signs and symptoms that are consistent with progressive left- and right-sided heart failure.
Atrial abnormalities
The first half of the P wave is recorded when the electrical impulse that originated in the SA node stimulates the right atrium and reaches the AV node. The downslope of the P wave reflects stimulation of the left atrium. The appearance of abnormal P waves on the ECG may be caused by delayed intra-atrial conduction, elevated atrial pressure, atrial dilation, and atrial muscular hypertrophy, among other causes. In the past, terms used to describe atrial abnormalities have included P-mitrale, P-pulmonale, left atrial enlargement, right atrial enlargement, atrial hypertrophy, and atrial overload. Today, experts recommend that the terms left atrial abnormality (LAA) and right atrial abnormality (RAA) be used because a combination of several factors that may not be distinguishable can result in abnormal P waves (Hancock et al., 2009).
You will recall that the normal P wave results from atrial depolarization. The initial portion of the P wave represents depolarization of the right atrium, and the middle and end portions represent left atrial depolarization. Because these events normally occur nearly at the same time, they fuse into a single, smooth rounded waveform.
RAA produces changes in the initial part of the P wave. The P wave is tall (more than 2.5 mm in height), peaked, and usually of normal duration (Hancock et al., 2009) (Fig. 9.31). The abnormal P waves characteristic of RAA are usually best seen in leads II, III, aVF, and sometimes V1 (Goldberger et al., 2018). Lead V1 may reveal a biphasic P wave. Examples of conditions that may cause RAA include COPD with or without pulmonary hypertension, congenital heart disease, and right ventricular failure.

With LAA, the middle and end of the P wave are prolonged because depolarization of the left atrium begins and ends later than right atrial depolarization (Surawicz & Knilans, 2008). Notched P waves are usually visible and correspond with the delay in left atrial activation because the right and left atrial peaks that are usually nearly simultaneous and fused into a single peak become more widely separated (Hancock et al., 2009) (see Fig. 9.31). Notched P waves are generally most easily seen in the limb leads. The P wave may be biphasic in lead V1 with a slight initial positive deflection and a prominent, wide negative deflection (Goldberger et al., 2018). Examples of conditions in which LAA may occur include coronary artery disease, cardiomyopathies, hypertensive heart disease, and valvular heart disease. When the ECG reflects both RAA and LAA, the term combined atrial abnormality is used.
Ventricular abnormalities
With RVH, current travels between hypertrophied cells and moves through the enlarged right ventricle, producing higher-than-normal voltages on the body surface (Mirvis & Goldberger, 2019) (Fig. 9.32). Because the right ventricle usually is considerably smaller than the left, it must become significantly enlarged before changes are visible on the ECG. Characteristic ECG changes associated with RVH include tall R waves in leads V1 through V3 and deeper than normal S waves in leads I, aVL, V5, and V6 (Sharma & Morrison, 2022) (Fig. 9.33). Right axis deviation is usually present, and evidence of RAA may be seen. Causes of RVH include pulmonary hypertension and chronic pulmonary diseases, valvular heart disease, and congenital heart disease.


LVH is recognized on the ECG by increased QRS amplitude and changes in the ST segment and T wave (see Fig. 9.32). Typically, R waves in leads I, aVL, V5, and V6 are taller than usual, and S waves in leads V1 through V2 are deeper than normal (Mirvis & Goldberger, 2019). The QRS duration is often increased in LVH and may be attributed to the longer time required to activate the thickened wall of the left ventricle (Hancock et al., 2009) and the slower-than-normal conduction within the working myocardium (Mirvis & Goldberger, 2019). Causes of LVH include systemic hypertension, HCM, aortic stenosis, and aortic insufficiency. In addition, LVH may be accompanied by left axis deviation.
The Cornell voltage criterion is often used to check for the presence of LVH. This formula adds the S wave amplitude in lead V3 and the R wave amplitude in lead aVL. A total greater than 20 mm (2 mV) in women and 28 mm or more (2.8 mV) in men suggests that LVH is present (Ganz & Link, 2019). A 12-lead ECG’s interpretive algorithm checks for the presence of LVH using preprogrammed criteria, including formulas, to measure voltage. If the 12-lead machine determines that an ECG meets the criteria for LVH, a message is displayed, such as “Meets voltage criteria for left ventricular hypertrophy.”
An example of LVH is shown in Fig. 9.34. Note that the ST segment in Fig. 9.34 is elevated in V1, V2, and V3. Also note the ST-segment depression shown in leads V5 and V6. Recall that when the QRS complexes of LBBBs, ventricular rhythms, and ventricular paced rhythms are negatively deflected (i.e., a QS configuration), the ST segments and T waves are in the opposite direction of the last portion of the QRS complex. Similarly, when the QRS complex of LVH is negatively deflected, these ECG findings are shared by LVH, making the identification of ECG changes associated with acute MI complicated. Therefore, careful correlation of the patient’s ECG, clinical presentation, and the results of other diagnostic studies are essential.

Electrolyte disturbances
Because electrolyte imbalances may increase cardiac irritability and cause cardiac dysrhythmias, a patient’s ECG can be evaluated for evidence of electrolyte disturbances. ECG changes associated with electrolyte imbalances can vary widely from patient to patient.
Sodium
Sodium is the most abundant electrolyte in the body. It is vital in maintaining water balance, is necessary for the normal conduction of impulses in nerve and muscle fibers (in conjunction with potassium and calcium), and plays an essential role in the voltage of action potentials. Food and drink are the primary sources of sodium. In healthy individuals, sodium is primarily excreted in sweat and urine.
Hypernatremia
Hypernatremia (sodium excess) may result from several factors, including dehydration due to vomiting, severe watery diarrhea, excessive sweating, heat stroke, prolonged high fever, or Cushing syndrome. In addition, possible causes of hypernatremia because of the retention of relatively more sodium than water include excess aldosterone secretion, excess secretion of adrenocorticotropic hormone (ACTH), hypertonic parenteral fluid administration, inadequate fluid intake, or ingestion of abnormal amounts of sodium.
The patient may present with restlessness, irritability, confusion, thirst, dry and flushed skin, dry mucous membranes, decreased urine output, seizures, and coma. Hypernatremia does not cause any significant ECG changes.
Hyponatremia
Hyponatremia (sodium deficit) may result from inadequate sodium intake, prolonged diuretic therapy, excessive diaphoresis, excessive loss of sodium from trauma (e.g., burns), adrenal insufficiency, renal disease, severe gastrointestinal (GI) fluid losses from gastric suctioning or lavage, and prolonged vomiting or diarrhea. In addition, some medications may impair water excretion and contribute to hyponatremia.
The patient may present with irritability, fatigue, headache, nausea and vomiting, abdominal cramps, and muscle weakness. Hyponatremia does not cause any significant ECG changes.
Potassium
Potassium is the primary intracellular fluid cation. It is essential for many cell functions, including cardiac and neuromuscular activity, resting membrane potential, growth, enzyme function, and regulation of fluid volume and pH (Stanton & Koeppen, 2018).
Hyperkalemia
Hyperkalemia (potassium excess) may occur because of acute or chronic renal failure, excessive administration of intravenous (IV) potassium, metabolic acidosis, ingestion of excessive amounts of salt substitutes, medications (e.g., spironolactone, angiotensin-converting enzyme inhibitors, nonsteroidal anti-inflammatory drugs), or widespread cell damage (e.g., crush injuries, burns). The patient may present with anxiety, restlessness, cardiac dysrhythmias, skeletal muscle weakness, abdominal muscle cramping, and diarrhea.
The effects of hyperkalemia depend on the tissue involved. The atrial myocardium is the most sensitive, the ventricular myocardium less sensitive, and the SA node and bundle of His the least sensitive (El-Sherif et al., 2012). When the potassium level exceeds 5.5 mEq/L, tall, peaked (tented), narrow, symmetric T waves may be seen on the ECG (Box 9.2). However, 50% of patients with potassium levels higher than 6.5 mEq/L will not manifest any ECG changes (El-Sherif et al., 2012). As the potassium level rises, PR intervals lengthen and the QRS duration increases, reflecting slowed conduction. When the potassium level nears 10 mEq/L, intraventricular conduction delays and dysrhythmias such as ventricular tachycardia, ventricular fibrillation, and asystole may develop. Examples of the effects of hyperkalemia on the ECG are shown in Fig. 9.35.

Hypokalemia
Hypokalemia (potassium deficit) is one of the most common electrolyte disorders (Stanton & Koeppen, 2018). It may occur because of prolonged diuretic therapy with thiazide diuretics or furosemide, an inadequate dietary intake of potassium, administration of potassium-deficient parenteral fluids, starvation, severe GI fluid losses from gastric suctioning or lavage, prolonged vomiting or diarrhea, or laxative use without potassium replacement. It has been estimated that as many as 10% to 40% of patients taking thiazide diuretics and almost 50% of patients resuscitated from out-of-hospital ventricular fibrillation have low potassium levels (El-Sherif et al., 2012).
The patient may present with skeletal muscle weakness, fatigue, paresthesias, and cardiac dysrhythmias (e.g., sinus bradycardia, AV blocks). The electrophysiologic effects of hypokalemia include increased automaticity, decreased conduction velocity, shortening of the effective refractory period, and prolongation of the relative refractory period (El-Sherif et al., 2012). Possible ECG manifestations of hypokalemia are shown in Box 9.3 and Fig. 9.36.

Calcium
Calcium is essential in bone formation, nerve and muscle function, and blood clotting.
Hypercalcemia
Causes of hypercalcemia (calcium excess) include hyperparathyroidism, chronic and acute renal failure, excessive vitamin D or vitamin A intake, hyperthyroidism, adrenal insufficiency, cancer (e.g., breast, lung, multiple myeloma), excessive use of calcium-containing antacids, and an excessive intake of calcium supplements.
The patient may present with nausea, vomiting, acute mental status changes ranging from mild confusion to coma, fatigue, skeletal muscle weakness, constipation, and cardiac dysrhythmias. ECG changes associated with hypercalcemia include shortening of the ST segment and decreased QT interval duration.
Hypocalcemia
Hypocalcemia (calcium deficit) may result from renal disease, dietary deficiency of calcium and vitamin D, pancreatic disease, malabsorption because of small bowel disease, hypoparathyroidism, and certain medications.
Symptoms may range from mild to severe, including irritability and confusion, tingling of the nose, mouth, ears, fingers, or toes; nausea, vomiting, and diarrhea; cardiac dysrhythmias; hyperactive deep tendon reflexes; carpal spasms (Trousseau sign); facial muscle contraction (Chvostek sign); and pathologic fractures. ECG changes associated with hypocalcemia include lengthening of the ST segment and increased QT interval duration. Possible ECG manifestations of calcium disturbances are shown in Fig. 9.37.

Magnesium
Magnesium has an essential role in membrane stability, skeletal muscle contraction, respiratory smooth muscle function, and enzyme reactions contributing to cardiovascular function.
Hypermagnesemia
Causes of hypermagnesemia (magnesium excess) include hypothyroidism, Addison disease, excessive parenteral magnesium (e.g., eclampsia), or excessive use of magnesium-containing antacids, laxatives, or enemas in patients with impaired renal function. Signs and symptoms include drowsiness, hypotension, muscle weakness, impaired breathing, and diminished deep tendon reflexes. In addition, hypermagnesemia depresses AV and intraventricular conduction, increasing the potential for bradycardia and AV blocks.
Hypomagnesemia
Hypomagnesemia (magnesium deficit) may occur because of prolonged or excessive diuretic therapy, excessive calcium or vitamin D intake, administration of IV fluids or total parenteral nutrition without magnesium replacement, hypercalcemia, malabsorption associated with disease of the small intestine, malnutrition, and alcohol use disorder.
Early signs and symptoms may include fatigue, nausea and vomiting, and a loss of appetite. As hypomagnesemia worsens, the patient may experience acute mental status changes, cardiac dysrhythmias, paresthesias, and muscle weakness and cramps. Hypomagnesemia does not generally produce significant ECG changes; however, it may cause or increase the severity of hypokalemia. In addition, hypomagnesemia has been associated with a prolonged QT interval and implicated as a possible cause of torsades de pointes.
Analyzing the 12-lead electrocardiogram
It is essential to use a systematic method when analyzing a 12-lead ECG. Before beginning an in-depth review, take a moment to “take in” the entire 12-lead and get an overall impression of the tracing. Does the rate look as if it is normal, fast, or slow? Do the ST segments look markedly elevated or depressed? Is there evidence of premature beats, pauses, baseline wander, or artifact? If baseline wander or artifact is present to any significant degree, note it. If the presence of either of these conditions interferes with the assessment of any lead, use a modifier such as “possible” or “apparent” in your interpretation. After initially surveying the tracing, consider using the following approach when reviewing a 12-lead ECG:
- 1. Identify the rate and underlying rhythm. Identify any premature beats and pauses, if present.
- 2. Estimate the QRS axis using leads I and aVF.
- 3. Analyze waveforms, segments, and intervals. Before examining waveforms, quickly look at the calibration marker and determine if it is standard, half-standard, or twice the standard. Next, examine each lead, selecting one good representative waveform or complex in each lead. Inspect each waveform, noting any changes in orientation, shape, size, and duration.
- 4. Examine for evidence of ischemia, injury, and infarction. Look for the presence of ST-segment displacement (i.e., STE or ST-segment depression).
- 5. Look for evidence of other conditions. Is there evidence of chamber enlargement, electrolyte imbalances, or conditions that mimic MI (e.g., LVH, LBBB, ventricular rhythm, ventricular paced rhythm)?
- 6. Interpret your findings.
Stop & review
Multiple response
Identify one or more choices that best complete the statement or answer the question.
- 1. A 66-year-old man presents with persistent chest pain that has been present for 1 hour. His 12-lead ECG reveals STE in leads V2, V3, and V4, and his cardiac biomarkers are elevated. You suspect
- 2. Which of the following is probably the single best lead to use when differentiating between right and left bundle branch blocks?
- 3. When leads I and aVF are used to determine the electrical axis, left axis deviation is present if the QRS is
- 4. When evaluating the ECG for the presence of chamber enlargement, an ECG machine’s sensitivity must be calibrated so that a 1-millivolt electrical signal will produce a deflection measuring exactly _____ mm tall.
- 5. Which of the following ECG changes is one of the earliest to occur during a STEMI but may have resolved by the time the patient seeks medical assistance?
- 6. Although a right ventricular infarction may occur by itself, it is more commonly associated with a(n) _____ wall myocardial infarction.
- 7. Which of the following are possible ECG signs of hyperkalemia?
- 8. Which of the following are possible ECG signs of sodium disturbances?
- 9. Patients experiencing ___and ___ infarctions are most likely to develop bundle branch blocks.
- 10. Normal electrical axis lies between____ in the frontal plane.
- 11. In a patient experiencing an acute coronary syndrome, T-wave inversion suggests the presence of
- 12. Lead II is perpendicular to lead
- 13. Which of the following statements is true regarding ventricular hypertrophy?
- a. Hypertrophy increases the QRS amplitude.
- b. Hypertrophy increases the duration of the QRS complex.
- c. Leads I, V5, and V6 are the best leads to use when looking for ECG evidence of hypertrophy.
- d. ECG evidence of right ventricular hypertrophy is usually more readily evident than left ventricular hypertrophy.
Matching
Match the terms below with their descriptions by placing the letter of each correct answer in the space provided.
- a. Left anterior descending artery
- b. STEMI
- c. Cardiac enlargement
- d. V1, V2
- e. Positive
- f. Dilated cardiomyopathy
- g. I and aVF
- h. Terminal force
- i. Right atrial abnormality
- j. QS
- k. I, aVL, V5, V6
- l. rSRʹ
- m. Right coronary artery
- n. Negative
- o. Tall R waves in leads V1 through V3 and deeper than normal S waves in leads I, aVL, V5, and V6
- p. Left bundle branch block
- q. Non-ST elevation acute coronary syndromes
- r. Intraventricular conduction delay
- s. Hypertrophic cardiomyopathy
- t. Increased QRS amplitude and changes in the ST segment and T wave
- u. Left atrial abnormality
- ____ 14. This can produce ST-segment elevation and wide Q waves that look remarkably similar to infarction
- ____ 15. Term that refers to either dilation of a heart chamber or hypertrophy of the heart muscle
- ____ 16. Leads commonly used to determine axis deviation
- ____ 17. Non-ST elevation myocardial infarction and unstable angina
- ____ 18. Cardiac biomarkers and ST segments are elevated when this is present
- ____ 19. Leads that view the septum
- ____ 20. QRS pattern that is characteristic of right bundle branch block
- ____ 21. Most common form of cardiomyopathy
- ____ 22. Term used to describe a wide QRS that is not associated with a bundle branch block pattern
- ____ 23. The P wave is tall, peaked, and usually of normal duration
- ____ 24. Vessel that is usually blocked with an inferior myocardial infarction
- ____ 25. Deflection of the terminal force of the QRS complex in V1 in right bundle branch block
- ____ 26. Vessel that is usually blocked with an anterior myocardial infarction
- ____ 27. Characteristic ECG changes associated with right ventricular hypertrophy
- ____ 28. Leads that view the lateral wall of the left ventricle
- ____ 29. The final portion of the QRS complex
- ____ 30. Characteristic ECG changes associated with left ventricular hypertrophy
- ____ 31. QRS pattern that is characteristic of left bundle branch block
- ____ 32. Type of cardiomyopathy characterized by significant myocardial hypertrophy without ventricular dilation that results in a markedly reduced stroke volume because of impaired diastolic filling
- ____ 33. Associated with prolongation of the middle and end of the P wave
12-lead electrocardiograms—practice

-
- Rhythm: __________________________ Rate: __________________________ P waves: ________________________
- PR interval: ______________________ QRS duration: _____________________ QT interval: _____________________
- ST depression: __________ ST elevation: __________ Other findings: ____________________
- Interpretation: _____________________________________________________________________________________
- 35. Analyze this 12-lead ECG and record your findings below.

-
- Rhythm: __________________________ Rate: __________________________ P waves: ________________________
- PR interval: ______________________ QRS duration: _____________________ QT interval: _____________________
- ST depression: __________ ST elevation: __________ Other findings: ____________________
- Interpretation: _____________________________________________________________________________________
- 36. Analyze this 12-lead ECG and record your findings below.

-
- Rhythm: __________________________ Rate: __________________________ P waves: ________________________
- PR interval: ______________________ QRS duration: _____________________ QT interval: _____________________
- ST depression: __________ ST elevation: __________ Other findings: ____________________
- Interpretation: _____________________________________________________________________________________
- 37. Analyze this 12-lead ECG and record your findings below.

-
- Rhythm: __________________________ Rate: __________________________ P waves: ________________________
- PR interval: ______________________ QRS duration: _____________________ QT interval: _____________________
- ST depression: __________ ST elevation: __________ Other findings: ____________________
- Interpretation: _____________________________________________________________________________________
- 38. Analyze this 12-lead ECG and record your findings below.

-
- Rhythm: __________________________ Rate: __________________________ P waves: ________________________
- PR interval: ______________________ QRS duration: _____________________ QT interval: _____________________
- ST depression: __________ ST elevation: __________ Other findings: ____________________
- Interpretation: _____________________________________________________________________________________
- 39. Analyze this 12-lead ECG and record your findings below.

-
- Rhythm: __________________________ Rate: __________________________ P waves: ________________________
- PR interval: ______________________ QRS duration: _____________________ QT interval: _____________________
- ST depression: __________ ST elevation: __________ Other findings: ____________________
- Interpretation: _____________________________________________________________________________________
- 40. Analyze this 12-lead ECG and record your findings below.
-
- Rhythm: __________________________ Rate: __________________________ P waves: ________________________
- PR interval: ______________________ QRS duration: _____________________ QT interval: _____________________
- ST depression: __________ ST elevation: __________ Other findings: ____________________
- Interpretation: _____________________________________________________________________________________
- 41. Analyze this 12-lead ECG and record your findings below.

-
- Rhythm: __________________________ Rate: __________________________ P waves: ________________________
- PR interval: ______________________ QRS duration: _____________________ QT interval: _____________________
- ST depression: __________ ST elevation: __________ Other findings: ____________________
- Interpretation: _____________________________________________________________________________________
- 42. Analyze this 12-lead ECG and record your findings below.

-
- Rhythm: __________________________ Rate: __________________________ P waves: ________________________
- PR interval: ______________________ QRS duration: _____________________ QT interval: _____________________
- ST depression: __________ ST elevation: __________ Other findings: ____________________
- Interpretation: _____________________________________________________________________________________
- 43. Analyze this 12-lead ECG and record your findings below.

-
- Rhythm: __________________________ Rate: __________________________ P waves: ________________________
- PR interval: ______________________ QRS duration: _____________________ QT interval: _____________________
- ST depression: __________ ST elevation: __________ Other findings: ____________________
- Interpretation: _____________________________________________________________________________________
- 44. Analyze this 12-lead ECG and record your findings below.

-
- Rhythm: __________________________ Rate: __________________________ P waves: ________________________
- PR interval: ______________________ QRS duration: _____________________ QT interval: _____________________
- ST depression: __________ ST elevation: __________ Other findings: ____________________
- Interpretation: _____________________________________________________________________________________
- 45. Analyze this 12-lead ECG and record your findings below.

-
- Rhythm: __________________________ Rate: __________________________ P waves: ________________________
- PR interval: ______________________ QRS duration: _____________________ QT interval: _____________________
- ST depression: ____________________ ST elevation: ____________________ Other findings: _____________________
- Interpretation: _____________________________________________________________________________________
- 46. Analyze this 12-lead ECG and record your findings below.

-
- Rhythm: __________________________ Rate: __________________________ P waves: ________________________
- PR interval: ______________________ QRS duration: _____________________ QT interval: _____________________
- ST depression: __________ ST elevation: __________ Other findings: ____________________
- Interpretation: _____________________________________________________________________________________
Stop & review answers
- 1. C. An acute coronary syndrome diagnosis is based on the patient’s clinical presentation, history, ECG findings, and cardiac biomarker results. If ST segments are elevated in two contiguous leads, and elevated cardiac biomarkers are present, the diagnosis is STEMI. If ST elevation is not present, but biomarker levels are elevated, the diagnosis is NSTEMI. If the ST segments are not elevated, and cardiac biomarkers are not elevated, the diagnosis is unstable angina.
- 2. B. The criteria for bundle branch block recognition may be found in any lead of the ECG. However, when differentiating RBBB from LBBB, pay particular attention to the QRS morphology (i.e., shape) in specific leads. Lead V1 is probably the single best lead to use when differentiating between RBBB and LBBB.
- 3. B. Current flow to the left of normal is called left axis deviation (between −30 and −90 degrees). If the QRS complex is predominantly positive in I and negative in aVF, left axis deviation is present.
- 4. D. When evaluating the ECG for chamber enlargement, it is essential to check the calibration marker to ensure that it is 10 mm (1 mV) tall.
- 5. B. Hyperacute (i.e., tall) T waves are sometimes called “tombstone” T waves and typically measure more than 50% of the preceding R wave. In addition to an increase in height, the T wave becomes more symmetric and may become pointed. These changes are often not recorded on the ECG because they have typically resolved by the time the patient seeks medical assistance.
- 6. C. The right ventricle is supplied by the right ventricular marginal branch of the RCA. Occlusion of the right ventricular marginal branch results in an isolated right ventricular infarction (RVI). Occlusion of the RCA proximal to the right ventricular marginal branch results in an inferior and right ventricular infarction. RVI should be suspected when ECG changes suggesting an inferior infarction are seen.
- 7. C, F. ECG signs of hyperkalemia may include:
- 8. E. Sodium disturbances do not cause any significant changes on the ECG.
- 9. A, F. The septum, which contains the bundle of His and bundle branches, is usually supplied by the left anterior descending coronary artery. ECG changes of infarction are seen in leads V1 and V2 if the site of infarction is limited to the septum. If the entire anterior wall is involved, ECG changes will be visible in V1, V2, V3, and V4. A blockage in this area may result in both right and left bundle branch blocks, second-degree atrioventricular (AV) block type II, and third-degree AV block.
- 10. A. In adults, the normal QRS axis is considered to be between −30 and +90 degrees in the frontal plane. Current flow to the right of normal is called right axis deviation (between +90 and ±180 degrees). Current flow in the direction opposite of normal is called indeterminate, “no man’s land,” northwest, or extreme right axis deviation (between −90 and ±180 degrees). Current flow to the left of normal is called left axis deviation (between −30 and −90 degrees).
- 11. B. In a patient experiencing an acute coronary syndrome, T-wave inversion suggests the presence of myocardial ischemia.
- 12. D. In the hexaxial reference system, the axes of some leads are perpendicular to each other. For example, lead II is perpendicular to aVL, lead I is perpendicular to lead aVF, and lead III is perpendicular to lead aVR.
- 13. A, C. Ventricular muscle thickens (i.e., hypertrophies) when it sustains a persistent pressure overload. Dilatation occurs because of persistent volume overload. The two often go hand in hand. Hypertrophy increases the QRS amplitude and is often associated with ST-segment depression and asymmetric T-wave inversion. Because the right ventricle is normally considerably smaller than the left, it must become significantly enlarged before changes are visible on the ECG. Leads V1, V5, and V6 are used when looking for ECG evidence of hypertrophy.
Matching
Practice 12-lead electrocardiograms answers
Note: The rate and interval measurements provided here were obtained using electronic calipers.
- 34. Fig. 9.38
- Rhythm and rate: Sinus tachycardia at 101 beats/min
- QRS axis: Left
- PR interval: 0.16 second
- QRS duration: 0.13 second
- QT interval: 0.35 second
- ST depression/elevation: Depression in I, II, aVL, V1 to V2
- Other findings: T waves inverted in V1 to V2
- Interpretation: Sinus tachycardia at 101 beats/min with RBBB
- 35. Fig. 9.39
- 36. Fig. 9.40
- Rhythm and rate: Sinus rhythm at 60 beats/min
- QRS axis: Left
- PR interval: 0.16 second
- QRS duration: 0.14 second
- QT interval: 0.42 second
- ST depression/elevation: Elevation V1 to V4; depression in I, aVL, V5, V6
- Other findings: T waves inverted in I, aVL, V5, V6
- Interpretation: Sinus rhythm at 60 beats/min; possible STEMI/new-onset LBBB; consider clinical presentation
- 37. Fig. 9.41
- 38. Fig. 9.42
- Rhythm and rate: Sinus rhythm at 86 beats/min
- QRS axis: Normal
- PR interval: 0.14 second
- QRS duration: 0.09 second
- QT interval: 0.35 second
- ST depression/elevation: Elevation noted in V1 to V4
- Other findings: T waves inverted in III; tall, peaked in V2 to V4; baseline wander in V6
- Interpretation: Sinus rhythm at 86 beats/min. Anteroseptal infarction; STE noted in V1 to V4. Tall, peaked T waves in V2 to V4. Reciprocal changes noted in III, subtle changes in II and aVF.
- 39. Fig. 9.43
- Rhythm and rate: Sinus rhythm at 92 beats/min
- QRS axis: Normal
- PR interval: 0.15 second
- QRS duration: 0.11 second
- QT interval: 0.36 second
- ST depression/elevation: Elevation in II, III, aVF; depression in I, aVL, V1 to V4
- Other findings: Pathologic Q waves in II, III, aVF; baseline wander in I, II, III
- Interpretation: Sinus rhythm at 92 beats/min. Inferior STEMI; STE noted in II, III, and aVF. Reciprocal change noted in aVL. ST depression in V1 to V4 suggests possible posterior involvement; consider obtaining posterior leads. Obtain V4R to assess for right ventricular infarction.
- 40. Fig. 9.44
- Rhythm and rate: Atrial fibrillation at 81 beats/min
- QRS axis: Left
- PR interval: None
- QRS duration: 0.09 second
- QT interval: 0.39 second
- ST depression/elevation: Elevation in I, aVL; depression in II, III, aVF
- Other findings:
- Interpretation: Atrial fibrillation at 81 beats/min. Lateral STEMI; reciprocal changes noted in II, III, and aVF.
- 41. Fig. 9.45
- Rhythm and rate: Junctional rhythm at 55 beats/min
- QRS axis: Normal
- PR interval: None
- QRS duration: 0.10 second
- QT interval: 0.45 second
- ST depression/elevation: Elevation in II, III, aVF; depression in I, aVL, V1 to V4
- Other findings: T waves inverted in aVL, V1
- Interpretation: Junctional rhythm at 55 beats/min. Inferior STEMI; reciprocal changes noted in aVL. Obtain V4R to assess for right ventricular infarction.
- 42. Fig. 9.46
- Rhythm and rate: Atrial fibrillation at 115 beats/min
- QRS axis: Normal
- PR interval:
- QRS duration: 0.10 second
- QT interval: 0.36 second
- ST depression/elevation: Elevation in II, III, aVF, V5, V6; depression in I, aVL, V1 to V3
- Other findings: T waves inverted in V1, V2
- Interpretation: Atrial fibrillation at 115 beats/min. Inferolateral STEMI; reciprocal changes in I and aVL. Obtain V4R to assess for right ventricular infarction. ST-segment depression in V1 to V3 suggests possible posterior involvement; consider obtaining posterior leads.
- 43. Fig. 9.47
- Rhythm and rate: Sinus bradycardia at 56 beats/min
- QRS axis: Normal
- PR interval: 0.11 second
- QRS duration: 0.10 second
- QT interval: 0.46 second
- ST depression/elevation: Elevation in V1 to V4; depression in II, III, aVF
- Other findings: Tall T waves in V2 to V4
- Interpretation: Sinus bradycardia at 56 beats/min. Suspected anteroseptal STEMI; reciprocal changes noted in II, III, aVF. Short PR interval.
- 44. Fig. 9.48
- Rhythm and rate: Supraventricular bradycardia at 42 beats/min
- QRS axis: Normal
- PR interval: None
- QRS duration: 0.09 second
- QT interval: 0.52 second
- ST depression/elevation: Elevation in II, III, aVF, V5 to V6; depression in I, aVL
- Other findings: Tall T waves in II, III, aVF
- Interpretation: Supraventricular bradycardia at 42 beats/min. Inferolateral STEMI; reciprocal changes in I and aVL. Prolonged QT interval. Obtain V4R to assess for right ventricular infarction.
- 45. Fig. 9.49
- 46. Fig. 9.50
- Rhythm and rate: Sinus tachycardia at 113 beats/min with first-degree AV block and LBBB
- QRS axis: Normal
- PR interval: 0.33 second
- QRS duration: 0.15 second
- QT interval: 0.33 second
- ST depression/elevation: Elevation in V1 to V3
- Other findings: Artifact in limb leads
- Interpretation: Sinus tachycardia at 113 beats/min with first-degree AV block. Possible anteroseptal STEMI; however, wide QRS and LBBB pattern are also present. Consider clinical presentation and obtain serial ECGs.
References
El-Sherif N, Turitto G. & Robotis D. Arrhythmias and electrolyte disorders Electrophysiological disorders of the heart 2nd ed. 2012; Saunders Philadelphia 865-874.
Ganz L. & Link M.S. Electrocardiography Goldman-Cecil medicine 26th ed. 2020; Elsevier Philadelphia 246-253.
Goldberger A.L, Goldberger Z.D. & Shvilkin A. Atrial and ventricular enlargement Goldberger’s clinical electrocardiography 9th ed. 2018; Elsevier Philadelphia 50-60.
Halim S.A, Newby K. & Ohman E.M. Diagnosis of acute myocardial ischemia and infarction Cardiology 3rd ed. 2010; Elsevier Philadelphia 345-360.
Hancock E.W, Drew B.J, Mirvis D.M, Okin P, Kligfield P. & Gettes L.S. AHA/ACCF/HRS recommendations for the standardization and interpretation of the electrocardiogram: Part V: Electrocardiogram changes associated with cardiac chamber hypertrophy J Am Coll Cardiol 11, 2009;53: 992-1002.
Kumar V, Abbas A.K. & Aster J.C. Heart Robbins Basic Pathology 10th ed. 2018; Elsevier Philadelphia 399-441.
Latcu D. & Nadir S. Atrioventricular and intraventricular conduction disorders Cardiology 3rd ed. 2010; Elsevier Philadelphia 725-739.
Mirvis D.M. & Goldberger A.L. Electrocardiography Braunwald’s heart disease: A textbook of cardiovascular medicine 11th ed. 2019; Elsevier Philadelphia 117-153.
O’Gara P.T, Kushner F.G, Ascheim D.D, Casey Jr. D.E, Chung M.K, de Lemos J.A. & Zhao D.X. 2013 ACCF/AHA guideline for the management of ST-elevation myocardial infarction J Am Coll Cardiol 4, 2013;61: e78-e140.
Otto C.M. Cardiomyopathies, hypertensive and pulmonary heart disease Textbook of clinical echocardiography 6th ed. 2018; Elsevier Philadelphia 235-267.
Phalen T. & Aehlert B. ST-elevation variants The 12-lead ECG in acute coronary syndromes 4th ed. 2019; Elsevier St. Louis 78-97.
Sharma E. & Morrison A.R. Diagnostic tests and procedures in the patient with cardiovascular disease Cecil essentials of medicine 10th ed. 2022; Elsevier Philadelphia 24-42.
Stanton B.A. & Koeppen B.M. Potassium, calcium, and phosphate homeostasis Berne & Levy physiology 7th ed. 2018; Elsevier Philadelphia 647-669.
Surawicz B, Childers R, Deal B.J. & Gettes L.S. AHA/ACCF/HRS recommendations for the standardization and interpretation of the electrocardiogram: Part III: Intraventricular conduction disturbances: A scientific statement from the American Heart Association Electrocardiography and Arrhythmias Committee J Am Coll Cardiol 11, 2009;53: 976-981.
Surawicz B. & Knilans T.K. Atrial abnormalities Chou’s electrocardiography in clinical practice 6th ed. 2008; Saunders Philadelphia 29-44.
Tan N.Y, Witt C.M, Oh J.K. & Cha Y.-M. Left bundle branch block: Current and future perspectives Circ Arrhythm Electrophysiol 4, 2020;13: e008239.
Thygesen K, Alpert J.S, Jaffe A.S, Chaitman B.R, Bax J.J, Morrow D.A. & White H.D. Fourth universal definition of myocardial infarction J Am Coll Cardiol 18, 2018;72: 2231-2264.