Cerebrospinal Fluid Analysis
After studying this chapter, the student should be able to:
- 1. Describe the formation of cerebrospinal fluid (CSF) and state at least three functions that the CSF performs.
- 2. Describe the procedure for lumbar puncture and the proper collection technique for CSF.
- 3. Discuss the importance of timely processing and testing of CSF and state at least three adverse effects of time delay on CSF specimens.
- 4. State the physical characteristics of normal CSF and discuss how each characteristic can be modified in disease states.
- 5. Discuss the clinical importance of the microscopic examination of CSF.
- 6. Compare and contrast the concentrations of the following constituents of CSF in health and in disease states:
- 7. Briefly describe protein electrophoretic patterns of CSF and the abnormal presence of oligoclonal banding.
- 8. Calculate the CSF/serum albumin index and the CSF/immunoglobulin G index and state the clinical importance of each index.
- 9. Discuss the proper microbiological examination of CSF and its importance in the diagnosis of infectious diseases of the central nervous system.
- 10. Briefly explain the role of CSF immunologic tests in the diagnosis of meningitis.
Key Terms1
Physiology and Composition
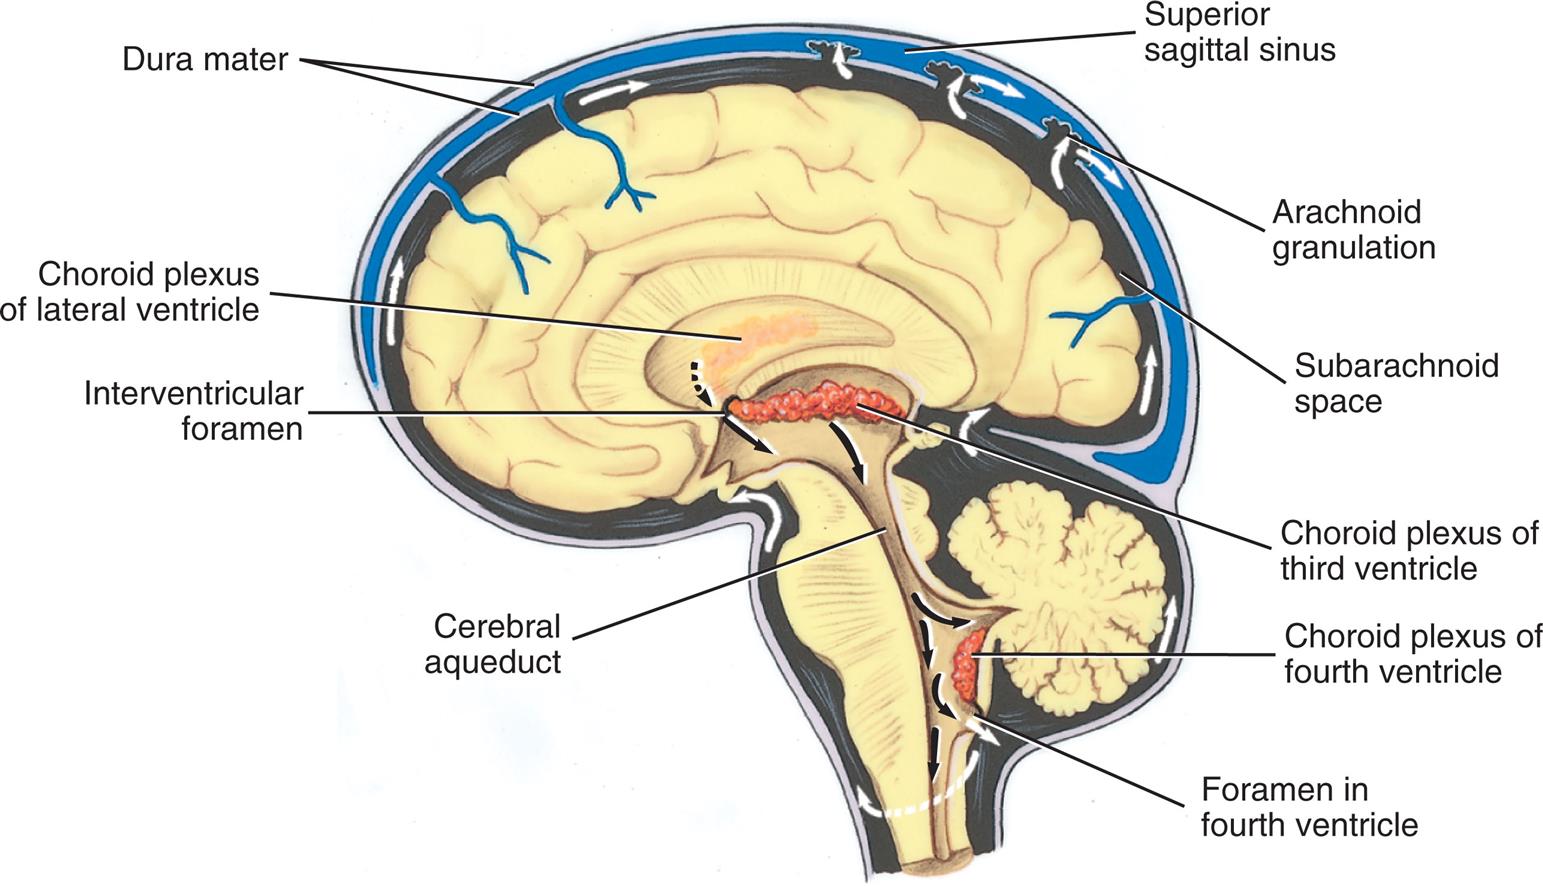
Cerebrospinal fluid (CSF) bathes the brain and spinal cord. CSF is produced primarily (70%) from secretions into the four ventricles of the brain by the highly vascular choroid plexus (vascular fringe–like folds in the pia mater). The ependymal cells that line the brain and spinal cord also play a minor role in the production of CSF. The formation of CSF can be described as a selective secretion from plasma, not as an ultrafiltrate. This is evidenced by higher CSF concentrations of some solutes (e.g., sodium, chloride, magnesium) and lower CSF concentrations of other solutes (e.g., potassium, total calcium) compared to plasma. If simple ultrafiltration were responsible for CSF production, these solute concentration differences would not exist.
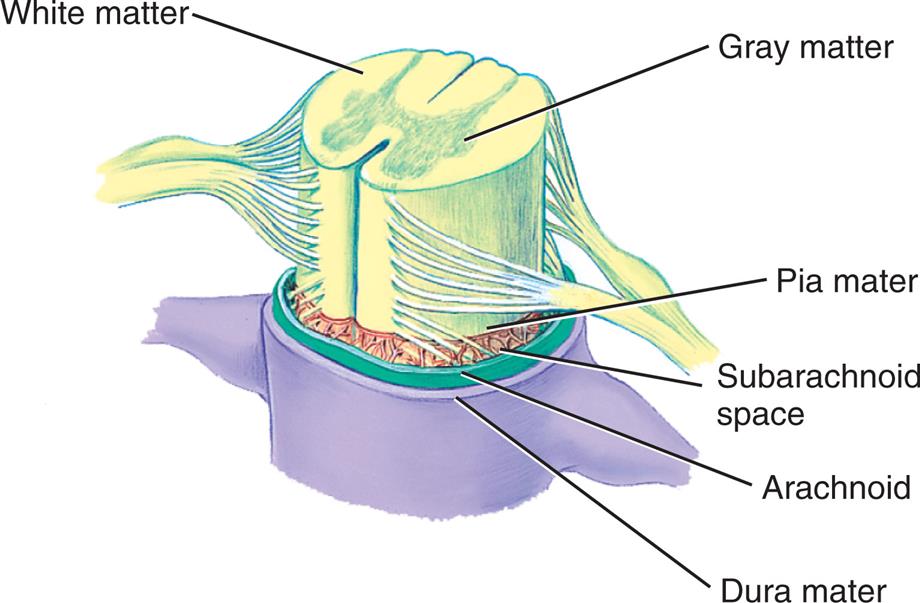
The brain and spinal cord are surrounded by three membranes, collectively termed the meninges. The tough outermost membrane, the dura mater, is next to the bone. The arachnoid (also called arachnoidea), or middle layer, derives its name from its visual resemblance to a spider web. The innermost membrane, the pia mater, adheres to the surface of the neural tissues (Fig. 9.1). Cerebrospinal fluid flows in the space between the arachnoidea mater and the pia mater, called the subarachnoid space, where it bathes and protects the delicate tissues of the central nervous system (CNS). From its initial formation in the ventricles, the CSF circulates to the brainstem and spinal cord, principally through pressure changes caused by postural, respiratory, and circulatory pressures (Fig. 9.2). The CSF eventually flows in the subarachnoid space to the top outer surface of the brain, where projections of the arachnoid membrane called arachnoid granulations are present. These projections have small, one-way valvelike structures that allow the CSF to enter the bloodstream of the large veins of the head. Cerebrospinal fluid formation, circulation, and reabsorption into the blood make up a dynamic process that constantly turns over about 20 mL each hour.1 If the flow path between production and reabsorption of CSF into the blood is obstructed for any reason, CSF accumulates, producing hydrocephalus; intracranial pressure can increase, causing brain damage, intellectual and developmental disabilities, or death if left untreated. Normally, the total volume of CSF in an adult ranges from 85 to 150 mL. The volume in neonates is significantly smaller, ranging from 10 to 60 mL.
The CSF protects and supports the brain and spinal cord and provides a medium for the transport and exchange of nutrients and metabolic wastes. The capillary endothelium in contact with CSF enables the transfer of substances from the blood into the CSF and vice versa. This capillary endothelium differs from the endothelium in other tissues by the presence of tight junctions between adjacent endothelial cells. These tight junctions significantly reduce the extracellular passage of substances from the blood plasma into the CSF. In other words, all substances that enter or leave the CSF must pass through the membranes and cytoplasm of the capillary endothelial cells. This modulating interface between the blood and the CSF is called the blood-brain barrier and accounts for the observed concentration differences of electrolytes, proteins, and other solutes. An example of the selectivity and effectiveness of this blood-brain barrier is the failure of some antibiotics (e.g., penicillins), given intravenously, to enter the CSF, although these antibiotics freely penetrate all other tissues of the body.
In healthy individuals, the chemical composition of CSF is closely regulated and includes low-molecular-weight proteins. Changes in the chemical composition or in the cellular components can aid in the diagnosis of disease. Protein, glucose, and lactate are routinely measured in CSF. Although numerous other parameters (e.g., sodium, potassium, chloride, magnesium, pH, PCO2, enzymes) have been evaluated for clinical use, they have yet to prove their diagnostic value. In addition to chemical analysis, CSF is routinely cultured for microbial organisms, examined microscopically to evaluate the cellular components, and tested for the presence of specific antigens. These cytologic, microbiological, and immunologic studies can provide valuable diagnostic information. For CSF reference intervals, see Table 9.1 or Appendix C.
Table 9.1
| Physical Examination | |
| Color | Colorless |
| Clarity | Clear |
| Chemical Examination | |||
|---|---|---|---|
| Component | Conventional Units | Conversion Factor | SI Units |
| Electrolytes | |||
| Calcium | 2.0–2.8 mEq/L | 0.5 | 1.00–1.40 mmol/L |
| Chloride | 115–130 mEq/L | 1 | 115–130 mmol/L |
| Lactate | 10–22 mg/dL | 0.111 | 1.1–2.4 mmol/L |
| Magnesium | 2.4–3.0 mEq/L | 0.5 | 1.2–1.5 mmol/L |
| Potassium | 2.6–3.0 mEq/L | 1 | 2.6–3.0 mmol/L |
| Sodium | 135–150 mEq/L | 1 | 135–150 mmol/L |
| Glucose | 50–80 mg/dL | 0.5551 | 2.8–4.4 mmol/L |
| Total protein | 15–45 mg/dL | 10 | 150–450 mg/L |
| Albumin | 10–30 mg/dL | 10 | 100–300 mg/L |
| IgG | 1–4 mg/dL | 10 | 10–40 mg/L |
| Protein Electrophoresis | Percent of Total Protein |
|---|---|
| Transthyretin (prealbumin) | 2–7% |
| Albumin | 56–76% |
| α1-Globulin | 2–7% |
| α2-Globulin | 4–12% |
| β-Globulin | 8–18% |
| γ-Globulin | 3–12% |
| Microscopic Examination | |||
|---|---|---|---|
| Component | Conventional Units | Conversion Factor | SI Units |
| Neonates (<1 year old) | 0–30 cells/μL | 106 | 0–30 × 106 cells/L |
| 1–4 years old | 0–20 cells/μL | 106 | 0–20 × 106 cells/L |
| 5–18 years old | 0–10 cells/μL | 106 | 0–10 × 106 cells/L |
| Adults (>18 years old) | 0–5 cells/μL | 106 | 0–5 × 10⁶ cells/L |
| Differential Cell Count | Percent of Total Count |
|---|---|
| Neonates | |
| Lymphocytes | 5–35% |
| Monocytes | 50–90% |
| Neutrophils | 0–8% |
| Adults | |
| Lymphocytes | 40–80% |
| Monocytes | 15–45% |
| Neutrophils | 0–6% |
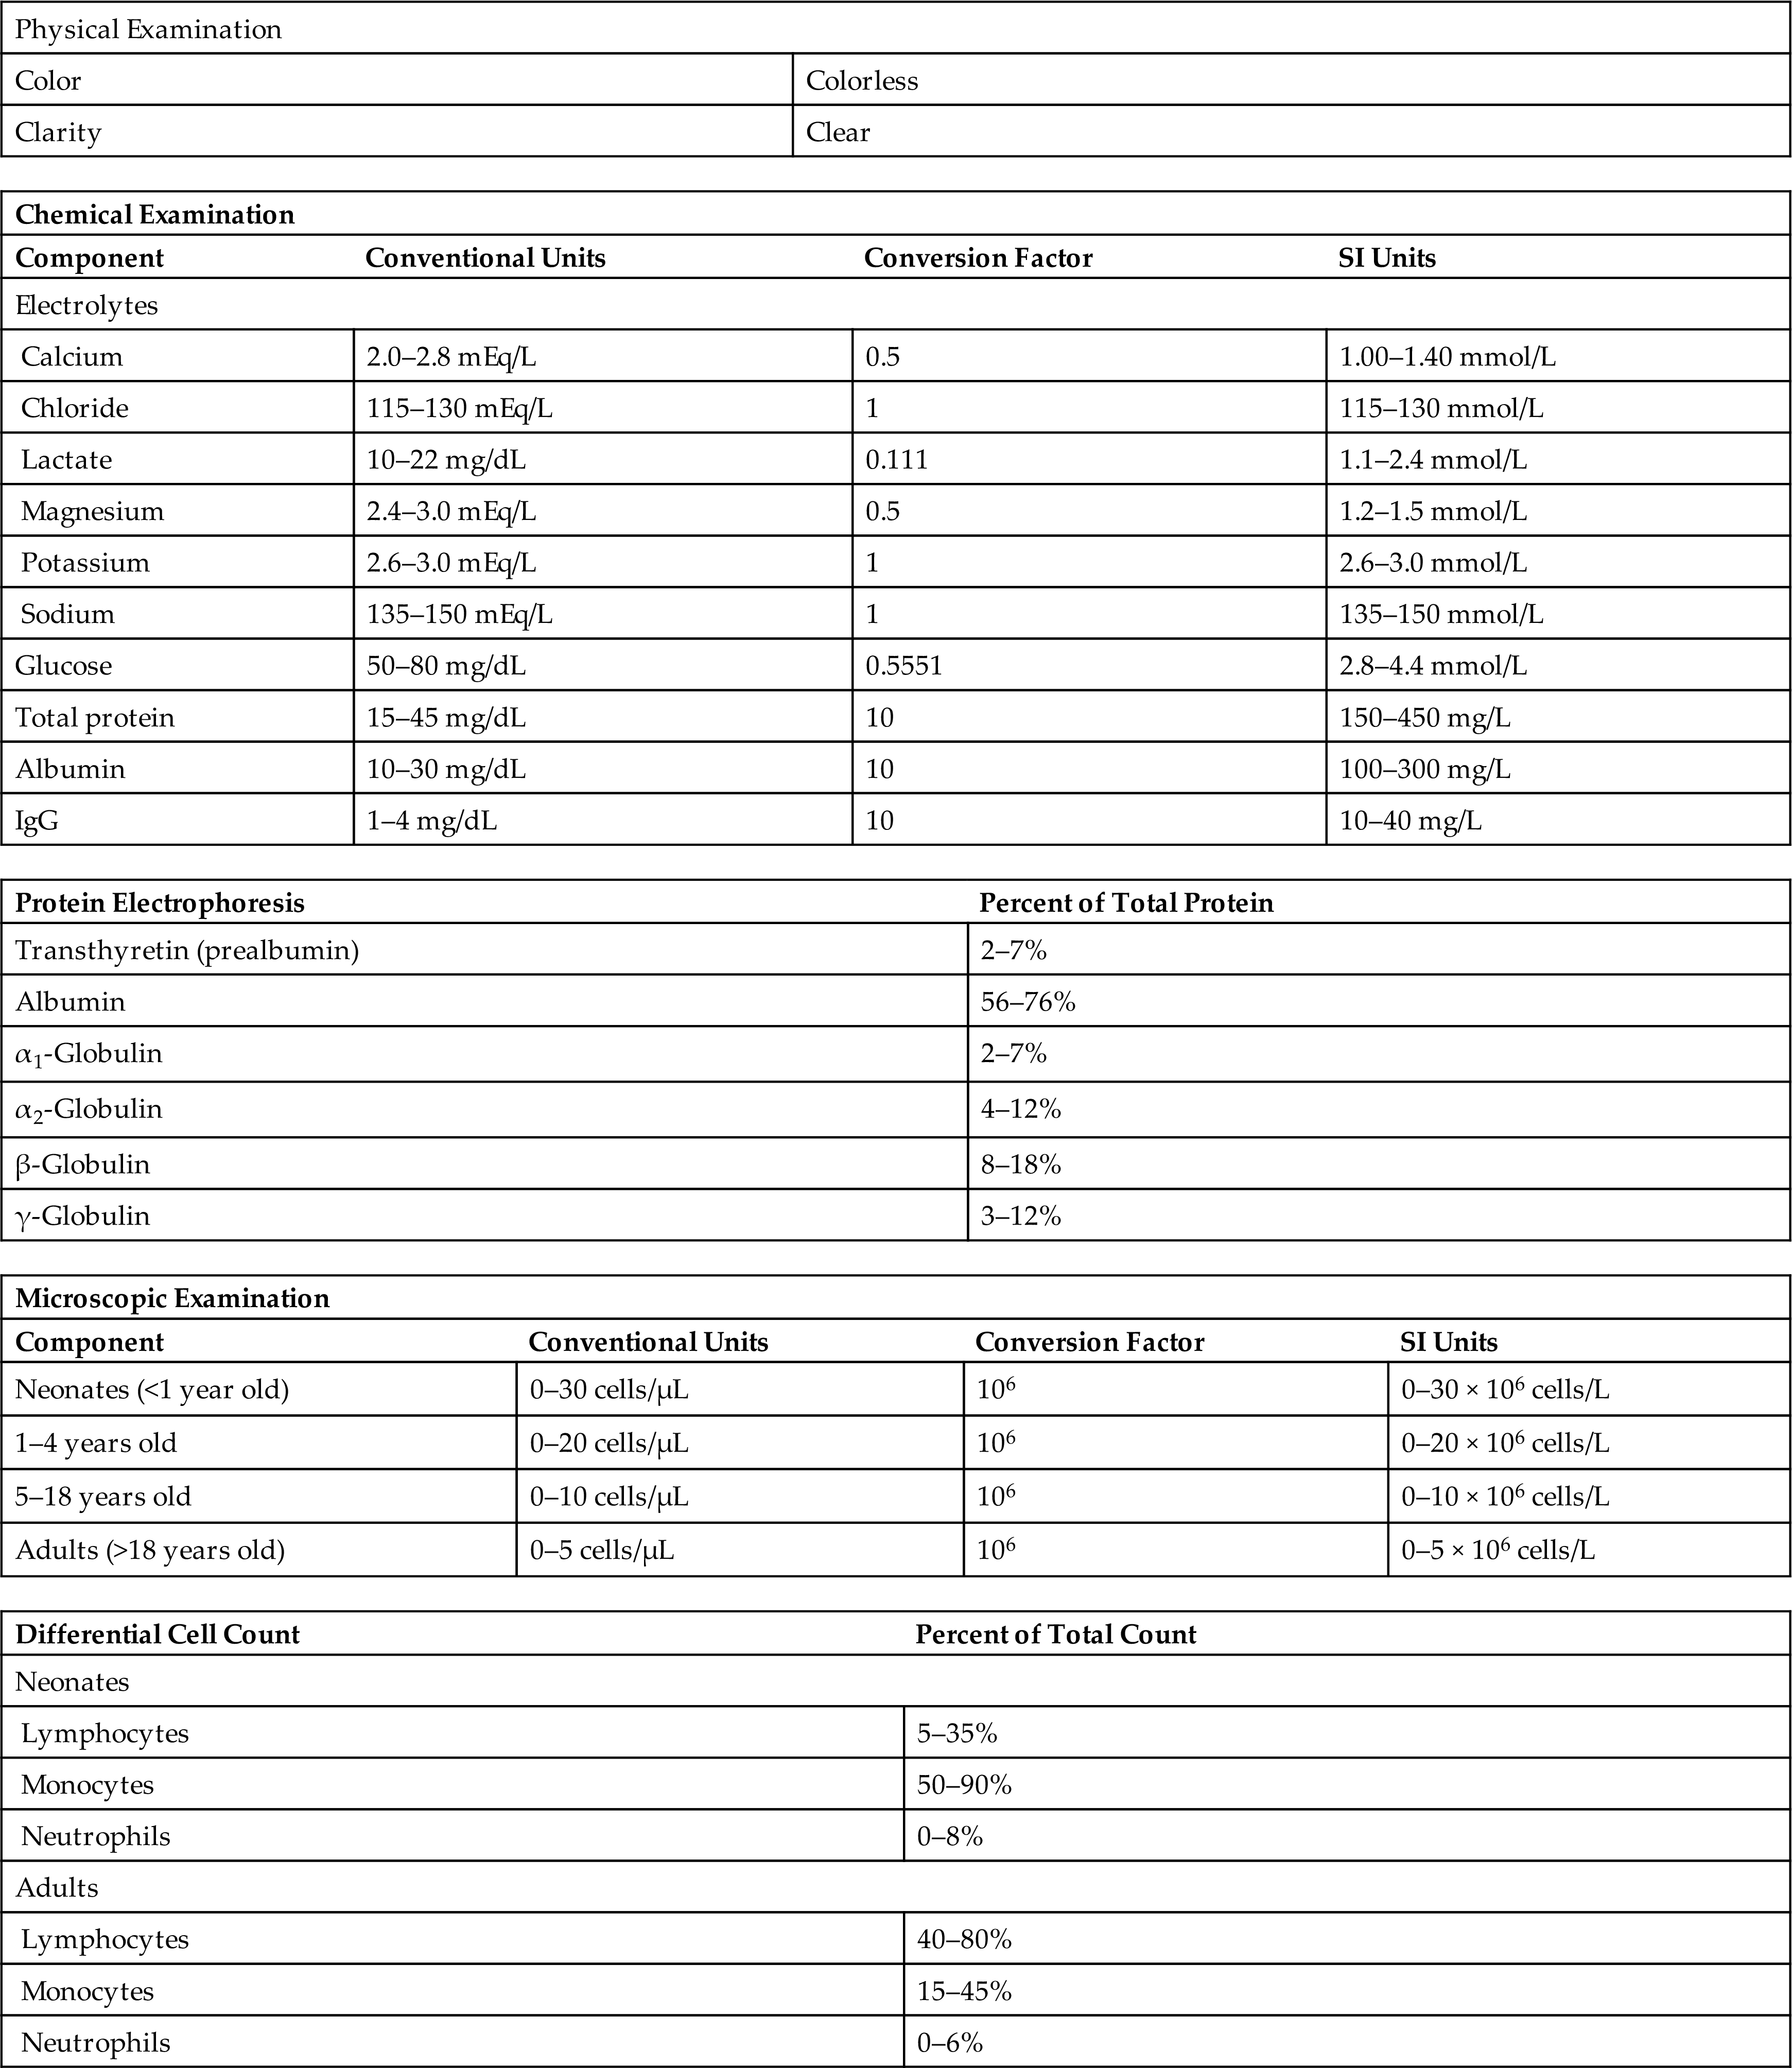
aFor cerebrospinal fluid specimens obtained by lumbar puncture.
Specimen Collection
Cerebrospinal fluid specimens are collected specifically for the diagnosis or treatment of disease (Box 9.1). Although the lumbar puncture principally used to obtain CSF specimens is fairly routine, it involves significant patient discomfort and can cause complications. Therefore once a CSF specimen has been collected, it is imperative that it is properly labeled and handled at the bedside and in the laboratory.
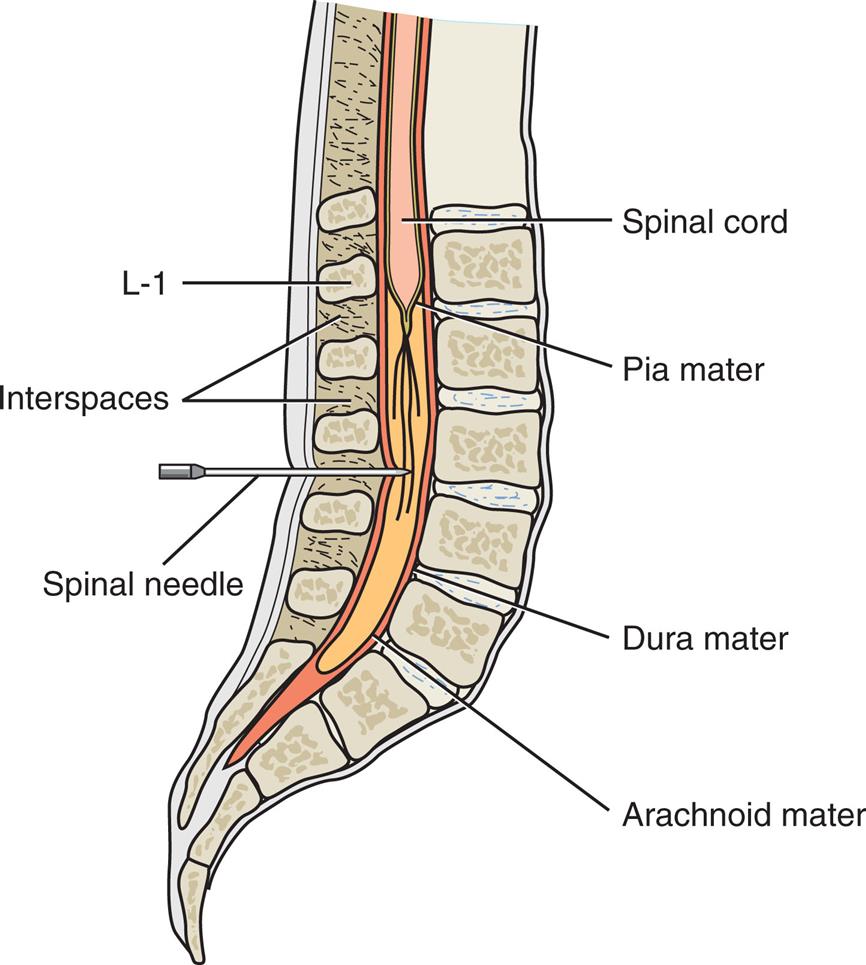
Usually a physician performs a lumbar puncture in the third or fourth lumbar interspace (or lower) in adults or in the fourth or fifth interspace in children (Fig. 9.3). The puncture site selection can vary if an infection is present at the preferred site. A locally infected site must be avoided to prevent introduction of the infection into the CNS. The lumbar puncture procedure is performed aseptically after thorough cleansing of the patient’s skin and the application of a local anesthetic. The spinal needle is advanced into the lumbar interspace, and often a “pop” is heard on penetration of the dura mater. Immediately after the dura mater has been entered and before any CSF has been removed, the physician takes the initial or “opening” pressure of the CSF using a manometer that attaches to the spinal needle. Normal CSF pressures for an adult in a lateral recumbent position range from 50 to 180 mm Hg, with slightly higher pressures obtained from individuals in a sitting position. If the pressure is in the normal range, up to 20 mL of CSF (approximately 15% of the estimated total CSF volume) can be removed safely. If the CSF pressure is less than or greater than normal, only 1 to 2 mL should be removed. Because the total volume of CSF is significantly smaller in infants and children, proportionately smaller volumes are collected from them. After the CSF has been removed and before the spinal needle has been withdrawn, the physician takes the “closing” CSF pressure, which should be 10 to 30 mm Hg less than the opening pressure. Both CSF pressure values and the amount of CSF removed are recorded in the patient’s chart.
As CSF is collected, it is dispensed into three (or more) sequentially labeled sterile collection tubes. The first tube is used for chemical and immunologic testing, because any minimal blood contamination resulting from vessel injury during the initial tap normally does not affect these results. The second tube is used for microbial testing, and the third tube is reserved for the microscopic examination of cellular components (i.e., red and white blood cell counts and cytologic studies). If only a small amount of CSF is obtained and a single collection tube must be used, the ordering physician prioritizes the tests desired. With these low-volume specimens, it is imperative that a portion of the specimen is maintained sterile when microbiology tests are ordered. This can be achieved by having the microbiology laboratory receive and process the specimen first, or, by using sterile technique, a sufficient volume of the specimen is transferred to another container for cell counts and any chemical or immunologic tests requested.
The examination and testing of CSF should take place as soon as possible after collection. Therefore in most institutions, tests ordered on CSF specimens are considered stat. Delay in testing can cause inaccurate results, such as falsely low cell counts caused by the lysis of white blood cells or falsely high lactate levels caused by glycolysis. In addition, the recovery of viable microbial organisms is jeopardized. When delay is unavoidable, each CSF collection tube must be stored at the temperature that best ensures recovery of the constituents of interest (Table 9.2). Any CSF remaining after the initial tests have been performed can be frozen and saved for possible future chemical or immunologic studies.
Physical Examination
Normal CSF is clear and colorless, with a viscosity similar to that of water. Increased viscosity, although rare, can occur as a result of metastatic, mucin-secreting adenocarcinomas. Abnormally increased amounts of fibrinogen in CSF caused by a compromised blood-brain barrier can result in clot formation. Fine, delicate clots can form a thin film or pellicle on the surface of CSF after it has been stored at refrigerator temperatures for 12 or more hours. Most often, clot formation is associated with a traumatic puncture procedure, in which blood and plasma proteins contaminated the CSF. Rarely, no blood is present in the CSF, and clots form as a result of elevated CSF protein levels with conditions such as Froin’s syndrome or suppurative or tuberculous meningitis, or as a result of subarachnoid obstruction. Despite the various possibilities for clot formation, clots rarely are encountered, even in patients with pathologic conditions. If present, however, clot formation must be noted and reported.
Because a CSF specimen is collected into three or more collection tubes and all tubes may not be sent to the same laboratory area, the testing personnel must examine and individually assess each tube for clarity, color, and volume. The clarity or turbidity of CSF depends on its cellularity. Pleocytosis, an increase in the number of cells in CSF, causes the CSF to appear cloudy to varying degrees. A cloudy CSF specimen is associated with a white blood cell count greater than 200 cells/μL or a red blood cell count exceeding 400 cells/μL. Similarly, microorganisms or an increased protein content can produce cloudy CSF specimens. Cerebrospinal fluid clarity can be graded semiquantitatively from 0 (clear) to 4+ (newsprint cannot be read through the fluid) using standardized criteria to ensure consistency in reporting. Occasionally, the CSF may appear oily because of the presence of radiographic contrast media.
Although normal CSF is colorless, in disease states it often appears xanthochromic. Although xanthochromia literally means a yellow discoloration, this term is applied to a spectrum of CSF discolorations, including pink, orange, and yellow. A pink supernatant after centrifugation results from oxyhemoglobin, a yellow supernatant results from bilirubin, an orange supernatant results from a combination of these, and a brownish supernatant results from methemoglobin formation. High concentrations of other substances, such as carotene, and protein in concentrations greater than 150 mg/dLcan cause xanthochromic CSF specimens, as can conditions such as meningeal melanoma or collection of the CSF 2 to 5 days after a traumatic tap (Box 9.2).
Hemorrhage or Traumatic Tap
Gross blood in CSF is visually apparent, and determining its source requires differentiation between a traumatic puncture procedure and a subarachnoid or intracerebral hemorrhage. Several observations can aid in making this differentiation (Table 9.3). First, a traumatic tap results in the greatest amount of blood collected in the first specimen tube. Hence a visual assessment or a comparison of the RBC count between tube 1 and tube 3 (or 4) will show a significant difference (decrease). In contrast, a hemorrhage results in a homogeneous distribution of RBCs throughout all collection tubes.
Table 9.3
Second, after centrifugation of CSF, when the supernate is colorless, it points to a traumatic tap. In contrast, a xanthochromic supernate indicates a previous hemorrhage. It takes 1 to 2 hours for RBC lysis to occur in CSF and for the formation of the compounds that produce xanthochromia.2 The lysis of RBCs observed in CSF is not osmotically induced because plasma and CSF are osmotically equivalent; rather, it is speculated that the lack of sufficient CSF proteins and lipids needed to stabilize RBC membranes causes the lysis. Because lysis can occur in vivo or in vitro, timely processing and testing of CSF specimens are necessary. Once RBC lysis has occurred in CSF, xanthochromia can be evident as early as 2 hours after the hemorrhage and persist for as long as 4 weeks.3
Lastly, when the microscopic examination of CSF reveals macrophages with phagocytosed RBCs (erythrophages), it indicates either a hemorrhage or a previous traumatic tap. As hemoglobin from RBCs is processed within macrophages, they become siderophages (i.e., cells with intracellular hemosiderin granules), and hematin crystals may be present. See subsection Macrophages later in this chapter for additional discussion and a timeline of the cellular findings in CSF following a hemorrhage or traumatic tap.
Microscopic Examination
The CSF of adults normally contains a small number of white blood cells (WBCs), specifically, lymphocytes and monocytes at 0 to 5 cells/μL. Similarly low numbers of WBCs (0–10 cells/μL) are expected in children, whereas healthy neonates can have up to 30 WBCs/μL, with monocytes predominating.
In contrast, RBCs are not normally present in CSF. When present, RBCs most often represent CSF contamination with peripheral blood during the lumbar puncture procedure. Rarely, RBCs are present because of a recent (within 1 or 2 hours) subarachnoid or cerebral hemorrhage.
Cell counts on CSF must be performed as soon as possible to ensure valid results. At room temperature, 40% of the WBCs in CSF will lyse in 2 hours.4 If the specimen is refrigerated, WBC lysis can be reduced significantly to approximately 15%, but not completely prevented. Similarly, RBCs do not demonstrate significant lysis at 4°C; therefore the CSF collection tube for cell counts should be refrigerated if the count must be delayed for any reason.
Depending on the testing institution, different approaches to CSF cell counts are possible. Some laboratories do not perform a total cell count; instead, they perform individual RBC and WBC counts. The sum of these two counts is equivalent to a total cell count. Other laboratories perform a total cell count and a WBC count; the difference between these counts is the RBC count.
Total Cell Count
Despite being labor intensive and technically challenging with low precision, cell counts on CSF are often performed manually. Chapter 17 describes a manual procedure for performing CSF and other cell counts using a hemacytometer, and Appendix D provides details for preparing the various diluents that can be used. Commercial control materials are available to monitor the technical performance of personnel performing manual hemacytometer cell counts. However, it is possible to prepare “in-house” simulated CSF specimens using the method developed by Lofsness and Jensen.5 These simulated specimens can be used (1) as quality control samples, (2) as samples for training, or (3) for competency assessment of laboratory personnel.
Total cell counts on CSF are usually made using well-mixed, undiluted CSF. Because of the low viscosity and protein content of CSF, cells settle within 1 minute after filling the hemacytometer chambers. When counting clear CSF, the standard of practice is to count all nine large squares on both sides of the hemacytometer. When the number of cells in the nine squares exceeds 200 or is crowded or overlapping, the CSF should be diluted with isotonic saline. Dilutions vary according to the concentrations of cells present. Sometimes an initial dilution may be selected based on the visual appearance of the fluid, ranging from a 1:10 dilution for a slightly cloudy specimen to a 1:10,000 dilution for bloody specimens.
Automation of CSF cell counts significantly increases analytical precision and reduces turnaround time. However, because the number of cells in CSF is normally low (<5 cells/μLin adults or <30 cells/μL in children), many electronic impedance-based cell counters cannot be used because the instrument’s background count produces values higher than these “normal” cell counts. This is an issue, especially when most of the CSF samples actually tested in the laboratory have low cell counts that reside in the normal range.
Some automated systems currently available for CSF cell counting are the ADVIA 120 and ADVIA 2120 hematology analyzers (Siemens Healthcare Diagnostics, Deerfield, IL), Sysmex XE-5000 hematology analyzers (Sysmex Corporation, Mundelein, IL), and the Iris iQ200 with Body Fluids Module (Beckman Coulter Inc., Brea, CA). Studies using these analyzers indicate agreement with the manual hemacytometer method, and the best correlations are obtained at high cell counts.6–8 The ADVIA and Sysmex analyzers enumerate and differentiate cells using flow cytometry, whereas the iQ200 enumerates and differentiates RBCs and nucleated cells using flow cell digital imaging. Note that automated systems are not used to differentiate nucleated cells or to identify pathologic cell types such as neoplastic cells, siderophages, and lipophages. (See Chapter 16for additional discussion of automated body fluid analysis.)
Red Blood Cell (Erythrocyte) Count
RBC counts provide little diagnostically useful information. They can be performed to aid in the differentiation of a recent hemorrhage from a traumatic puncture procedure, as previously discussed. Another application of the RBC count is to correct the WBC count and total protein determinations obtained from a CSF specimen known to be contaminated with peripheral blood. These calculated “corrections” have limited accuracy, usually overcorrect the counts, assume that all of the RBCs present result from contamination, and have little clinical use. Therefore this chapter does not describe these corrections in detail; readers are referred to the bibliography for additional information.
As with the total cell count, well-mixed, undiluted CSF is used for the RBC count unless the number of cells present requires dilution because of overlapping and crowding of cells. Because the differentiation between small lymphocytes and crenated erythrocytes can be difficult in unstained wet preparations, some laboratories eliminate this count, replacing it with the difference obtained between the total cell count and the WBC count.
White Blood Cell (Leukocyte) Count
Increased WBC counts in CSF are associated with diseases of the CNS and a variety of other conditions (Table 9.4). The WBC count can vary significantly depending on the causative agent. Often the highest WBC counts (greater than 50,000 cells/μL) in CSF occur with bacterial meningitis. However, the same condition can show no pleocytosis in some patients.9
Table 9.4
| Malignant cells | ||
|---|---|---|
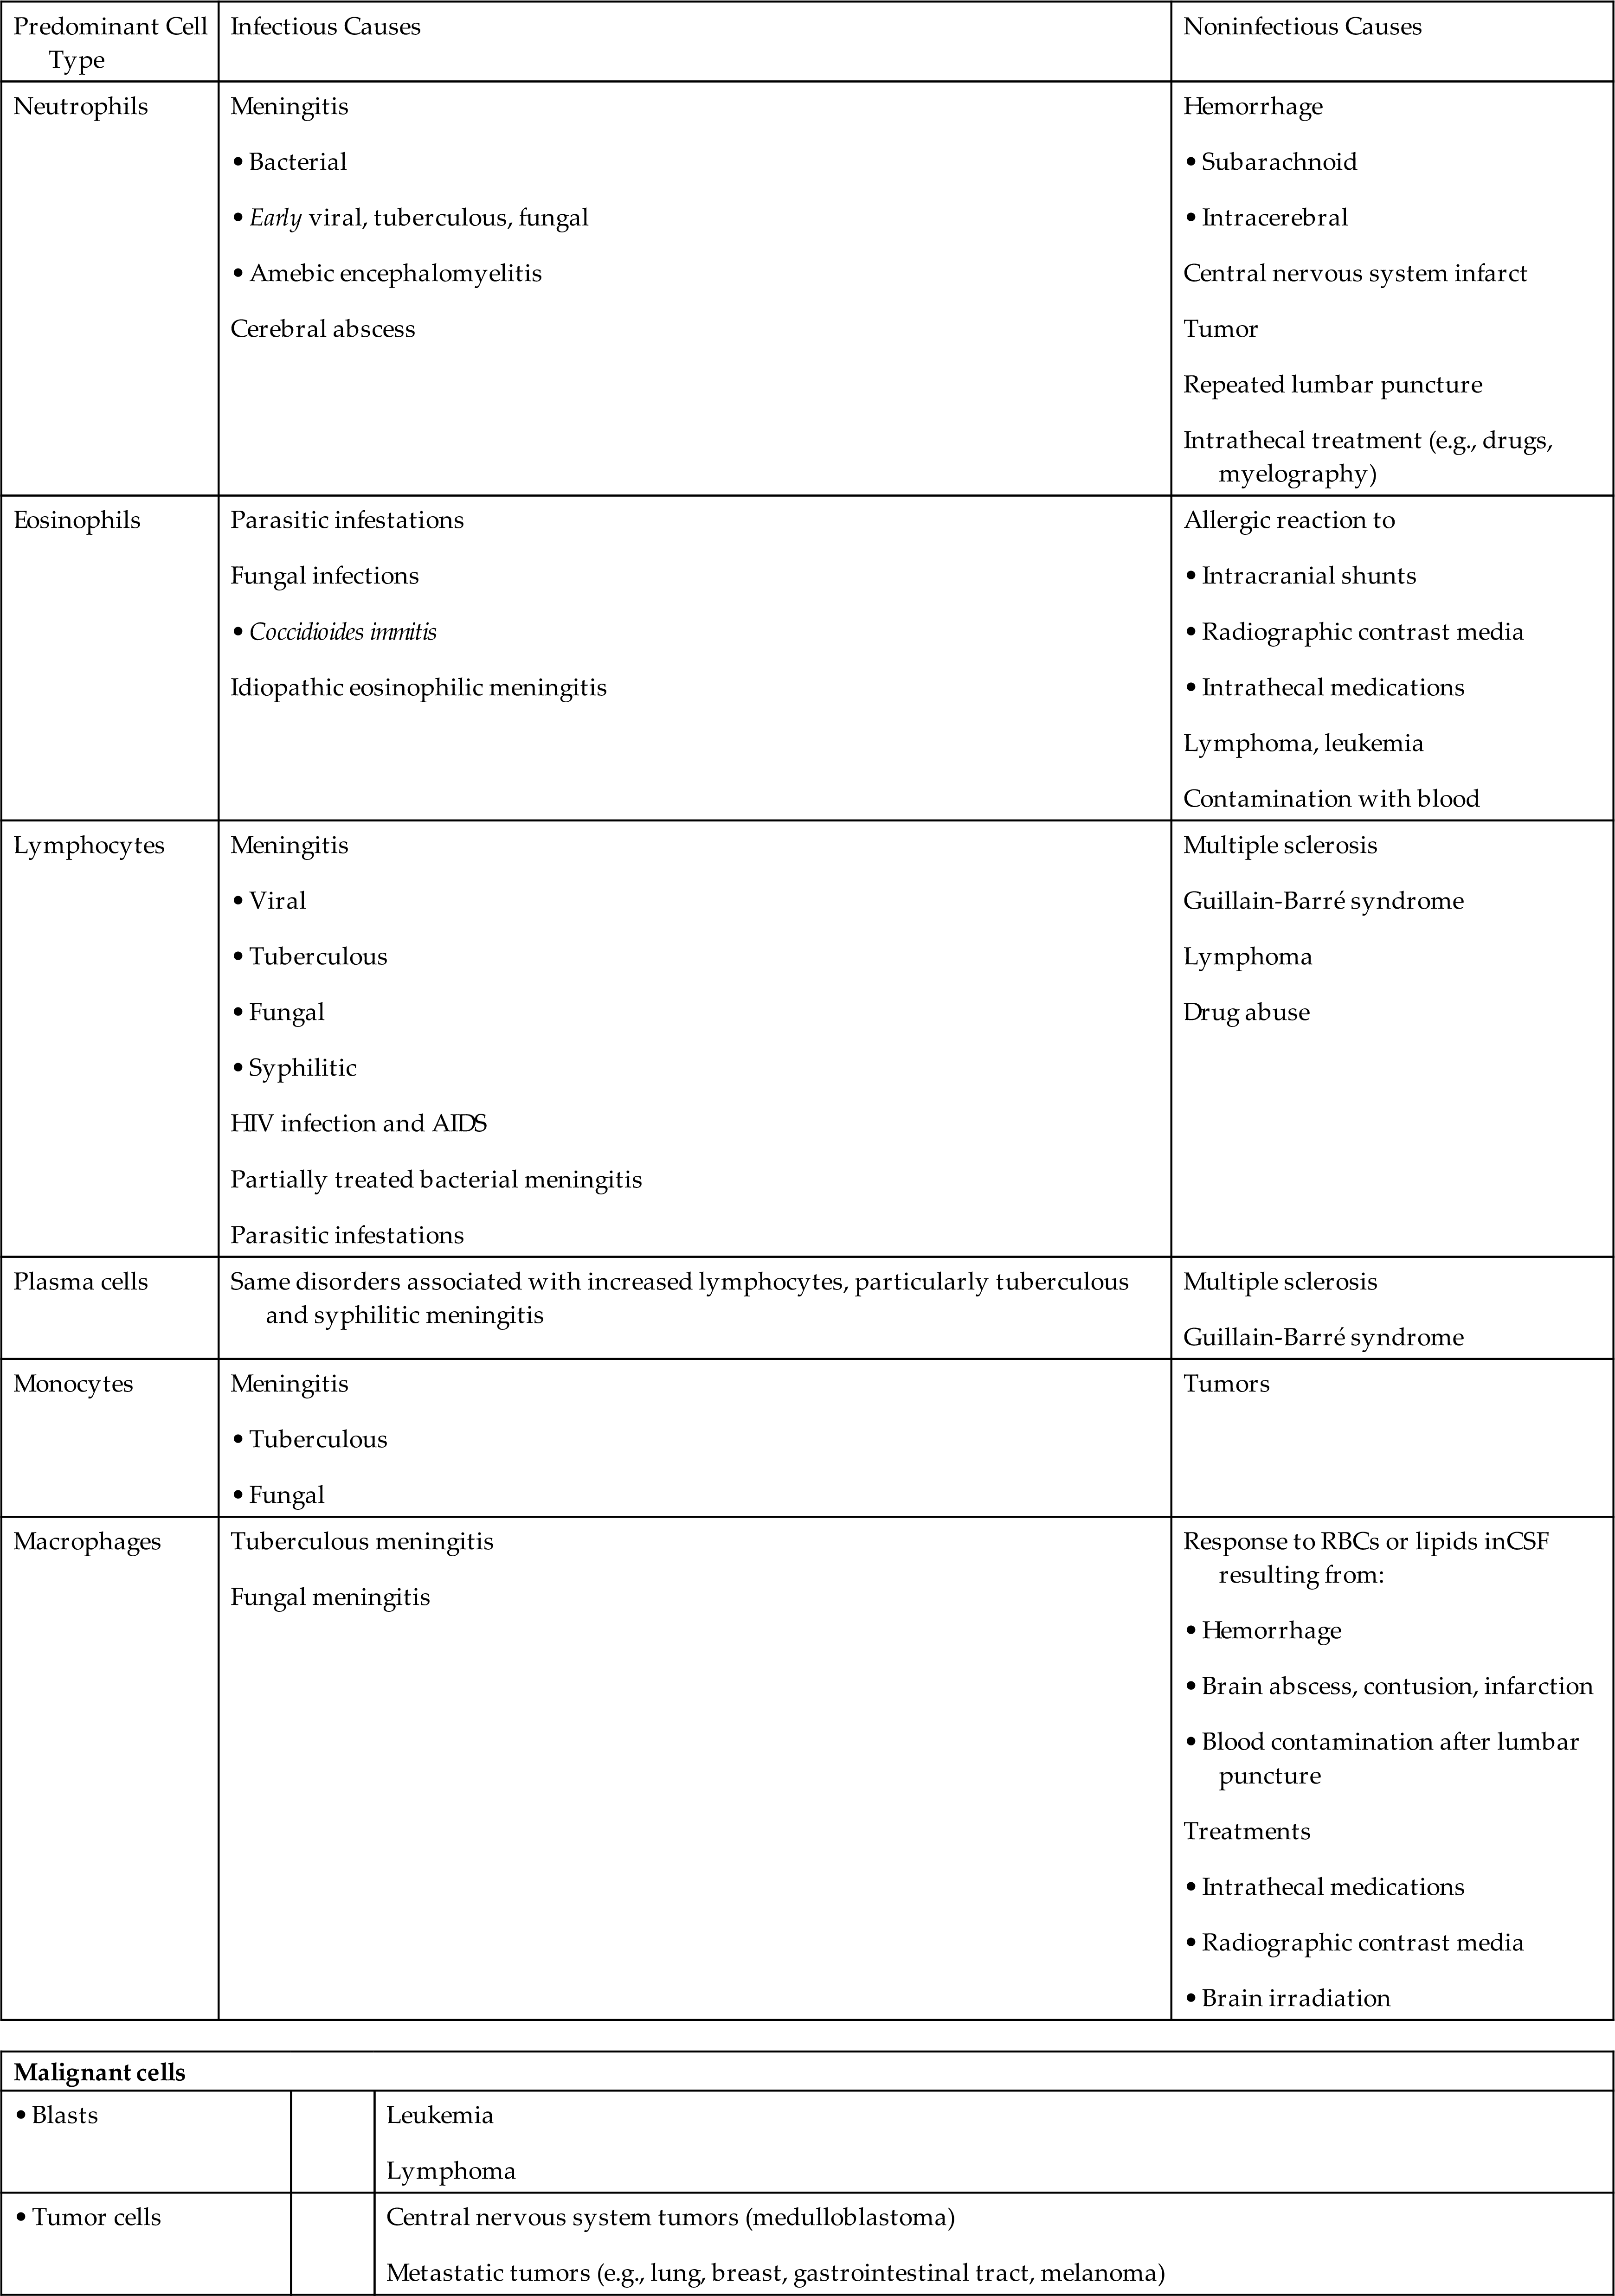
AIDS, Acquired immunodeficiency syndrome; CSF, cerebrospinal fluid; HIV, human immunodeficiency virus; RBC, red blood cell.
To enhance the visualization of white blood cell nuclei and to eliminate any RBCs present, the CSF can be treated with glacial acetic acid, and 3 to 5 minutes is allowed for RBC lysis before the hemacytometer chambers are filled. For details, see Chapter 17, Box 17.1. With the WBC nuclei more readily apparent, the WBCs are counted and may be classified as mononuclear or polymorphonuclear cells. Note that classification of WBCs during this count, known as a chamber differential, has poor precision and is unsatisfactory for reporting; however, it provides a preliminary indication of the cell types present. When WBC numbers are such that a dilution is required for accurate counting, an acetic acid and stain mixture (e.g., Turk’s solution) can be used as the diluent; this solution enhances visualization and facilitates classification of the WBCs (see Chapter 17 and Appendix D).
Nucleated Cell Differential
Slide Preparation
The differential cell count provides useful diagnostic information. Normally, lymphocytes and monocytes predominate in the CSF, with the percentages of each differing for adults and neonates (Table 9.5). A normal range for children 2 months old to 18 years old has yet to be established because of limited data. Before cytocentrifuge techniques were used, any neutrophils present were considered abnormal. Currently, with the increased cell recovery obtained using cytospin preparations, neutrophil counts of less than 10% are considered normal.10
Table 9.5
| Age | Lymphocytes | Monocytes | Neutrophils |
|---|---|---|---|
| Neonates (0–2 months) | 5–35% | 50–90% | 0–8% |
| Children (2 months to 18 years) | Not yet established | Not yet established | Not yet established |
| Adults (>18 years) | 40–80% | 15–45% | 0–6% |
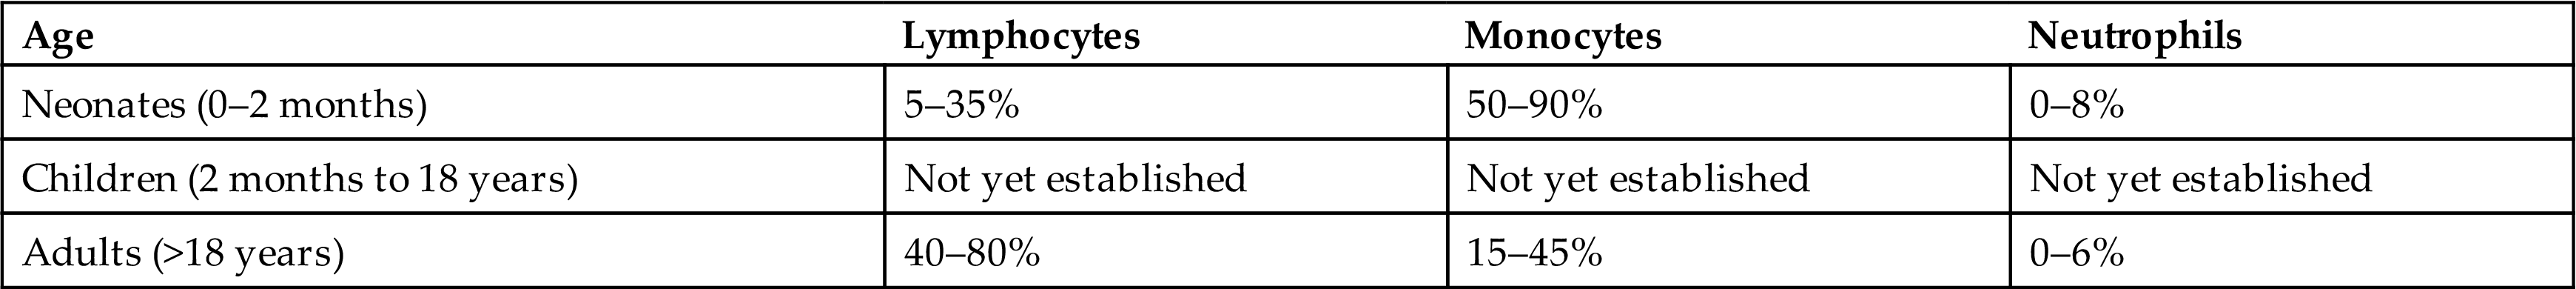
aData apply to cerebrospinal fluid differential counts using a cytospin preparation technique.
Performing a differential count of the nucleated cells in CSF requires the laboratorian to (1) concentrate the cells, (2) prepare a smear of the concentrate on a microscope slide, and (3) stain the slide preparation with Wright’s stain. The preferred and most widely used technique is cytocentrifugation and it is rapid, technically simple to perform, and produces slides with good cellular recovery. Note that some cell distortion can occur. The artifacts associated with cytocentrifugation are well known and listed in Chapter 17, Box 17.4. For additional discussion of slide preparation, see Chapter 17, subsection Body Fluid Analysis: Manual Hemacytometer Counts and Differential Slide Preparation.
Slide Examination
When a nucleated cell differential is performed, the entire slide is scanned using a low-power objective (10 ×). This scan provides an overview of the cellularity of the specimen as well as aids in detecting abnormalities that can be few in number yet apparent at this magnification, such as malignant cell clumps or other significant findings (Fig. 9.4). Note that the low-power examination can be done before or after the nucleated cell differential is performed.
A nucleated cell differential is performed using a high-power oil immersion objective (i.e., 50 × or 100 ×). The cell types that can be present in CSF include: granulocytes (i.e., neutrophils, eosinophils, basophils), lymphocytes, plasma cells, mononuclear phagocytes (i.e., monocytes, macrophages), and malignant cells. Note that all nucleated cells are counted. See Table 9.4 for conditions associated with specific cell types.
Nucleated Cell Types in Pleocytosis
Neutrophils
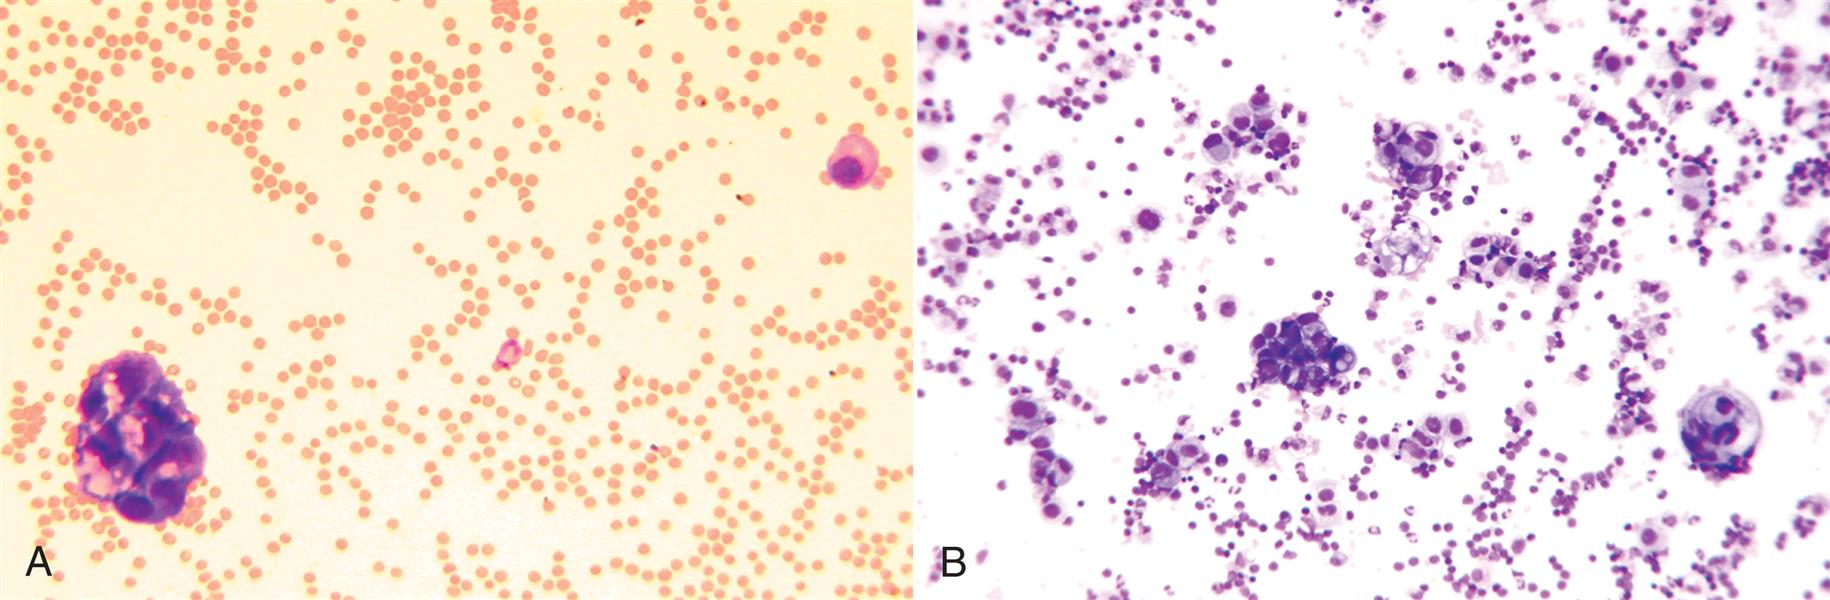
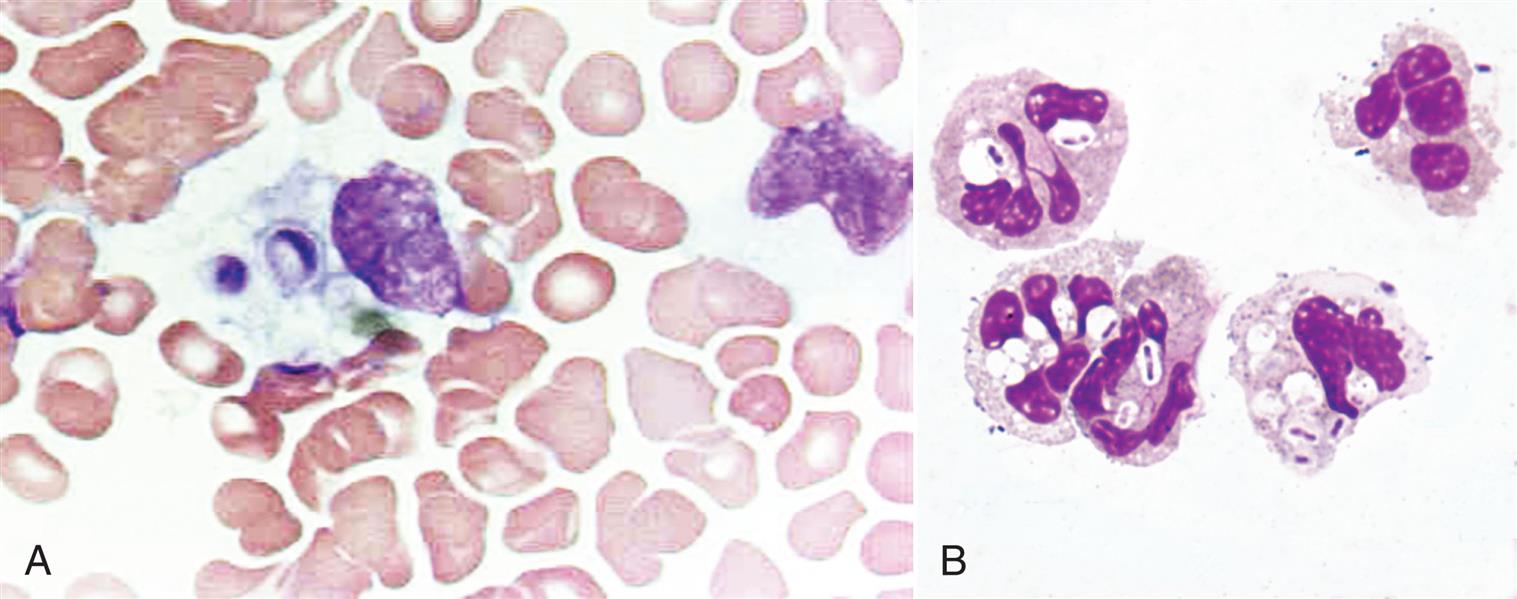
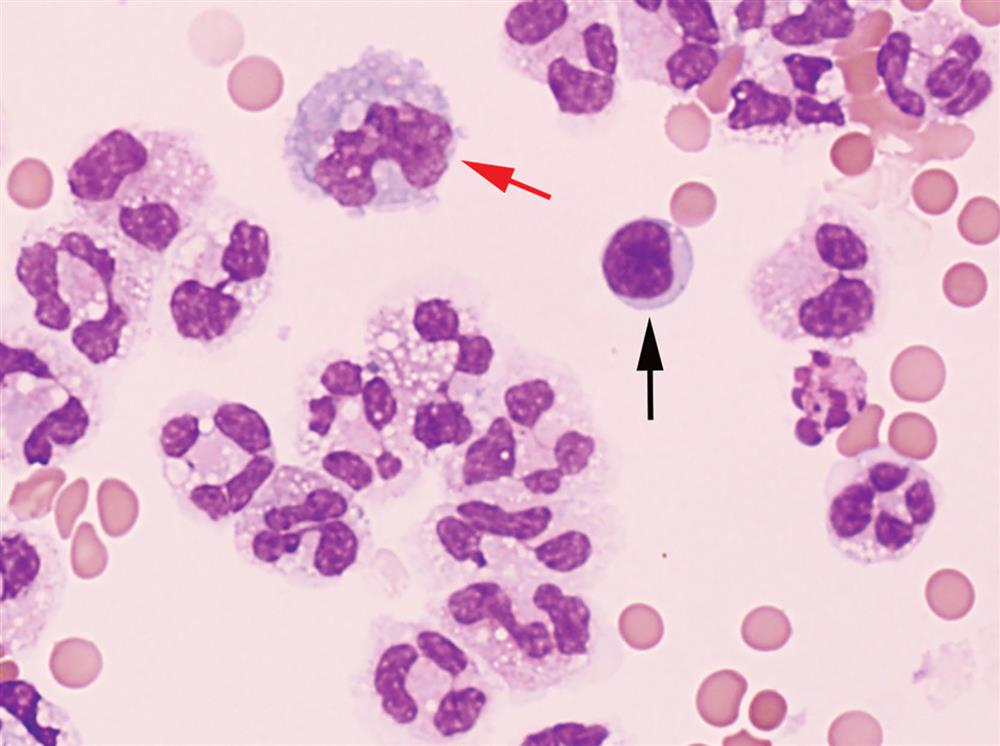
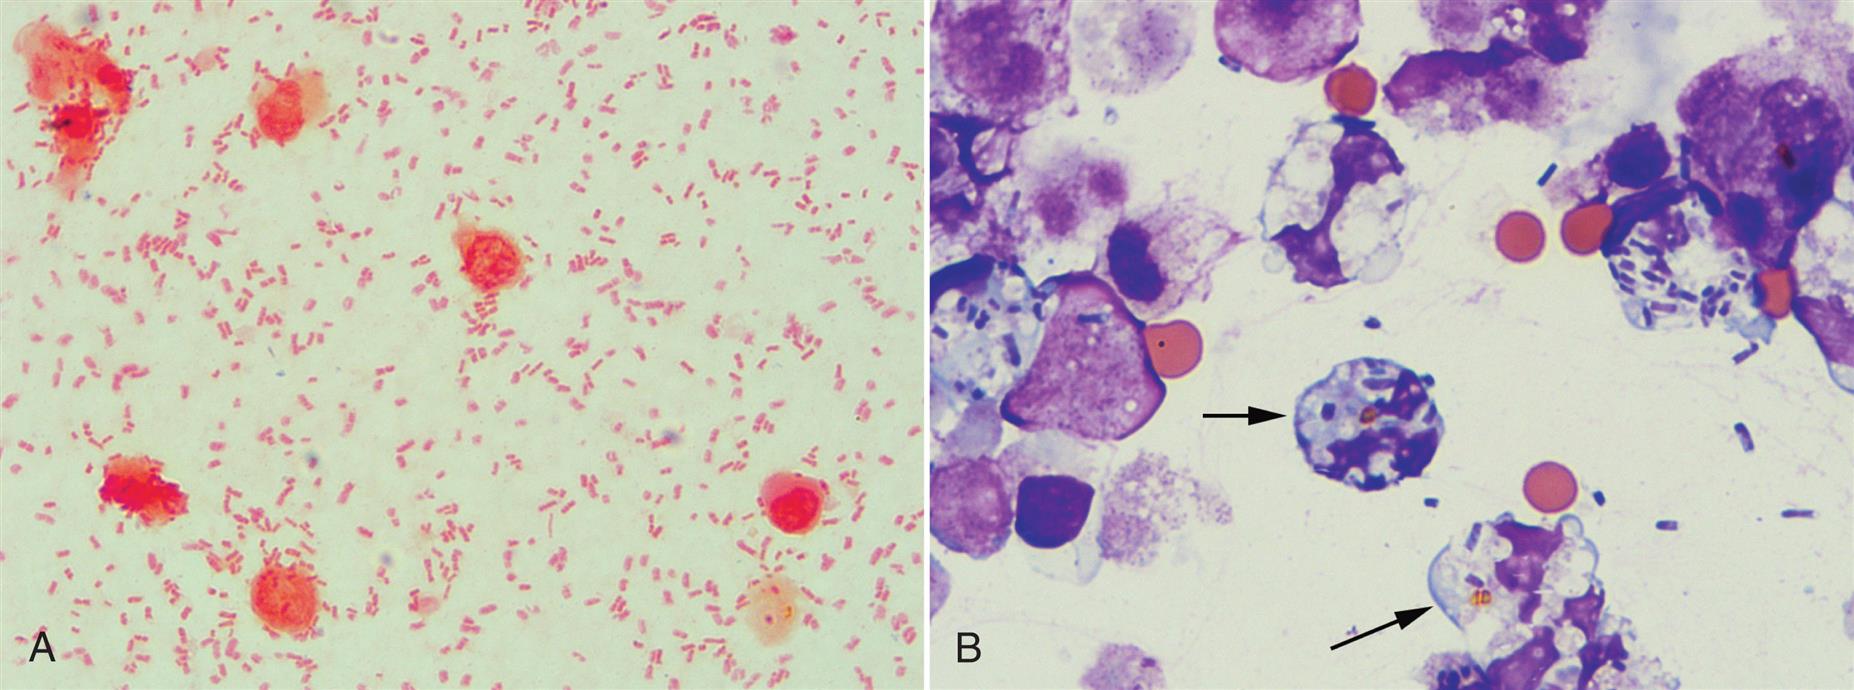
Neutrophilic pleocytosis occurs in early viral, fungal (Fig. 9.5, A), tubercular, and parasitic infections, as well as with noninfectious conditions. With bacterial meningitis, as many as 90% of the WBCs present in the CSF can be neutrophils (Fig. 9.5, B). In contrast, only a small percentage of neutrophils (≈10%) may be present with other infectious agents. Noninfectious conditions associated with an increased number of neutrophils in the CSF include subarachnoid or intracerebral hemorrhage, repeated lumbar punctures, and intrathecal administration of drugs or radiographic contrast media.
Eosinophils
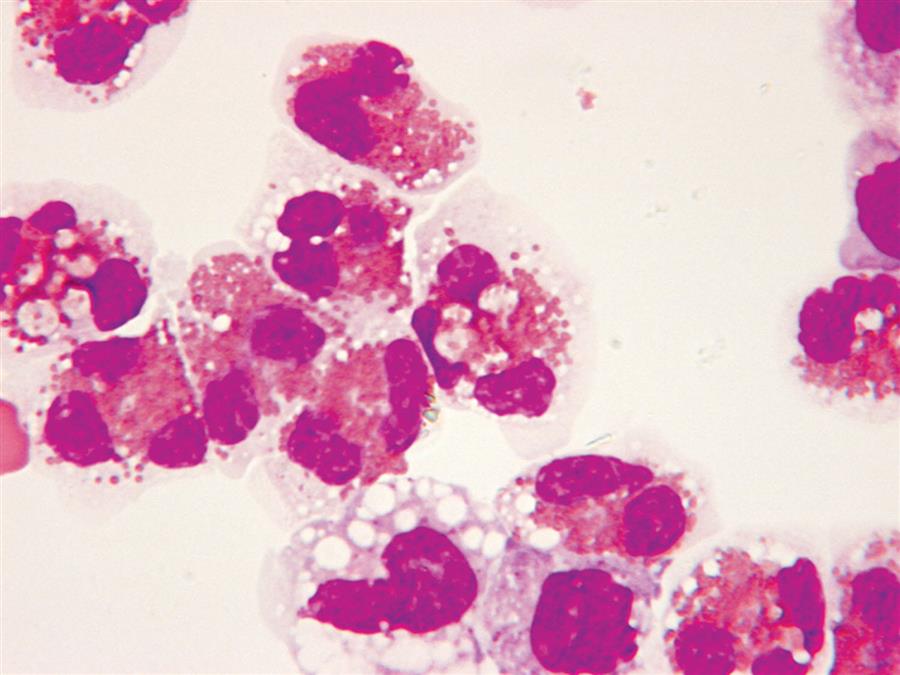
Few eosinophils are seen in normal CSF, and small increases are not considered clinically significant. Eosinophil pleocytosis (10% or greater) is associated with various parasitic and fungal infections, and can also result from an allergic reaction to malfunctioning intracranial shunts or to the intrathecal injection of foreign substances such as radiographic contrast media or medications (Fig. 9.6). A form of meningitis that results in eosinophil pleocytosis has also been described; when a causative agent or pathogen is not identified, the term used is idiopathic eosinophilic meningitis.11
Lymphocytes
An increased number of lymphocytes in the CSF is associated with viral, tuberculous, fungal, and syphilitic meningitis. Although initially these conditions may show a mixture of cells (i.e., neutrophils, lymphocytes, monocytes, and plasma cells), in later stages of disease lymphocytes predominate (Figs. 9.7 and 9.8). Lymphocytes in CSF can become activated by stimuli and transform in the same way as those in peripheral blood. As a result, a variety of lymphoid cells can be present at one time in the CSF. They can range in size from small (7–12 μm) round to oval cells to large cells (12–18 μm), with the change in size primarily due to increased amounts of cytoplasm. Transformed lymphocytes, known as reactive lymphocytes, can be even larger, ranging from 10 to 30 μm in diameter and their cytoplasm can be pale to dark blue. Reactive lymphocytes are pleomorphic, can contain azurophilic granules, and their cytoplasm is easily indented by surrounding cells.
In cases of viral meningitis, all lymphocyte types are usually present in varying numbers, including reactive as well as plasmacytoid lymphocytes. Lymphocyte differentiation can be difficult and has limited clinical utility. Therefore, all lymphocytes in the nucleated cell differential are enumerated in a single category. Table 9.4 lists other conditions demonstrating CSF-lymphocytic pleocytosis.
Plasma cells
In health, plasma cells are not in CSF; therefore when present, they should always be noted. Lymphocytes transform under various stimuli to eventually become a mature plasma cell. See Chapter 10, Figs. 10.7 and 10.10, and for additional discussion about plasma cells see Chapter 10, subsection Lymphocytes and Plasma cells.
Plasma cells can be seen in acute viral and chronic inflammatory conditions—many of the same conditions that result in lymphocytic pleocytosis. Note that in some cases of multiple sclerosis, the presence of plasma cells may be the only CSF abnormality.
Monocytes
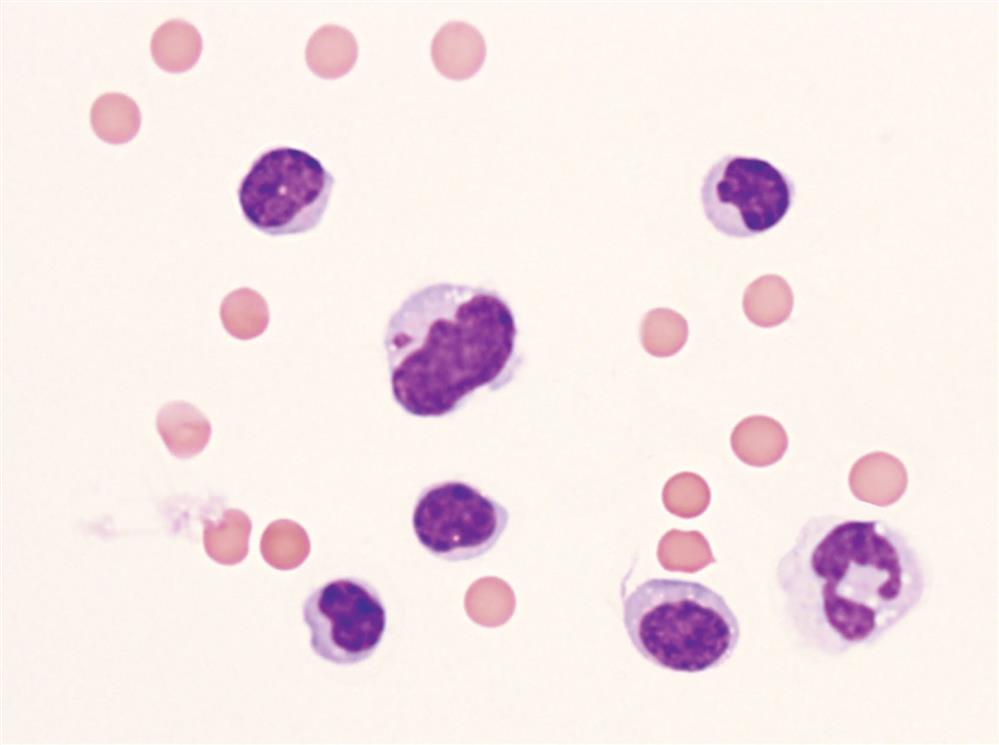
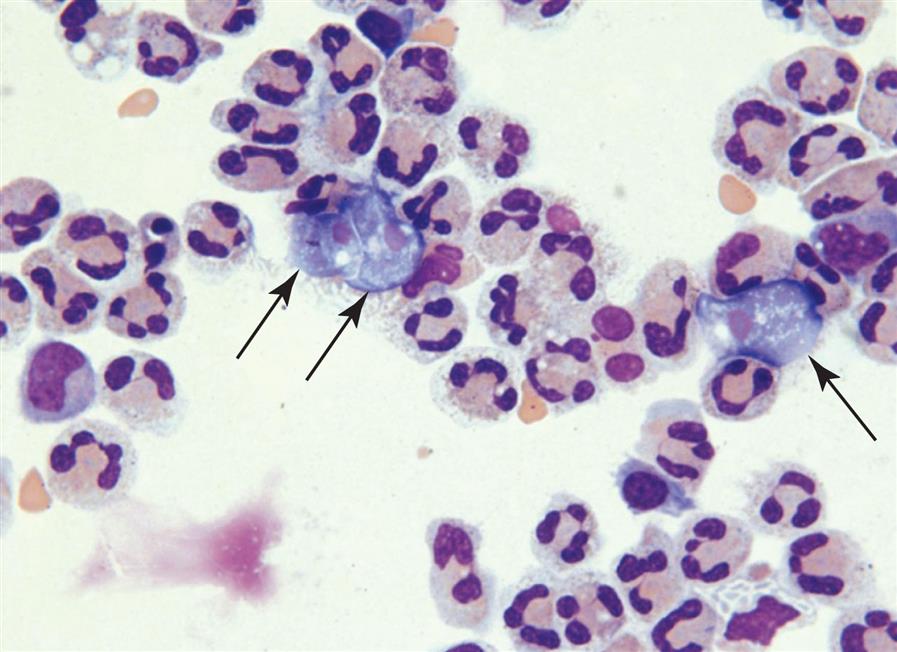
The number of monocytes in CSF can be increased, but monocytes rarely predominate (Fig. 9.9). Usually an increase in the number of monocytes occurs in a mixed pleocytosis pattern with other cell types (i.e., lymphocytes, neutrophils, plasma cells). A mixed pattern is seen in cases of tuberculous or fungal meningitis, chronic bacterial meningitis, or rupture of a cerebral abscess.
Macrophages
Macrophages in CSF originate from monocytes and possibly from stem cells located in the reticuloendothelial tissue of the arachnoid and pia mater. Although macrophages are not present in normal CSF, they are frequently found after hemorrhage and various other conditions because of their active phagocytic ability. CNS procedures such as myelography and pneumoencephalography can stimulate an increase in monocytes and macrophages in the CSF that can persist for 2–3 weeks after the procedure. Macrophages are capable of phagocytizing other cells, such as RBCs and WBCs, and substances, such as lipids, pigments, and microorganisms.
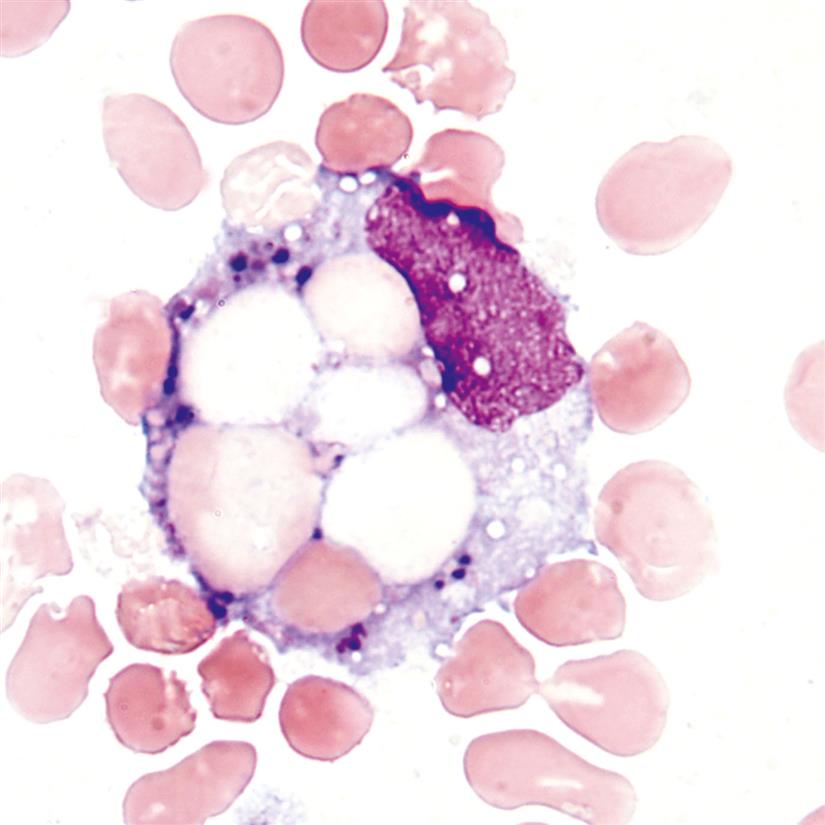
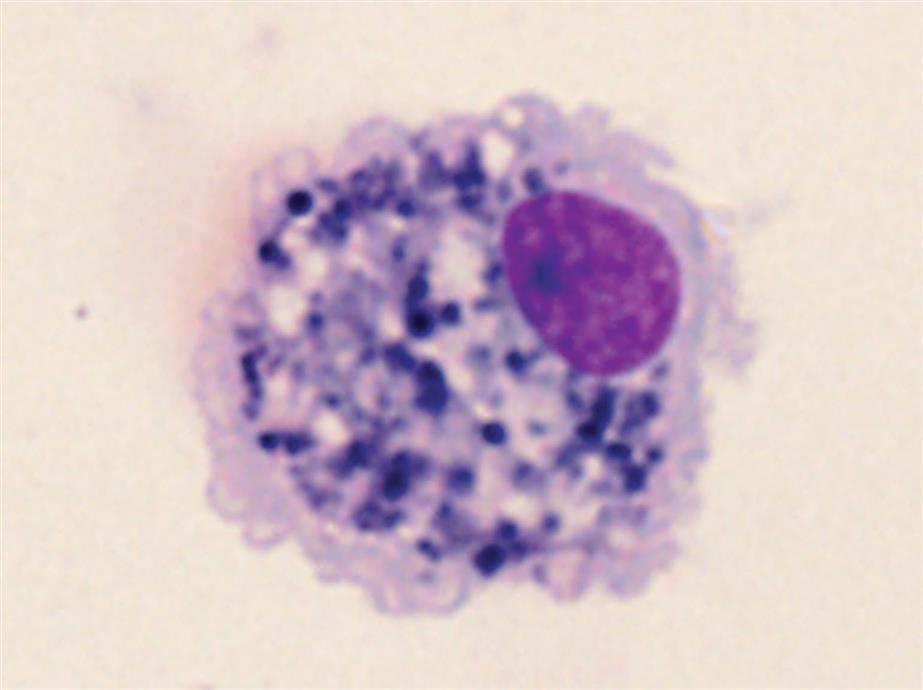
After a subarachnoid or cerebral hemorrhage, recently phagocytosed RBCs are readily apparent in macrophages, which are then called erythrophages (Fig. 9.10). The engulfed RBCs rapidly lose their pigmentation to form vacuoles in the cytoplasm of these large cells. Two to four days following a hemorrhage, macrophages with intracellular hemosiderin (i.e., brown- to black-pigmented granules) derived from hemoglobin degradation appear. These cells are called siderophages and can persist in the CSF for 2 to 7 weeks.12 Siderophages are apparent on a Wright-stained cytospin prepared slide (Fig. 9.11) but, if desired, visualization can be enhanced using an iron stain.
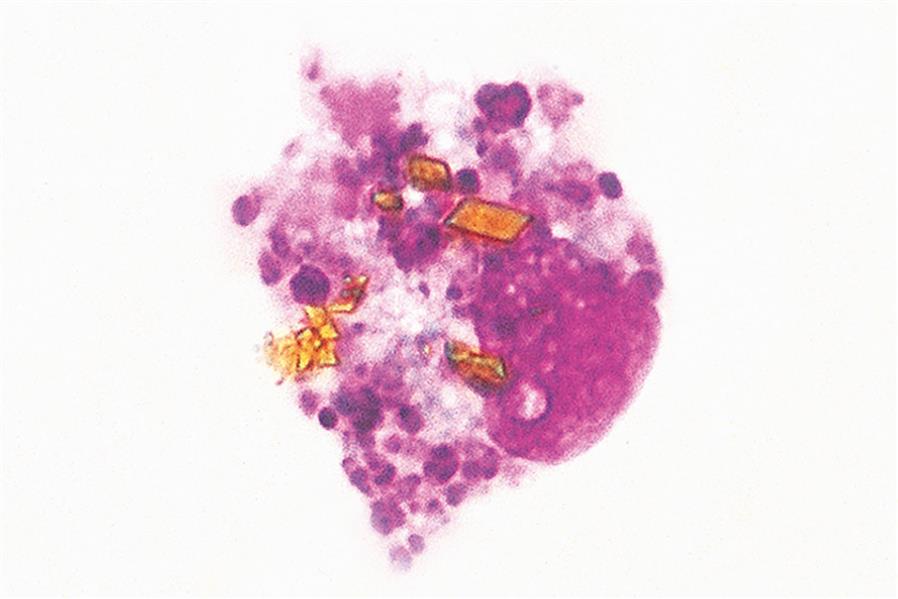
Another finding associated with a previous hemorrhage is the appearance of hematin crystals. These yellow-brown rhomboid crystals can be observed in the CSF approximately 2 weeks after a hemorrhage (Fig. 9.12). They can reside within macrophages (intracellular) or appear free floating (extracellular) in the fluid. The presence of hematin crystals indicates that blood (hemoglobin) was catabolized in the subarachnoid space of the brain or spinal cord approximately 2 weeks prior. See Box 9.3 for additional discussion about hematin and a similar but different compound called hematoidin.
Note that the presence of a small number of erythrophages does not always indicate a hemorrhage. When a second lumbar puncture is performed within 8 to 12 hours of a previous puncture, peripheral blood that entered the CSF during the initial procedure can be responsible for the erythrophagocytic activity observed. However, when siderophages or hematin crystals are also present, it indicates that a hemorrhage occurred in the CNS. See Table 9.6 for a summary of when different types of macrophages appear and how long they persist in the CSF following a hemorrhage.
Table 9.6
| Finding | Appearance | Duration |
|---|---|---|
| Macrophages | ~2 hours | Up to 2 months |
| Erythrophages | ~8 hours | Up to 1 week |
| Siderophages | ~2–4 days | Up to 8 weeks |
| Macrophages with intracellular hematin crystals; or extracellular hematin crystals | ~2 weeks | Up to 2 months |
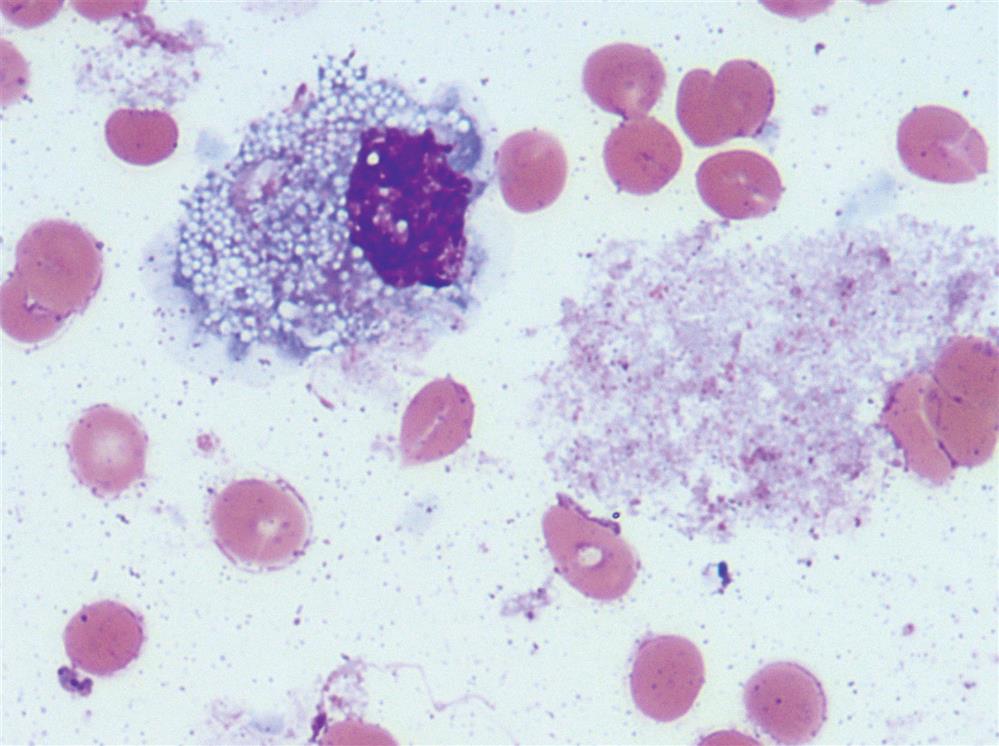
Neutrophages and lipophages are two names used to describe macrophages based on other cytoplasmic inclusions. The phagocytosis of neutrophils occurs late in inflammatory conditions and produces neutrophages. These phagocytic cells are removing neutrophils (that have been battling the disease process) as well as other cellular debris to assist in recovery and tissue repair. Note that monocytes and other macrophages have also been observed as intracellular inclusions within macrophages. Lipophages are macrophages with vacuoles of phagocytized lipids (Fig. 9.13). The vacuoles in these cells are small and uniform in contrast to the large vacuoles from RBCs in erythrophages. Lipophages can be present in the CSF as a result of trauma, abscess, infarction, chemotherapy, or irradiation of the CNS. As with other cytoplasmic inclusions, the nucleus in these lipid-laden macrophages is often pushed to one side.
Other cells and brain tissue
At times, ependymal and choroid plexus cells are observed in CSF. These cells are collectively known as ventricular lining cells. Microscopically using a Wright-stained cytospin preparation of CSF, it is very difficult to differentiate between ependymal cells (cells lining the ventricles; the ependyma) and cells from the choroid plexus. Irregardless, these ventricular lining cells are often present as cell clumps or sheets of various sizes, but can also appear singly (Fig. 9.14). These cells range from 20 to 40 µm in diameter and have round to oval nuclei. Their cytoplasm is moderate to abundant and at their cytoplasmic borders, vacuoles or cilia (ependymal cells) may be present.
Ventricular lining cells are frequently seen in patients with ventricular or cisternal taps and shunts. In these cases, their presence is not clinically significant. However, they can also be present due to brain trauma, surgery, infarction, or following brain imaging procedures. Therefore it is important to be familiar with the cytologic characteristics of ventricular lining cells so that they can be identified and differentiated from malignant cells or artifactual clusters of lymphocytes or monocytes.
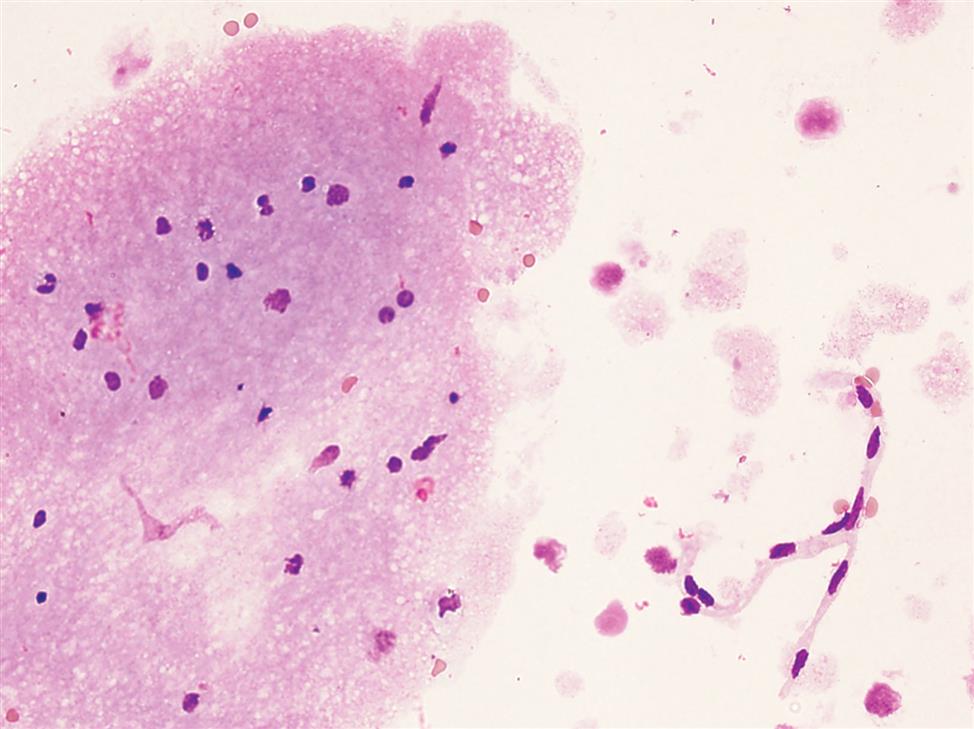
Other cells such as squamous epithelial cells, chondrocytes (cartilage cells), cells originating from bone marrow contamination (e.g., nucleated RBCs), spindle-shaped cells, neurons, and astrocytes can also be observed in CSF. Likewise, brain tissue and capillaries can be seen in CSF collections. Although uncommon, these elements are typically observed following intercranial surgery, cerebral hemorrhage, CNS trauma, or in patients with a ventricular shunt. Using a Wright-stained cytospin preparation, brain tissue appears pink to basophilic with a finely granular matrix. The brain tissue can be acellular or it may have randomly dispersed nuclei that show no evidence of cytoplasm (Fig. 9.15).
Malignant cells
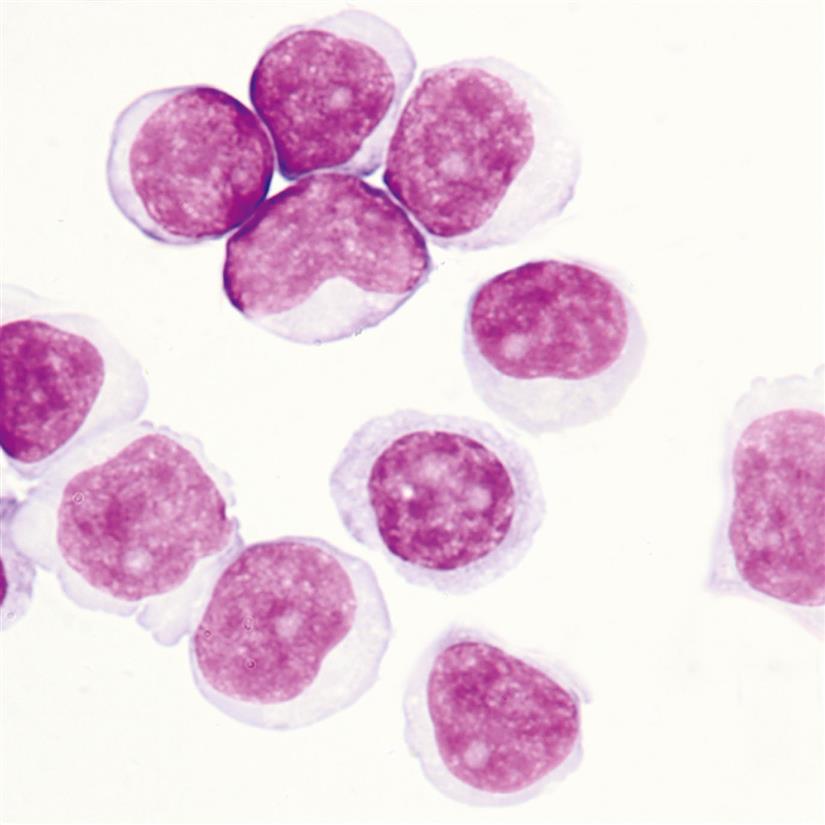
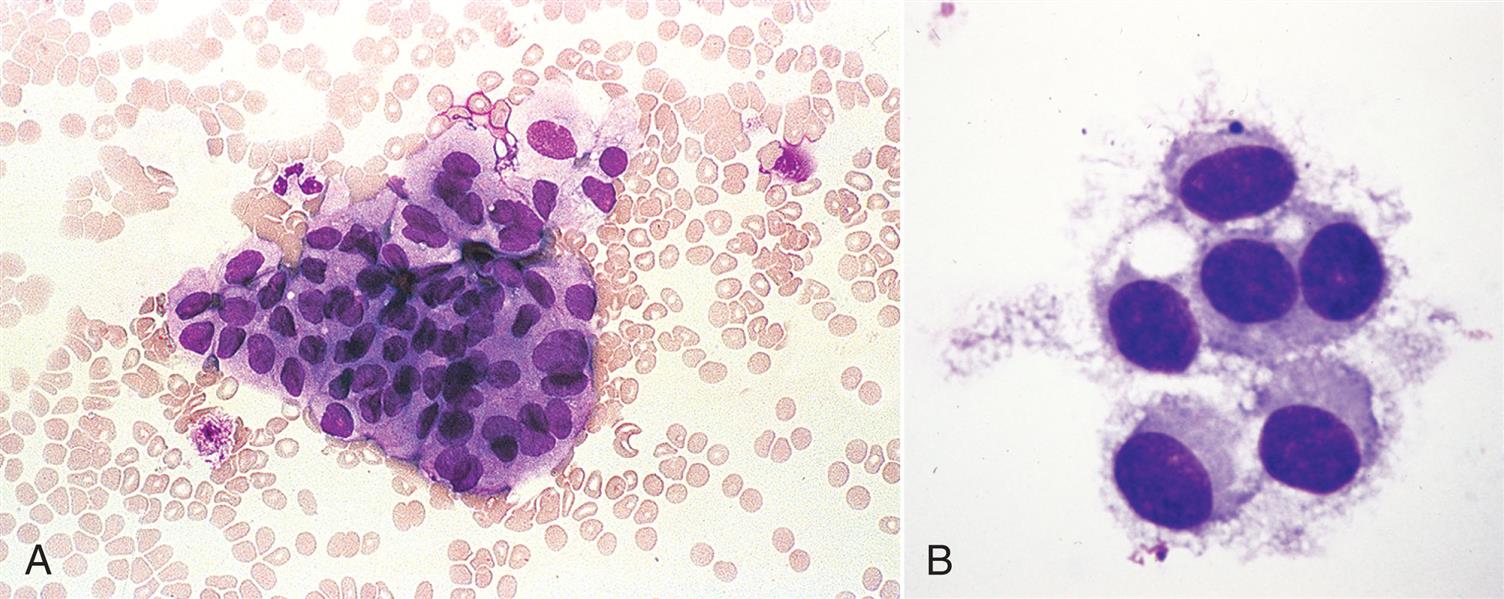
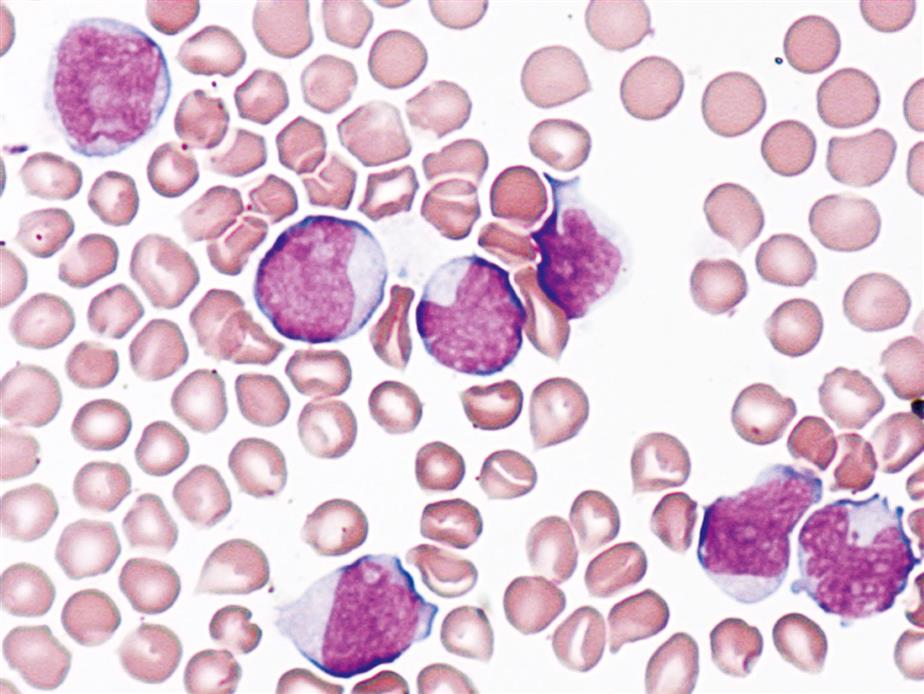
Malignant cells in the CSF originate from a primary CNS tumor (e.g., medulloblastoma) or from metastasis. Most commonly seen are metastatic tumor cells from melanoma and from cancers of the lung, breast, or gastrointestinal tract. Leukemia, particularly acute lymphoblastic leukemia and acute myeloblastic leukemia, as well as lymphoma, can also result in the presence of malignant cells in the CSF. In patients with lymphoma and acute lymphoblastic leukemia with meningeal infiltration, increased numbers of lymphoblasts are present (Fig. 9.16). The leukemic and lymphoma lymphoblasts are characteristically uniform in size, shape, and appearance, in contrast to transformed reactive lymphocytes in lymphoid-stimulating conditions that show a significant variation in the types of cells present. The actual number of lymphoblasts present is not of diagnostic importance; even small numbers are clinically significant. Similarly, in patients with acute myeloblastic leukemia, readily identifiable and uniform myeloblasts are seen (Fig. 9.17).
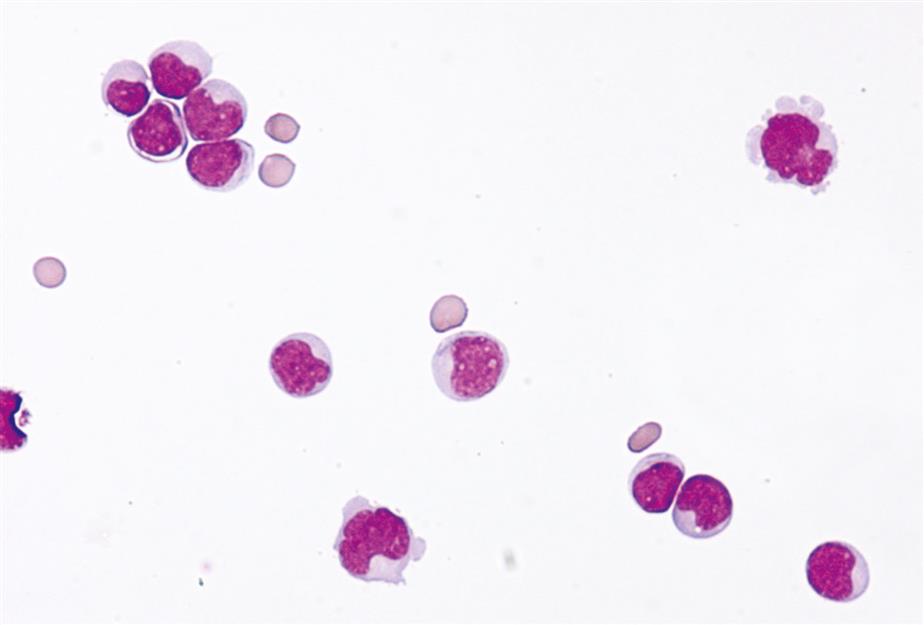
Because drugs used in chemotherapy do not pass the blood-brain barrier, malignant cells that enter the CNS can proliferate unchecked in the CSF. As a result, most patients with acute lymphoblastic leukemia (≈80%) and acute myeloblastic leukemia (≈60%) develop CNS involvement at some stage during the disease.17
In CSF, malignant tumor cells can appear singly or as cell clumps. When clumps of cells are present, it is important to positively identify and differentiate malignant cells from clumps of normal choroid plexus cells and from ependymal cells that line the ventricles. These normal cells of the CNS closely resemble malignant cells in size, shape, and appearance, but they have no clinical significance. In contrast, malignant cells are always of diagnostic importance. Therefore, always consult a pathologist or experienced cytologist whenever suspicious cells are present. See Chapter 10, Box 10.2 for a listing of morphologic features associated with malignant cells.
Chemical Examination
Although numerous chemical constituents of CSF have been evaluated and studied, few have established clinical usefulness. Historically, although numerous electrolytes and acid-base indicators—such as chloride, calcium, magnesium, pH, and PCO2—were analyzed, these analytes now have little clinical value. Instead, assays of glucose, lactate, and various proteins in the CSF predominate, providing substantive diagnostic information. This chapter does not discuss those chemical tests with limited clinical use, such as glutamine quantitation, which reflects CSF ammonia levels and can aid in the diagnosis of hepatic encephalopathy resulting from Reye’s syndrome, viral hepatitis, or cirrhosis, and it does not discuss lactate dehydrogenase activity with isoenzyme analysis, which can aid in the differential diagnosis of various CNS disorders.
Protein
The bulk of CSF protein (more than 80%) is derived from the transport of plasma proteins (via pinocytosis) through the capillary endothelium in the choroid plexus and meninges; the rest of the protein results from intrathecal synthesis.18 Because of this transport process of proteins, normally only low-molecular-weight proteins are present in the CSF. Electrophoresis, after concentrating CSF (80–100 times), normally reveals only the presence of transthyretin (TTR; previously called prealbumin), albumin, and transferrin. Trace amounts of immunoglobulin G (IgG), a high-molecular-weight protein (molecular weight 160,000), can also be demonstrated electrophoretically in some normal CSF specimens.
Total Protein
The total amount of protein in the CSF varies with the age of the individual and the site from which the CSF is obtained. The protein content of CSF obtained from the lumbar region is greater than that obtained from the cisterna or ventricles. In general, CSF total protein concentrations ranging from 15 to 45 mg/dL (150–450 mg/L) are considered normal, although infants and adults older than 40 years often have higher protein concentrations.
The CSF total protein is most commonly determined to assess the integrity of the blood-brain barrier and to indicate pathologic conditions of the CNS. Increased CSF total protein can result from one of four different mechanisms: (1) CSF contamination with peripheral blood during the puncture procedure; (2) altered capillary endothelial exchange (change in the blood-brain barrier); (3) decreased reabsorption into the venous blood; or (4) increased synthesis in the CNS. Because of the high concentration of proteins in the blood plasma compared to CSF (≈1000:1), a traumatic tap can result in significant false elevation of the CSF total protein. Formulas to correct for the contribution of plasma protein to CSF after a traumatic tap use the RBC count obtained from the same collection tube. As mentioned earlier, however, these RBC-based formulas overestimate the correction, are rough estimates at best, and are not clinically useful.
Changes in the permeability of the blood-brain barrier and decreased reabsorption at the arachnoid villi occur with numerous disorders, such as bacterial, viral, and other forms of meningitis; cerebral infarction; hemorrhage; endocrine disorders; and trauma. Obstruction to the flow of CSF caused by tumors, disk herniation, or abscess prevents the normal circulation of fluid, which enhances water reabsorption in the spinal cord and results in increased CSF protein. Last, the infiltration of the CNS with immunocompetent cells that synthesize immunoglobulins can also result in an increased total protein determination (e.g., in multiple sclerosis, neurosyphilis).
Decreased CSF total protein can result from (1) increased reabsorption through the arachnoid villi because of increased intracranial pressure or (2) loss of fluid because of trauma (e.g., a dural tear) or invasive procedures (e.g., pneumoencephalography).
Several methods are available to determine CSF total protein. Test selection is dictated by the limited sample volume and the need for sensitivity because CSF protein concentrations are normally low (15–45 mg/dL). Turbidimetric procedures based on the precipitation of protein are often used. For a comprehensive discussion of the methods available, including the advantages and disadvantages of each, the reader should consult a textbook in clinical chemistry.
Albumin and Immunoglobulin G
Because albumin is not synthesized in the CNS, all albumin present in the CSF results from passage across the blood-brain barrier, assuming no contamination occurs during the puncture procedure. Therefore albumin can be used as a reference protein to monitor the permeability of the blood-brain barrier. Permeability is evaluated by determining the CSF/serum albumin index, which is the ratio of the CSF albumin concentration to the serum albumin concentration (Equation 9.1).Note that the concentration units differ: albumin in the CSF is reported in milligrams per deciliter, whereas serum albumin is reported in grams per deciliter. A CSF/serum albumin index less than 9 is considered normal. Index values between 9.0 and 14.0 represent minimal impairment of the blood-brain barrier, index values between 15 and 100 represent moderate to severe impairment of the barrier, and index values that exceed 100 indicate a complete breakdown of the barrier.18
 Equation 9.1
In contrast to albumin, IgG is a high-molecular-weight protein that is normally present in minute amounts (approximately 1 mg/dL) in the CSF. In some pathologic conditions, increased CSF IgG can result from increased production within the CNS or from increased transport from the blood plasma. To specifically identify those conditions characterized by increased intrathecal synthesis, albumin is used as a reference protein, and the following formula is used to determine the CSF IgG index:
 Equation 9.2
As with albumin, the concentration units of IgG differ with specimen type. Because this calculation depends on determinations of the albumin and IgG concentrations, any analytical error is magnified. Therefore it is imperative to use accurate and precise quantitative immunochemical methods (e.g., nephelometry) to determine the albumin and IgG concentrations. A typical reference interval for the IgG index is 0.30 to 0.70 (this range varies with the technical methods used and the patient population). Values greater than this range are associated with increased intrathecal production of IgG, whereas values less than this range indicate a compromised blood-brain barrier. Because about 90% of patients with multiple sclerosis have an IgG index greater than 0.70, this index is diagnostically sensitive for this disease. However, other inflammatory disorders of the CNS cause increased IgG synthesis, which limits the specificity of the index for multiple sclerosis. Regardless, the CSF IgG index is a diagnostically useful tool and is frequently used.
Protein Electrophoresis
Protein electrophoresis reveals the composition and distribution of proteins in the CSF. An abnormal distribution of proteins can be present in the CSF (see Table 9.1) despite a normal total protein content. Because of its low protein content, the CSF must be concentrated 80- to 100-fold before electrophoresis. This is most often done using commercial concentrating devices.
Four protein bands predominate in a normal CSF pattern: TTR, albumin, and two distinct transferrin bands (Fig. 9.18, A).In addition, faint bands of α1-antitrypsin and IgG may be present. The second transferrin band, also known as τ (tau) transferrin, migrates in the β2 region and is a sialic acid–deficient form of transferrin synthesized almost exclusively in the CNS. Because it is a protein unique to the CSF, when a CSF electrophoretic pattern is compared to a serum electrophoretic pattern from the same individual, τ transferrin will not be present in the serum pattern. Normally, serum, nasal fluid, middle ear fluid, saliva, and sputum do not contain τ transferrin. Therefore the presence of τ transferrin in a fluid or discharge positively identifies it as CSF, which assists in the diagnosis of CSF rhinorrhea or otorrhea (i.e., the discharge of CSF through the nose or ears, respectively).19
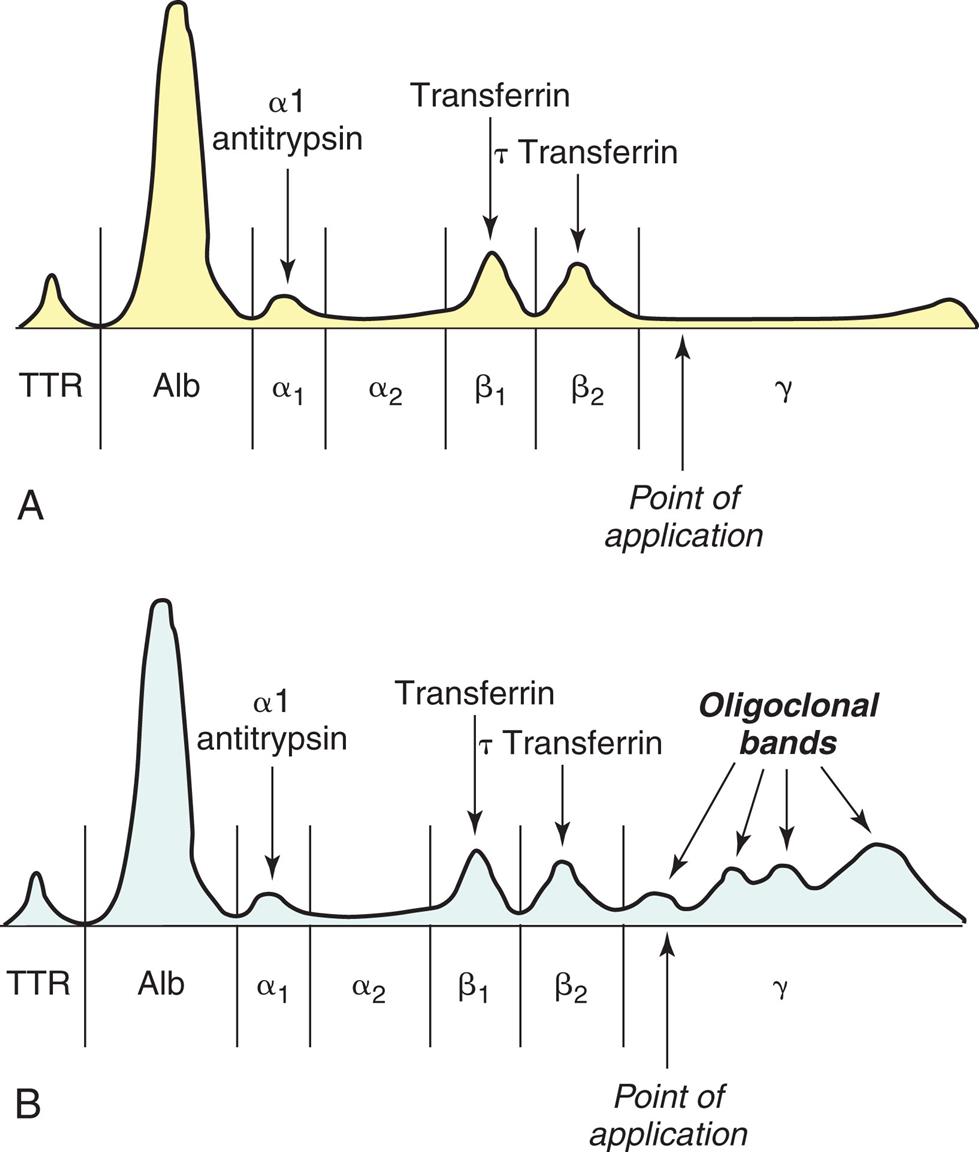
Electrophoresis of CSF is performed primarily to detect oligoclonal bands in the γ region (see Fig. 9.16, B). Oligoclonal banding can vary significantly from a few faint discrete bands to many intense bands. Their presence in the CSF and concomitant absence in serum is highly indicative of multiple sclerosis. Because IgG can pass the blood-brain barrier, simultaneous electrophoretic analysis of serum and the CSF is necessary. Some lymphoproliferative disorders also produce oligoclonal banding, but the bands are present in both serum and the CSF. In these cases, if only the CSF is analyzed, an inaccurate diagnosis could be made. Among patients with multiple sclerosis, 90% demonstrate CSF oligoclonal bands at some time in the course of their disease. Although these bands aid in the diagnosis of multiple sclerosis, their presence or intensity does not correlate with a particular stage of disease, nor can they be used to predict disease progression. In addition, other CNS disorders, such as subacute sclerosing panencephalitis, neurosyphilis, bacterial and viral meningitis, and acute necrotizing encephalitis, can also demonstrate CSF oligoclonal banding. As a result, CSF oligoclonal banding alone cannot be considered pathognomonic for multiple sclerosis. Instead, a protocol consisting of laboratory tests and a clinical assessment of neurologic dysfunction is used to diagnose multiple sclerosis.
Myelin Basic Protein
Myelin, a primarily lipid substance (70%), surrounds the axons of nerves and is necessary for proper nerve conduction. The remaining 30% of myelin is made up of proteins, one of which is myelin basic protein. With multiple sclerosis and other demyelinating diseases, the myelin sheaths undergo degradation and release myelin basic protein into the CSF, where it can be detected using sensitive immunoassays. Detection of myelin basic protein is not specific for multiple sclerosis, and the protein is present only during acute exacerbation of the disease. Myelin basic protein determinations, therefore, are used primarily to follow the course of disease or to identify those individuals with multiple sclerosis who do not show oligoclonal banding (≈10%).
Glucose
The CSF glucose concentration is in a dynamic equilibrium with glucose in the blood plasma. Two mechanisms account for glucose in the CSF: (1) active transport by endothelial cells, and (2) simple diffusion along a concentration gradient that exists between the blood plasma and the CSF. Because of the time involved for these processes to occur, a CSF glucose value reflects the plasma glucose concentration 30 to 90 minutes preceding collection of the fluid. Accurately interpreting CSF glucose values requires a plasma glucose drawn 0 to 60 minutes preceding the lumbar puncture, preferably a fasting level. Normally, CSF glucose ranges from 50 to 80 mg/dL(2.75–4.40 mmol/L), which is approximately 60% to 70% of the plasma concentration. If a CSF/plasma glucose ratio is calculated, normal values average 0.6.
Increased CSF glucose levels are found after hyperglycemia and traumatic puncture procedures (because of peripheral blood contamination) but have no diagnostic significance. In contrast, low CSF glucose values (<40 mg/dL) are associated with numerous conditions such as hypoglycemic states, meningitis, and infiltration of the meninges with metastatic or primary tumor. More than 50% of meningitis cases have a low CSF glucose level. The mechanism for the low CSF glucose level observed is twofold: decreased or defective transport across the blood-brain barrier and increased glycolysis within the CNS.
Lactate
Lactate is normally present in the CSF at concentrations ranging from 10 to 22 mg/dL (1.1–2.4 mmol/L), and its CSF concentration is essentially unrelated to that of blood plasma. Increased CSF lactate levels result from anaerobic metabolism within the CNS because of tissue hypoxia or decreased oxygenation of the brain. Any condition that impairs the blood supply or the transport of oxygen to the CNS results in increased CSF lactate levels. Numerous conditions that produce high CSF lactate levels include low arterial PO2, cerebral infarction, cerebral arteriosclerosis, intracranial hemorrhage, hydrocephalus, traumatic brain injury, cerebral edema, and meningitis.
Determination of CSF lactate can assist in differentiating meningitis caused by bacterial, fungal, or tuberculous agents from viral meningitis. In viral meningitis, the lactate level rarely exceeds 25 to 30 mg/dL; in contrast, other forms of meningitis usually produce CSF lactate levels greater than 35 mg/dL. It is interesting to note that increased CSF lactate levels are closely associated with low CSF glucose levels and that together these parameters may be a better diagnostic indicator of bacterial meningitis than either parameter alone.
Microbiological Examination
The microbiology laboratory plays a key role in the diagnosis and selection of treatment for meningitis. If a limited volume of CSF is obtained, most often microbiological studies take precedence over all other studies. With identification of the causative agent responsible for meningitis, appropriate antibiotic therapy can begin. Gram staining and other microscopic techniques may reveal the causative agent, whereas a CSF culture can assist in diagnosis but more often confirms it. Similarly, using immunologic tests that detect microbial antigens in the CSF greatly aids in the diagnosis of meningitis.
Usually the second CSF collection tube obtained from a puncture procedure is sent to the microbiology laboratory. This tube or any subsequent tube is preferred because it is less likely than the first tube to contain microbial organisms from the puncture site. The CSF for microbial studies must be maintained at room temperature and should be processed immediately to ensure the recovery of viable organisms. Centrifugation of CSF at 1500 × g for 15 minutes produces a sediment from which smears and cultures are prepared.20
Microscopic Examination of Cerebrospinal Fluid Smears
Because the microscopic examination of concentrated CSF sediment can provide a rapid presumptive diagnosis of meningitis in 60% to 80% of cases, it is imperative that a skilled microbiologist perform the examination (Fig. 9.19). Routine or cytocentrifuged smears can be prepared, with the latter technique concentrating any organisms present into a well-defined area on the slide, facilitating microscopic examination. Gram-stained smears can be difficult to interpret. False-negative results can occur because of the presence of only a small number of organisms. However, precipitated dye and debris, as well as contaminating organisms from reagents and supplies, can lead to false-positive Gram stain results. Although other stains, such as acridine orange, a fluorescent stain, are being evaluated for their sensitivity, the Gram stain remains the most commonly used stain to identify microorganisms in CSF.
If tuberculous meningitis is suspected, the CSF smear is stained with an acid-fast stain. In suspected cases of fungal meningitis, CSF smears are often evaluated by using Gram stain and by putting together an India ink preparation for Cryptococcus neoformans. Because microscopic identification can be insensitive (requires the presence of numerous organisms), immunologic tests are frequently used to assist in the diagnosis of various types of meningitis.
Primary amebic meningoencephalitis (PAM) caused by the amoeba Naegleria fowleri is a rare but deadly disease. Diagnosis can be made from the microscopic identification of amoeboid trophozoites in a cytocentrifuged CSF smear stained with Wright’s stain. The amoebas are 15 to 35 μm in diameter with a sky-blue cytoplasm and a distinct finely granular, violet nucleus (Fig. 9.20). It is also possible during the microscopic examination of a wet mount for motile trophozoites to be observed. It is important to note that trophozoites can significantly degenerate in vivo and in vitro.21 Hence analysis using a polymerase chain reaction (PCR) assay may be needed. N. fowleri inhabit warm freshwater areas and can infect children and young adults who play or relax in these waters. For additional images of this rare amoeba in cytospin preparation, see http://www.cdc.gov/parasites/naegleria/naegleria-fowleri-images.html.
Culture
The most common causes of meningitis are Haemophilus influenzae, Neisseria meningitidis, and Streptococcus pneumoniae; however, numerous other bacteria, fungi, parasites, and viruses can be causative agents. Aerobic culturing of CSF enables the isolation of common types of bacteria in 80% to 90% of cases. However, if antibiotic therapy precedes CSF collection, recovery of bacterial isolates from the specimen can be significantly reduced. In suspected cases of tuberculous meningitis, the chance of positive culture increases with repeat CSF cultures. In cases of suspected meningitis, blood cultures should also be performed. These cultures are positive in 40% to 60% of patients with suspected meningitis and often provide the only clue as to the causative agent.17
Immunologic Methods
Several immunologic assays are currently available to detect the presence of microbial antigens in the CSF (and in serum). The various techniques used include coagglutination, latex agglutination, immunoassay, and counterimmunoelectrophoresis. In these assays, the reagent containing polyclonal antibodies is combined with the CSF; if the microbial antigen is present, a positive test result is obtained. As monoclonal antibodies are developed, the sensitivity and specificity of these assays will improve.
Currently, immunologic tests can be used to detect several bacterial and fungal organisms that cause meningitis. The latex slide agglutination test for Cryptococcus antigen is widely used because of its high sensitivity (60% to 99%) and specificity (80% to 99%). In addition, this test serves as a good prognostic indicator, with increasing titers suggesting spread of the disease and decreasing titers associated with response to treatment. Similarly, immunologic assays for Coccidioides immitis, Mycobacterium tuberculosis, Haemophilus influenzae, Neisseria meningitidis, Streptococcus pneumoniae, and group B streptococci are available. Although these assays generally are rapid and easy to perform, they do not have equivalent diagnostic value. Sensitivity and specificity vary with each assay, and false-positive nonspecific reactions and false-negative reactions can occur. Consequently, CSF Gram stain and culture remain the standard for the diagnosis of bacterial and fungal meningitis.
At times, to assist in the diagnosis of neurosyphilis, a request for a venereal disease research laboratory (VDRL) test on CSF may be received. Although the VDRL-CSF test is highly specific for syphilis, it should not be used as a “screening” test because it yields a high percentage of false negatives (i.e., low sensitivity). In other words, a nonreactive result does not rule out neurosyphilis. Therefore the VDRL-CSF should be performed only when the patient’s serum fluorescent treponemal antibody absorbed test (FTA-ABS) result is reactive (positive).
Study Questions
- 1. Cerebrospinal fluid (CSF) is produced primarily from
- 2. Cerebrospinal fluid is found between the
- 3. Which of the following statements regarding CSF is true?
- A. Cerebrospinal fluid is constantly produced.
- B. Cerebrospinal fluid is reabsorbed into the blood at the choroid plexus.
- C. Cerebrospinal fluid is essentially composed of diluted plasma.
- D. Cerebrospinal fluid circulates through the brain and spinal cord because of active and passive diffusion processes.
- 4. Which of the following substances does not normally pass through the blood-brain barrier?
- 5. During a lumbar puncture procedure, the first collection tube of CSF removed should be used for
- 6. Which of the following is not an analytical concern when the processing and testing of CSF are delayed?
- 7. Pleocytosis is a term used to describe
- 8. All of the following can cause xanthochromia in the CSF except
- 9. In the CSF, which of the following findings indicates a traumatic puncture?
- 10. How many leukocytes are normally present in the CSF obtained from an adult?
- 11. Which of the following cells can be present in small numbers in normal CSF?
- 12. Which of the following cell types predominate in the CSF during a classic case of bacterial meningitis?
- 13. Which of the following cell types predominate in the CSF during a classic case of viral meningitis?
- 14. When choroid plexus cells and ependymal cells are present in the CSF, they
- 15. All of the following proteins are normally present in the CSF except
- 16. Which of the following events does not result in an increased CSF total protein?
- 17. Which of the following proteins in the CSF is used to monitor the integrity of the blood-brain barrier?
- 18. An immunoglobulin G index greater than 0.70 indicates
- 19. An unknown fluid can be positively identified as CSF by determining the
- 20. Which of the following statements about oligoclonal bands is false?
- A. In the CSF, these bands indicate increased intrathecal concentrations of immunoglobulin G.
- B. The bands usually correlate with the stage of disease and can be used to predict disease progression.
- C. The bands are often present in the CSF and serum of individuals with a lymphoproliferative disease.
- D. The bands are often present in the CSF but not in the serum of individuals with multiple sclerosis.
- 21. Which of the following statements about CSF glucose is false?
- A. Increased CSF glucose values are diagnostically significant.
- B. Glucose enters the CSF by active transport and simple diffusion.
- C. Decreased CSF glucose values reflect a defective blood-brain barrier and increased glycolysis.
- D. CSF glucose values reflect the plasma glucose concentration 30 to 90 minutes preceding collection.
- 22. Normal CSF lactate levels (less than 25 mg/dL) are commonly found in patients with
- 23. Which of the following procedures frequently provides a rapid presumptive diagnosis of bacterial meningitis?
- 24. India ink preparations and microbial antigen tests on the CSF can aid in the diagnosis of
A 4-year-old girl is brought to the emergency room by her parents. She is lethargic, reports that her head hurts, and shows signs of stiffness in her neck. Her mother states that she has had “a temperature” for the past 2 days; her current temperature is determined to be 104°C. She is admitted to the hospital, where blood is drawn and a lumbar puncture performed. Cerebrospinal fluid and pertinent blood chemistry results follow.
| Blood Chemistry Results | Reference Interval |
|---|---|
| Glucose, fasting: 90 mg/dL | <110 mg/dL |
Cerebrospinal Fluid Results
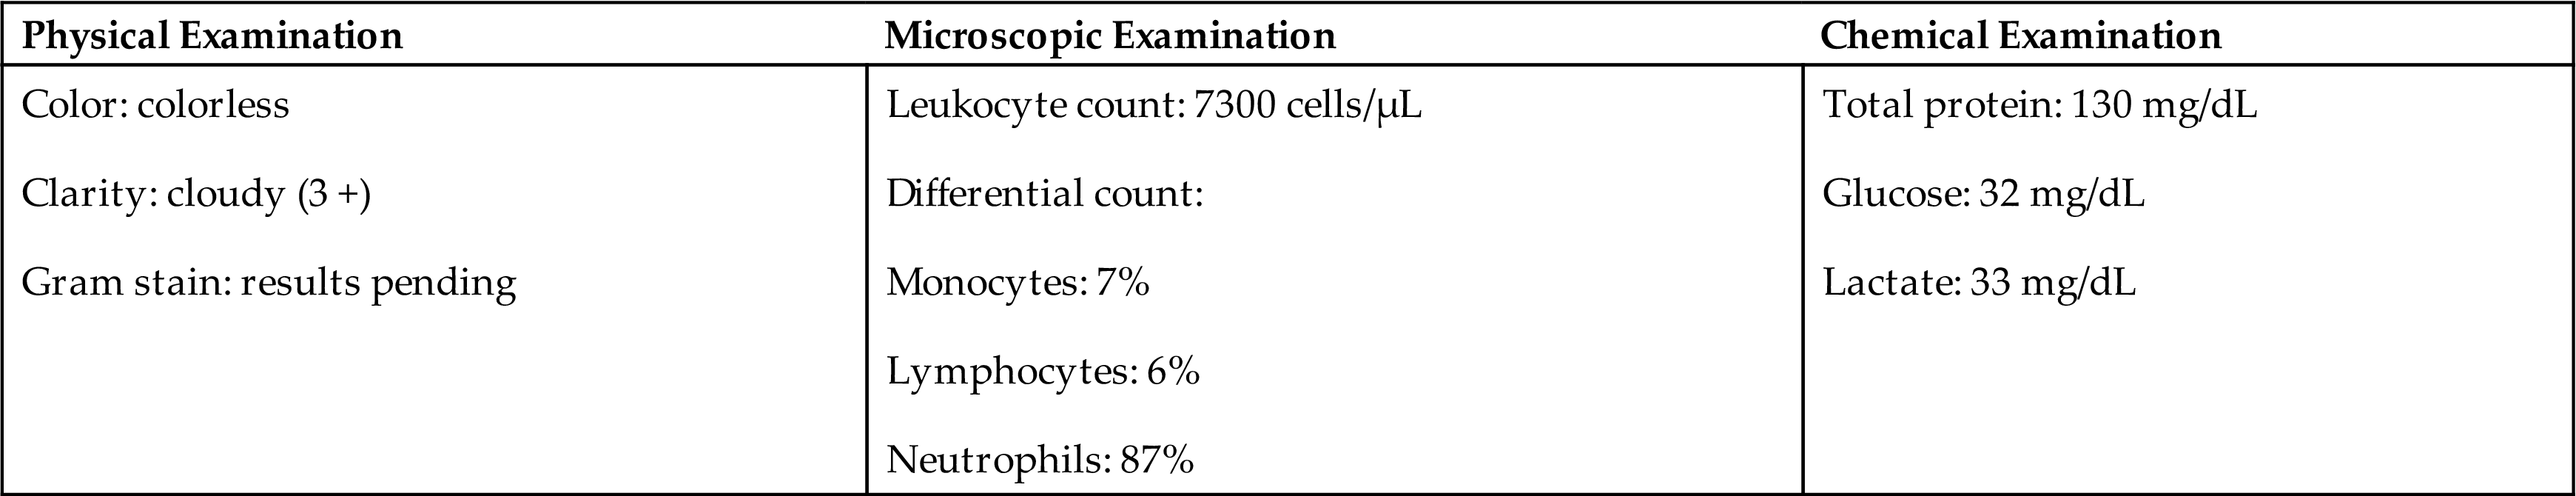
- 1. List any abnormal results.
- 2. Calculate the CSF/plasma glucose ratio.
- 3. These results are most consistent with a preliminary diagnosis of
- 4. Does the CSF lactate value assist in determining a diagnosis for this patient?
- 5. Situation: If Gram stain results are negative (i.e., no organisms seen), would you change the diagnosis selected in Question 3? Why or why not?
- 6. Briefly explain the physiologic mechanisms that account for the CSF total protein and glucose values.
A 39-year-old woman noticed numbness in her left leg and difficulty walking approximately 3 months ago. Since that time, the numbness seems to come and go, along with episodes of dizziness. More recently, she has experienced numbness on the right side of her face and “blurred” vision in her right eye that comes and goes. She gets tired easily and often feels unsteady while upright and walking. She is admitted to the hospital for tests. Cerebrospinal fluid and pertinent blood chemistry results follow.
| Blood Chemistry Results | Reference Interval |
|---|---|
| Glucose, fasting: 85 mg/dL | <110 mg/dL |
| Albumin: 4.6 g/dL | 3.5–5.0 g/dL |
| Immunoglobulin G: 1.4 g/dL | 0.65–1.50 g/dL |
Cerebrospinal Fluid Results
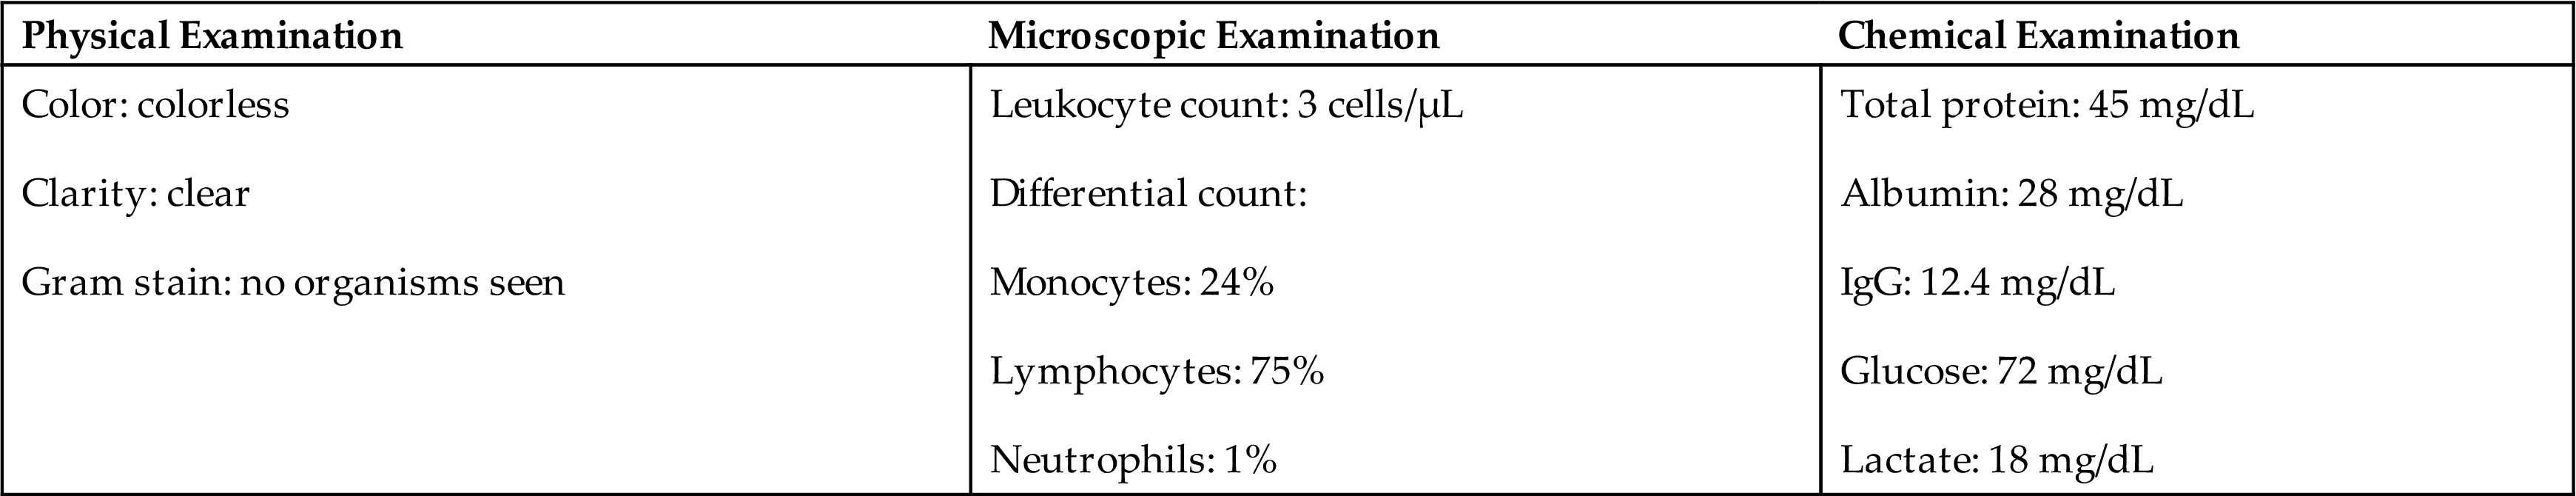
- 1. List any abnormal results.
- 2. Calculate the CSF/serum albumin index as follows:

- 3. Why is the CSF/serum albumin index a good indicator of the integrity of the blood-brain barrier?
- 4. Calculate the CSF IgG index as follows:

- 5. Suggest a diagnosis that is consistent with the results obtained and the patient history.
- 6. Based on the diagnosis chosen, state two additional chemical tests that could be performed to confirm this diagnosis, and indicate the results expected.