Mechanics of Ventilation
After reading this chapter, you will be able to:
- • Explain how elastic recoil forces the lungs and chest wall to interact to determine the resting lung volume.
- • Describe how static lung volumes and capacities are influenced by changes in the elastic recoil forces of the lungs and chest wall.
- • Describe the pressure gradients that determine lung volume and airflow rate into and out of the lungs.
- • Describe how spontaneous breathing and positive-pressure mechanical breathing are different and similar in the way they create pressure gradients throughout the respiratory cycle.
- • Describe how the rib cage, diaphragm, and abdomen move and interact in normal and abnormal breathing conditions.
- • Interpret static and dynamic pressure-volume curves of the lungs, the thorax, and the lung–thorax system.
- • Distinguish between lung compliance and airway resistance as causes of abnormally high lung inflation pressure during mechanical ventilation.
- • List factors that cause lung compliance and airway resistance to change.
- • Describe how surface tension and pulmonary surfactant influence lung compliance, inflation pressure, alveolar stability, and work of breathing.
- • Explain what causes the lung’s pressure-volume curve to exhibit hysteresis.
- • Explain how to use pressure-volume and time-pressure curves to distinguish between elastic and frictional forces that oppose lung inflation.
- • Explain the role lung volume plays in determining whether expiratory flow rate is effort-dependent or effort-independent.
- • Explain how lung compliance and airway resistance determine passive emptying and filling rates of the lung during breathing.
- • Describe factors that predispose the lung to incomplete exhalation and trapping of air in the alveoli at the end of expiration.
- • Explain how work of breathing, respiratory muscular strength, and respiratory muscular fatigue are clinically assessed.
Key Terms
abdominal paradox
airway resistance (Raw)
asynchrony
atelectasis
auto-PEEP
barotrauma
body plethysmograph
closing volume
compliance
compliance curve
critical closing pressure
critical opening pressure
dipalmitoyl phosphatidylcholine (DPPC)
dynamic compliance (Cdyn)
elastance
elasticity
equal pressure point (EPP)
exocytosis
expiratory reserve volume (ERV)
frequency dependence of compliance
frequency-to-VT (f/VT) ratio
functional residual capacity (FRC)
Hooke’s law
hysteresis
inspiratory capacity (IC)
intrinsic PEEP
isovolume pressure-flow curve
kyphoscoliosis
Laplace’s law
maximum expiratory pressure (MEP)
maximum inspiratory pressure (MIP)
peak pressure (Ppeak)
pendelluft
phosphatidylglycerol (PG)
plateau pressure (Pplat)
Poiseuille’s law
positive end-expiratory pressure (PEEP)
pressure gradients
pressure-time index (PTI)
pulmonary edema
pulmonary fibrosis
pulmonary surfactant
rapid shallow breathing index (RSBI)
residual volume (RV)
respiratory distress syndrome (RDS)
Reynolds’ number (Re)
single-breath nitrogen elimination test
specific compliance
sphingomyelin
spirogram
spirometer
static compliance (Cst)
surface tension
tension-time index of the diaphragm (TTdi)
tension-time index of the inspiratory muscles (TTmus)
tidal volume (VT)
time constant (TC)
total lung capacity (TLC)
transdiaphragmatic pressure (Pdi)
transpulmonary pressure (PL)
transrespiratory pressure (Prs)
transthoracic pressure (Pw)
viscosity
viscous resistance
vital capacity (VC)
Resistance to lung inflation is categorized as (1) elastic resistance and (2) nonelastic or frictional resistance. Frictional resistance exists only under dynamic conditions—that is, when gas moves through the airways and tissues slide over one another. In contrast, elastic resistance exists under both dynamic and static (no air movement) conditions. Normally, the ventilatory muscles easily overcome elastic and frictional resistances, and the work of breathing (WOB) is minimal and endlessly sustainable.
When the ventilatory muscles are completely relaxed and there is no airflow, the lungs and chest wall (thorax) have equal but oppositely directed recoil forces that exactly balance each other; the equilibrium between these two forces determines the resting lung volume. The static and dynamic characteristics of the lung and chest wall system influence the WOB and distribution of inspired gas in the lung. Understanding normal lung–thorax mechanics is essential for the clinician to rationally treat patients with lung disease.
Static Lung and Chest Wall Mechanics
Elastic Recoil of the Lungs and Thorax
Elasticity is the force with which an object returns to its original shape after being stretched. The stretching of a highly elastic object generates a strong recoil force. The healthy lung has a tendency to recoil inward and pull away from the chest wall. At the same time, the thorax (i.e., chest wall) has a tendency to recoil outward, away from the lung. These two oppositely directed recoil forces create a subatmospheric pressure in the pleural space between the lung and chest wall. The lung’s elastic recoil force is generated by (1) elastic and collagen fibers of the lung parenchyma and (2) surface-tension forces of the thin liquid film lining the alveoli. Of these two factors, surface tension contributes the most to the lung’s recoil force.
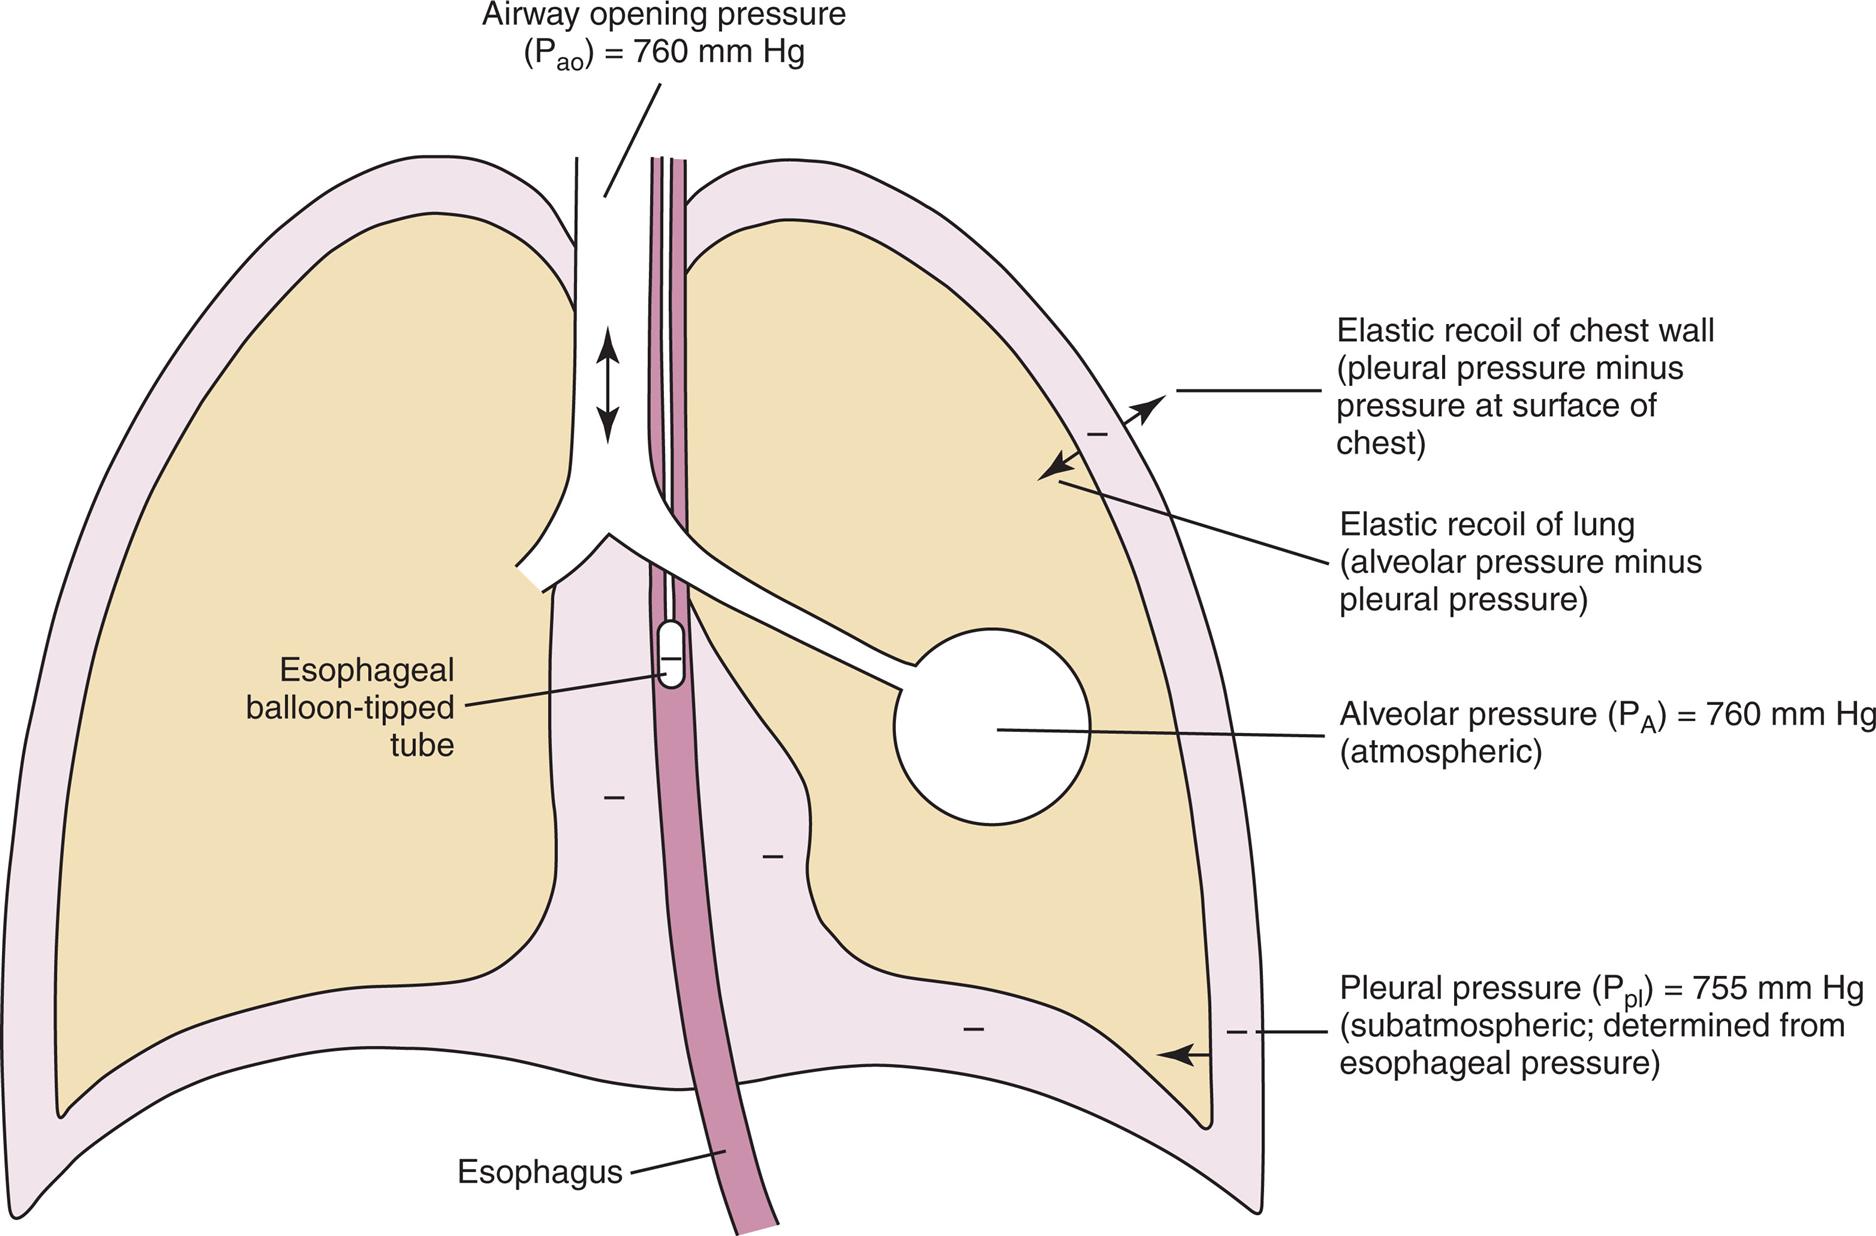
As the lung and chest wall recoil in opposite directions, the pressure between the pleural membranes decreases (Boyle’s law). No true space normally exists between the visceral and parietal pleurae; however, if a small tube were placed through the chest wall between these membranes, a space would be created, and the pressure measured through the tube would be subatmospheric. This method of obtaining intrapleural pressure (Ppl) would be invasive and hazardous for clinical purposes; changes in Ppl can be measured more safely through a balloon-tipped catheter placed in the esophagus with the tip of the catheter well inside the thoracic cavity (Fig. 3.1). The thin-walled esophagus has little muscle tone and easily transmits Ppl changes to the balloon on the end of the catheter. Changes in intraesophageal balloon pressure reflect the changes in Ppl. Fig. 3.1 shows lung and thorax recoil forces and the resulting pressures.
Pressure Gradients During Ventilation
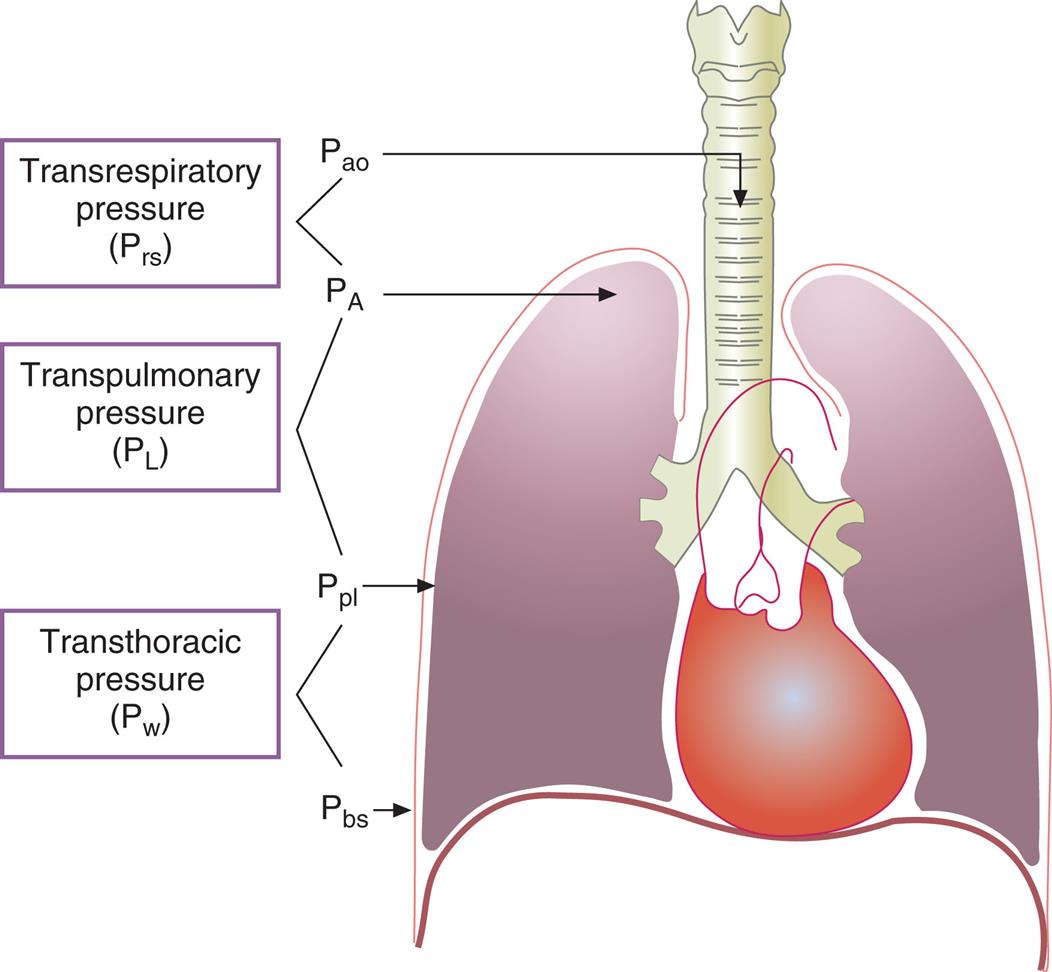
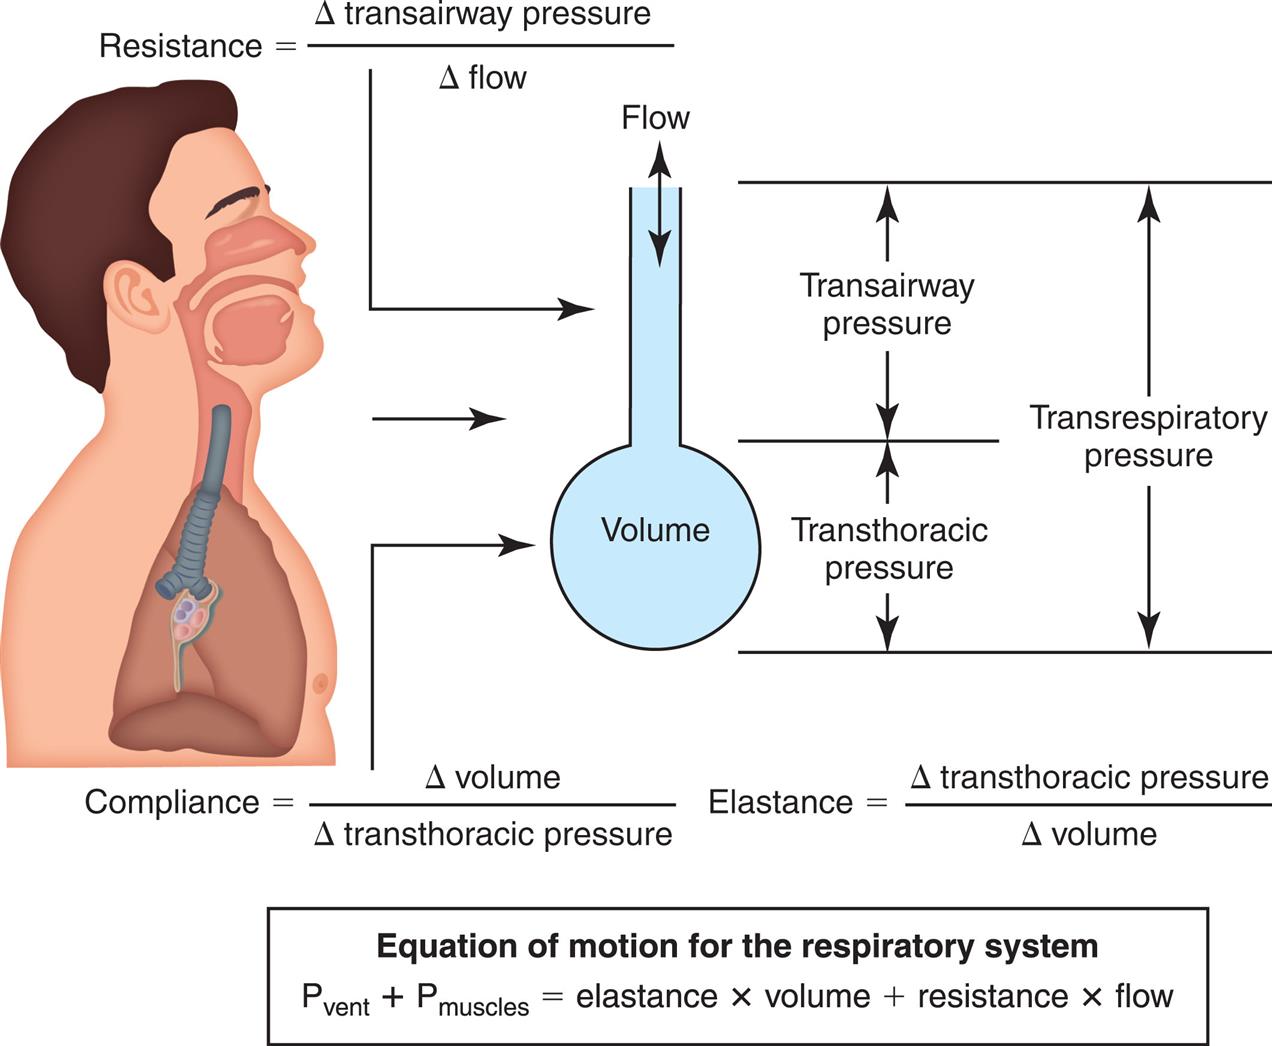
Fig. 3.2 illustrates various pressure differences or gradients involved in ventilation. Airway pressures are usually expressed using atmospheric pressure as the zero reference value. A pressure of 0 mm Hg does not refer to an absolute lack of pressure but to atmospheric pressure (760 mm Hg at sea level). In this sense, a subatmospheric pressure of 755 mm Hg represents a “negative” pressure of 5 mm Hg. Likewise, a pressure of 765 mm Hg represents a “positive” pressure of 5 mm Hg. (Of course, all pressures are positive and cannot be truly negative. However, in this book, the terms negative and positive with regard to pressure refer to subatmospheric and supra-atmospheric pressures.)
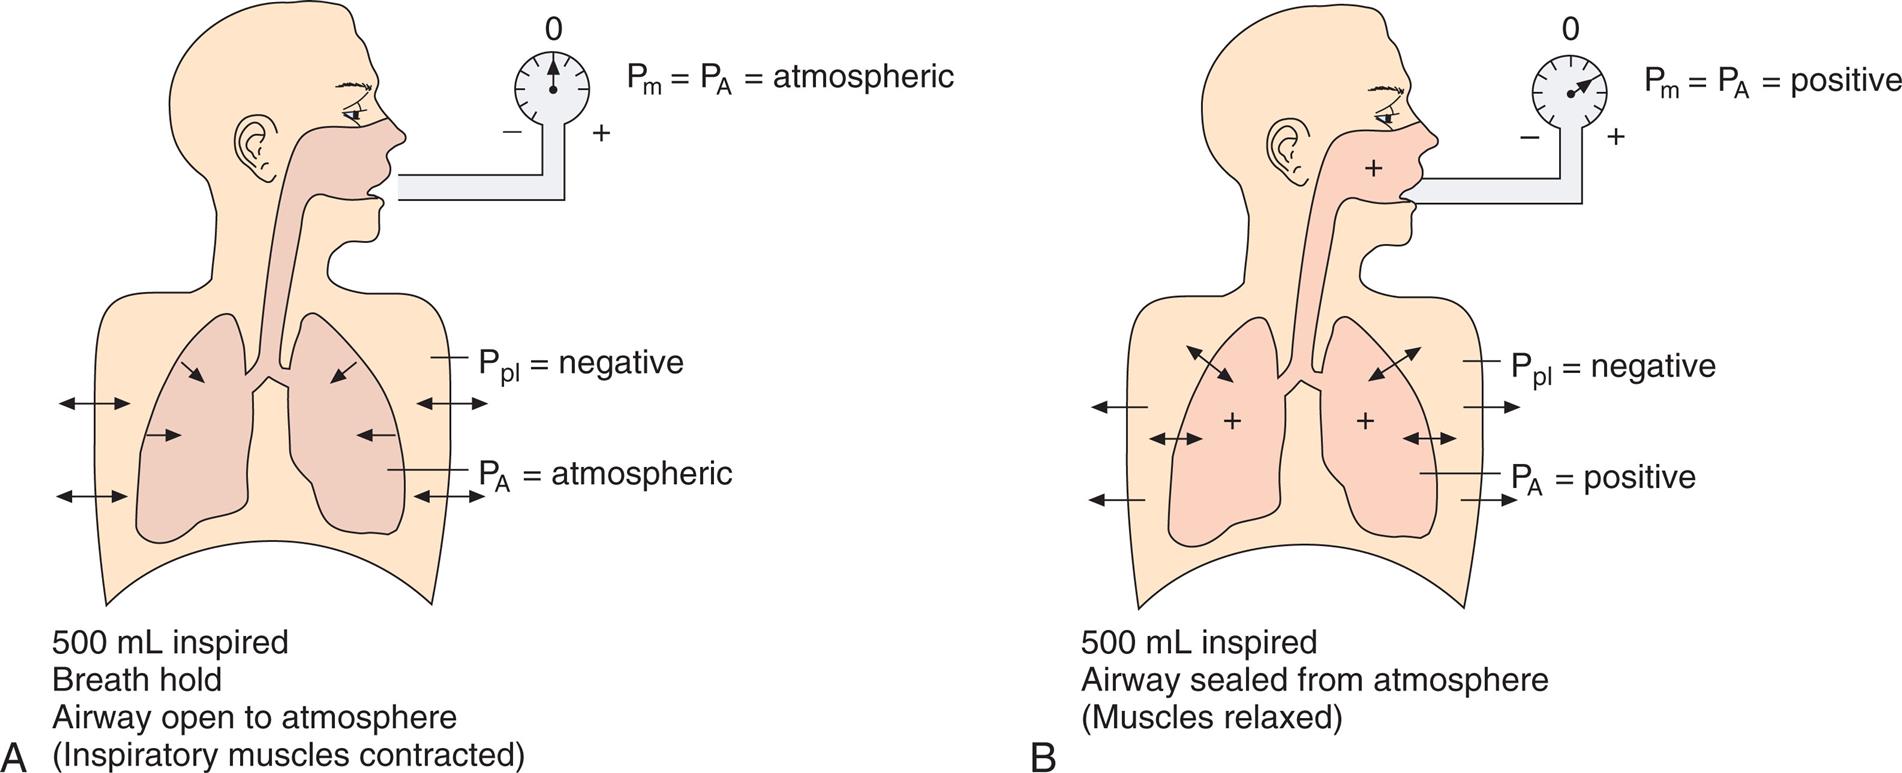
Pressure at the mouth or the airway opening (Pao) is always equal to atmospheric pressure, or 0 mm Hg during normal spontaneous breathing (SB). Pressure at the body surface (Pbs) is also by definition 0 mm Hg. Alveolar pressure (PA), also called intrapulmonary pressure, is negative during inspiration, 0 mm Hg when airflow is absent, and positive during expiration. Ppl is always negative during normal quiet breathing for reasons discussed previously. The more strongly the lung’s recoil force tries to pull the lung away from the chest wall, the more negative the Ppl. When no air is moving and the lung is stationary, the inward recoil pressure of the lung is exactly balanced by the outward recoil pressure of the chest wall, creating a negative pressure between the two structures of about −5 cm H2O (i.e., Ppl is normally negative); because there is no air movement, the PA is zero. In other words, PA is equal to the sum of chest wall and lung recoil pressures.
Pressure gradients are simply pressure differences between two points that cause air to move in or out of the lungs and are responsible for keeping the lungs in an inflated state. Air, or any gas always flows from a point of high pressure to a point of low pressure; a pressure gradient of 0 mm Hg means there is no pressure difference between the two points and no airflow. Important pressure gradients in ventilation are the transpulmonary pressure (PL), transthoracic pressure (Pw), and transrespiratory pressure (Prs) (see Fig. 3.2). (See Appendix I for a summary of pressure symbols in ventilatory mechanics.)
Prs is the difference between alveolar and body-surface pressures (Prs = PA − Pbs) or the pressure difference across the entire respiratory system (lungs plus chest wall). Because both Pbs and Pao are atmospheric during normal breathing, Pao can be substituted for Pbs in the previous equation (Prs = PA − Pao, as shown in Fig. 3.2). This equation shows that Prs is actually equal to the pressure difference across the airways, that is, between the mouth and alveoli; for this reason, Prs is sometimes called the transairway pressure (PTA). It should be apparent that PTA is responsible for airflow in and out of the lung. The reason why no airflow exists at the end of inspiration or at the end of expiration is that PA is equal to Pao under both of these conditions, which means Prs or PTA is 0 mm Hg at these two points in the breathing cycle. In normal SB, PTA changes only when the PA changes, because Pao is equal to atmospheric pressure and remains constant at 0 mm Hg. The magnitude of PTA (i.e., the size of the difference between mouth and alveolar pressures) is affected by how much frictional resistance the airways pose to airflow: the greater this pressure difference, the greater the airway resistance.
The transpulmonary pressure (PL) gradient is the difference between alveolar and intrapleural pressures (PL = PA − Ppl); in other words, PL is the pressure inside the alveoli minus the pressure outside the alveoli, or the distending pressure across the alveolar walls. PL is equal to the elastic recoil force of the lungs when there is no airflow—that is, the lung’s inward recoil creates a subatmospheric intrapleural pressure (Ppl) that exactly counterbalances the lung’s recoil force and prevents it from recoiling further. Alveolar pressure is always greater than pleural pressure in the intact normal lung–thorax system; the difference between these two pressures (PL) is the pressure gradient that keeps the alveoli inflated. If PL increases, alveolar volume increases, and vice versa; lung volume changes can only occur if PL changes. Breathing, whether spontaneous or mechanically induced, consists of the cyclical increase and decrease of PL.
Refer to Fig. 3.4. At the end of a spontaneous 500-mL inspiration, the PA is 0 mm Hg; at the end of a positive-pressure lung inflation to 500 mL, PA is 10 mm Hg. Explain how it is possible for the lung to contain the same volume at these two different alveolar pressures.

Transthoracic pressure (Pw) is the difference between Ppl and Pbs, or the pressure difference across the thoracic wall (Pw = Ppl − Pbs). It is equal to the outward recoil force of the thorax when there is no airflow. The stronger this outward recoil force, the greater the Pw. Pw is a reflection of thoracic wall recoil force alone.
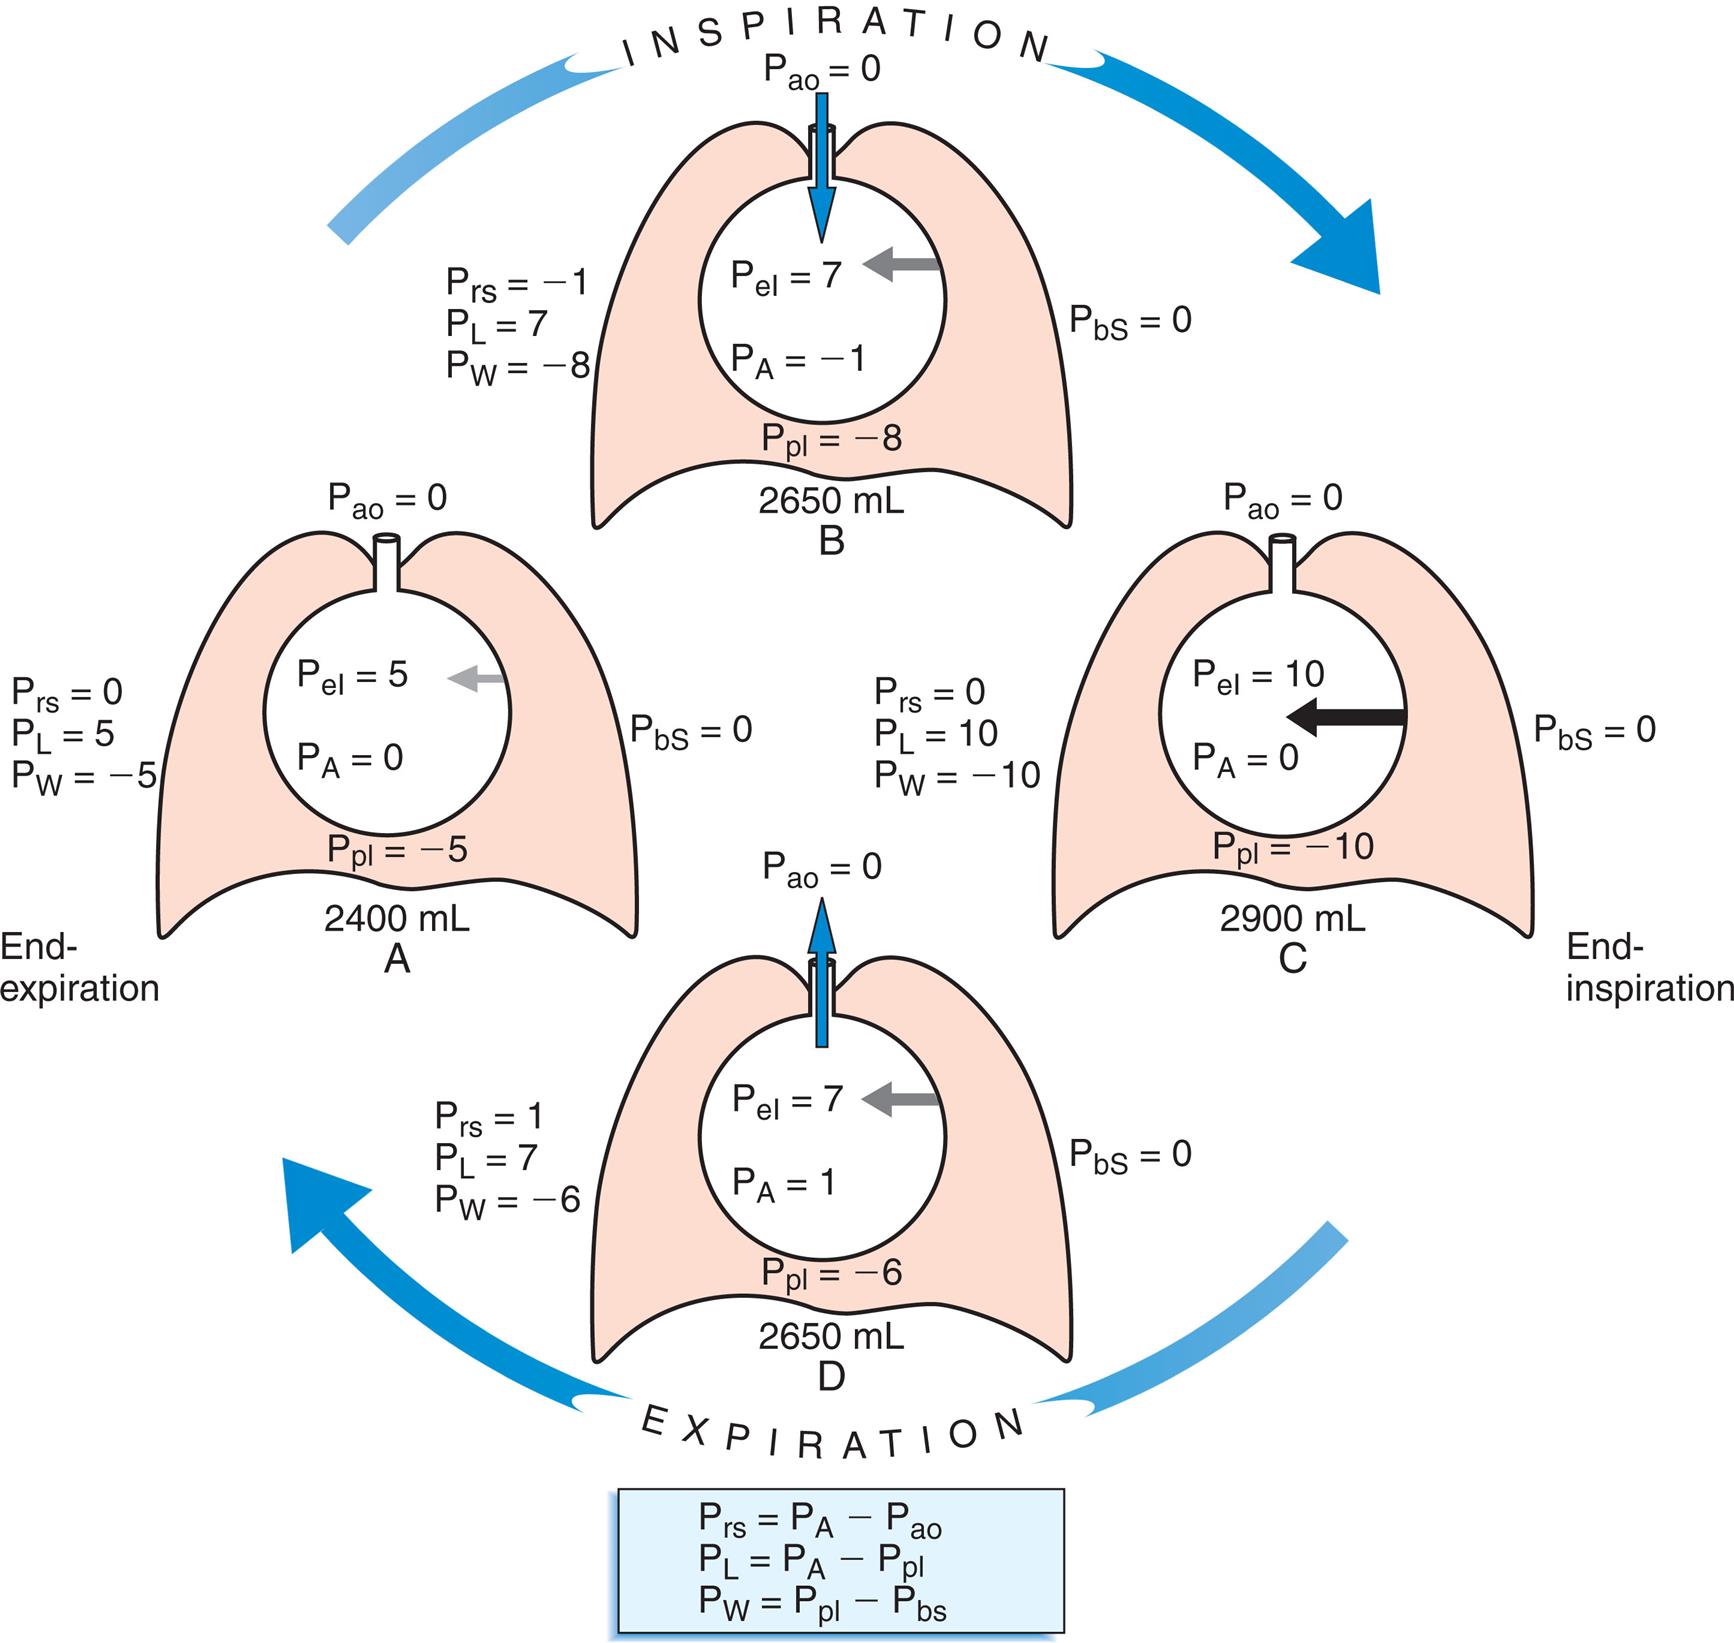
Fig. 3.3 illustrates changes in pressures during the respiratory cycle (inspiration and expiration). At the end of a resting expiration when all airflow has ceased, PA = 0 cm H2O, and the elastic recoil force of the lungs (Pel) is equal to a pressure of about 5 cm H2O (Fig. 3.3, A). This means Ppl must be −5 cm H2O (PA is the sum of alveolar recoil pressure plus Ppl). Therefore transpulmonary pressure (PL) at this point is about 5 cm H2O. The PL is calculated as follows:


By convention, PL is expressed as a positive number because it is the pressure that distends the lung. Corresponding with a PL of 5 cm, H2O is a counterbalancing transthoracic pressure of −5 cm H2O, shown as follows:


When all muscles are relaxed and no air is flowing, the inward and outward recoil forces of the lungs and thorax are in equilibrium with each another (see Fig. 3.3, A). The Prs (pressure difference between the alveoli and the body surface) is the sum of PL plus Pw and is 0 mm Hg under the resting conditions just described. This is illustrated as follows:


The act of inspiration (see Fig. 3.3, moving from A to B to C) disrupts the equilibrium between lung and thoracic recoil forces. The ventilatory muscles contract and increase the thoracic dimensions as explained in Chapter 2. Consequently, Ppl decreases (as described by Boyle’s law), which increases the PL gradient (PA − Ppl), “pulling” the alveoli to larger volumes. This causes PA to fall below Pao, establishing a pressure gradient for airflow into the lungs (see Fig. 3.3, B). Air stops flowing into the lungs when PA equalizes with Pao (see Fig. 3.3, C). At this point, PL is at its maximum value in the respiratory cycle (i.e., the difference between PA and Ppl is greatest), corresponding with an inhaled volume of 500 mL in this example.
Expiration begins when ventilatory muscles relax, allowing lung recoil forces to shrink the thoracic cavity passively to its resting volume (see Fig. 3.3, moving from C to D). As the thoracic volume decreases, Ppl increases (becomes less negative), narrowing the gap between Ppl and PA. This decreases PL, which reduces the lung’s dimensions and compresses the lung’s air, causing PA to rise above Pao. Gas then flows out of the lungs, reestablishing the initial pre-inspiratory conditions (see Fig. 3.3, from D to A).
Rib Cage and Diaphragm–Abdomen Components of the Thorax
To this point, the thorax has been considered as if it were a single unit. It is more accurate to think of the thorax as having two components: (1) the rib cage and (2) the diaphragm–abdomen complex.1 The rib cage and diaphragm are coupled but can act independently during ventilation. Rib cage movements change the anteroposterior and lateral dimensions of the thorax, and diaphragm movements displace the abdominal organs (during inspiration) and change vertical thoracic dimensions. Normally, abdominal displacement predominates during quiet breathing, whereas rib cage displacement predominates when one breathes large volumes near maximum lung capacity.1 If abdominal displacement by the diaphragm (i.e., downward diaphragm movement) is hampered by obesity, pregnancy, or an otherwise distended abdomen, breathing becomes more dependent on rib cage displacement. The WOB then increases because it is more difficult to inflate the lung when the diaphragm resists movement.
Static Lung Volumes and Capacities
The total lung capacity (TLC) is the amount of gas the lung contains after a maximal inspiratory effort. All other lung volumes are natural subdivisions of the TLC. The term “capacity” refers to the combination of two or more volumes; volumes are basic, non-overlapping components of the TLC.
Measurement of Lung Volumes—Spirometry
Spirometry is the process of measuring volumes of air moving in and out of the lungs. A spirometer is the device used to measure these volumes. The spirogram is a graphical record (volume vs. time) of lung volumes made by a spirometer. A classic water-seal spirometer is shown in Fig. 3.5. Understanding the function of the now outdated water-seal spirometer helps one understand the interrelationships between volumes and capacities. (Modern spirometers are electronic, microprocessor-controlled devices.)
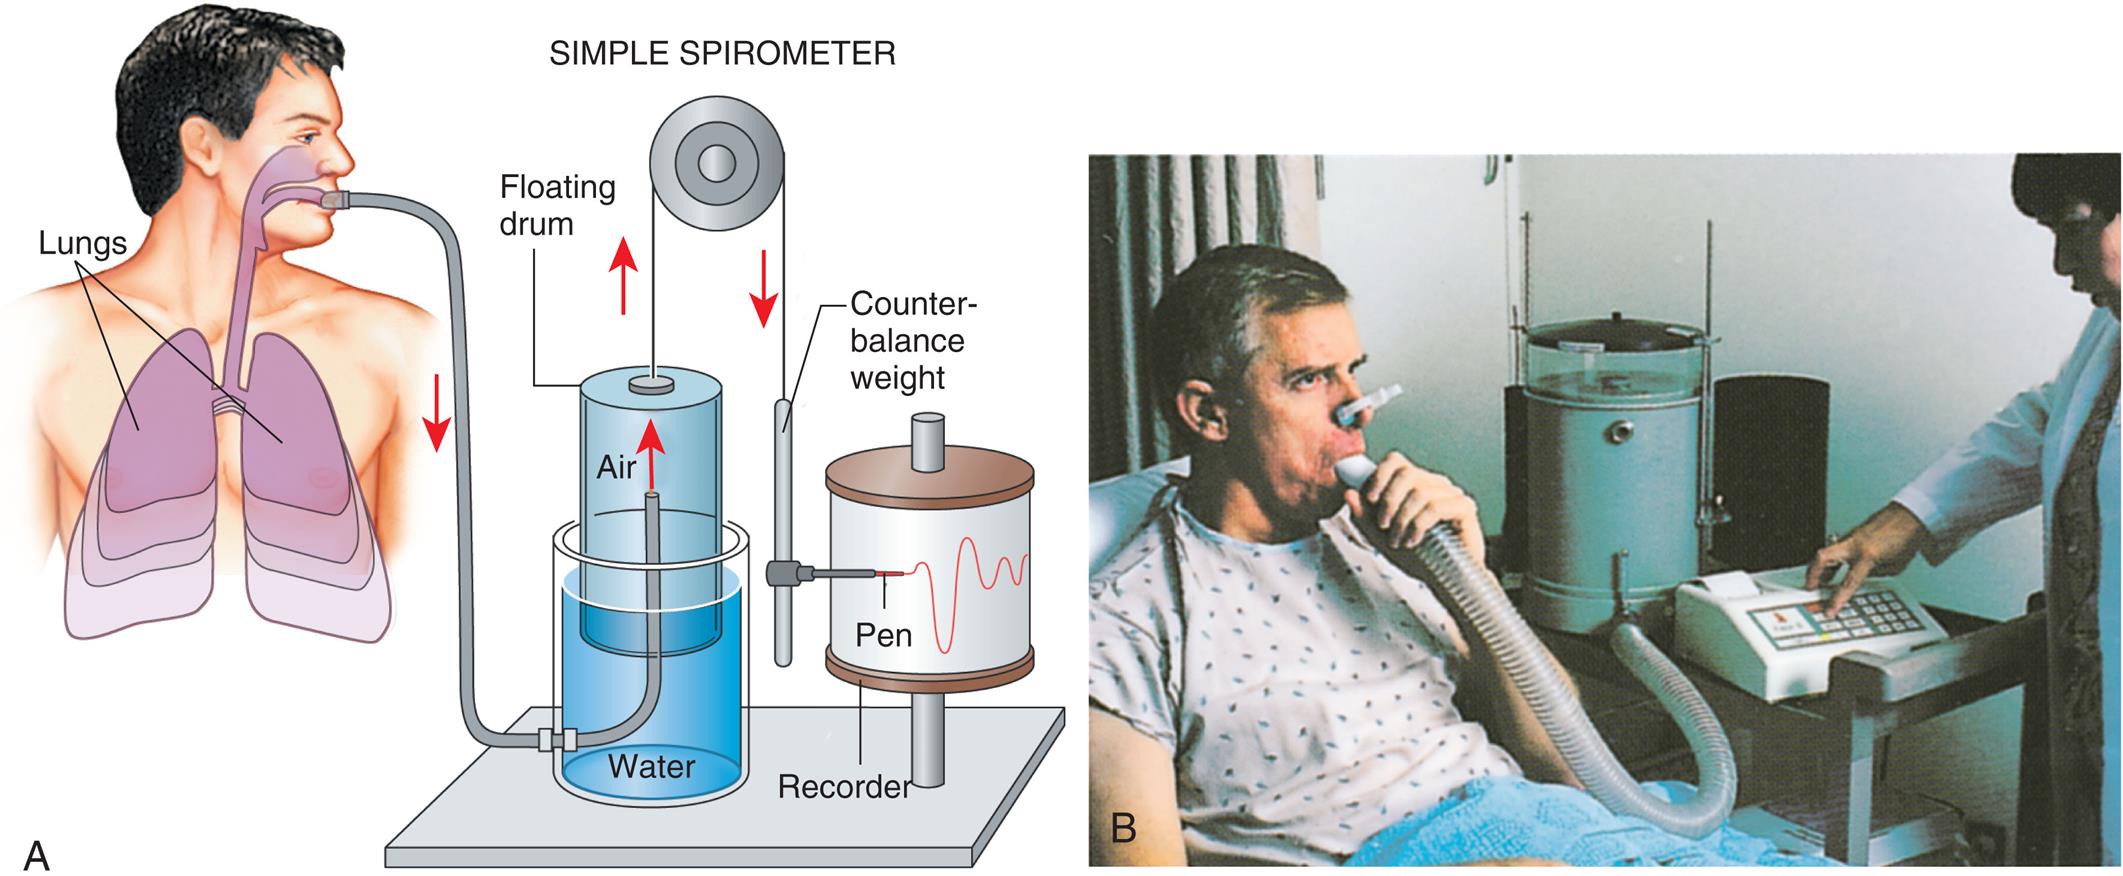
While wearing nose clips to occlude the nostrils, the patient inhales and exhales through a large tube inserted snugly into the mouth (see Fig. 3.5). Exhaled air enters the inverted cylinder (bell), which is suspended by a chain draped over a pulley. The open end of this bell fits loosely over a smaller cylinder and floats in a water-filled sleeve. The other end of the chain holding the bell is attached to a recording pen and counterweight, which exactly balance the weight of the floating bell. The water provides a seal from atmospheric air and allows nearly frictionless movement of the bell. Bell movements cause the pen to move up and down, inscribing reciprocal tracings on recording paper wrapped around a drum rotating at a constant speed, creating a graphic representation of volume (vertical axis) versus time (horizontal axis) (Fig. 3.6).
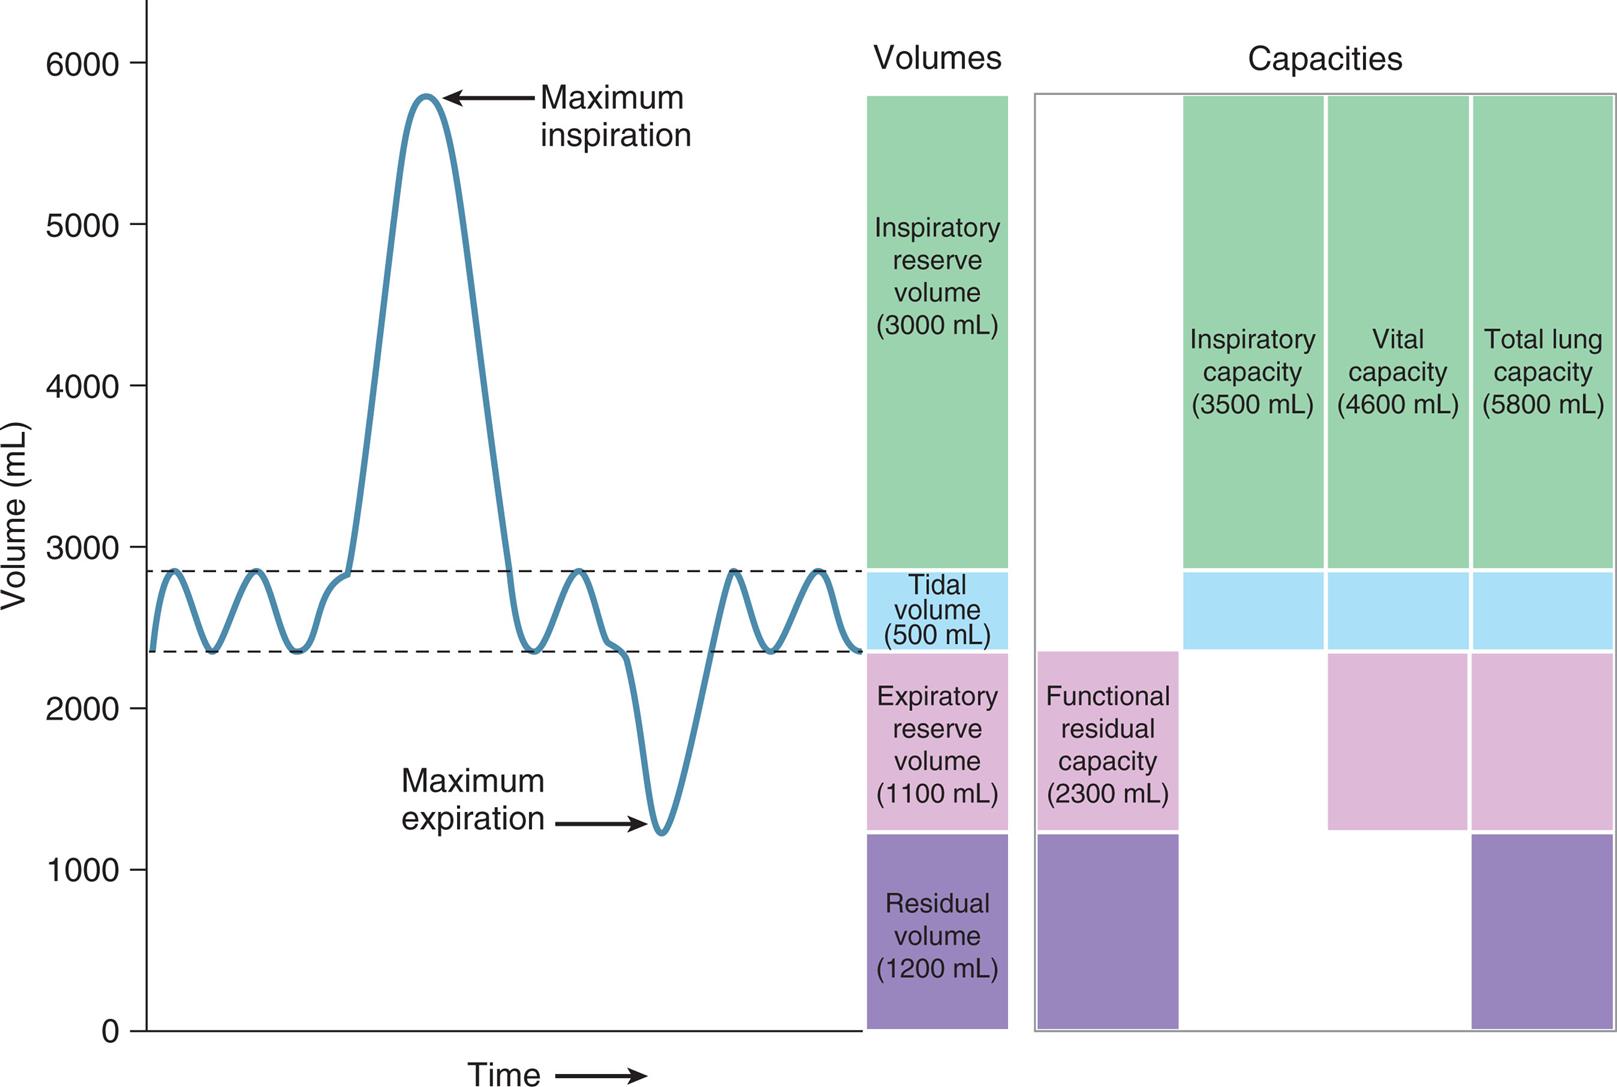
Fig. 3.6 reveals that not all of the TLC is accessible to the spirometer. The residual volume (RV) cannot be exhaled, even with the greatest expiratory effort, because the rigid rib cage prevents total lung deflation. RV must be measured indirectly through other techniques (see Chapter 5).
Fig. 3.6 illustrates the four lung volumes and four lung capacities. The measurements for each are approximate and vary according to an individual’s height, gender, and age. The descriptions and symbols for the static lung volumes and capacities are shown in Table 3.1. (See also Appendix I.)
Table 3.1
ERV, Expiratory reserve volume; FRC, functional residual capacity; IRV, inspiratory reserve volume; RV, residual volume; TLC, total lung capacity; TV, tidal volume; VC, vital capacity; VT, tidal volume.
The tidal volume (VT) is the volume of air inhaled or exhaled with each breath. The vital capacity (VC) defines the maximum limits of a single breath—that is, from maximum-effort inspiration to maximum-effort expiration. Theoretically, the VT could increase until it equals the VC, but this never occurs, even with the most strenuous exercise. The functional residual capacity (FRC) is the amount of air in the lungs at the point of ventilatory muscle relaxation, also known as the resting level, or end-tidal exhalation level. Normally, about 40% of the TLC is contained in the lung at this resting FRC level. Expiratory (abdominal) muscle contraction is required to exhale any portion of the FRC, which involves the exhalation of expiratory reserve volume (ERV). The balance point between inward lung recoil and outward chest wall recoil determines the FRC’s volume. Any factor that decreases lung recoil force increases the FRC and decreases the inspiratory capacity (IC). Any factor that increases lung recoil force decreases the FRC and decreases the TLC and VC. (Chapter 5 reviews these interrelationships in more detail.)
During resting VT breathing, only inspiration requires muscular (diaphragmatic) contraction. Tidal exhalation is a result of passive lung recoil; normally, no muscular effort is required to exhale. The end-tidal exhalation level is the point of total relaxation of all ventilatory muscles. Tidal exhalation ends when lung and chest wall recoil forces reestablish their recoil equilibrium point.
Maximum Static Inspiratory and Expiratory Pressures
Maximum inspiratory pressure (MIP) and maximum expiratory pressure (MEP) depend on ventilatory muscle strength. (Alternative symbols are PImax and PEmax.) These pressures are measured under static conditions while a person inhales or exhales with maximal effort against an occluded tube attached to a pressure gauge. During this measurement, the nose is blocked and the lips are sealed tightly around the tube to prevent air leaks.
The maximum pressures generated depend on the lung volumes at which they are measured. The MIP generating capacity is greatest at RV because diaphragmatic muscle fibers are maximally lengthened. The same principle is true for MEPs. At TLC, expiratory muscles are fully stretched, and a maximal expiratory effort may generate up to 230 cm H2O. At RV, expiratory muscle fibers are maximally contracted, and no expiratory pressure can be generated.
Average MEP and MIP results for adults are shown in Table 3.2.2 These pressures represent considerable reserve muscle strength. Measurements of MIP and MEP may be used clinically to assess the ability of a patient to sustain spontaneous, unassisted ventilation; MIP is more often used in this regard, although its measurement tends to vary, depending on the clinician performing the test. Severe reduction of inspiratory muscle strength is present if the patient cannot generate a subatmospheric pressure greater than −30 cm H2O MIP.3
Static Pressure-Volume Relationships
The pressure required to inflate the lung under static (no air flow) conditions reflects the elastic properties of the lung–thorax system. In the clinical setting, a pressure-volume (P-V) graph can be constructed by the measurement of several static inflation pressures and their corresponding volumes. Pressures are plotted on the horizontal axis of the graph, and volumes are plotted on the vertical axis.
Hooke’s Law and Elastic Recoil
Over the normal physiological range of tidal breathing, the lung’s expansion in response to increasing pressures conforms to Hooke’s law. Hooke’s law states that an elastic structure changes dimensions in direct proportion to the amount of force applied. Each unit of pressure applied to the lung causes a given unit of volume to enter the lung. As the lung volume increases, lung recoil force increases. A linear relationship is maintained between pressure and volume up to the elastic limit. If the elastic limit is exceeded, lung rupture is imminent.
Hooke’s law oversimplifies the response of the lung to increasing pressures. Although the inflation P-V curve is relatively linear in the VT range, a curve that plots the VC against the lung’s distending pressure (PL) is more S-shaped. Moreover, the deflation curve follows a different path than the inflation curve, which is explained in the next section.
Static Pressure-Volume Curve
The transpulmonary pressure, or PL (i.e., PA − Ppl) can be measured to create a static P-V curve for the lung alone (not taking the chest wall into account). The Ppl can be estimated with an esophageal balloon, as described previously. PA is measured at the mouth under static conditions (i.e., when air flow is absent, which assures that mouth and alveolar pressures are equal).
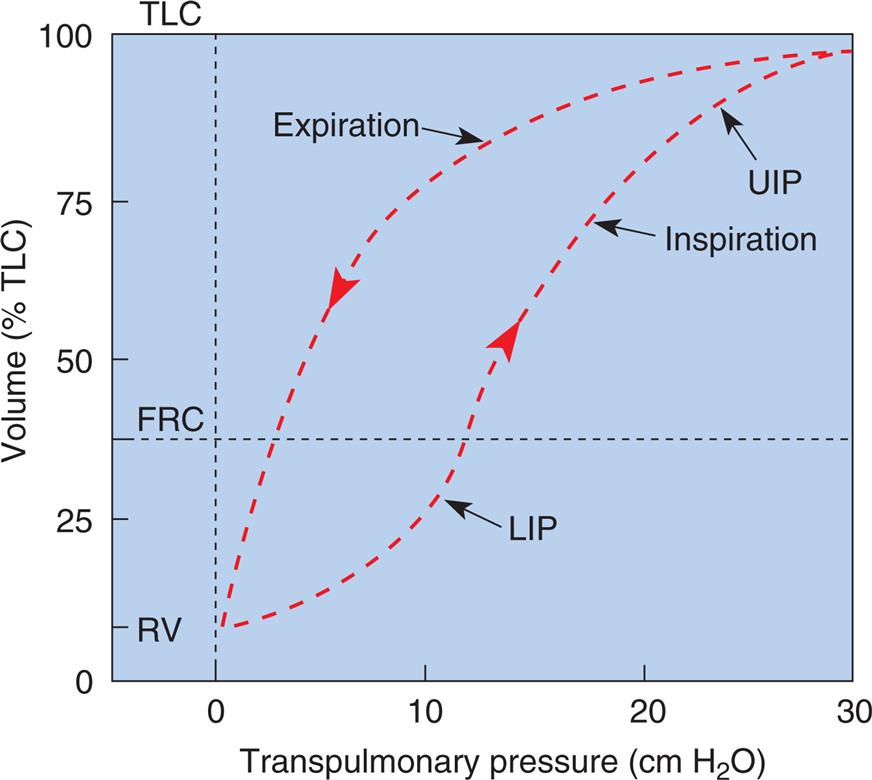
An inspiratory P-V curve can be constructed (Fig. 3.7) by applying a sequence of increasing pressures to the trachea, inflating the lung in volume increments, in a stepwise fashion from RV to TLC. Each volume increment is held momentarily in the lung until all airflow ceases and PL is recorded. If the lung is deflated in an identical stepwise fashion back to RV, an expiratory P-V curve is constructed. The inflation-deflation curves are traced in a counterclockwise fashion if the lung is inflated by positive pressure applied to the trachea. The curves are nonlinear, partly because the collagen and elastic fibers that make up the lung parenchyma are not uniform springs. Elastic fibers are easily stretched, but collagen fibers are more resistant to deformation. As the lung volume approaches TLC during inspiration, collagen fibers resist stretching more, causing the slope of the P-V curve to flatten at its upper end, creating an upper inflection point (UIP) (see Fig. 3.7).
Hysteresis and Mechanism of Lung Volume Change
The inflation and deflation limbs of the P-V curve in Fig. 3.7 trace different paths, showing that for the same distending pressure, lung volume is greater during deflation than inflation. This phenomenon is called hysteresis, which occurs because the lungs dispel energy during inflation4; that is, part of the energy used to inflate the lungs is not recovered during deflation, which means it takes less force to keep the lungs inflated during deflation than it does during inflation. This phenomenon has been experimentally demonstrated: Fig. 3.7 shows that the lung volume at a given point during inflation is lower than the lung volume at that same point during deflation.
The phenomenon of hysteresis is related to the mechanism whereby lung volume changes. The idea that 300 million alveoli inflate and deflate simultaneously like balloons is overly simplistic. It is now widely understood that alveoli in the healthy lung inflate and deflate sequentially rather than all at the same time, a phenomonen known as recruitment and derecruitment.5 At the end of a maximally forceful expiration (at RV), many alveoli are closed; during a subsequent deep inspiration, lung volume increases mainly by the sequential opening of more and more alveoli, not because individual alveolar diameters increase. The lungs use up energy in the alveolar recruitment process, mostly in overcoming the molecular adhesive forces of surface tension—forces that are of course not present during expiration, when alveoli are already open.
The lung’s recruitment-expansion mechanism has been confirmed by in vivo microscopy of alveoli that lie just below the visceral pleura; inflation of the lung increased the number of recruited alveoli but did not increase individual alveolar diameters.5 That is, alveolar size did not change, but the number of recruited alveoli changed in direct proportion to applied pressure.
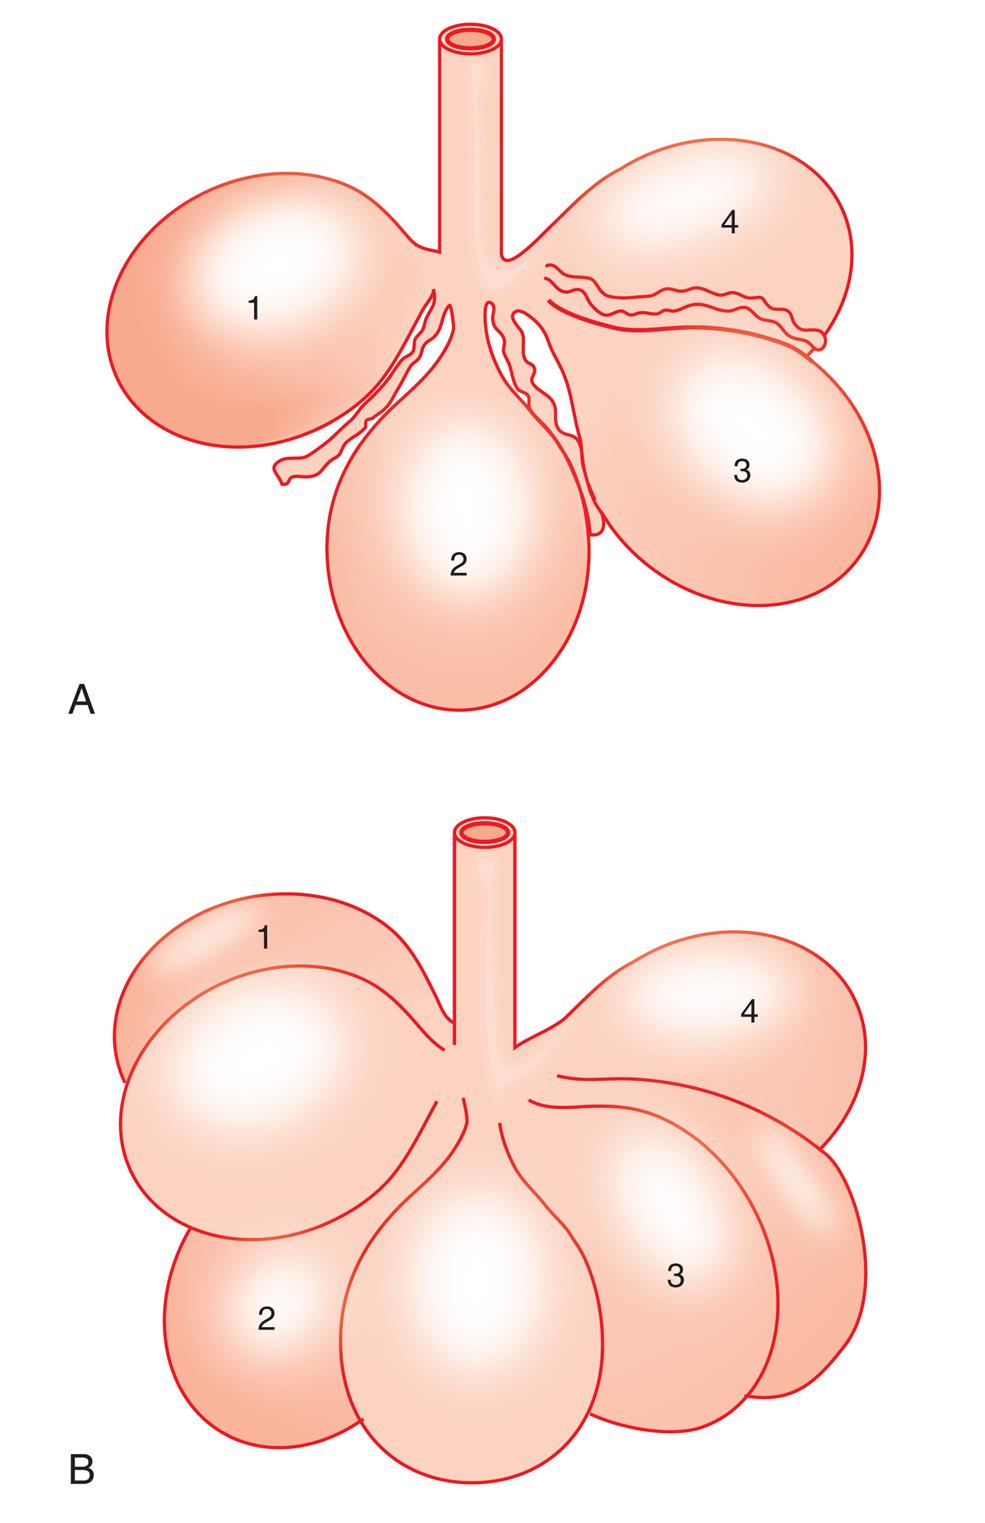
The alveolar recruitment–derecruitment mechanism is illustrated in Fig. 3.8. At the beginning of inspiration (Fig. 3.8, A), numerous alveoli are closed, their walls stuck together. As inspiration continues, these alveoli are forced open and recruited by the increasing PL (Fig. 3.8, B). Recruitment occurs in two phases: In the first phase, from RV to about 50% of the TLC, lung volume increases because of a linear increase in the number of alveoli recruited (i.e., the number recruited is directly proportional to PL). From 50% to 100% of TLC, the rate of recruitment accelerates, and the number of recruited alveoli increases exponentially. This accelerated recruitment rate is reflected by a steeper slope on the P-V curve, which is marked by a lower inflection point (LIP) on the inspiratory limb (see Fig. 3.7).6
At one time it was thought that the LIP marked the point at which alveolar recruitment was complete, and that if pressure were not allowed to fall below this point during expiration in mechanically ventilated patients, alveolar closure on expiration would be prevented. It is now known that alveolar recruitment continues beyond the LIP, all the way to TLC; that is, the entire P-V curve can be thought of as a recruitment curve.6 (See Clinical Focus 3.3 for a discussion of the clinically obtained P-V curve and significance of the LIP.)
What Static and Dynamic Pressure-Volume Curves Tell Us in the Clinical Setting
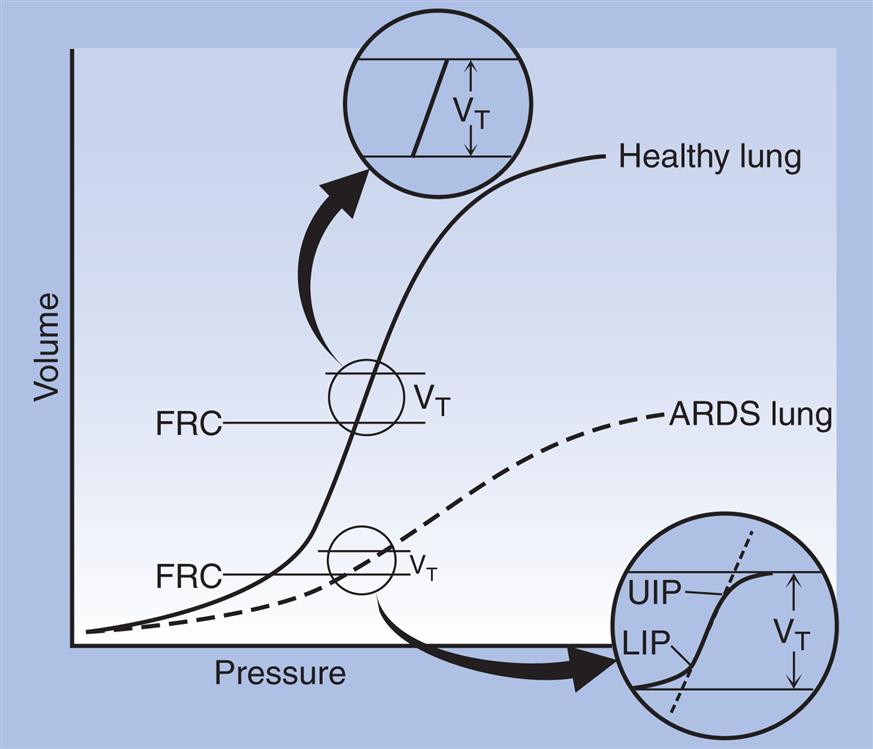
Static P-V curves (no airflow conditions) are sometimes constructed in mechanically ventilated patients with acute lung injuries with the belief that these curves might be helpful in ventilator management. Beginning at the FRC (end-tidal) level, the respiratory therapist progressively inflates the lungs in measured increments, pausing after each inflation to record its corresponding pressure. In healthy lungs, the P-V curve over the VT range is linear, but in severe lung injury (e.g., acute respiratory distress syndrome [ARDS]), the tidal P-V curve often has a sigmoid shape with a distinct LIP and possibly an UIP, as shown in the figure. Traditionally, the LIP was thought to be the critical pressure at which collapsed alveoli reopened, and the UIP was believed to mark the volume at which alveolar overstretching occurred. The conventional wisdom among clinicians was to ventilate patients with airway pressures between the two inflection points; the ventilator could be set to maintain positive end-expiratory pressure (PEEP) to keep pressures above the LIP on expiration, and VT could be limited to keep inspiratory pressure below the UIP. This strategy, sometimes called the “open-lung” approach to mechanical ventilation, was used to protect against ventilator-induced lung injury (VILI).
However, pressures measured at the endotracheal tube reflect the summation of many simultaneously occurring events in the highly complex lung composed of 300 million alveoli; alveolar P-V relationships inferred from measurements made at the endotracheal tube introduce uncertainty, limiting the helpfulness of P-V curves in ventilator management. It is now widely accepted that alveolar reopening in acute lung injury continues along the linear middle part of the static P-V curve, even above the UIP, and that the UIP probably indicates the end of alveolar recruitment, not necessarily the beginning of overdistention.6 On the other hand, any alveolar recruitment beyond the UIP would be at the expense of potentially injurious pressure in already opened alveoli. It is possible that overdistention of some alveoli occurring simultaneously with the recruitment of others might delay the appearance of the UIP, which means overdistention and alveolar injury could occur even at pressures below the UIP.6 Regarding the use of the LIP to set PEEP at a level that prevents expiratory alveolar closure, one must keep in mind that PEEP is applied on expiration. The LIP is a feature of the inspiratory P-V curve, more related to alveolar reopening during inspiration than it is to alveolar closure, which occurs during expiration. The LIP appears to be of limited relevance to expiratory alveolar closure and optimal PEEP levels.6
What causes the LIP, and what does it mean? The LIP is probably due to the instantaneous reopening of many alveoli with the same threshold opening pressures, which occurs in evenly distributed (homogeneous) lung disease. In unevenly distributed (heterogeneous) lung disease, alveoli with different threshold opening pressures coexist, and the LIP may be absent because alveoli tend to reopen in a more sequential fashion rather than in large numbers all at once.6 PEEP tends to be more beneficial in homogeneous lung disease in which there is a widespread presence of nonventilated zones, where large numbers of alveoli can be recruited simultaneously. PEEP is not as effective when lung disease is heterogeneous (characterized by intermingled ventilated and nonventilated zones), where an increase in inspiratory pressure is more likely to overdistend already open alveoli rather than recruit large numbers of alveoli all at once. The P-V curve contour may simply indicate the presence of homogeneous or heterogeneous lung disease and the potential for recruitment, not the optimal level of PEEP needed to prevent alveolar closure.6
The VT P-V curve can be displayed in a breath-to-breath real-time fashion on the monitoring screens of modern mechanical ventilators. However, this dynamically traced P-V curve is affected by airflow resistance and the P-V relationships in the ventilator tubing, humidifier, and endotracheal tube; therefore it cannot provide accurate information about the P-V relationships in the alveoli. The ventilator pressure sensor measures pressure at the patient connection part of the ventilator tubing. During inflation, tubing pressure increases rapidly (depending on the ventilator’s flow setting) with little initial volume change as endotracheal tube and airway resistances are overcome. Volume increases more rapidly relative to pressure as elastic resistance is overcome. This transition from frictional to elastic resistance creates an “inflection point” on the lower part of the inspiratory P-V loop, but it does not have the same meaning as the inflection point on the static P-V curve.
When the lung deflates, all alveoli are already open; the molecular adhesive forces opposing the recruitment process during inspiration are therefore not present during expiration. Thus during expiration the lungs contain a greater volume for a given distending force than they contained at that same distending force during inspiration, which explains the presence of hysteresis—the separation of the P-V curve’s inspiratory and expiratory limbs.
Lung Distensibility: Static Compliance
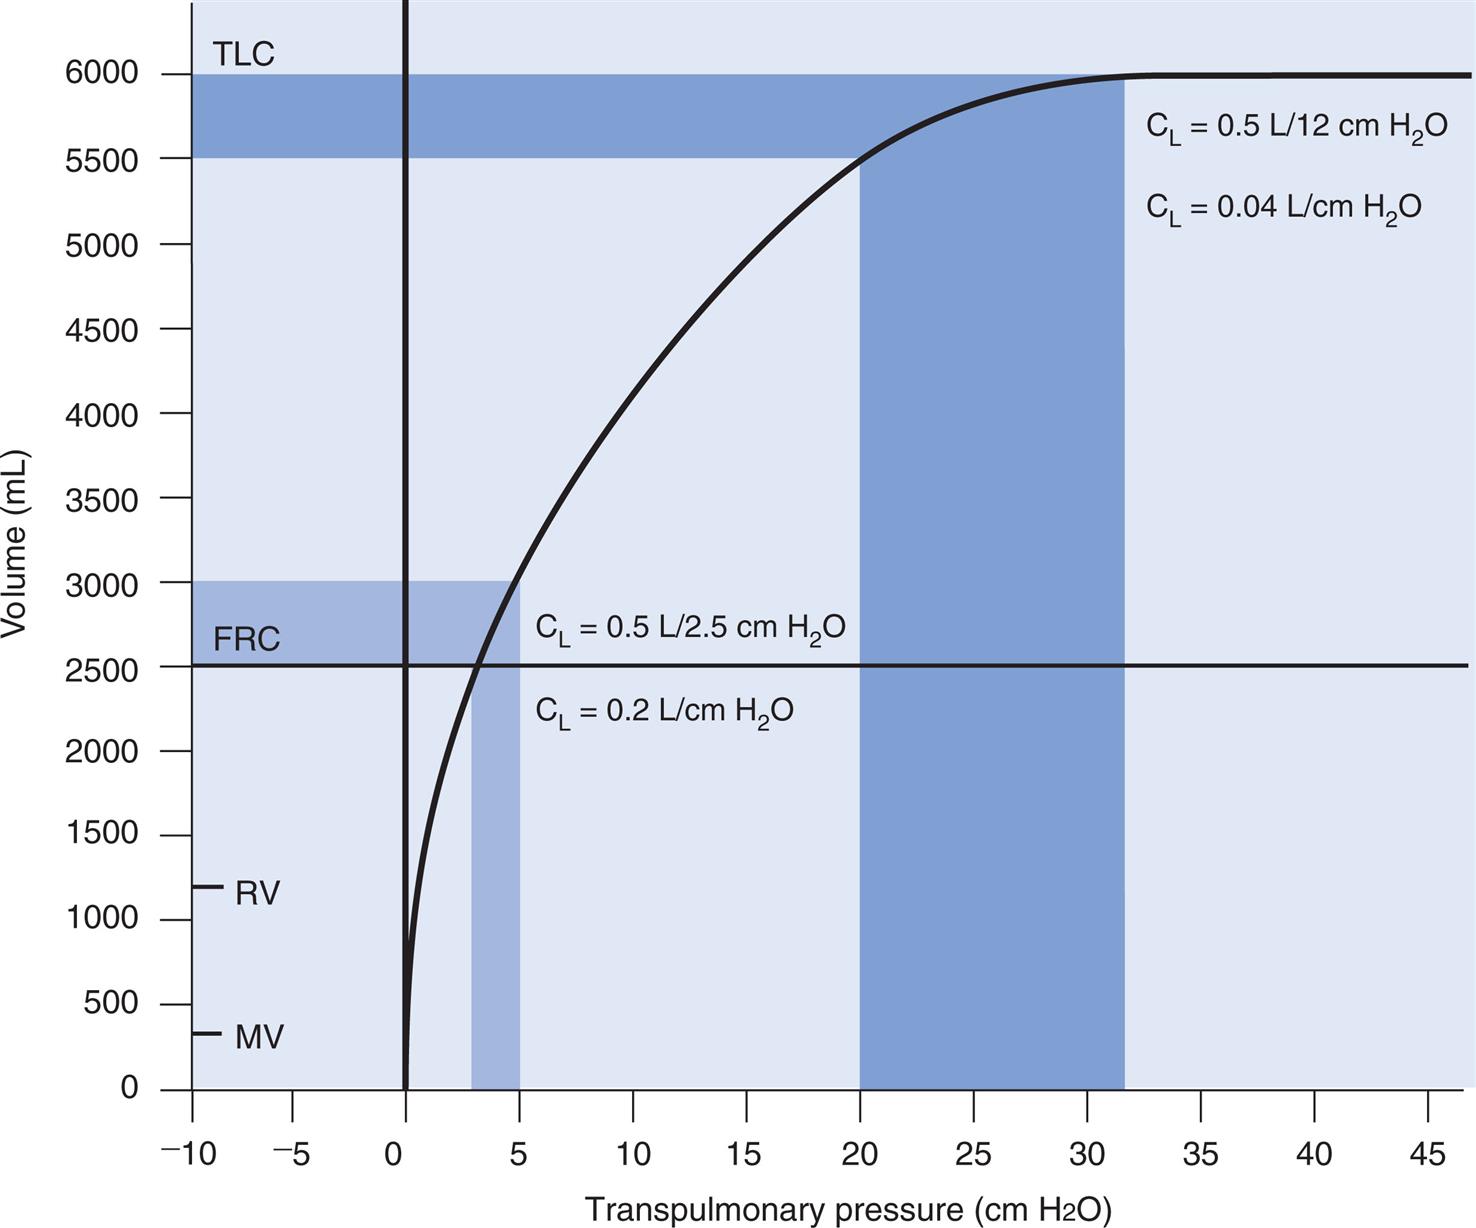
Compliance is a measure of the lung’s opposition to inflation. The P-V curve (see Fig. 3.7) is a compliance curve. Lung compliance (CL) is defined as the change in lung volume produced by a unit of pressure change and is measured in liters per centimeter of water pressure (L/cm H2O), shown as follows:

Compliance can be conceptualized as the ease with which the lung can be inflated or distended; if very little pressure is required to inflate the lung, it has high compliance. A lung with low compliance is stiff and difficult to inflate or distend. Static compliance can be obtained from the P-V curve in Fig. 3.9 by measuring the volume change (vertical axis) produced by a given pressure change (horizontal axis). Normal compliance of the adult lung (CL) is 0.2 L/cm H2O or 200 mL/cm H2O, measured at the end of expiration (the FRC).
The opposite of compliance is elastance, defined as the change in pressure required to produce a unit of volume change (cm H2O/L). Elastance is the mathematical reciprocal of compliance (elastance = 1/compliance). The more elastic the lung is, the less its compliance. Elastance can be conceptualized as recoil force; highly elastic lungs are stiff and difficult to inflate and exhibit a high recoil force. By convention, in pulmonary medicine, the elastic characteristics of the lung are quantified in terms of compliance rather than elastance.
Compliance and lung volume
The value of CL depends on the volume at which it is measured. The compliance curve is not linear, as shown in Fig. 3.9. Near TLC, lung fibers are stretched and close to their elastic limits; a 500-mL inspiration taken at a point near TLC requires much more muscular effort than a 500-mL inspiration beginning at FRC. The slope of the compliance curve is steepest and CL is greatest (easiest to inflate) at FRC; this is beneficial because an individual normally inhales the VT from the FRC level where volume changes require little effort. Even during strenuous exercise, people breathe over the lower 70% of the P-V curve, keeping the elastic WOB relatively low. The larger inspired volumes during exercise produce higher lung recoil, which helps provide the force needed to produce high expiratory flow rates during rapid breathing rates.
Measured lung compliance (L/cm H2O) is greater in an adult than an infant because adult lungs are larger and accept more volume for a given pressure. Although the inherent elastic properties of lung tissues may be identical in adult and infant lungs, the infant’s measured CL is lower. To correct for lung size, compliance can be calculated per unit of lung volume (CL/vol). This measurement is called specific compliance and is generally indexed to the individual’s FRC (specific compliance = CL/FRC). Adults and infants have about the same specific CL.
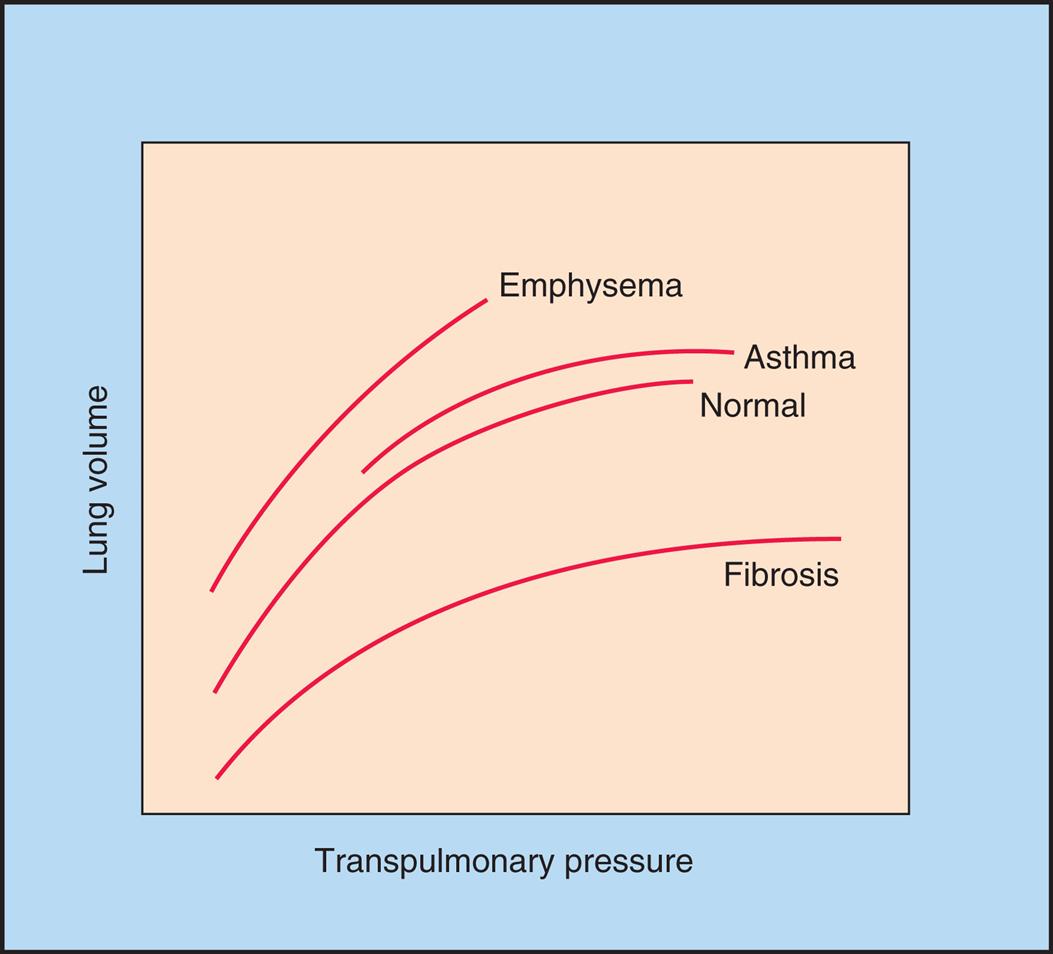
Fig. 3.10 illustrates the effects of different disease types on CL. Emphysema is characterized by a loss of elastic lung tissue, which means the lungs can be easily distended and have an abnormally low recoil force. Small pressure changes produce large volume changes. Weakened elastic lung recoil (i.e., abnormally increased lung compliance) changes the equilibrium point between lung and thoracic recoil forces, which increases the FRC. In contrast, pulmonary fibrosis is characterized by high lung recoil force; in this case, the FRC equilibrium point is displaced, this time to a lower point in the TLC than normal.
Clinical Focus 3.4
Effect of Airway Obstruction on Functional Residual Capacity and Breathing Position on the Compliance Curve
Emphysema is a disease characterized by the destruction of elastic lung tissue. Consequently, the lung’s elastic recoil force decreases (i.e., the lungs become highly compliant), which means the lungs do not empty completely to their normal resting volume at the end of an exhalation; this increases the FRC. In addition, loss of elastic recoil force reduces the tethering forces the lung’s elastic fibers normally exert on small noncartilagenous airways to keep them open. This situation allows these airways to collapse prematurely during exhalation, obstructing exhaled gas flow, which also prevents normal lung emptying. Because of the increased FRC, a patient with emphysema begins each inspiration at a level closer to the TLC (see Fig. 3.20, A). Patients with emphysema appear to be in a continuous inspiratory position even when they are at the end of a normal expiration. However, breathing at this higher lung volume is actually advantageous for the highly compliant emphysematous lung because it increases lung recoil force and assists expiration (i.e., even the highly compliant lung recoils with greater force if it is stretched). In other words, the lung with emphysema has such little recoil force that it must be stretched to near its TLC to generate enough recoil to drive passive expiration. Even then, recoil force is lower than normal. This low recoil force drives expiratory flow out of the lung slowly, unduly prolonging expiratory time. For this reason, patients with emphysema often contract their abdominal expiratory muscles during normal ventilation (always an abnormal sign) to aid exhalation.7

Surface Tension and Pulmonary Surfactant
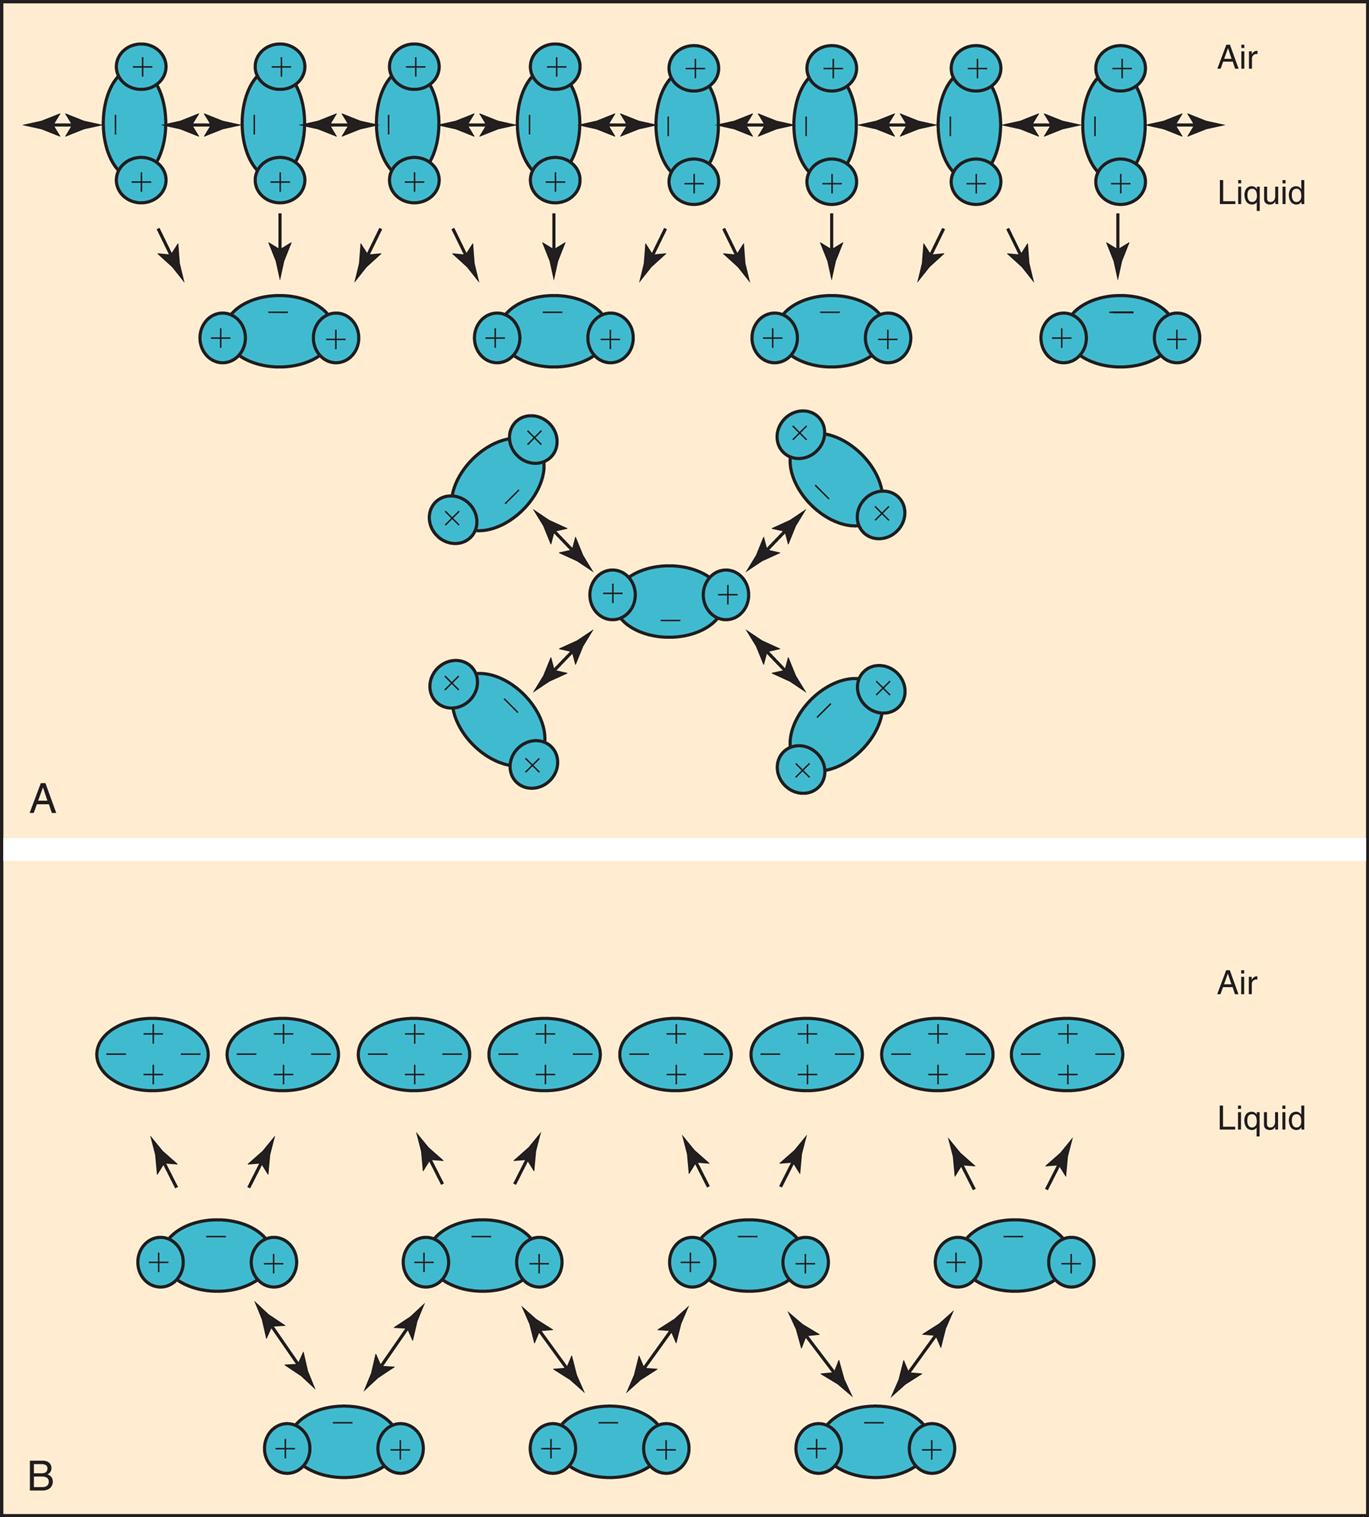
The molecules of a water surface are attracted by other water molecules below and adjacent to them. As a result, the water surface has a tendency to contract, creating a force known as surface tension (Fig. 3.11, A). Surface tension causes a water droplet to take on the shape of a rounded bead because of the tight intermolecular attraction forces surrounding the droplet.
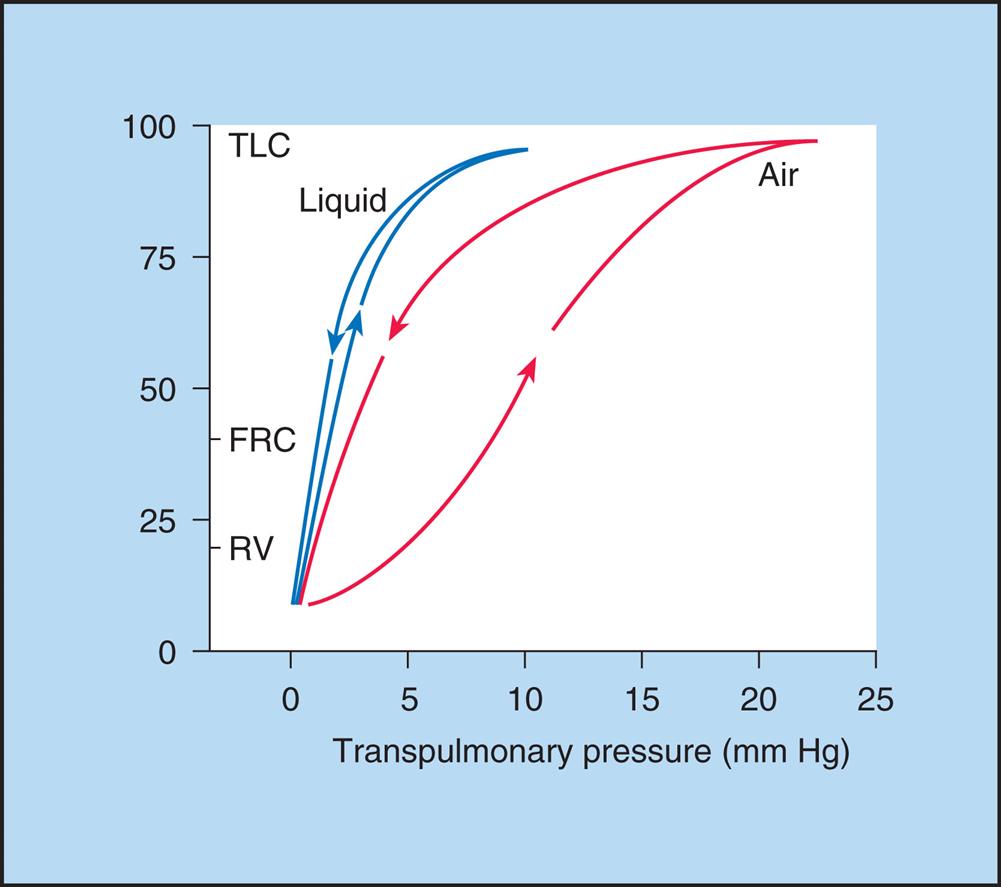
In 1929, von Neergaard conducted the now classic experiment in which he demonstrated the presence of surface tension in the alveoli. He inflated the lungs of anesthetized cats, first with air and then with a liquid saline solution. He constructed P-V curves for both air and saline inflations. Fig. 3.12 illustrates that saline inflation requires much less pressure than air inflation to achieve a given volume. von Neergaard correctly concluded that alveolar air-liquid interfaces produced forces that opposed lung inflation. Saline inflation abolished the air–liquid interface, eliminating its opposition to lung inflation. The recoil pressure of the saline-filled lungs reflected only elastic tissue retractile forces, whereas the recoil pressure of the air-filled lung reflected retractile forces of the elastic tissues plus collapsing forces of surface tension. Surface tension is a major determinant of the lung’s elastic recoil force.8
The film of liquid lining the alveoli surrounds alveolar gas, similar to a soap bubble. As just described, the liquid surface has a tendency to contract, which tends to shrink or collapse the spherical alveoli. The collective surface tension of about 300 million alveoli is responsible for most of the lung’s elastic recoil force. However, the liquid film lining the alveoli is not composed of pure water; if it were, high surface-tension forces would cause widespread alveolar collapse (atelectasis) and greatly increase the work required to inhale a normal tidal breath. The alveolar fluid lining contains a special substance capable of altering surface tension known as pulmonary surfactant (described in the next section of this chapter).
Laplace’s law offers some insight into the contribution of surface tension to the lung’s elastic recoil pressure. If one applies a counterpressure equal to the collapsing force of alveolar surface tension, the alveolus remains in its inflated state. Laplace’s law describes the relationship among the variables as follows:

In this equation, P represents distending pressure (in dynes/cm2), T represents surface tension force (in dynes/cm2), and r represents the alveolar radius (in cm). The equation shows that if surface tension remains constant, small alveoli require higher distending pressure to remain inflated than large alveoli (Fig. 3.13, A); in other words, the equation predicts that the smaller alveoli should empty into larger alveoli—assuming that all alveoli have the same surface tension. If the surface tension were the same for all alveoli, Laplace’s law would predict serious alveolar instability; small alveoli would collapse into larger ones, producing coexisting areas of overdistention and complete collapse (see Fig. 3.13, B). Of course, alveolar pressures throughout the lungs must be identical because they are all connected to a common airway—the trachea. How then is alveolar stability maintained, and how can the lung inflate evenly?
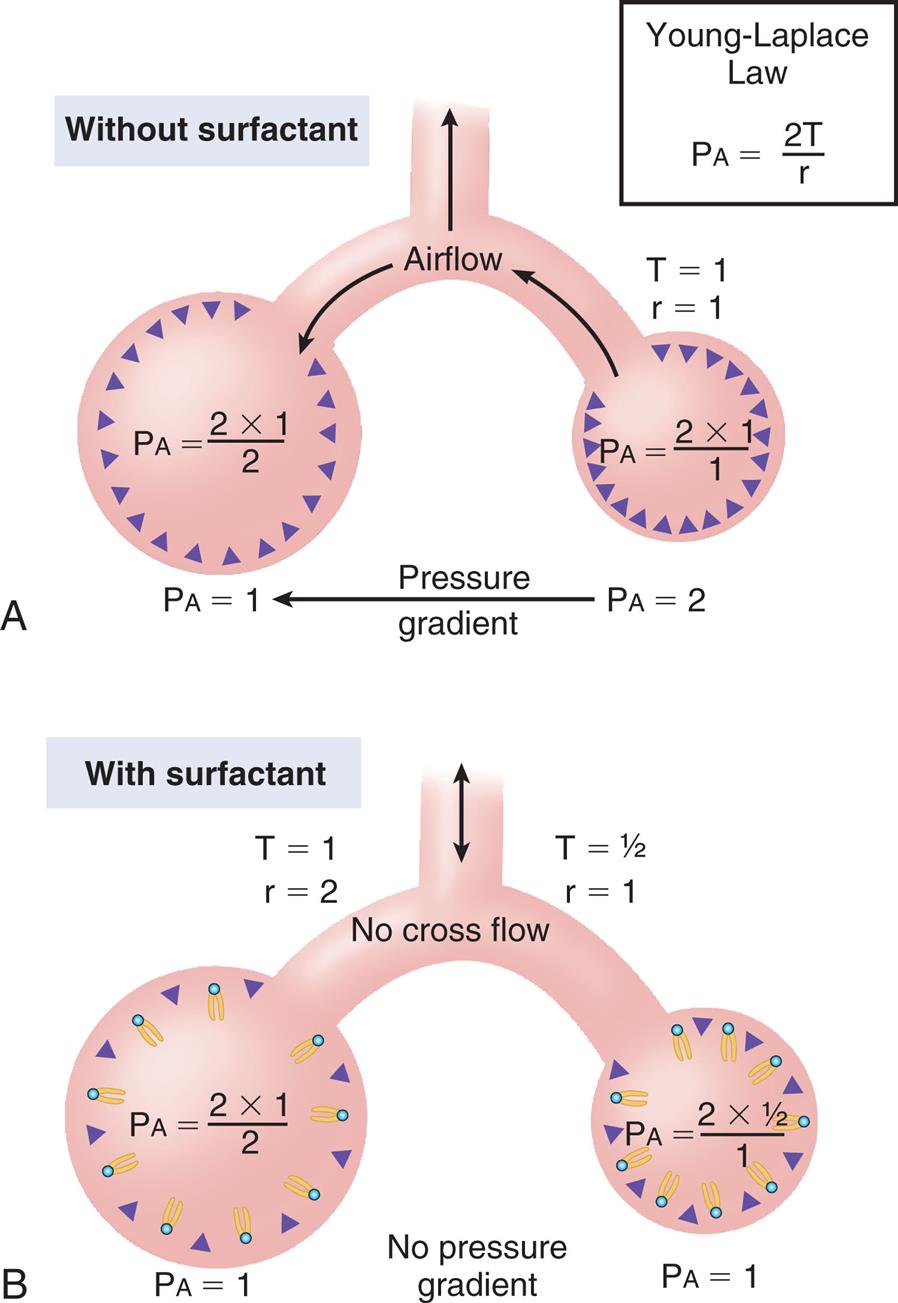
The explanation is that pulmonary surfactant alters alveolar surface tension in such a way that larger alveoli have a higher surface tension than smaller alveoli. Because variations in alveolar radii are associated with equivalent variations in surface tension, the same pressure can keep all alveoli inflated. As shown by Laplace’s law (P = 2 T/r), if r and T both double or if both are cut in half, P remains the same. Because of pulmonary surfactant, the recoil pressure for all alveoli is the same, regardless of their size.
Fig. 3.14 illustrates critical opening pressure and critical closing pressure. A relatively high pressure is required to expand a collapsed alveolus. When enough pressure is applied to produce an alveolar radius equal to that of the alveolar duct supplying it, the critical opening pressure has been reached. When the critical opening pressure is exceeded, the alveolus abruptly opens and expands easily. This phenomenon is similar to the inflation of a toy balloon; high pressure is required initially until the balloon abruptly expands; thereafter, the balloon inflates easily. The critical opening pressure is identical to the critical closing pressure; pressures below this level result in the abrupt collapse of the alveolus. The radius of the alveolar duct and the surface-tension force determine the critical opening pressure.
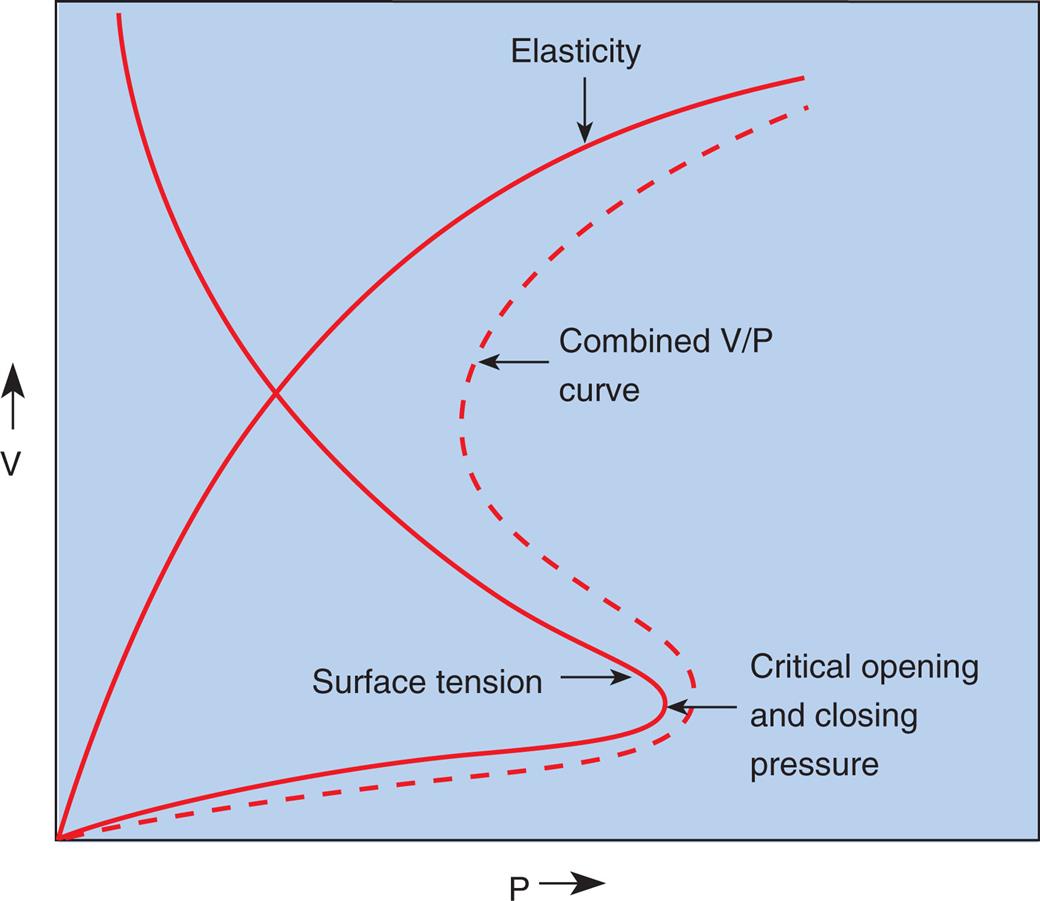
Adhesive molecular surface-tension forces are the major opposition to alveolar inflation when the alveolus is collapsed and below its critical opening pressure. Above the critical opening pressure, elastic tissue recoil becomes a progressively greater opposition to inflation (see Fig. 3.14).
Nature and Composition of Pulmonary Surfactant
Surfactant molecules in a water medium have extremely weak attractive forces for each other and for the surrounding water molecules. Strong intermolecular attractive forces between water molecules push the neutral surfactant molecules up to the surface, forming a thin surfactant film the thickness of one molecule—a monolayer. This surfactant monolayer floats on the surface and shields the water molecules below from contact with air (see Fig. 3.11, B). The weak intermolecular attractive forces of the floating surfactant monolayer impart a low surface tension to the solution.
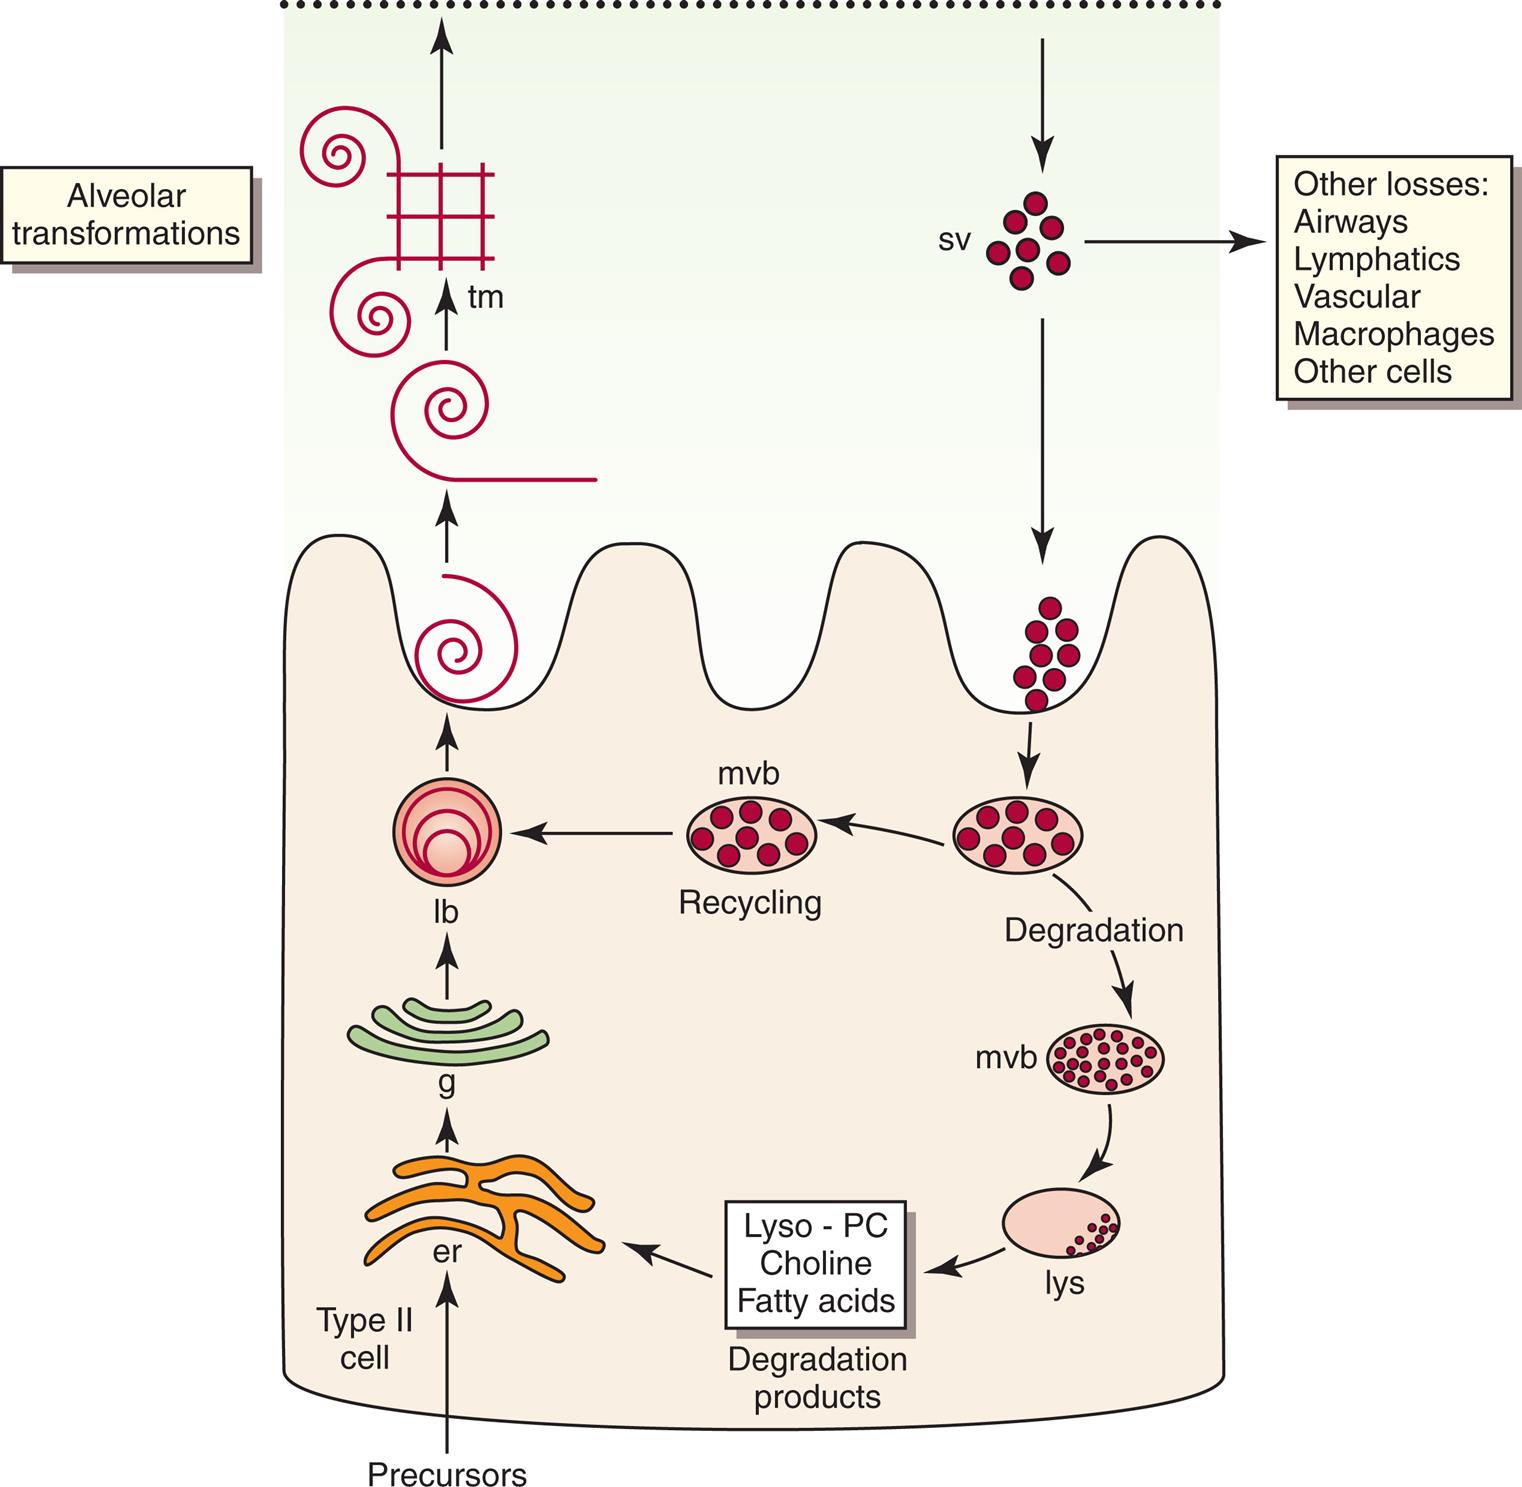
Pulmonary surfactant is a complex substance composed of 90% phospholipid and 10% protein. Dipalmitoyl phosphatidylcholine (DPPC) constitutes about 50% of surfactant’s phospholipid content and is primarily responsible for the surface tension–lowering properties of surfactant.9 DPPC forms a tight monolayer at the air-liquid interface of the alveolus. The more this surface monolayer is compressed (as occurs in smaller alveoli), the more it concentrates the DPPC molecules and lowers the surface tension. Type II cells secrete surfactant phospholipids by discharging lamellar bodies into the liquid film that lines the inner alveolar surface; this process is known as exocytosis. Once secreted, lamellar bodies unravel and transform into a lattice-like structure called tubular myelin (Fig. 3.15). Tubular myelin is the immediate precursor of the DPPC surface monolayer; when facilitated by a specialized surfactant protein (described in the following paragraphs), it quickly spreads to form a film one molecule thick on the alveolar air-liquid surface through a process called adsorption.
Normal surfactant contains four specialized proteins that can be divided into two groups: (1) hydrophilic, or water-attracting, proteins SP-A and SP-D and (2) hydrophobic, or water-repelling, proteins SP-B and SP-C. The two hydrophilic proteins SP-A and SP-D are not as critical for surfactant function as the two extremely hydrophobic surfactant proteins SP-B and SP-C; the presence of SP-B in particular is essential for the formation of tubular myelin and its adsorption on the monolayer film surface.9
Adequate functional surfactant must be present in the fetal lung at birth to allow a successful transition to air breathing; otherwise, high surface tension causes widespread alveolar collapse and severe respiratory distress. DPPC is first present in lamellar bodies of the human fetal lung at about 24 weeks of gestation.9 Avery and Mead10 were the first investigators to describe low surfactant levels in premature newborns with respiratory distress syndrome (RDS). It was later confirmed that deficient synthesis and secretion of pulmonary surfactant causes RDS to occur in premature infants. Specifically, the absence of SP-B is responsible for respiratory distress and gas exchange abnormalities in premature newborns.9
The concentration of DPPC, also known as lecithin, increases during the last 20% of gestation in full-term fetuses. At the same time, the concentration of another phospholipid, sphingomyelin, remains relatively constant. The ratio of lecithin to sphingomyelin (L/S ratio) in amniotic fluid is predictive of fetal lung maturation. An L/S ratio greater than 2:1 indicates fetal lung maturity in nondiabetic pregnancies; the L/S ratio is inaccurate in mothers with diabetes.11 The L/S ratio is generally 1:1 at 31 to 32 weeks of gestation and 2:1 at 35 weeks of gestation.11 Phosphatidylglycerol (PG) is another phospholipid component of surfactant that is produced late in gestation. Its presence in amniotic fluid almost guarantees lung maturity; the risk of RDS is low if PG is present. The L/S ratio and the presence of PG in amniotic fluid continue to be the gold standard for determining fetal lung maturity.11 More recently, the lamellar body count in amniotic fluid has been shown to correlate significantly with the L/S ratio and PG levels. The advantage of the lamellar body count is that it can be performed more quickly and easily, requires a minimal amount of amniotic fluid, and is less costly than phospholipid analysis; in addition, it is less subject to false elevations in diabetes.11 Maternal administration of steroids may accelerate the production of fetal DPPC.9
Physiological Significance of Pulmonary Surfactant
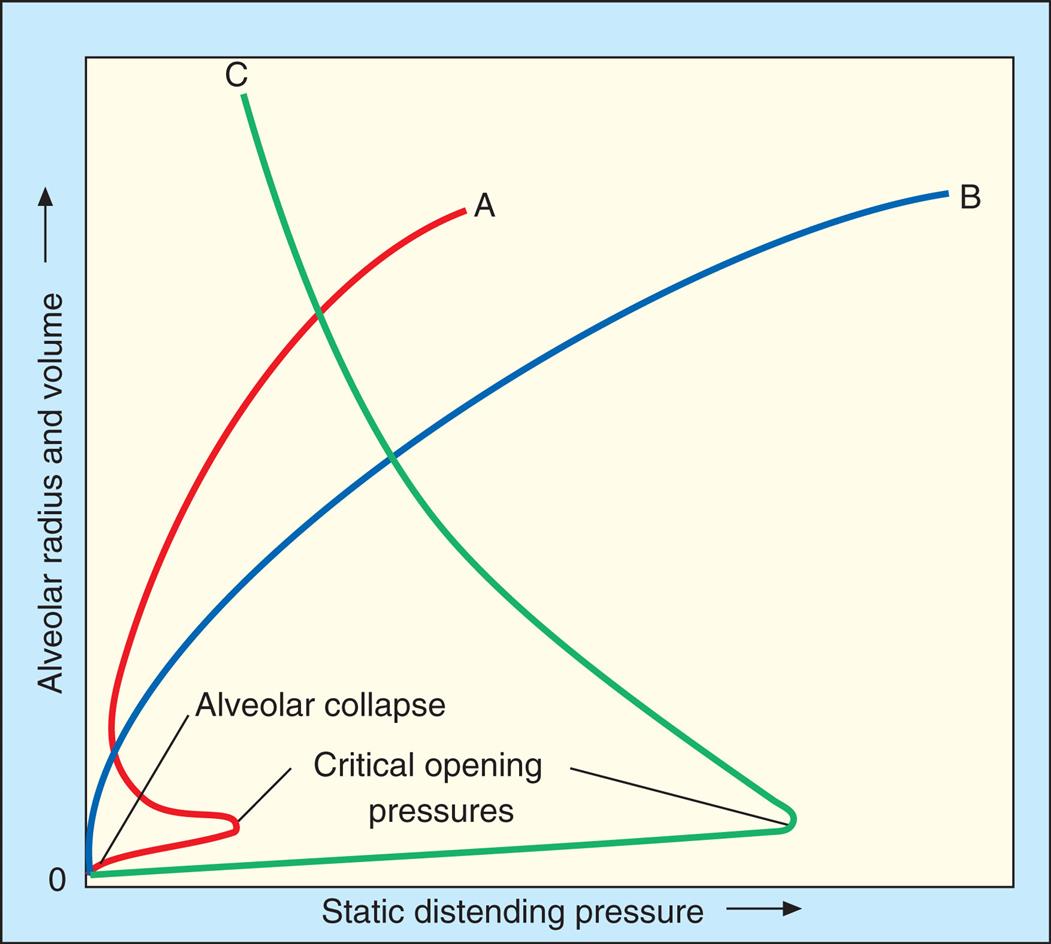
In Fig. 3.16, curve C shows that when the alveolar diameter is small in the surfactant-deficient lung, extremely high PL is required to offset surface tension forces and prevent alveolar collapse. Therefore alveoli are quite prone to collapse at low lung volumes, as Laplace’s law predicts. In the presence of pulmonary surfactant, surface tension decreases dramatically as the alveolar volume decreases (curve A); this allows small alveoli to remain inflated at an extremely low PL.
Pulmonary surfactant is physiologically important because (1) it reduces WOB, (2) it reduces the distending pressure required to keep small alveoli open, and (3) it provides a stabilizing influence, allowing alveoli of different sizes to coexist at the same distending pressure. Pulmonary surfactant also helps reduce the tendency for fluid to leave pulmonary capillaries and enter the interstitial space (pulmonary edema). In the absence of pulmonary surfactant, high surface tension retracting forces create too much negative intrapleural and interstitial pressure, pulling fluid out of the capillaries. Thus by decreasing alveolar surface tension, pulmonary surfactant helps prevent the development of pulmonary edema.9
Lung and Chest Wall Interactions
Lung, Thorax, and Total Compliance
If the lungs were removed from the body and the empty thoracic cavity inflated with air, the measured compliance of the thoracic cage would be equal to that of the lungs (i.e., 0.2 L/cm H2O). Thoracic compliance (CT) can be measured directly or calculated by finding the difference between CL and the combined lung–thorax compliance (CLT).
CL and CLT can be obtained simultaneously by measuring esophageal balloon pressure and mouth pressure under static conditions, which is equivalent to measuring intrapleural and alveolar pressures (remember, mouth pressure equals alveolar pressure under static, no-flow conditions). The subject inspires a known volume of gas and holds the breath, keeping the glottis open (Fig. 3.17, A). In this state, the esophageal (pleural) pressure reflects only lung recoil pressure changes (i.e., the thorax cannot contribute to recoil pressure because the ventilatory muscles hold it in a fixed position). PA is equal to atmospheric pressure because the glottis is open and air is not moving. Then, while maintaining this lung volume, the subject pinches the nostrils shut, tightly seals the lips around the mouthpiece of the pressure gauge, and completely relaxes all muscles of ventilation (see Fig. 3.17, B). Mouth pressure under these no-flow relaxed conditions now equals the combined recoil pressures of the lungs and thorax. Mouth pressure also equals the PA. The negative intrapleural pressure in this situation equals the recoil pressure of the thoracic cage alone; that is, the occluded mouth and nose trap air in the lungs, creating a positive pressure splint that prevents the lungs from recoiling inward. Only outward recoil of the thoracic cage can now generate negative Ppl.
The data needed to calculate CL (volume inspired/[PA − Ppl]) and CLT (volume inspired/[PA − atmospheric pressure]) are obtained from the ventilatory maneuvers just described. The compliance of the thoracic cage alone can be derived from the following equation:

Another way to state this is as follows:

In this equation, CL represents lung compliance, CT represents thoracic cage compliance, and CLT represents combined lung and thoracic cage compliance. The normal value is 0.1 L/cm H2O for CLT and 0.2 L/cm H2O for CL. CT is normally 0.2 L/cm H2O, calculated as follows:

Thoracic cage compliance is decreased in persons with skeletal deformities of the chest wall (e.g., kyphoscoliosis and ankylosing spondylitis), spastic skeletal muscle diseases, and severe obesity. The reason why reciprocals of compliance are used in the calculations above becomes more apparent as the interactions between the lungs and thoracic cage are examined later in this chapter.
Relaxation Pressure-Volume Curves
At FRC, the lungs are stretched above their unstressed resting volume, and the thoracic cage is compressed below its unstressed resting volume. The cohesive seal of the parietal and visceral pleural membranes couples the lungs and thorax. If the pleural seal is broken, exposing the intrapleural space to atmospheric pressure, the lungs recoil inward to their resting minimal air volume, and the thoracic cage recoils outward to its unstressed resting volume, which is 75% to 80% of the TLC, or about 70% of the VC). The point at which outward thoracic recoil forces and inward lung recoil forces equalize determines the FRC, which is the unstressed resting volume of the intact lung–thorax system.
Passive relaxation P-V curves can be constructed separately for the lungs and thoracic cage. Fig. 3.18, A, shows the relaxation pressures for the lung alone (hypothetically outside of the thorax) plotted against TLC. Pressure in the lung is 0 at collapsed resting state (see Fig. 3.18, A, 1) and increases to its maximum level as the lung is inflated to TLC, where elastic tissues are stretched maximally (see Fig. 3.18, A, 3). At each lung-inflation point in the hypothetical figure, the airway is sealed, airflow stops, and the positive pressure in the lungs is created by passive lung recoil forces.
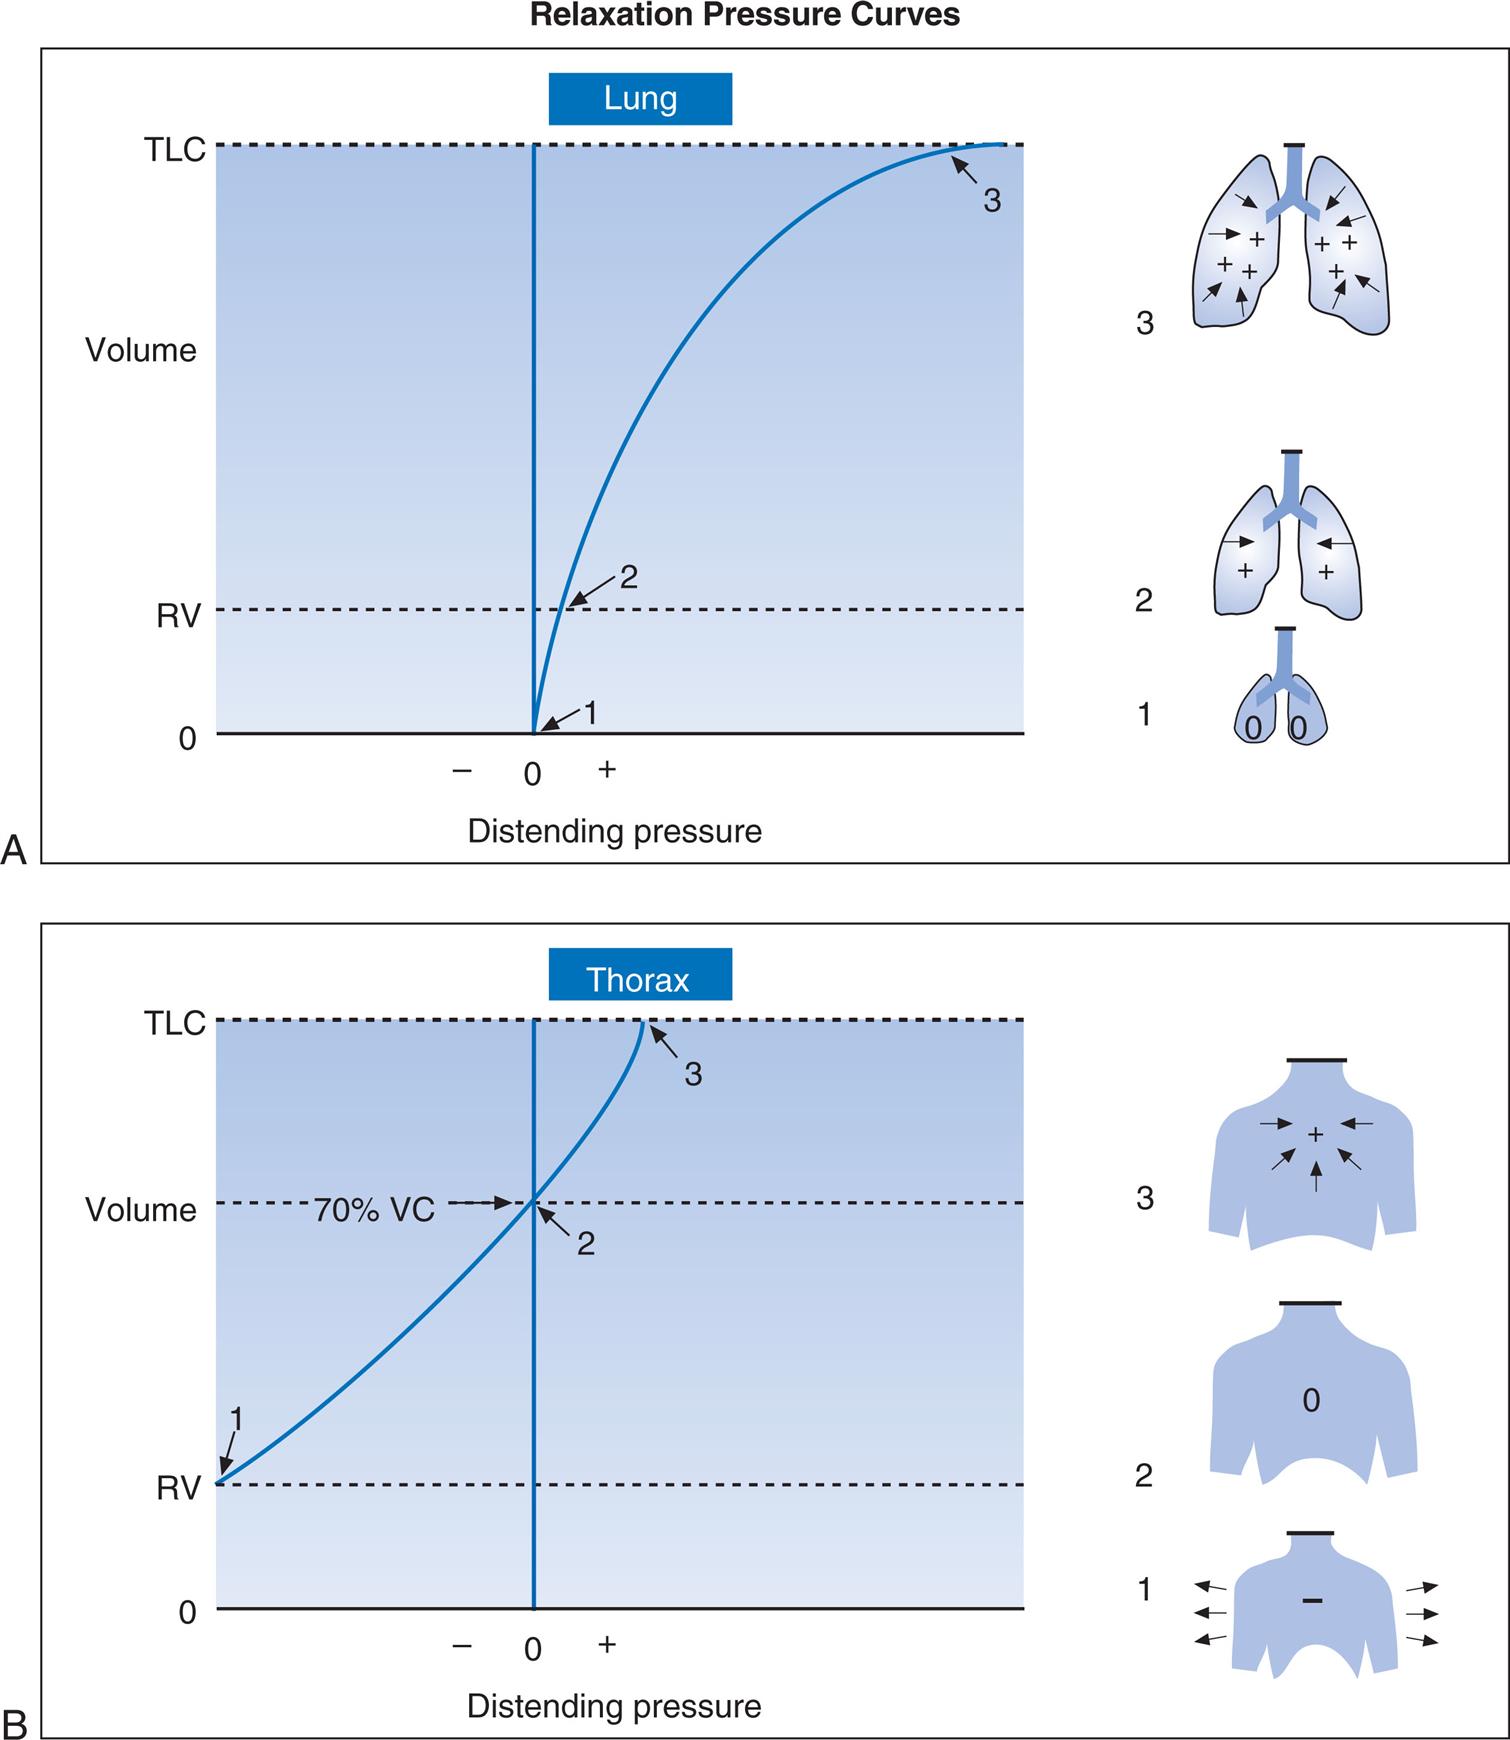
Fig. 3.18, B, shows that if the hypothetical empty thoracic cage were compressed to the RV level, it would generate a strong outward recoil force. This outward force would generate a negative intrathoracic pressure if the thoracic opening were sealed and the compression force removed, allowing the rib cage to recoil freely (see Fig. 3.18, B, 1). If the thoracic opening were unsealed and the rib cage allowed to recoil freely outward, the thorax would come to a rest at about 70% of the VC, generating neither inward nor outward recoil force (see Fig. 3.18, B, 2). Inflation beyond this point would expand the thoracic cage to a volume above its resting level, which would generate an inward recoil force. In other words, from 70% of the VC to TLC, the thorax and lungs recoil in the same direction (see Fig. 3.18, B, 3).
Fig. 3.19 shows individual relaxation P-V curves for the lungs and thorax plotted on the same graph along with the coupled lung–thorax system curve. The resting equilibrium point between inward lung recoil force and outward thoracic recoil force determines the FRC, which normally occurs between 40% and 50% of TLC. This FRC balance point between the two opposing recoil forces is shown in Fig. 3.19 as the point where the horizontal distances between 0 pressure and the two recoil curves are identical (distance a is equal to distance b in the figure).

The lung–thorax compliance curve (see solid line in Fig. 3.19) is the algebraic sum of the lung (dotted line) and thorax (dashed line) compliance curves. At all points along the lung–thorax curve, its slope is less than the slope of either the lung curve or the thoracic curve, which means that the combined lung–thorax system is less compliant than either of its components alone (i.e., CLT is less than either CL or CT).
Put in terms of elastance, combined lung–thorax elastance (the reciprocal of compliance) is greater than either lung or thorax elastance; this helps explain why reciprocals of CL and CT must be added to obtain the compliance of the total system. Compliance is a measure of the lung’s distensibility, whereas elastance is a measure of the lung’s resistance to inflation. The thorax and lungs actually represent separate elastances, not compliances, arranged in series with one another. As with an electrical circuit, total resistance is equal to the sum of the resistances in the series (RT = R1 + R2 + …). In this equation, RT represents total resistance, and R1 through R2 represent the individual resistances. Similarly, lung and thorax elastances (resistance to inflation) can be summed to obtain total elastance (ELT = EL + ET). In this equation, ELT represents total system elastance, and EL and ET represent individual lung and thorax elastances. Because compliance is the reciprocal of elastance, reciprocals of compliance must be added to calculate total compliance. This is shown as follows:
 1
1
 2
2
Substituting the general term 1/C for E in eq. 1:
 3
3
Relaxation Pressure-Volume Curves and Disease
A change in lung elasticity alone alters the lung–thorax recoil curve because it changes the equilibrium point between lung and thorax recoil forces. Thus FRC must change.
If the lung at FRC in Fig. 3.19 develops decreased elasticity (greater compliance), the equilibrium between lung recoil and thoracic recoil is disrupted; outward, thoracic recoil predominates, pulling the lungs outward to a larger volume. The thorax stops expanding, and the lung stops enlarging when the stretching lung generates enough recoil force to again balance the oppositely directed thoracic recoil force. This establishes a new equilibrium point at a larger volume than before (i.e., FRC is increased and VT is breathed at a higher level in TLC). The lung curve and lung–thorax curve would shift leftward toward a more vertical position, showing that lower pressures are required to inflate the lung to any given volume. Pulmonary emphysema, characterized by the destruction of elastic lung tissue, produces the changes just described. Diseases that increase lung recoil force, such as pulmonary fibrosis, shift lung and lung–thorax curves to the right (and a more horizontal position) and reduce the FRC, because increased lung recoil force pulls the thorax down to smaller volumes.
Fig. 3.20 shows P-V relaxation curves for the lungs and thorax under normal conditions (see Fig. 3.20, B) compared with pulmonary emphysema (see Fig. 3.20, A) and pulmonary fibrosis (see Fig. 3.20, C). The lungs of the patient with emphysema in A have extremely low recoil force; they must be stretched to near TLC before they generate enough recoil force to counterbalance the thoracic recoil force and establish FRC. FRC is quite large, mainly because the RV is so large. Even minimal air is increased as a result of the low lung recoil; if these lungs are removed from the chest, their recoil is so weak that they are unable to expel much of their air, and they remain hyperinflated, even when unstressed and at rest.
The fibrotic lungs in Fig. 3.20, C, recoil quite strongly, even at low lung volumes. Not much inflation is required before their recoil force is equal to chest wall recoil force. The FRC equilibrium point is established at an abnormally low volume. TLC is reduced because the ventilatory muscles are not strong enough to stretch the strongly recoiling fibrotic lung to greater volumes.
Dynamic Lung and Chest Wall Mechanics
Elastic recoil resistance to ventilation is normally much greater than frictional resistance to airflow. However, in certain diseases of the airways, frictional resistance to airflow may exceed elastic resistance.
Frictional (Nonelastic) Resistance
Frictional resistance to gas flow or airway resistance (Raw) is the main component of nonelastic resistance. To a much smaller extent, friction between moving tissues in the thorax contributes to nonelastic resistance.
Resistance to Gas Flow
When gas flows through a tube, pressure decreases steadily along the tube from the inlet (the gas source) to the tube outlet. The pressure drop across the length of the tube (P1 − P2) is the driving pressure creating the gas flow; that is, the driving pressure required is dependent on how much frictional resistance the tube imposes. Greater frictional resistance causes a greater drop in pressure along the length of the tube. Frictional resistance is present between gas molecules themselves (viscosity) and between gas molecules and the tube wall. The greater the cohesive forces among gas molecules, the greater the viscosity of the gas and the greater its opposition to flow. Generally, the smaller the tube radius is, and the greater the gas viscosity, the greater will be the resistance.
Resistance (R) to gas flow through a tube is expressed as the pressure decrease between the inlet and outlet divided by the flow rate ( ). This is shown as follows:

Airway Resistance
In the lung, Raw is measured in units of cm H2O/L/sec. For a given flow rate, a large pressure decrease across the airways indicates the presence of high resistance. Also, the higher the flow rate, the greater the pressure drop between two points in a given airway. Normal Raw in adults measured at the FRC level at a constant flow rate of 0.5 L per second is about 0.5 to 1.5 cm H2O/L/sec; that is, to produce a flow of 1 L per second, a person must generate a pressure difference across the airways (between the mouth and alveoli) of only 0.5 to 1.5 cm H2O.
The lung volume markedly affects Raw. For this reason, Raw is usually measured beginning at the FRC level (an easily reproducible volume, since it is the end-tidal resting level). A special instrument called a body plethysmograph measures PA, mouth pressure, and flow rate simultaneously to calculate Raw.
Raw is greater at low lung volumes than high lung volumes. High volumes near TLC create high transpulmonary pressure gradients and mechanically dilate the airways. Also, high elastic recoil at high lung volumes has a tethering effect on airways, pulling them to larger diameters. Both of these effects are reduced at low lung volumes. Near RV, small, noncartilaginous airways are severely narrowed, greatly increasing Raw. As RV is approached, some of these small airways completely collapse because pressure outside the airway (Ppl) exceeds intra-airway pressure.
Neurogenic factors also affect Raw at different lung volumes. Stretch receptors in the lung (see Chapter 1) are stimulated at high volumes, causing a reflex decrease in parasympathetic bronchomotor tone, which dilates the bronchi. Conversely, at low volumes, parasympathetic tone is unchecked, and the airways narrow.
Flow Regimens in the Airways
The pattern of airflow also affects Raw. The three major patterns or regimens of gas flow through the airways are referred to as laminar, turbulent, and tracheobronchial or transitional.
Laminar Flow
Flow is laminar when it is organized in separate streamlines, similar to overlapping cylindrical layers of gas moving at different speeds. Whereas the gas flowing in the central layer of the stream moves at the highest velocity, the outside layer contacting the airway wall is stationary; this produces a cone-shaped stream front (Fig. 3.21), also called a parabolic velocity profile. The concentric cylindrical layers of gas slide over one another, creating friction between them as they travel at different velocities. This friction is determined by molecular cohesive forces (unique for each gas type) and is the source of gas viscosity. When flow is laminar, the pressure required to produce a given flow rate through the airways is influenced by gas viscosity but not by the molecular weight or density of the gas.2

Poiseuille’s Law and Airway Resistance
Under laminar flow conditions, the pressure required to produce a given flow rate through a tube is defined by Poiseuille’s law ( ). In this equation, P represents the pressure gradient across the tube,
  represents the gas flow rate, l represents the tube length, n represents gas viscosity, r represents the tube radius, and 8 and π represent constants. This equation states that under laminar flow conditions, the pressure required to drive a given flow through a tube must increase if the tube length or gas viscosity increases. More important is the increased pressure needed to maintain a given flow rate when tube radius decreases. The equation shows that if an airway’s radius decreases to half of its original size (e.g., because of bronchospasm or mucosal edema), 16 times more driving pressure is required to maintain the original flow through the airway. For practical purposes, the constants in Poiseuille’s law can be lumped together to form one constant (K), simplifying Poiseuille’s law to
  . As this equation shows, pressure required to drive flow through a tube varies with the fourth power of the tube radius. Stated differently, the denominator of the equation (r4) is 16 times smaller if the tube radius is cut in half, which means the driving pressure required to keep flow constant must increase 16-fold. It is apparent that of all the factors affecting Raw, the most profound is the airway radius. In practical terms, a person must exert 16 times more effort (work) to maintain the same flow through airways that constrict to half of their original diameters. Put another way, if muscular weakness or fatigue prevents such increased effort, flow decreases to one sixteenth of its original value, drastically reducing ventilation.
Turbulent Flow
In contrast to laminar flow, turbulent flow is chaotic, with many churning eddy currents (see Fig. 3.21). Gas molecules swirl in lateral, reverse, and forward directions. The entire gas stream moves forward with no velocity difference between its center and outside portions; this lack of difference in flow rates across the tube’s diameter gives turbulent flow a blunt rather than conical velocity profile. Turbulent flow in the lung is much noisier than laminar flow because high-velocity gas molecules strike the airway walls much greater frequently. Turbulent flow requires a much higher driving pressure than laminar flow to produce a given flow rate. In laminar flow, the pressure gradient is directly proportional to the flow rate; if pressure doubles, the flow rate also doubles. But in turbulent flow, the pressure gradient is proportional to the square of the flow rate. Doubling the flow rate requires a fourfold increase in driving pressure. Poiseuille’s law does not apply to turbulent flow.
Turbulent flow is more likely to occur when the flow rate is high and when flow abruptly changes direction, for example, through narrow and sharply branching airways. Reynolds’ number (Re) predicts when the flow regimen will change from laminar to turbulent. The dimensionless number Re is derived from values for gas density, viscosity, velocity, and airway diameter. (The Re equation is complex, and its derivation is beyond the scope of this textbook.) Generally, if Re is greater than 2000, flow is turbulent. In contrast to laminar flow, the pressure required to produce a given flow rate in turbulent flow is influenced by the molecular weight of the gas or its density (greater density requires greater pressure) but not by its viscosity. For this reason, helium, a gas with very low density, is sometimes used to reduce WOB in patients with abnormally turbulent airflow, as occurs in severe airway obstruction (see Clinical Focus 3.8).
Tracheobronchial or Transitional Flow
The type of flow referred to as tracheobronchial or transitional occurs where airways branch and has characteristics of laminar and turbulent flow. One or the other type of flow may predominate, depending on the airway geometry and flow velocity.
Types of Flow in the Lung and Distribution of Airway Resistance
Flow patterns in the lung are highly turbulent in the upper airways, trachea, and major bronchi but never turbulent in bronchioles and distal airspaces. Normal quiet breathing commonly produces instantaneous peak flow rates of 1 L/sec, or 60 L/min, at the mouth. Even during quiet breathing, flow is highly turbulent in the pharynx, larynx, and trachea. As the airways branch toward the lung’s periphery, airflow is progressively redirected into more and more channels until finally, at the terminal bronchiole level, flow is distributed across hundreds of millions of airways; this greatly reduces flow velocity, and flow is exclusively laminar. Even during maximal ventilation, flow in the peripheral airways remains laminar. For similar reasons, Raw is normally much lower in small peripheral airways than in large airways (see Chapter 1). Collectively, the numerous peripheral airways have an enormous cross-sectional area, far outweighing the effects of their small individual diameters.
The upper airways, including the larynx, mouth, and nose, normally account for about 50% of total Raw at the FRC level; airways smaller than 3 mm in diameter account for less than 10% of the total Raw.13 However, in people who have severe emphysema, chronic bronchitis, or asthma, resistance to flow in the lower airways may equal or exceed upper Raw.
Dynamic Compliance
Lung and chest wall compliance measured while air is flowing is called dynamic compliance (Cdyn). The earlier discussions of compliance involve static compliance (Cst). Under dynamic conditions, airway pressure is a reflection of both elastic and flow-resistive opposition to lung inflation. The difference between Cdyn and Cst reflects the magnitude of Raw present.
Dynamic Pressure-Volume Curves
Fig. 3.22 is a plot of superimposed static and dynamic CL curves obtained during mechanical positive-pressure lung inflation with the respiratory muscles completely at rest. Lung inflation begins at FRC (point A). The straight, solid line (A–C) is the Cst curve, which is constructed by momentarily interrupting airflow at progressively greater volumes and holding the breath (ventilatory muscles relaxed) until all airflow ceases.
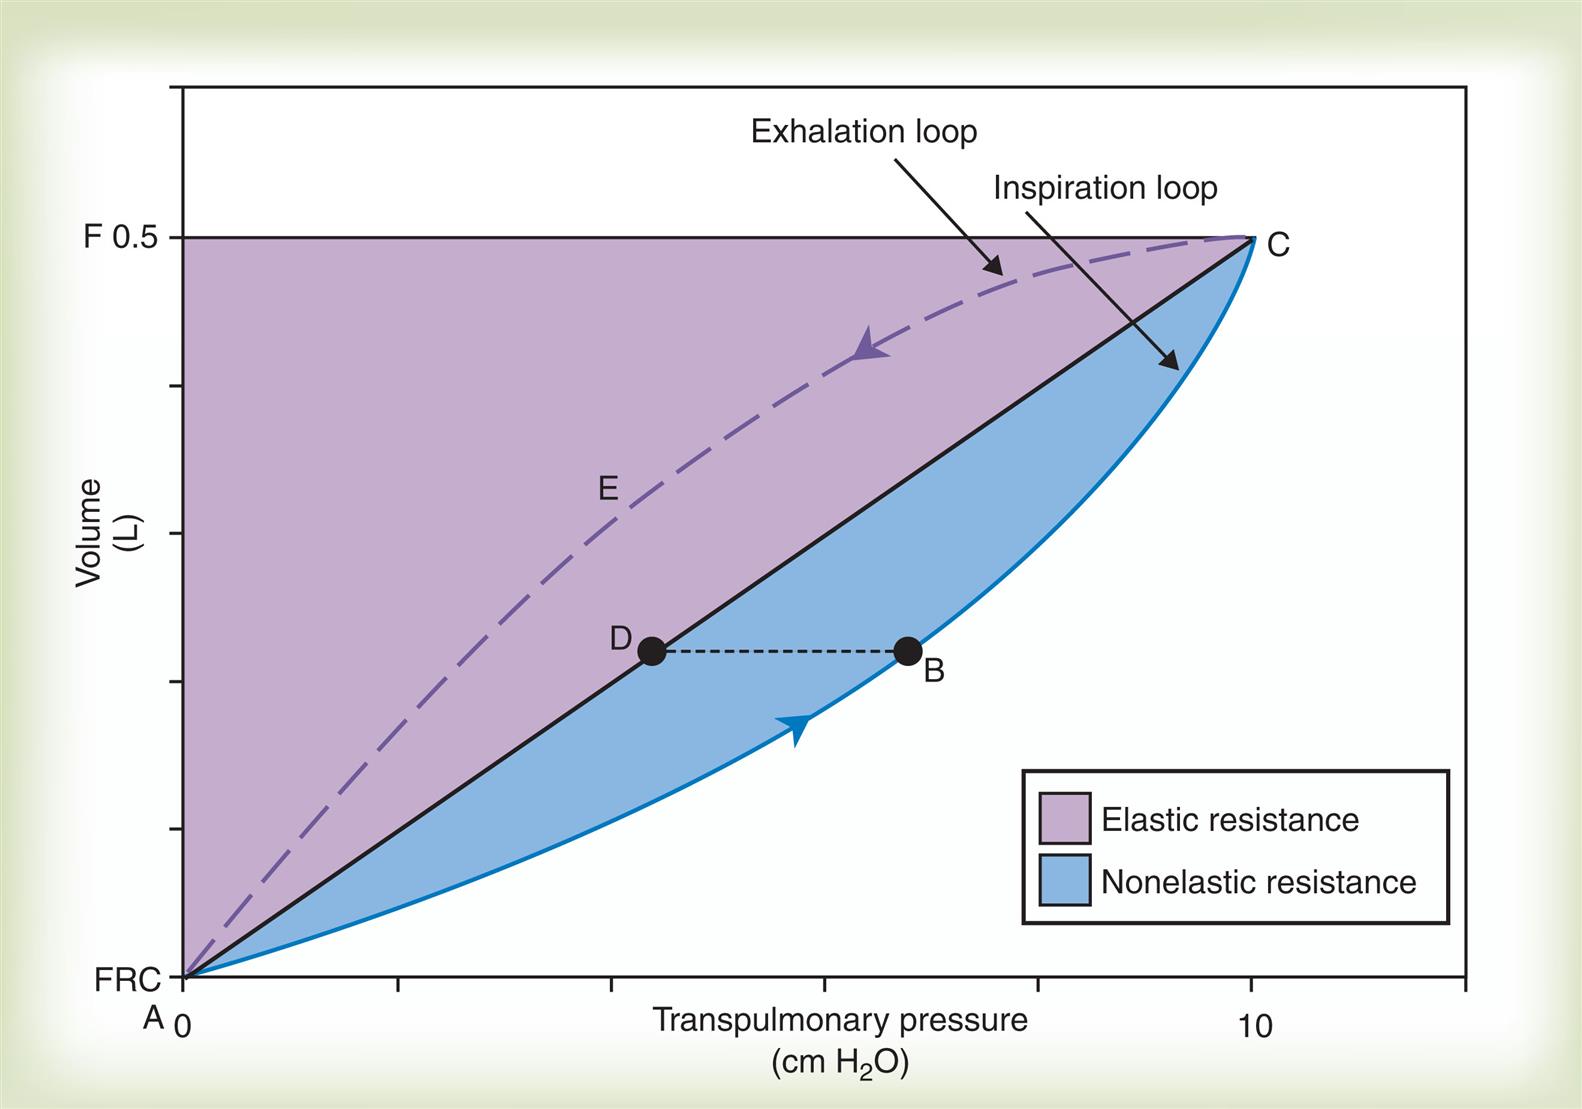
The curved solid line (ABC) plots pressures dynamically in real time as lung volume increases during a single uninterrupted lung inflation, creating the Cdyn curve. The Cdyn curve bows away from the straight Cst line, reflecting the “drag” that frictional airway resistance adds to elastic resistance. If lung inflation is abruptly halted and the breath is held at point B on the dynamic curve, airflow stops and frictional airway resistance ceases to exist; the pressure generated by this resistance disappears and airway pressure falls to point D on the static pressure curve. The pressure at point D is created by only the elastic recoil forces present at that volume, whereas the pressure at point B is created by elastic recoil forces plus flow-resistive forces. Thus pressure B minus pressure D represents the pressure generated by Raw. The white area in Fig. 3.22 is proportional to the inspiratory WOB caused by elastic resistance, and the shaded area (inspiratory portion of the loop) is proportional to inspiratory work caused by frictional airway resistance. The area enclosed by the curved dashed line (CEA on the expiratory loop) and the straight static curve (ADC) is proportional to expiratory airway resistance work. Modern positive-pressure mechanical lung ventilators can graphically display breath-by-breath P-V loops (compliance curves), allowing respiratory therapists to identify and differentiate elastic and frictional resistances to ventilation.
Peak and Plateau Airway Pressure
The same positive pressure breath illustrated in Fig. 3.22 can be graphically represented on a pressure versus time curve (Fig. 3.23). The pressure the ventilator generates to inflate the lung increases to a maximum peak value (see Fig. 3.23). This peak pressure (Ppeak) corresponds with the pressure represented by point B on the Cdyn curve in Fig. 3.22, which is created by the sum of elastic and frictional opposition to lung inflation. If the breath is held momentarily (an inspiratory pause), gas flow stops and Raw disappears, as does the pressure it generated; thus airway pressure falls to a slightly lower level and stays there until the person is allowed to exhale. This plateau pressure (Pplat) (see Fig. 3.23) is created by only the elastic recoil force of the lung–thorax system, which corresponds to point D on the static curve in Fig. 3.22. The Ppeak − Pplat difference is generated by only frictional Raw.
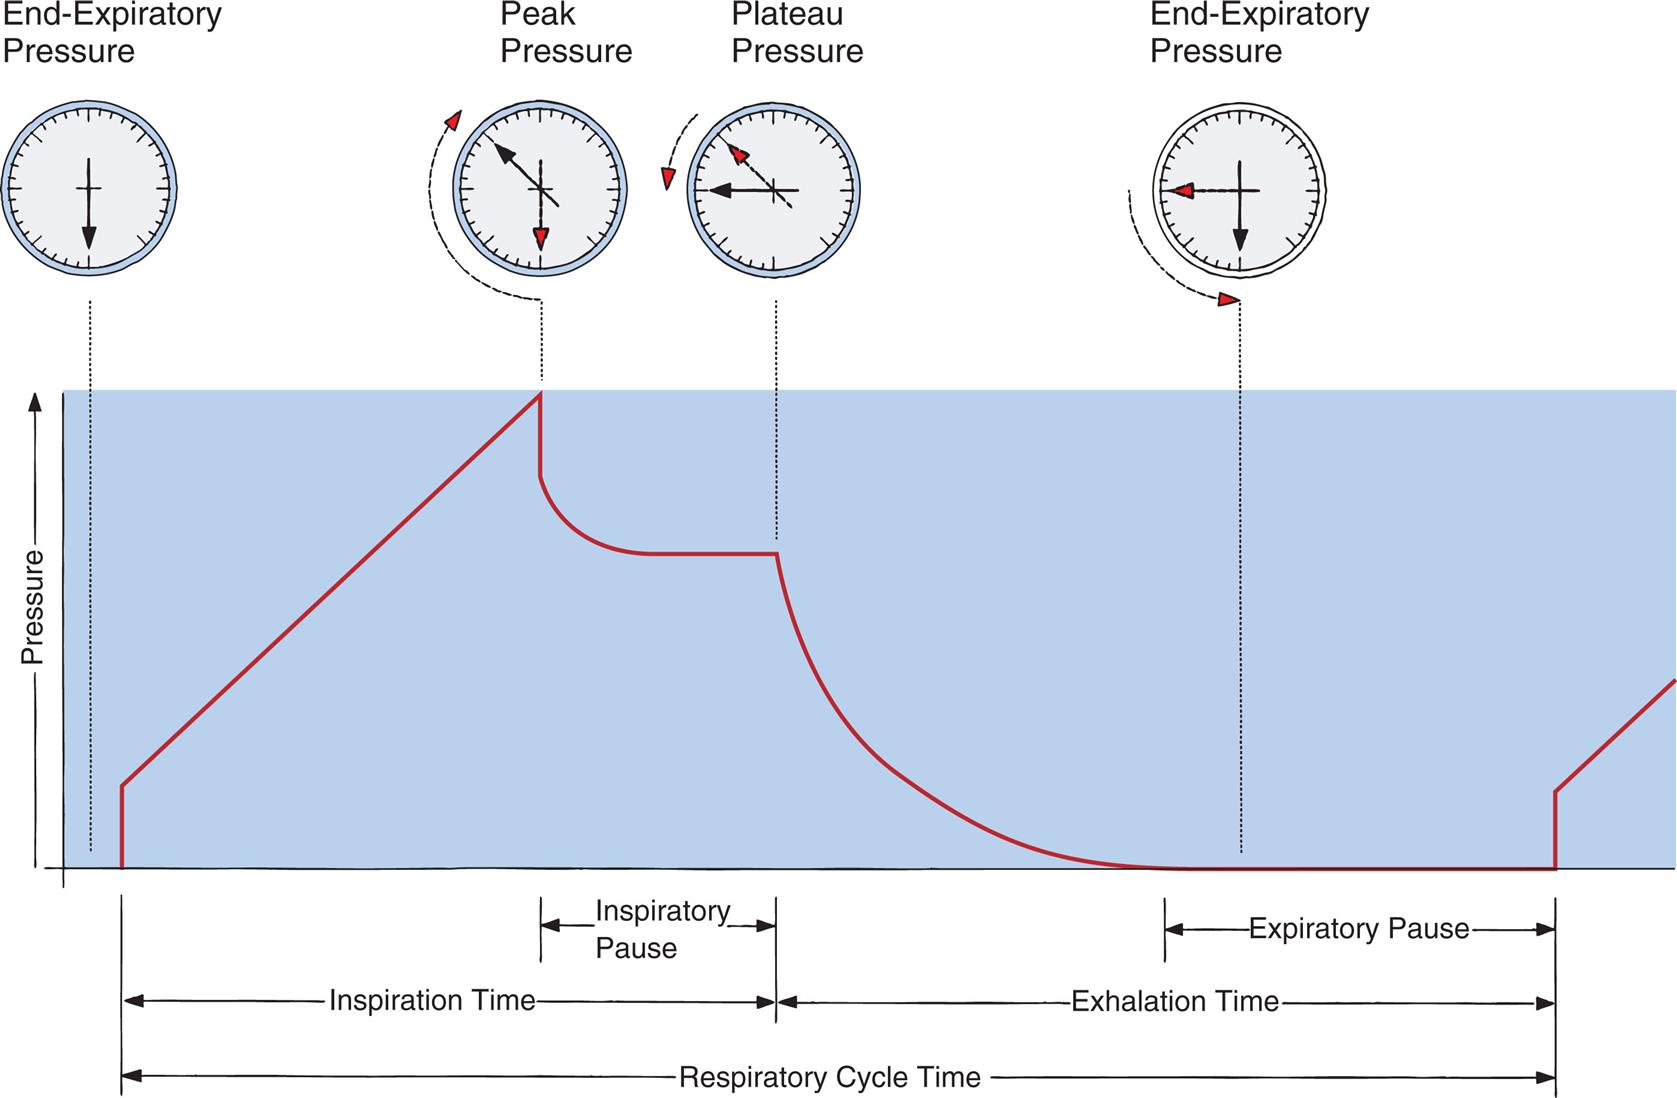
It is important to note that if all airways are open, Pplat is equal to PA because it is measured under static, no-flow conditions, after pressures equalize across the airways. Pplat is therefore more relevant than Ppeak in assessing the potential for pressure-induced alveolar stretch injury (barotrauma) during positive pressure mechanical ventilation.
Computation of lung–thorax compliance and airway resistance in mechanical ventilation
Respiratory system compliance (lung–thorax compliance [CLT]) and Raw can be easily computed on a mechanically ventilated patient. CLT and Raw are measures of elastic and flow-resistive (nonelastic) opposition to ventilation, respectively. By programming the ventilator to create an inspiratory pause, as just described, the respiratory therapist can directly measure Ppeak and Pplat (see Fig. 3.23). The delivered VT and the inspiratory flow rate are known values programmed into the ventilator. The CLT is calculated as follows:

Baseline pressure is the airway pressure at the end of expiration under no-flow conditions, just before inspiration begins. (In critically ill patients, the ventilator is often programmed to maintain some degree of PEEP in the airway to keep alveoli above their critical closing pressures; thus baseline pressure is not necessarily same as atmospheric pressure.) Changes in the CLT reflect changes in lung recoil forces. One can think of the denominator in the equation above (Pplat – baseline pressure) as the driving pressure that must be applied to the lung–thorax system to achieve the VT. (An explanation of the driving pressure’s clinical relevance in managing critically ill mechanically ventilated patients is presented in Chapter 14.)
A mechanically ventilated patient’s Raw can be computed from the ventilator’s inspiratory flow rate ( ) in L per second, Ppeak, and Pplat as follows (assuming a constant flow rate):

In this case, the computed Raw includes the resistances of the ventilator tubing and the endotracheal tube; nevertheless, changes in measured Raw are usually a reflection of changes in the patient’s airway diameter.
Ppeak during mechanical ventilation reflects both elastic and flow-resistive opposition to lung inflation, whereas Pplat reflects elastic resistance only. Ppeak, Pplat, CLT, and Raw are clinically useful in distinguishing between factors that increase lung recoil forces and factors that increase flow resistance through the airways.
Lung Inflation Pressure and Equation of Motion
We know from the previous section that the pressure required to drive gas into the airways and inflate the lungs is created by the elastic and frictional resistive elements that oppose ventilation. This is illustrated in Fig. 3.24. Lung inflation pressure can be expressed in terms of these two resistive elements as follows16:
 1
1
In this equation, Pappl is the airway pressure applied at the mouth, Pel is the elastic recoil pressure (a function of lung volume), and Pr is the airway resistive pressure (a function of flow rate). The Pappl may be supplied totally by the respiratory muscles (Pmus), by a mechanical ventilator (Paw), or by both (Pmus + Paw). Substituting the term Pmus + Paw for Pappl, eq. 1 can be written as follows17:
 2
2
Breathing is spontaneous or unassisted if only the respiratory muscles supply the inflation pressure (when Paw = 0). Breathing is mechanically assisted if a mechanical ventilator helps the respiratory muscles supply the inflation pressure (Paw is then positive). Breathing is completely mechanically controlled if the ventilator supplies all of the inflation pressure (when Pmus = 0). The inflation pressure needed to counteract the elastic recoil and airway resistance pressures can be calculated if elastance (E), resistance (Raw), volume (V), and flow rate ( ) are known:


Substituting the term V × E for Pel and the term  × Raw for Pr, eq. 2 can be rewritten as follows:
 3
3
Eqs. 1 to 3 are consistent with Newton’s third law of motion: “For every action, there is an equal and opposite reaction.” Each equation or a variation of each has been referred to as the respiratory system “equation of motion” (see Fig. 3.24). In eq. 3, if the patient breathes spontaneously, the airway pressure (Pmus) is negative during lung inflation. If the patient is attached to a mechanical ventilator and it supplies more flow than the patient demands, airway pressure becomes positive, and inspiration is assisted. If the ventilator supplies just enough flow to match the patient’s inspiratory flow demand exactly, airway pressure remains at zero throughout inspiration. The respiratory system equation of motion is the theoretical basis for this kind of mechanical ventilation, known as proportional assist ventilation (PAV).16 In PAV, the ventilator monitors volumes, pressures, and flows instantaneously as the patient breathes and uses this information to compute breath-to-breath inspiratory pressures (Pel + Pr) proportional to the patient’s inspiratory demands.
Exhalation Mechanics and Cephalad Flow Bias
During expiration, PL (the distending pressure across airway walls) decreases, causing the airway diameter to decrease. PL and anatomical tissue structure determine airway diameter. The cartilaginous airways are better able than small, noncartilaginous airways to resist pressure-induced diameter changes. Small airways depend on elastic retractile forces of surrounding lung parenchyma for their patency (see Chapter 1). Natural airway narrowing during normal tidal exhalation causes expiratory linear flow velocity to be greater than it is during inhalation, especially in small, peripheral airways (i.e., for a given flow rate, gas molecules pick up speed as they move through narrowed airways). This expiratory cephalad (toward the head) flow bias enhances the normal process of mucociliary clearance because mucus tends to move in the direction of the highest flow velocity.18 This effect is exaggerated during a cough when small airways are narrowed further by bursts of high intrapleural pressures; extremely high linear flow velocities provide the shearing forces necessary to propel mucus up toward the trachea and pharynx. (It is important to distinguish between bulk flow rate and linear flow velocity; although airway compression can reduce bulk flow rate [liters per second], it can at the same time increase linear velocity [meters per second].)
Expiratory Flow Limitation
Muscular effort determines the peak flow rate that can be generated by a maximal-effort exhalation if one begins to exhale from the TLC level. However, after about 20% of the VC is exhaled (20% of the way from TLC to RV), factors other than effort limit the expiratory flow rate. At some point during exhalation from TLC to RV, the pressure inside the airways falls below the Ppl surrounding the airways; as a result, small noncartilaginous airways are compressed and narrowed, limiting the maximal achievable expiratory flow rate.
At the start of a forced exhalation from the TLC level, abdominal muscles contract and force the diaphragm upward, and thoracic dimensions decrease, causing the normally subatmospheric Ppl to become positive. As a result, PA also increases. PA is the sum of static elastic recoil pressure (Pel) and surrounding Ppl (that is, PA = Pel + Ppl) as shown in Fig. 3.25, A. Frictional resistance to airflow causes the pressure along the airway to decrease steadily from the alveolus to the mouth, where pressure at the airway opening (Pao) is 0 mm Hg.
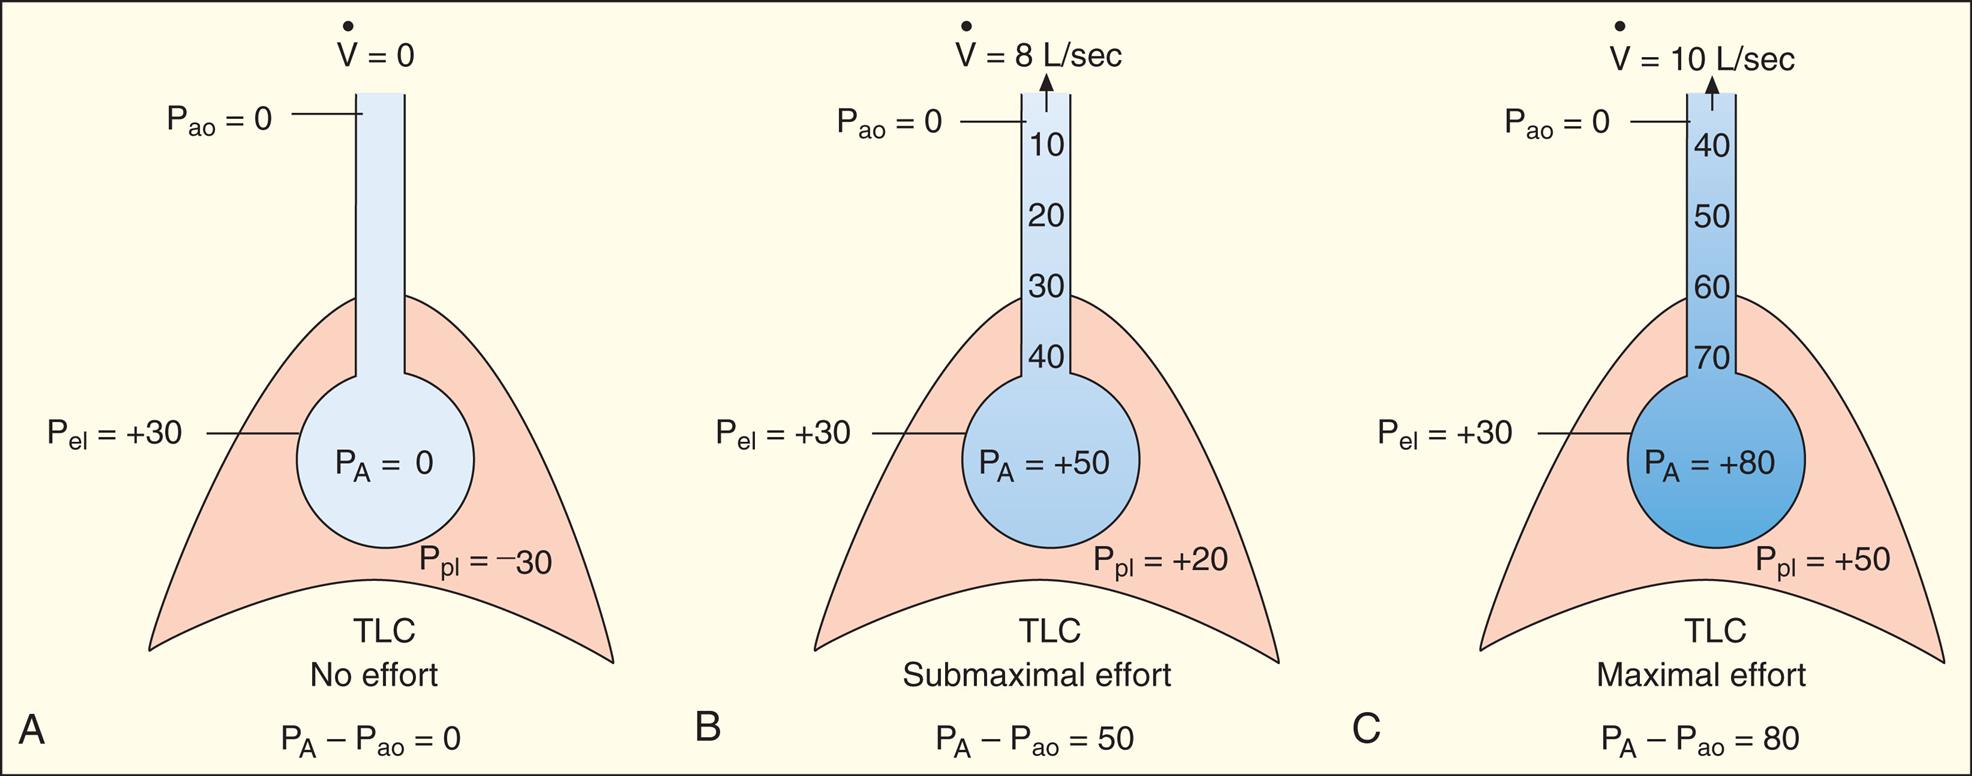
As exhalation continues and lung volume approaches RV, elastic lung recoil pressure decreases progressively as the shrinking lung approaches its resting zero recoil force level. The progressively lower Pel associated with diminishing lung recoil force means the maximum driving pressure that can be generated in the alveolus also diminishes (remember that PA = Pel + Ppl). As the lungs become smaller, the driving pressure and the maximal achievable expiratory flow rate decrease. This decrease in driving pressure is the main reason why pressure inside the airways eventually drops below pressure surrounding the airways (Ppl) as the lung nears RV. The point at which intra-airway pressure equals the surrounding Ppl is called the equal pressure point (EPP). Downstream from the EPP, the higher surrounding pleural pressure compresses and narrows the airways. In normal subjects this dynamic airway compression occurs only as the lung nears RV, where low elastic recoil force limits the maximum driving pressure that can be generated. In patients with emphysema, airway compression and collapse occur well above the RV level because the elastic recoil force of the lung is abnormally low in the first place.
Effort-Dependent and Effort-Independent Expiratory Flow Rate
If a maximal force exhalation starts from the TLC level, the initial flow rate is effort dependent—that is, greater efforts produce greater initial flows as shown in Fig. 3.25. In Fig. 3.25, A, the subject was instructed to inhale to TLC and hold the breath, keeping the glottis open. In Fig. 3.25, B, beginning at TLC, the subject was instructed to exhale forcefully but with a submaximal effort. In Fig. 3.25, C, the subject again starts to exhale from the TLC level, but this time with maximum effort. The high lung volume at the beginning of these exhalations produces a high elastic recoil pressure, which makes a high PA possible. Because PA is the sum of intrapleural and elastic recoil pressures, the higher the elastic recoil pressure, the greater the difference between PA and the surrounding Ppl. Therefore in a forced exhalation beginning from TLC, the PA pressure head is high enough that pressures down the airway (toward the mouth) never fall below Ppl before gas leaves the thoracic cavity. The EPP and dynamic airway compression described earlier never occur at high lung volumes near TLC. In Fig. 3.25, B and C, greater muscular effort produced greater driving pressures (PA − Pao) and thus greater flow rates; that is, maximal achievable flow rate is effort dependent.
In Fig. 3.26, A, the subject was instructed exactly as in Fig. 3.25, A, except that the exhalation maneuver began at 60% of VC instead of from TLC. At this smaller lung volume, the beginning lung recoil force is lower, and the difference between maximum achievable PA and Ppl is relatively small. Even during a submaximal exhalation effort (see Fig. 3.26, B), the pressure inside the airway soon falls below Ppl, and EPP is reached in airways well inside the thoracic cavity. A maximal expiratory effort (see Fig. 3.26, C) fails to produce a greater flow rate because the EPP represents a choke point between the alveolus and the mouth. In this situation, the driving pressure that produces the expiratory flow rate is not PA − Pao, as it is in Fig. 3.25, B and C, but is instead PA minus the EPP choke point pressure, which is identical for submaximal and maximal efforts in Fig. 3.26, B and C. One can think of the airway compression at EPP as a valve that controls the flow rate, similar to the way pinching the middle of a garden hose would control the outflow of water at the hose’s end. Greater muscular effort in Fig. 3.26, C, simply produced an increase in Ppl that exactly matched the increase in PA. Therefore the flow rate remains constant and is effort independent.
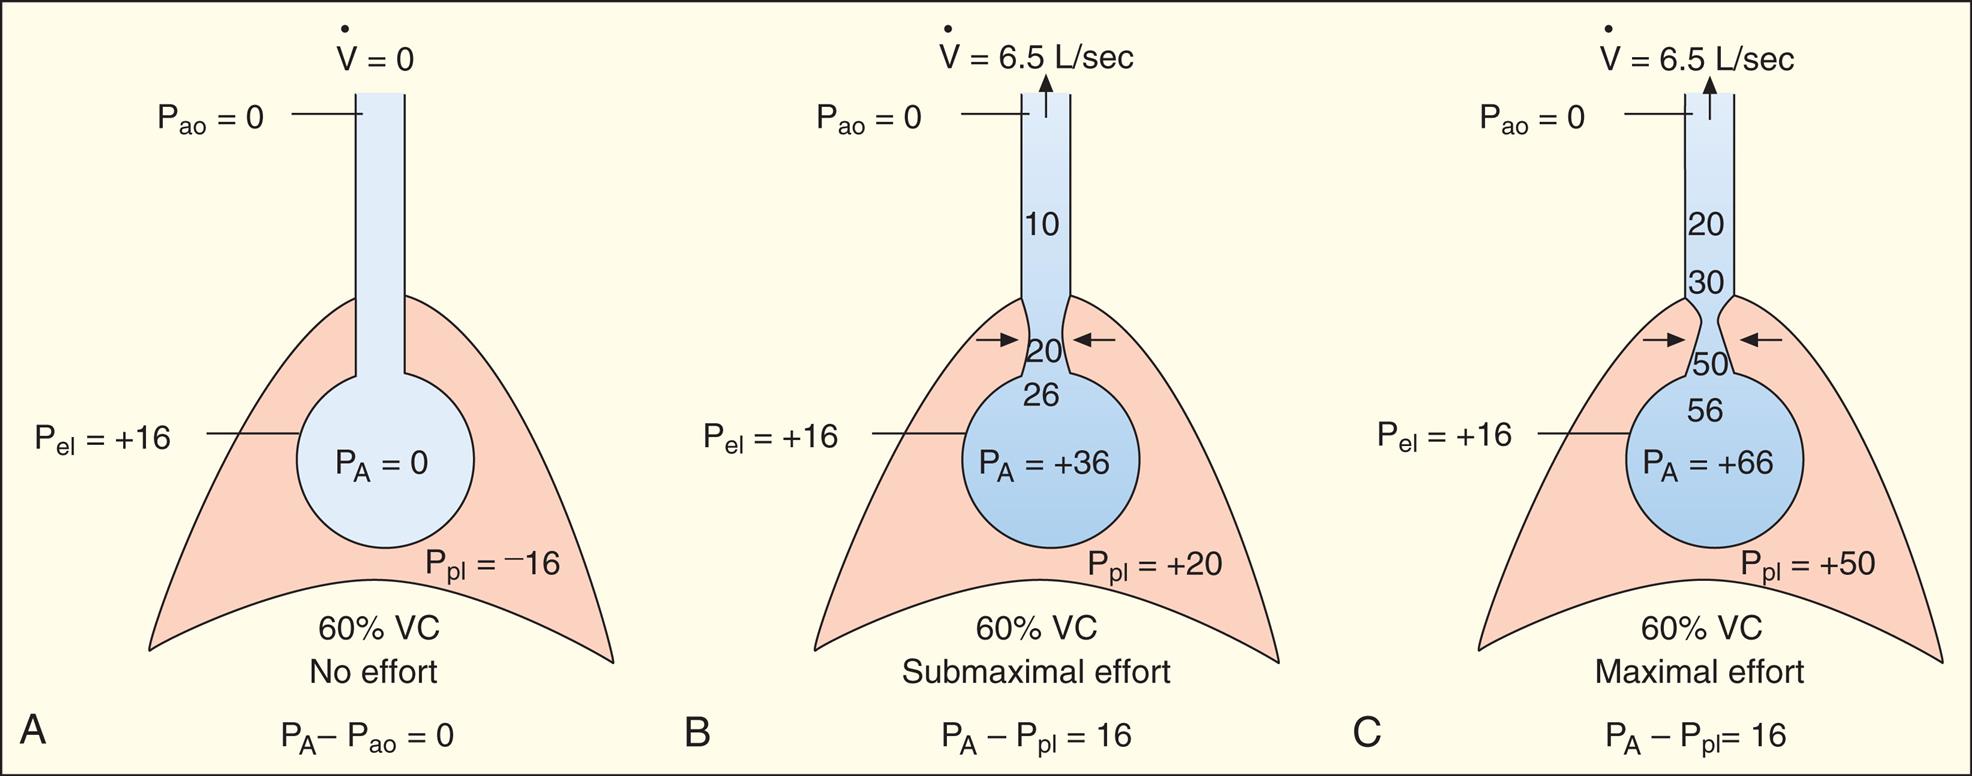
Isovolume Pressure-Flow Curve
The term isovolume means “at the same volume.” The isovolume pressure-flow curve (Fig. 3.27) can be constructed after a person repeatedly inhales as deeply as possible to TLC, each time exhaling the VC with different efforts. Each time the person exhales the VC, greater effort is used, until the last VC is exhaled with maximal effort. The flow rate, volume, and Ppl (using an esophageal balloon) can be measured simultaneously during each exhaled VC maneuver. For all separate VC efforts performed, from weak to maximal efforts, all flow rates and their corresponding Ppl values that occurred exactly at 60% of VC are identified. Each flow rate is plotted against each corresponding Ppl value obtained at 60% of each VC effort (see Fig. 3.27). This curve is called an isovolume pressure-flow curve because all flows and pressures are measured at the same volume (60% of VC).
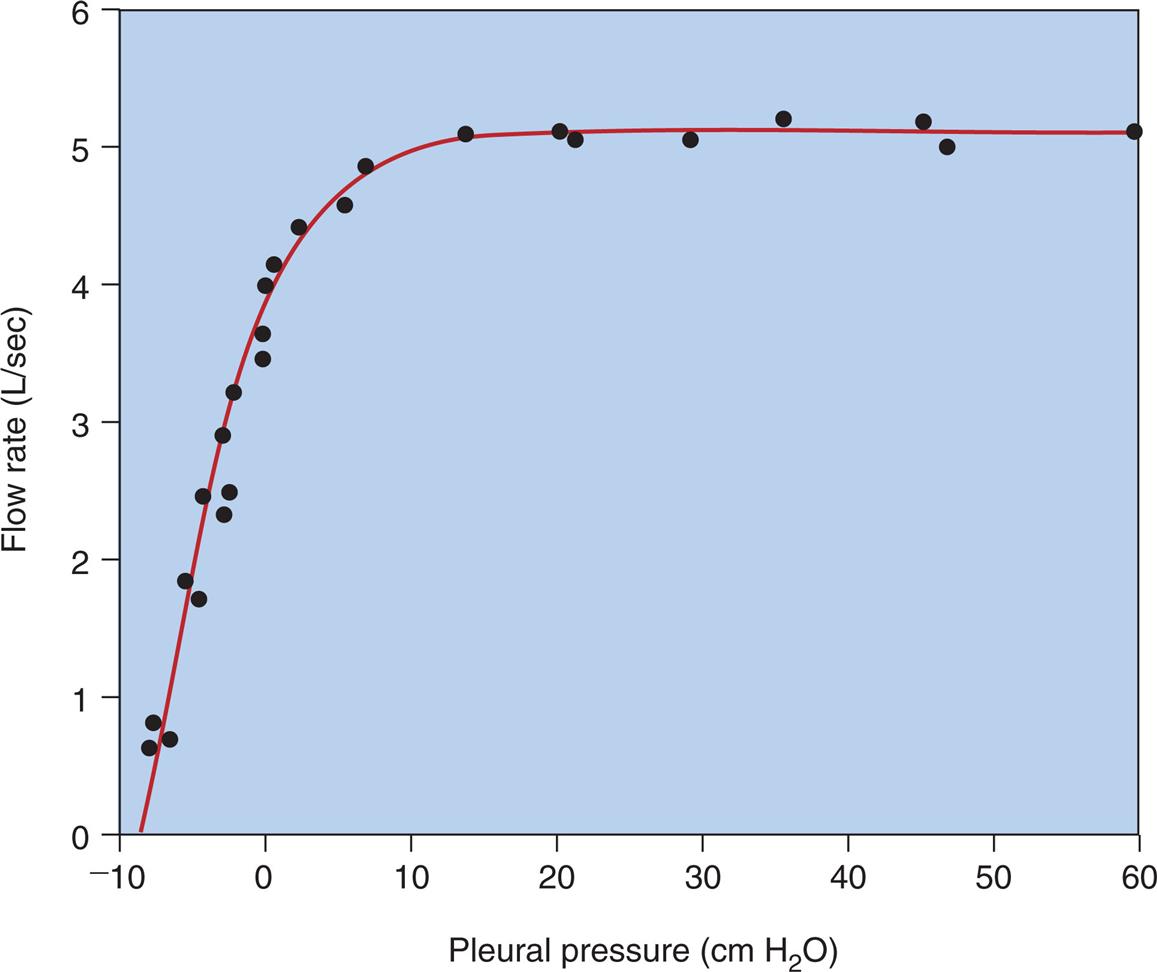
The points on the curve in Fig. 3.27 represent the different flow rates and pressures produced by their respective exhalation efforts, all of which are measured precisely at the moment the lung deflates through the point at which 60% of the VC is exhaled. The striking feature of this curve is that flow no longer increases after expiratory efforts cause pleural pressures to exceed the 10 cm H2O point. Even maximal effort (60 cm H2O pleural pressure in Fig. 3.27) fails to increase the flow rate. This graph shows that after the flow rate plateau is reached, the flow rate becomes effort independent. This flow limitation is explained by the EPP phenomenon described in the previous section.
If several other pressure-flow curves are plotted at different lung volumes in exactly the same manner just described, a family of isovolume pressure-flow curves is produced, each at a different lung volume (Fig. 3.28, A). At 90% of VC, increasing effort always produces increasing flows (i.e., a flow rate at 90% of the VC is effort dependent). At lower lung volumes (60%, 30%, and 10% of VC), expiratory flows initially increase with greater efforts, but after a certain point, further effort fails to increase flow. Each lung volume has its own maximum achievable flow rate ( ). If, on the same graph, each
  is plotted against its corresponding lung volume (instead of its corresponding pleural pressure), a flow-volume curve is created that is identical in shape to a flow-volume curve recorded instantaneously from a single exhaled, forced VC maneuver (see Fig. 3.28, B). The FVC flow-volume curve is actually a continuous plot of all the maximum flows achievable at all lung volumes ranging from TLC to RV. (The use of flow-volume curves in assessing pulmonary function is discussed in Chapter 5.)
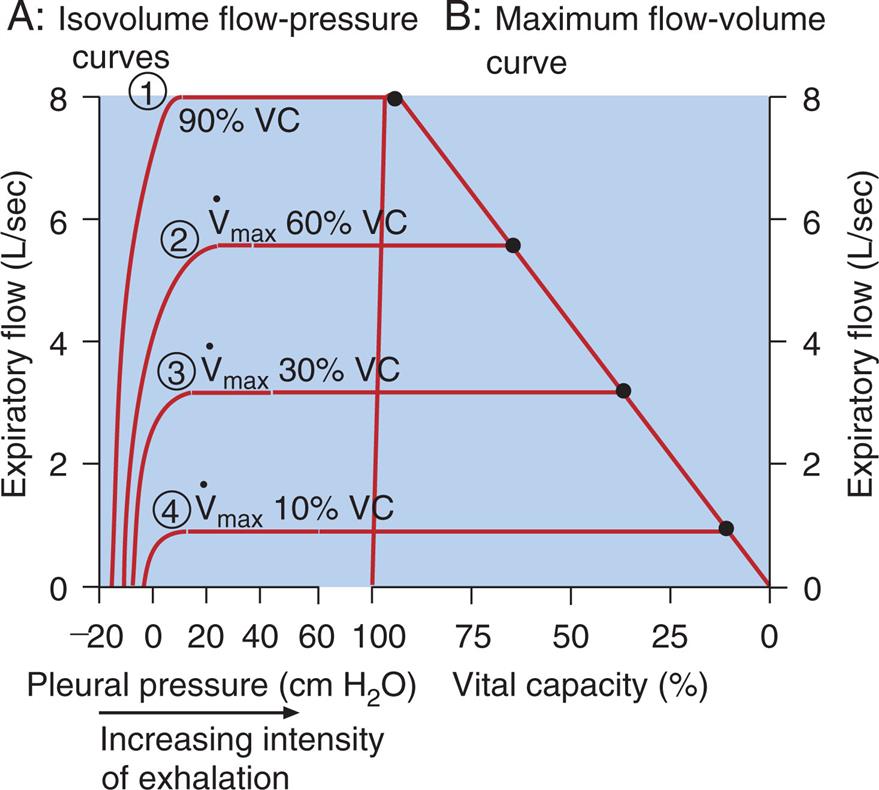
Time Constants in Ventilation
If a constant pressure is abruptly applied to the trachea, gas flows into the lungs until the lung pressure equals the applied pressure; at this point, the lung contains a volume determined by its compliance. CL and Raw determine how rapidly the source pressure and lung pressure equalize. The product of CL and Raw is the time constant (TC), expressed in seconds. This is shown as follows:

When an instantaneous, constant pressure is applied to the trachea, the rise in lung pressure and rise in lung volume are exponential functions of the time constant. After one time constant elapses, about 63% of the final equilibrium pressure or volume is achieved; 86.5% is achieved at the end of two time constants, 95% is achieved at the end of three time constants, and 99.3% is achieved at the end of four time constants. With normal values for total compliance (0.1 L/cm H2O) and Raw (1.0 cm H2O/L/sec), TC is as follows:

The time required for five time constants to elapse is 5 × 0.1 = 0.5 sec; in other words, 0.5 sec is enough time for pressure in normal lungs to rise and equilibrate with an applied inflation pressure.
Effect of Compliance
Stiff lungs with low compliance achieve equilibrium with the inflation pressure quickly but at a low volume (Fig. 3.29, B). Likewise, stiff lungs empty quickly because of their high elastic recoil. Lungs with low compliance and normal Raw have short time constants, that is, short inflation and deflation times. Four to five time constants are still required for complete inflation or deflation, but the absolute time required is less than for a normally compliant lung.
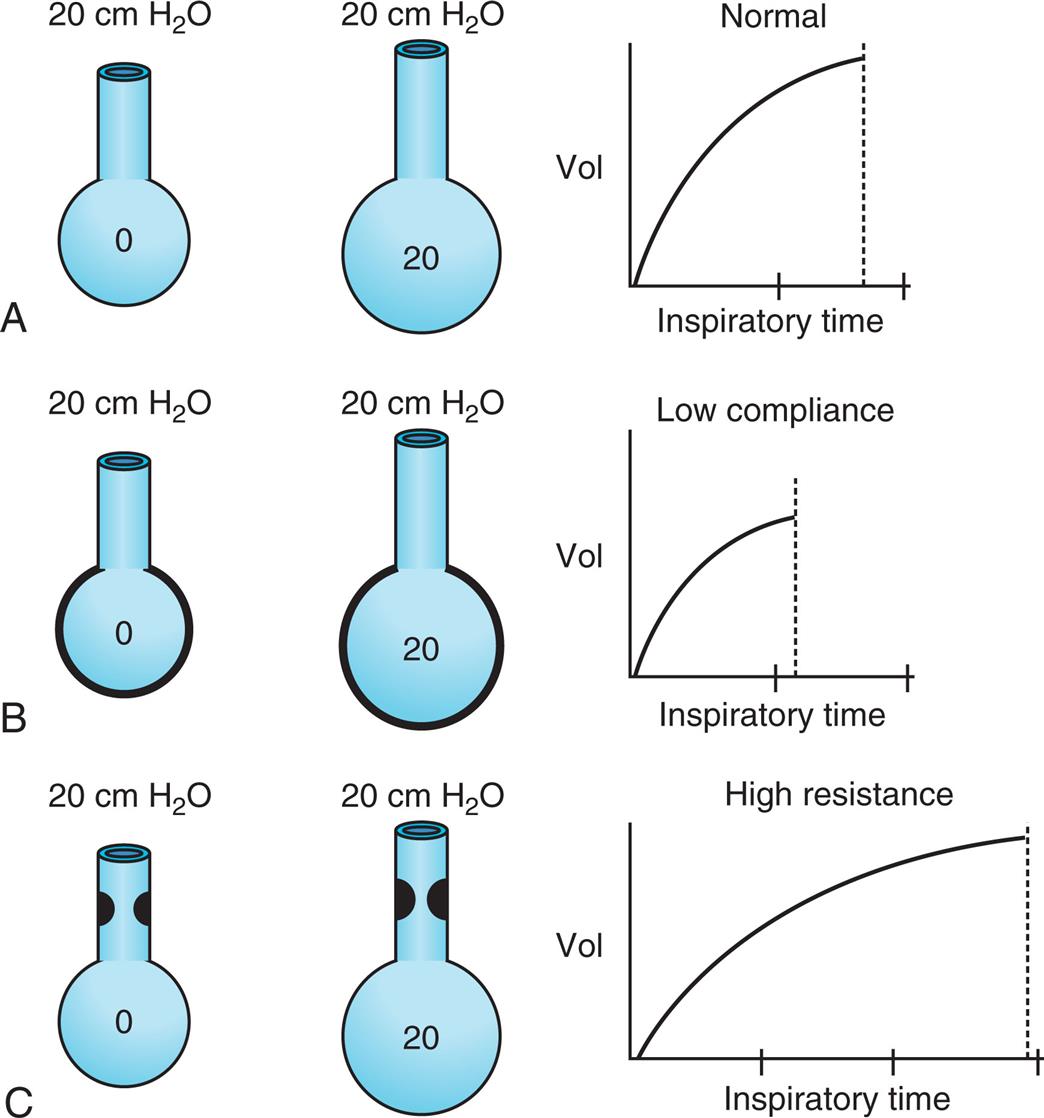
Effect of Airway Resistance
Fig. 3.29, C, illustrates that high frictional resistance leads to long inflation and deflation times. If the same instantaneous inflation pressure is applied to normal lungs and lungs with high Raw, more time is required for pressures to equalize across the high-resistance airways. Four or five time constants are still needed for pressure equalization, but each time constant is relatively long. Given adequate time, the lung with increased Raw eventually achieves the same volume as the normal lung, if inflation pressures are identical (see Fig. 3.29, C). Equally important, lungs with high Raw require long expiratory (deflation) times. Inadequate expiratory time leads to incomplete lung emptying, air trapping, and hyperinflation of the lungs.
Frequency Dependence of Compliance
Because small airways (<2 mm in diameter) account for less than 10% of the total Raw, they constitute a “silent zone” in which considerable disease may go undetected by conventional pulmonary function tests. One marker of increased small airway resistance is the frequency dependence of compliance.19 (Although frequency dependence of compliance studies are not performed in clinical practice, the explanation is helpful in understanding the factors that affect gas distribution in the lungs.)
Raw is so low in healthy people without disease that Cdyn and Cst are essentially equal at normal breathing rates. Even at 60 breaths/min (which implies the presence of high flow rates), Cdyn and Cst are equal in normal people. Therefore Cdyn is not normally affected by breathing rate; it is not frequency dependent, which implies that all ventilating lung units have normal and uniformly distributed resistances and time constants.
When Raw is not uniformly distributed throughout the lung, different areas fill and empty at different rates. An increased breathing frequency exaggerates the difference in filling and emptying rates. As the breathing rate continues to increase, the high-resistance units receive less and less ventilation until eventually most of the VT enters only normal units. High-resistance units require high driving pressures for a given VT; thus measured dynamic compliance decreases. If Cdyn decreases by 25% or more when the breathing rate increases from 20 to 60 breaths/min, compliance is considered to be frequency-dependent, indicating abnormally high small airway resistance. Frequency dependence of compliance may be present even if conventional Raw measurements are normal.
Effects of Lung Compliance and Airway Resistance on Ventilation
Distribution of Inspired Air
All lung units are connected to the same common airway and are exposed to the same inspiratory time. High-resistance units always lag behind the rest of the lung in filling and emptying times. When airway resistance is high, alveoli develop differential pressures at end-inspiration because of regional differences in Raw. After inspiration ceases, air may continue to flow within the lung from high-pressure to low-pressure areas. This intrapulmonary redistribution of gas between regions of differing Raw is called pendelluft.
Air Trapping and Auto-PEEP
High airway resistance, as seen in patients with asthma, and weak lung recoil force, as seen in patients with emphysema, require abnormally long expiratory times. High breathing rates shorten the time available for expiration, and if coupled with high airway resistance or weak lung recoil force, may not allow enough time for the lungs to empty to the normal FRC level before the next inspiration begins. If the lungs do not have enough time to empty, pressure in some of the slowly emptying alveoli may still be positive at the end of expiration when the next inspiration begins. Trapped air and pressure in the lung caused by inadequate expiratory time is called auto-PEEP—so-called because positive end-expiratory pressure “automatically” develops under these conditions.
Auto-PEEP increases the FRC, hyperinflates the lungs, and increases WOB. WOB is increased because (1) hyperinflated lungs have decreased compliance (high elastic recoil) and (2) the first part of each inspiratory effort is used to reduce the trapped positive alveolar pressures below airway opening pressure so that gas can start to flow into the lungs. For example, if at the end of expiration, PA is +5 cm H2O and pressure at the endotracheal tube opening is 0 cm H2O, the inspiratory muscles first must work to expand the thorax to decompress PA below 0 cm H2O before gas can start to flow into the lung; this makes inspiratory flow lag behind the patient’s inspiratory effort, creating ventilator-patient asynchrony. Compounding the problem, hyperinflation lowers the resting position of the diaphragm, shortening its muscle fibers as though it were already contracting and in a mid-inspiratory position. Such precontraction fiber shortening limits the diaphragm’s force of contraction.
Clinicians sometimes intentionally apply PEEP (sometimes called extrinsic PEEP) to the upper airway during mechanical ventilation to prevent premature collapse of alveoli during exhalation; this is different from auto-PEEP, which is an intrinsic abnormal development in patients with high airway resistance or weak lung recoil force. Other terms for auto-PEEP may include intrinsic PEEP, inadvertent PEEP, covert PEEP, and occult PEEP. These terms refer to the fact that auto-PEEP is hidden and difficult to detect by normal means. Standard mouth pressure measurements fail to detect auto-PEEP because alveolar pressure is still positive even after mouth pressure has decreased to zero.
Regional Pleural Pressure Gradients and Gas Distribution
Ppl does not have the same value throughout the pleural space from lung base to apex (Fig. 3.30). In the upright position, the gravitational downward pull of lung tissue and blood creates a greater negative Ppl at the apex (−8 cm H2O) than at the base (−3 cm H2O). Thus alveolar distending force, or PL is greater in the apex (PL = 8 cm H2O) than the base (PL = 3 cm H2O). As a result, apical alveoli are more inflated and have higher recoil forces (i.e., are less compliant) than basal alveoli at the FRC level. Consequently, inspired tidal air preferentially flows to the more compliant basal lung units, ventilating them more than apical units. Although apical alveoli contain the greater volume, their decreased compliance allows less volume change per breath and less ventilation per minute.
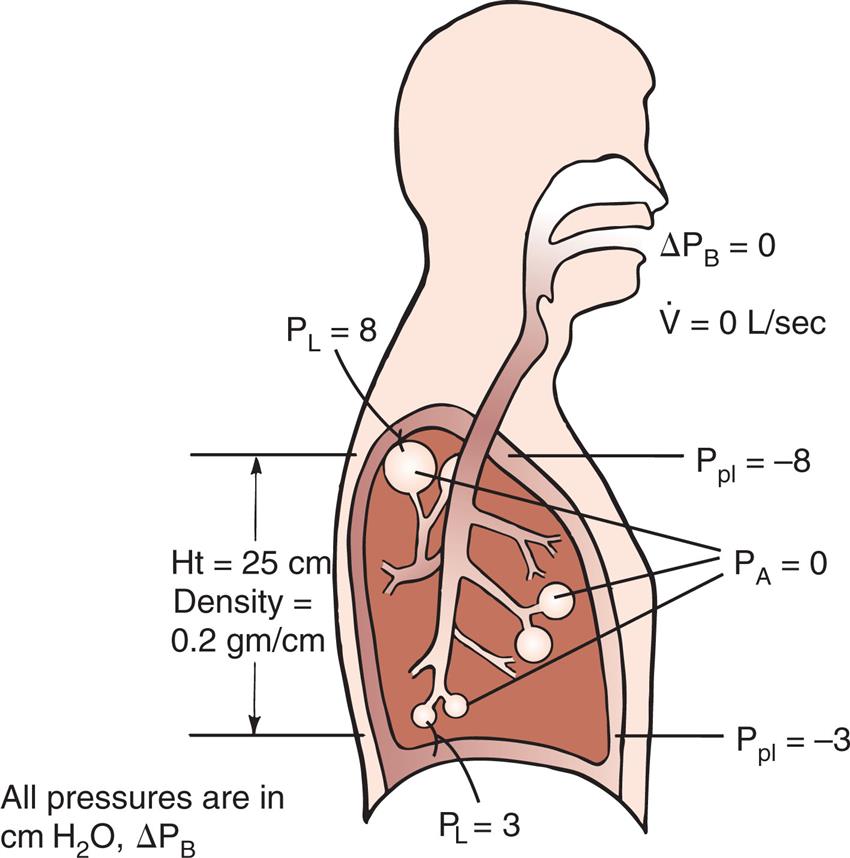
During a VC inspiration from RV to TLC, the basal alveoli undergo a greater volume change than apical alveoli. If a person exhales forcefully to RV, pleural pressure at the base becomes positive and small airways collapse. However, pleural pressure at the apex is still negative, and apical airways remain patent (Fig. 3.31, RV). If the person slowly inhales from RV to TLC, air first flows into the patent airways of apical alveoli; basal alveoli cannot receive volume until the Ppl is reduced below atmospheric levels and they begin to expand.
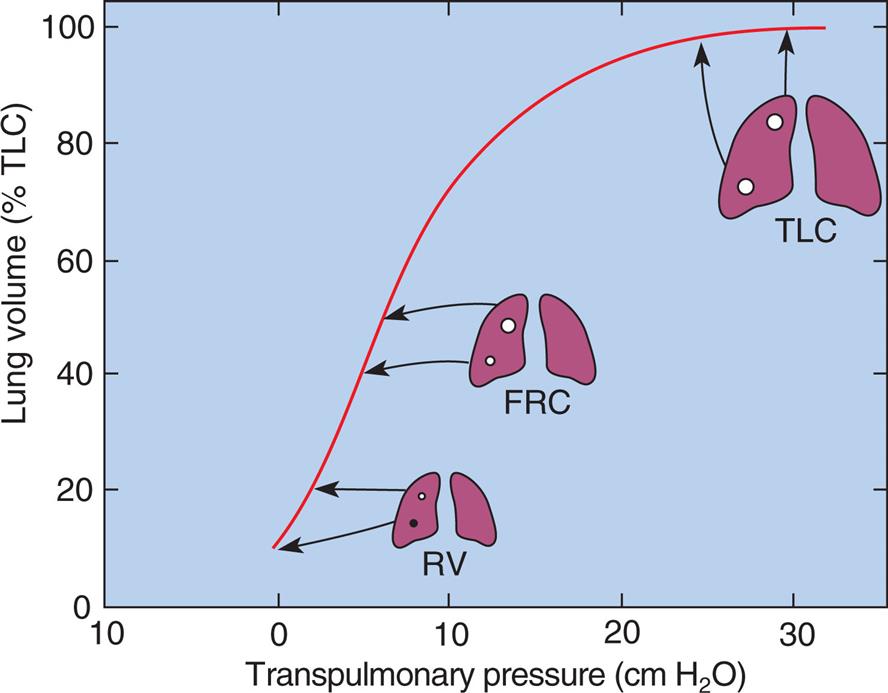
Apical alveoli at RV are small and on the steep part of the P-V curve (i.e., they are compliant and easily inflated because they are close to their resting volumes). However, at FRC (see Fig. 3.31), apical alveoli are more distended and less compliant than basal alveoli. At TLC, apical and basal alveoli are nearly the same size. Although the PL values are different, they are both on the flat part of the P-V curve, and their volumes differ only slightly. The greater portion of the inspired VC enters basal alveoli because they undergo a greater size change.
If the inspired VC described previously consists of 100% oxygen, the oxygen concentration of basal alveoli increases more than that of apical alveoli because basal alveoli receive more of the inspiratory gas. For the same reason, the nitrogen concentration of basal alveoli falls to a greater extent (i.e., nitrogen is more diluted by oxygen) than the nitrogen concentration of apical alveoli. This principle is the basis for the single-breath nitrogen elimination test, in which the nitrogen concentration is continuously plotted against volume as a person exhales a previously inspired VC of 100% oxygen. As the exhalation approaches RV, small basal airways close and no longer contribute their nitrogen-depleted air to the exhaled gas stream. Thus near RV, exhaled gas originates entirely from the relatively nitrogen-rich apical alveoli. The basal airway closure point is marked by the sudden increase in exhaled nitrogen concentration. The volume in the lung at this point minus the RV is called the closing volume.
People with high small airway resistance have early small airway collapse, as discussed previously. Therefore they have abnormally high closing volumes. The single-breath nitrogen elimination test has been used to detect the presence of small airway obstruction.
Effect of Compliance and Resistance on Pressure Gradients in Positive-Pressure Ventilation
During PPV, compliant lungs transmit more of the alveolar pressure into the pleural space than noncompliant lungs. Under normal conditions, when CLT is about 0.1 L/cm H2O, approximately half of the applied positive pressure in the alveoli is transmitted into the pleural space.1 Diseased lungs with low compliance (high recoil force) may transmit only one-third or one-fourth of their pressures. High intrapleural pressures induced by PPV in critical care settings may compress the great veins in the mediastinum and impede the return of venous blood to the heart. This effect is more pronounced when CL is normal but is less evident in stiff, noncompliant lungs; that is, if lung expansion is limited, less pressure can be transmitted into the pleural space.
During PPV, Raw affects the difference between Pao and PA, that is, the driving pressure for lung inflation. High Raw may cause the Pao to rise so high that, at the end of inspiration, the ventilator’s inspiratory time is not be long enough to allow PA to equalize with Pao. For this reason, individuals with high Raw, such as patients with severe asthma, can be ventilated with relatively high peak upper airway pressure without subjecting the alveoli to the same high pressure. The best indicator of true PA is the pressure obtained during an inspiratory pause (Pplat), when all gas flow stops and pressures are the same along the length of the airways.
Effect of Compliance and Resistance on Work of Breathing and Ventilatory Pattern
Work of Breathing
Work is required to overcome the elastic and frictional opposition to lung inflation. Expiration normally does not require muscular work under resting conditions. However, high Raw may require expiratory muscular work if passive lung recoil fails to overcome frictional resistance quickly enough to accommodate normal breathing rates.
Work is performed when a force moves an object over a certain distance (work = force × distance). This equation shows that no matter how great the force, if the object does not move, no work is performed. Thus WOB is a poor indicator of patient effort, which is one reason why it is not commonly calculated in the clinical setting. Work is measured in units of kilograms multiplied by meters (kg · m). The work equation can be modified to calculate WOB by substituting pressure for force (force equals pressure per unit of area) and lung volume for distance: WOB = P × V, which yields work units expressed in cm H2O · L. Generally, however, mechanical work is expressed in terms of either kg · m or joules (J). (To convert cm H2O · L to kg · m, divide cm H2O · L by 100; to convert to J, divide cm H2O · L by 10.) WOB is sometimes expressed in terms of work per unit of volume or kg · m/L. Normal WOB is about 0.05 kg · m/L or 0.5 J/L.
The respiratory muscles affect the mechanical WOB during spontaneous ventilation because they tense and add resistance to chest wall expansion. Therefore the work of lung inflation is best measured on a sedated patient during mechanical ventilation, when respiratory muscles are completely relaxed. The P-V curve in Fig. 3.22 illustrates the elastic and resistive WOB performed on the lung–thorax system by a positive pressure ventilator. Elastic opposition to inflation is proportional to the white triangle ADCFA. The shaded area, ABCDA, represents the work required to overcome frictional resistance. The total work is represented by the sum of both areas (ABCFA). About 65% of the total work during quiet breathing is elastic work; the remaining 35% is frictional work. Of the frictional work, 80% is used to overcome Raw, and 20% is used to overcome viscous resistance, or the friction between tissues as they slide over each other.
Expiratory frictional resistance, represented by the area ADCEA in Fig. 3.22, is normally overcome by stored elastic recoil energy of the lung. The lung deflates along the line CEA and inflates along the line ABC.
Ventilatory Pattern and Work of Breathing
Rapid breathing rates produce high flows, which increase the frictional component of work. Large VTs stretch the lung, increasing its recoil force and the elastic component of work. In health and disease, the body automatically chooses a breathing rate and VT that minimize the total WOB.
A patient with COPD has high Raw, especially on expiration, and the lungs have weak elastic recoil force. Therefore patients with COPD breathe at low respiratory rates to minimize frictional work and allow more exhalation time. At the same time, these patients can afford to breathe more deeply because of the lung’s weak elastic recoil force. Patients with COPD often must use a considerable amount of muscular energy (abdominal muscles) to exhale through high-resistance airways and to assist the emptying force of weakly recoiling lungs.
A patient with pulmonary fibrosis chooses a rapid and shallow breathing strategy. Elastic recoil is high; therefore a smaller VT minimizes the WOB. A normal Raw allows higher breathing rates. To summarize, high Raw with normal or increased CL produces slow, moderately deep breathing, whereas normal Raw with low compliance produces rapid, shallow breathing.
Muscular Weakness and Fatigue
If the respiratory muscles are already weak, increased WOB may lead to muscle fatigue. Weakness refers to the decreased force-generating capacity of the rested muscle; fatigue refers to the decreased force-generating capacity of actively working muscles, reversible by rest.20 Respiratory muscle weakness is common in critically ill patients and predisposes them to ventilatory failure. Clinical assessment of respiratory muscle fatigue is important in determining a patient’s need for mechanical ventilation.
Overt diaphragmatic fatigue may result from excessive WOB with or without muscle weakness. Overt fatigue is defined as the inability of the diaphragm to sustain a given force of contraction throughout inspiration.20 A measure of the diaphragm’s force of contraction is the transdiaphragmatic pressure (Pdi), or pressure difference across the diaphragm.21 Pdi is measured after the subject swallows a tube with both esophageal (above the diaphragm) and gastric (below the diaphragm) balloons attached. Pdi is the difference between esophageal and gastric balloon pressures. Any force that resists lung inflation causes the diaphragm to contract more forcefully, which increases Pdi.
A key indicator of diaphragmatic fatigue is the ratio between quiet-breathing Pdi and the maximal Pdi (Pdimax) a person can generate.21 This ratio tells the clinician what percentage of the maximal force-generating capacity the patient uses for each breath. The Pdi/Pdimax ratio increases when (1) lung recoil or Raw increase or (2) muscular weakness (i.e., low Pdimax) is present. The Pdi/Pdimax ratio in normal persons breathing quietly is about 0.05. Patients with a Pdi/Pdimax ratio of 0.4 or more eventually experience diaphragmatic fatigue.20
An index of diaphragmatic fatigue is the tension-time index of the diaphragm (TTdi), which relates the Pdi/Pdimax ratio to the time spent in inspiration (Ti). Ti is expressed as a fraction of the total breath cycle time, Ti/Ttot, or the so-called “duty cycle.” The product of these two ratios produces the TTdi, shown as follows:20

The greater the diaphragmatic fatigue, the greater the TTdi. TTdi takes into account (1) the percentage of maximum achievable inspiratory force the patient uses for each breath and (2) the length of time the force is applied. Clinical studies reveal that a TTdi of 0.15 is the fatigue threshold or critical TTdi above which healthy subjects cannot persistently maintain their breathing patterns.20
The disadvantage of TTdi is that it is an invasive procedure involving the swallowing of esophageal and gastric balloons, which makes it impractical for routine clinical assessment. In addition, TTdi focuses on diaphragmatic function alone and does not take into account the contribution that the rib cage and accessory muscles make to vigorous inspiratory efforts. The diaphragm and rib cage muscles are uncoupled, each able to function independently. In quiet, nonstressful inspiration, only the diaphragm is active, but as inspiratory load increases (e.g., breathing through an endotracheal tube), the rib cage muscles take on an increasingly greater share of the inspiratory work.
An alternative noninvasive estimate of TTdi is the tension-time index of the inspiratory muscles (TTmus), which reflects the performance of all inspiratory muscles involved in respiratory effort. TTmus uses easily measured mouth occlusion pressures instead of esophageal and gastric pressures. TTmus has also been called the pressure-time index [PTI].) TTmus is calculated as follows22:

The negative inspiratory pressures, PI and PImax, are measured at the mouth while the subject breathes through a tube that the clinician can abruptly occlude to make pressure measurements. PI is the average inspiratory occlusion pressure measured during normal breathing, and PImax is the maximal inspiratory occlusion pressure the patient can generate. Ti/Ttot is the fraction of the total respiratory cycle spent in inspiration. PI is estimated from the negative airway pressure generated during normal breathing 0.1 second after the airway is abruptly occluded (P0.1). (The greater the value of P0.1, the greater the TTmus. The reason P0.1 increases as muscle strength decreases is that when fatiguing respiratory muscles fail to generate adequate tension, the muscle spindles become excited and stimulate the central nervous system, which increases the nervous drive to breathe.)23 The equation for estimating PI (the mean inspiratory occlusion pressure) is as follows24:

This method assumes that P0.1 is the rate at which pressure increases over the inspiratory time (cm H2O/sec). Because the pressure generated by the inspiratory muscles does not always increase linearly, this method may overestimate PI. However, a given individual’s inspiratory time-pressure waveform is quite stable and repeatable; thus repeated measurements of PI, P0.1, and TTmus for any one individual should be reliable.25
Because TTmus reflects the performance of all inspiratory muscles, it has an advantage over TTdi in assessing patients with high inspiratory loads, relevant especially in patients with COPD and restrictive lung disease. These patients inhale using predominantly rib cage muscles rather than the diaphragm, a pattern exaggerated by high inspiratory workloads.25
A disadvantage of the TTdi and TTmus is that they require maximal patient effort and cooperation. A more objective method that does not rely on patient cooperation is the transdiaphragmatic “twitch” pressure (Pditw), obtained through noninvasive bilateral magnetic stimulation of the anterior phrenic nerves.21 Upon stimulation, the diaphragm twitches involuntarily with maximal contraction force while the pressure difference across the diaphragm is measured using an esophageal catheter (as described earlier). A more clinical friendly, noninvasive alternative is to measure the negative pressure generated at the patient’s airway opening, usually the end of an intubated patient’s endotracheal tube. This method correlates well with the results obtained from an esophageal catheter.21
An increased use of accessory ventilatory muscles, coupled with rapid, shallow breathing, also signals impending diaphragmatic fatigue. Accessory muscle use can be detected by palpating the neck and abdomen for muscle tensing. Fatiguing breathing patterns are characterized by the loss of synchronized outward inspiratory movements of both the rib cage and abdomen. Asynchrony occurs when the outward movement of the abdomen lags behind the movement of the rib cage during inspiration. Critically ill patients exhibiting asynchrony have an increased risk of ventilatory failure. A visual sign of overt diaphragmatic fatigue is abdominal paradox, in which the abdomen is sucked inward during inspiration as the rib cage expands outward; this is evidence that the rib cage muscles are predominantly being used.
Because rapid, shallow breathing invariably accompanies respiratory muscle fatigue, the frequency-to-VT (f/VT) ratio (sometimes called the rapid shallow breathing index [RSBI]) is widely used in the clinical setting to assess an individual’s ability to sustain adequate spontaneous ventilation. In a landmark study of patients weaned from mechanical ventilation, those with f/VT ratios greater than 100 (VT is expressed in liters and f in breaths/min) had a 95% likelihood of developing ventilatory failure, but patients with f/VT ratios less than 100 had an 80% probability of successfully sustaining spontaneous ventilation.26 The RSBI is an attractive noninvasive clinical tool for assessing WOB at the bedside because it is highly predictive of ventilatory failure, is easily measured, and does not require patient cooperation.
Energy Costs of Breathing
Oxygen consumed by the respiratory muscles reflects the energy costs of breathing. Oxygen consumed by the respiratory muscles alone can be assessed through a comparison of total oxygen consumption at rest with oxygen consumed at increased levels of ventilation. The oxygen cost of breathing in normal people ranges from 0.25 to 1.0 mL of oxygen consumed per liter of total ventilation; this is 1% to 2% of normal total body oxygen consumption.1 The efficiency of breathing is decreased in patients with COPD because respiratory muscles consume large amounts of oxygen for each liter of ventilation they produce.
The oxygen cost of ventilation is difficult to measure directly but may be indirectly estimated from WOB measures. However, WOB obtained from a P-V curve correlates poorly with oxygen consumed by ventilatory muscles because it does not take into account a patient effort that produces no volume change (no volume change means no work is performed, regardless of patient effort). A much more accurate indicator of oxygen consumption is TTdi, which takes into account the force of muscle contraction and the time over which it is applied. The energy cost, and thus oxygen consumption of skeletal muscle contraction, depends on the force developed, the duration of muscular contraction, and the velocity of muscle shortening. The P-V curve reflects the mechanical work performed but does not account for the intensity of muscle contraction.
Points to Remember
- • Both elastic and frictional forces resist ventilation; frictional forces exist only when air is flowing, whereas elastic forces are always present.
- • The lung’s recoil force is generated by elastic tissues and surface tension; of these two, surface tension is responsible for most of the recoil force.
- • Pulmonary surfactant reduces alveolar surface tension, which prevents regional alveolar collapse and reduces WOB.
- • Compliance and elastance are reciprocals of each other; low compliance implies high elastic recoil force, and high compliance implies low or weak elastic recoil force.
- • The balance point between the opposing recoil forces of the lungs and thorax determine the resting level of the lung–thorax system—the FRC; low lung compliance reduces FRC, whereas high compliance increases FRC.
- • Spontaneous and mechanical positive pressure breaths of equal volumes produce identical transpulmonary pressure gradients but completely different alveolar and pleural pressures.
- • In mechanical positive-pressure ventilation, plateau pressure is related to lung recoil force only, peak pressure is related to lung recoil force plus frictional airway resistance, and peak minus plateau pressure is related to frictional airways resistance only.
- • During inspiration, air preferentially goes to the high-compliance, low-resistance lung regions; during expiration, areas with the highest resistance and weakest recoil empty the slowest.
- • The body chooses breathing patterns that minimize frictional and elastic work; high airways resistance requires a slow breathing rate, and low compliance requires a rapid, shallow breathing rate.
- • Air trapping and auto-PEEP occur when expiratory time is too short for the lung to empty to the normal FRC level.
- • High airway resistance, weak lung recoil, and rapid breathing rate predispose the lung to the development of auto-PEEP.
- • At volumes less than 80% of TLC, maximal achievable expiratory flow rates are dictated by lung mechanics independent of muscular effort.
- • High airway resistance enhances premature small airway collapse and expiratory flow limitation during forceful exhalation.
- • Respiratory muscles may fatigue, and respiratory failure may occur if the muscles are abnormally weak or if WOB is too high.
- • The best clinical indices of respiratory muscle fatigue and energy expenditure take into account both the force generated and the time over which the force is applied.