chapter 98 Prostate Cancer Tumor Markers
The discovery and use of tumor markers have positively affected early detection, diagnosis, and staging for many malignancies. By improving early detection, tumor markers contribute to improved curative success rates. Optimal treatment and cure depend not only on accurate and early diagnosis but also on reliable follow-up for efficient detection of clinical recurrence. The identification of new markers and the development of sensitive tools to measure them will contribute to improved cure rates.
Among urologic malignancies, prostate cancer has greatly benefited from the discovery and application of tumor markers. Since its discovery in 1979 until clinical application in the late 1980s through 1990s, the prostate-specific antigen (PSA) has evolved into an invaluable tool for detecting, staging, and monitoring prostate cancer in men (Sensabaugh, 1978; Wang et al, 1979, 1981; Papsidero et al, 1980; Kuriyama et al, 1981). The widespread use of PSA screening has generated greater awareness about prostate cancer. During the PSA era, cancers identified when confined to the prostate have improved cure rates using either radical prostatectomy or radiation therapy. Whereas the majority of prostate cancers in the 1980s and early 1990s commonly arose through finding an abnormal digital rectal examination (DRE) or elevated PSA, or both, today most prostate cancer arises as clinically nonpalpable (stage T1c) disease with PSA levels between 2.5 and 10 ng/mL. The evolving demographics and natural history of prostate cancer have resulted in a stage migration to nonpalpable, clinically localized (stage T1c) disease and a parallel reduction in mortality (Pound et al, 1997, 1999; Stephenson et al, 1997; Polascik et al, 1999). However, these PSA-detected T1c cancers are not homogeneous. Although PSA screening has improved survival, outcomes are not the same for all T1c-detected disease because some of these cancers may not pose a threat to survival (Gretzer et al, 2002). Methods for improved detection of clinically significant prostate cancer are needed.
Despite routine application of PSA assays, limitations of specificity for this marker remain. Although PSA is widely accepted as a prostate cancer tumor marker, it is organ specific and not disease specific. Unfortunately, there is an overlap in the serum PSA levels among men with cancer and those with benign disease. Thus elevated serum PSA levels may reflect alterations within the prostate secondary to tissue architectural changes such as cancer, inflammation, or benign prostatic hyperplasia (BPH). Currently, serum PSA levels as low as 2.6 ng/mL are used as a threshold to perform transrectal ultrasound-guided biopsy. Although up to 30% of men presenting with an elevated PSA may be diagnosed following this invasive procedure, as many as 75% to 80% are not found to have cancer. In some instances the biopsy needle may fail to sample representative areas, thus failing to detect present cancer. To this end, application of PSA derivatives such as PSA density, PSA velocity, age-adjusted values, and, more recently, molecular derivatives have attempted to improve the performance of PSA (Christensson et al, 1990; Benson et al, 1992a, 1992b; Carter et al, 1992a, 1992b; Oesterling et al, 1993a, 1993b, 1993c; Riehmann et al, 1993; Seaman et al, 1993; Bazinet et al, 1994; Rommel et al, 1994; McCormack et al, 1995; Morgan et al, 1996; Lilja, 1997).
We are in a midst of a PSA biomarker crisis because the specificities of PSA and its derivatives require supplementation to improve specificity and to differentiate cancer from benign diseases of the prostate. Research into the biochemistry of PSA is yielding advances that have the potential to contribute to the detection and management of prostate cancer. New understanding of the molecular biology of carcinogenesis and prostate cancer is beginning to yield a new era in prostate cancer tumor research. Exploiting the knowledge of molecular oncology and application of novel techniques has provided innovative tools for the discovery of new biomarkers. Application of these promising diagnostic tests may be instrumental not only for detection but also to aid in discrimination between aggressive and indolent cancers. This chapter reviews our currently used markers in tissue, blood and urine, as well as the cellular-based components, and describes some promising markers that may evolve from the improved knowledge and methods used to evaluate genomic alterations, epigenetic modifications, and protein expression.
Tissue Biomarkers
Glutathione-S-Transferase Pi (GSTP1)
Changes in gene expression may occur as a result of alterations in DNA. Alterations known as epigenetic modifications include changes in DNA methylation and histone acetylation status. Segments within the gene promoter that are composed of GC-rich regions are termed CpG islands. Alterations in the methylation status of these regions may affect gene expression and have been shown to play a role in carcinogenesis (Jones and Baylin, 2002). Furthermore, cumulative effects of environmental exposures, such as diet and stress throughout life, may affect DNA methylation status and thus contribute to the risk of cancer development (Li et al, 2004). Assays for detection of CpG island hypermethylation include Southern blotting, restriction endonuclease PCR (RE-PCR), bisulfite genomic sequencing (BCR), and methylation-specific (MSP) PCR. Although each assay is sensitive, technical limitations exist. Currently, MSP PCR is most commonly employed for the detection of methylated CpG islands (Jones, 2002). The products of two hypermethylated genes that have been evaluated in prostate cancer development are glutathione-S-transferase P1 (GSTP1) and RAS association domain family protein isoform A (RASSF1A).
GSTP1 belongs to a family of detoxifying enzymes that are involved in metabolic reduction of electrophilic carcinogens. These enzymes are thought to be involved in the development of prostate cancer. Elevated levels of GSTP1 CpG hypermethylation have been detected in tissues from precancerous lesions (atypia and prostatic intraepithelial neoplasia [PIN]) and within ejaculates, urine, and plasma from men with prostate cancer (Nakayama et al, 2003). To date, many studies have evaluated these hypermethylated CpG islands as a prostate cancer tumor marker (Cairns et al, 2001; Goessl et al, 2001a, 2001b; Gonzalgo et al, 2003; Bastian et al, 2004). Cairns and coworkers (2001) have demonstrated the presence of elevated GSTP1 hypermethylation in up to 79% of prostate cancer specimens. Using urine specimens obtained after prostate massage, Goessl and colleagues (2001a, 2001b) found elevated levels of this marker in 68% of men with organ-confined disease, 78% of men with locally advanced or metastatic disease, 29% of men with PIN, and 2% of men with BPH.
Gonzalgo and coworkers (2003) demonstrated elevated GSTP1 hypermethylation in up to 50% of urine sediments taken from men immediately after transrectal prostate biopsy. Hypermethylation was also detected in 33% of men with negative biopsies and in up to 67% of men found to have PIN or atypia, suggesting that these patients may harbor occult prostate cancer and require more rigid follow-up with a low threshold for repeat biopsy. The use of MSP to measure GSTP1 hypermethylation in body fluids represents an emerging tool that is feasible and has demonstrated reproducible results, and it is likely to become a valued screening modality for prostate cancer detection.
In addition to GSTP1, hypermethylation of RASSF1A has been noted to occur in up to 70% of prostate cancers (Kuzmin et al, 2002; Liu et al, 2002). Early findings have noted an association of this marker with more aggressive tumors, and it may aid in distinguishing between these cancers and more indolent cancers. Although early, this work is promising, and the subject remains under investigation.
Many men continue to undergo biopsy procedures even though only 10% to 36% of men having an initial negative biopsy are found to have cancer on second biopsy (Djavan et al, 2000; O’Dowd et al, 2000; Lopez-Corona et al, 2003; Singh et al, 2004; Eggener et al, 2005), and cancer detection decreases with each subsequent negative biopsy (Keetch et al, 1994). Improved methods are needed to identify men who can forgo a repeat biopsy, particularly if the trigger for initial biopsy or the initial biopsy histology indicates high-risk features. Therefore emphasis on achieving a high negative predictive value (NPV) and low false-negative rate has been championed following many biomarker evaluations. In initial studies of prostate cancer, DNA methylation markers have exhibited high sensitivity and specificity (Maruyama et al, 2002; Yegnasubramanian et al, 2004), and improved upon the sensitivity of histology alone by 15% (Harden et al, 2003a). We therefore conducted this study to evaluate whether DNA methylation markers could improve upon the NPV of histology alone in men without cancer on initial biopsy but with a high index of suspicion for a missed cancer.
The first tissue methylation-biomarker to be discovered was glutathione-S-transferase π (GSTP1). Glutathione S-transferases (GSTs) are a family of detoxification enzymes that conjugate reactive substrates with reduced glutathione. The enzymes are dimers classified into four groups: α, µ, π, and θ (Hayes et al, 1995). Li and coworkers (2004) noted that the glutathione-S-transferase π (GSTP1) gene was unmethylated in all normal human tissues and BPH but was hypermethylated in all 20 prostate cancer (CaP) specimens analyzed. Eighty-eight of 91 CaP specimens did not stain for GSTP1 protein. Harden and coworkers (2003a, 2003b) used PCR to detect hypermethylated GSTP1 in prostate biopsy specimens. Twenty-nine (of 45 patients) were able to be evaluated using this method. GSTP1 methylation was detected in 11 of 15 (73% sensitivity) CaP cases and in none of 14 (100% specificity) benign controls. Quantitation of GSTP1 hypermethylation accurately detected CaP even in small, limited tissue samples. This would indicate that methylated GSTP1 represents a marker useful for CaP screening.
Bastian and coworkers (2005) used a restriction endonuclease, QMSP (RE-MSP), to detect abnormalities in the CpG islands found in serum GSTP1 DNA. No men with a negative biopsy had GSTP1 DNA detected in their sera, compared with 12% of men with clinically localized CaP and 28% with metastatic disease.
Gene Fusions
With the landmark discovery of the presence of gene fusions in prostate cancer by Chinnaiyan and colleagues (Tomlins et al, 2005), considerable work has been performed to determine if assays can be developed that can accurately detect prostate cancer or provide prognostic information. The TMPRSS2 and ETS transcription factor fusions have revealed novel biology about solid tumors with great potential implication (Tomlins et al, 2005). Because this discovery has such great potential, the concept has been to determine if we can detect these fusions in the urine of men with prostate cancer (Barry et al, 2007). A feasibility study that examined urine samples post-DRE, revealed that indeed the TMPRSS2-ERG fusion can indeed be found within the urine and has the potential to be an interesting marker (Laxman et al, 2008) with potential to aid in the detection of prostate cancer in men about to undergo a biopsy for the disease. In a larger follow-up study, investigators were able to determine that gene fusions are detectable in approximately 37% of the urine samples obtained from men with prostate cancer (Hessels et al, 2007). Using tissue samples, the presence of these gene fusions was observed in about half of the prostate cancer cases and was, in fact, observed in an even lower percentage of the more aggressive tumors (Perner et al, 2007; Mosquera et al, 2008). Several assays are being developed to detect these fusions in tissue and urine samples (Lu et al, 2008). Further delineation of the various splice variants that have been produced has the potential to add to the diagnostic utility of these fusions, indicating that the detection of a single fusion may not be sufficient (Hu et al, 2008). The clinical utility of the detection of a single gene fusion alone has been questioned recently with findings that the TMPRSS2-ERG fusion does not correlate with outcome in men undergoing prostatectomies (Gopalan et al, 2009). Moving toward the concept that single biomarkers will probably not answer the important clinical questions in prostate cancer alone, many investigators have begun to multiplex markers, resulting in additive value. Combining both the prostate cancer–3 (PCA-3) test, that will be described later in the chapter, together with the detection of these gene fusions in urine resulted in increasing sensitivity to 73%, although it was not possible to determine the specificity of the combined tests in these clinical populations. Overall, the current data related to the use of urine-based gene fusions seems to indicate that, at best, they may add slightly to PSA or even PCA-3 detection of prostate cancer and does not appear to have the ability to distinguish aggressive from nonaggressive disease.
Gene and Androgen Receptor Polymorphisms
As the genetic alterations associated with disease states are mapped, novel information is being revealed related to the potential of these differences to serve as biomarkers for prostate cancer. These findings have been specifically associated with more advanced prostate cancer. Using arrays that can specifically analyze single nucleotide polymorphisms (SNPs), investigators have begun to perform large-scale genomic comparisons of genetic alterations associated with prostate cancer. Much of the initial work has been done on individuals who have family histories of prostate cancer. In work performed through a collaborative effort that examined large numbers of individuals who are part of these hereditary study cohorts, investigators have revealed SNP patterns that impart a higher risk for developing prostate cancer. Because these are genomic differences, a simple blood draw or cheek swab can be used to make such a determination (Sun et al, 2008). Although the data are quite dramatic, the question has been raised about how these data should be handled clinically. For example, if an individual is found to have a fivefold increase in their risk for prostate cancer, what should be done? Should they be screened more carefully or more frequently? Should they simply undergo a prostate biopsy or treatment? Certainly this seems like an application where some type of preventive strategy might work. Unfortunately, we have little, if anything available that has been used to effectively prevent the disease.
In an attempt to discern genomic polymorphisms that may be predictive of castrate-resistant prostate cancer, Luo and colleagues (Hu et al, 2009) have examined the androgen receptor to determine if there may be gene variants that are predictive of the ability of the tumor to continue to grow in the absence of androgens. The hypothesis is that there are distinct forms of the androgen receptor that may be active in the absence of ligands. This may permit the cancer cells to continue to grow even in a castrate environment. They have recently revealed the presence of several unique forms of the androgen receptor. One form, variant 7, is shown to be increased in men with advanced prostate cancers (Hu et al, 2009). Using an antibody being constructed, the researchers are proposing to develop a blood test that can be used to identify individuals with castrate- resistant prostate cancer.
Blood and Urine Biomarkers
Prostate-Specific Membrane Antigen
The glycoprotein prostate-specific membrane antigen (PSMA) is a folate hydrolase and is found embedded within the cell membrane of all prostatic epithelial cells. The hydrophobic amino acids found on amino acid residues 20 to 43 suggest that this protein is a type II integral membrane protein with a small intracellular domain and a large extracellular domain (Israeli et al, 1997; Fair et al, 1997). The gene for PSMA has been cloned, fully sequenced, and localized to the short arm of chromosome 11 (11p11-p12). PSMA has been identified in the central nervous system, intestine, and prostate. In the brain, PSMA functions to metabolize the neurotransmitter N-acetyl-aspartyl-glutamate. In the intestine, PSMA has been localized to the proximal small bowel, where it works as a carboxypeptidase. Although isolated in these other tissues, PSMA is predominantly expressed in the prostate gland.
Of interest for diagnosis (Douglas et al, 1997), prognosis (Perner et al, 2007), and imaging (Wynant et al, 1991; reviewed by Abdel-Aziz et al, 2000) is the discovery of elevated expression of this protein in tissue from prostate cancer compared with normal prostate tissue (Silver et al, 1997; Chang et al, 1999a; Elgamal et al, 2000). More work has focused on use of PSMA in treatment strategies than for diagnostic tests (Elsässer-Beile et al, 2009). Multiple monoclonal antibodies have been designed to identify both the intracellular and extracellular domains of the PSMA protein; however, few have shown “diagnostic promise” immunohistochemically or as serum/urine assays (Horoszewicz et al, 1987; Douglas et al, 1997). However, PSMA mRNA expression among prostate cancers is highest in the hormone-deprived state (Henttu et al, 1992; Israeli et al, 1994). During cancer progression, differentially expressed variants of PSMA have been identified. Of three alternatively spliced variants of PSMA, one, known as PSM′, is differentially expressed in normal tissue, BPH, and prostate cancer. Su and colleagues (1995) demonstrated that the PSMA/PSM′ ratio is upregulated three- to sixfold in prostate cancer compared with BPH (0.76 to 1.6) and normal (0.075 to 0.45) tissue. Further reports to date have demonstrated the production of antibodies to PSMA. Horoszewicz and coworkers (1987) have found increased PSMA levels in 47% of prostate cancer patients (20 of 43) versus only 5% of noncancer patients (3 of 66) and negative results in 30 normal blood donors. Using the antibody produced by Horoszewicz and coworkers, Xiao and colleagues (2001) reported use of an immuno-SELDI (surface-enhanced laser desorption ionization) assay for PSMA. Applying the antibody to PSMA on a ProteinChip array, these authors were able to differentiate cases of prostate cancer from BPH. Perner and colleagues (2007) demonstrated marked differences, immunohistochemically, in the levels of PSMA in tissues from various prostate tumors that progressed after surgery (HR = 1.5, 95% CI = 1.1 to 2.8, P = .17) and suggested that PSMA might act independently as a prognostic biomarker of disease progression. The development of an accurate enzyme-linked immunosorbent assay (ELISA) for PSMA in serum/urine has potential significance for diagnostic and prognostic evaluation for prostate cancer. The clinical usefulness of PSMA for diagnosis, monitoring, and imaging continues to be promising and remains under investigation in many laboratories.
Human Kallikrein Gene Family
Another source of blood-based prostate cancer biomarkers has been identified among the protein products of the human kallikrein gene family (Fig. 98–1). Originally, only three genes of this family of genes were identified: the pancreatic/renal kallikrein (hKLK1), human kallikrein 2 (hKLK2), and PSA (hKLK3) genes (McCormack et al, 1995; Rittenhouse et al, 1998; Diamandis et al, 2000; Lilja, 1997). Since the identification of 12 other kallikrein genes, this family of proteases now consists of 15 members and is described with a distinct nomenclature (Diamandis et al, 2000; Yousef and Diamandis, 2001). Located on the long arm of chromosome 19 within the region spanning q13.2-q13.4, these genes share similar structural similarities. The serine proteases encoded by the three originally described genes have been identified as hK1 or hPRK (KLK1 gene), hK2 or hGK-1 (KLK2 gene), and hK3 or PSA (KLK3 gene). These serine proteases have similar amino acid sequences, with hK1 expressing 60% and hK2 expressing 78% homology with PSA (Schedlich et al, 1987; Clements, 1989). Both hK2 and hK3 are released in zymogen form from the prostatic epithelium and are found in seminal fluid as well as serum. Because they share structural homology, they can both form complexes with endogenous protease inhibitors such as α2-macroglobulin and α1-antichymotrypsin (ACT) (Young et al, 1995; Lilja, 1997; Rittenhouse et al, 1998). hK2 has been shown to regulate PSA activity by cleaving a leader amino acid sequence from PSA (proPSA), thus activating PSA (Kumar et al, 1997; Lovgren et al, 1997; Takayama et al, 1997). Although PSA is less expressed in prostate cancer tissue, hK2 levels have been shown to be elevated in poorly differentiated prostate cancer (Darson et al, 1997; Tremblay et al, 1997). Similar to PSA, hK2 has been shown to aid in the detection of prostate cancer (Kwiatkowski et al, 1998; Partin et al, 1999; Nam et al, 2000). It is likely that several other members of the kallikrein family of serine proteases will become useful tumor markers. Both hK6 and hK10 have been described as potential serum biomarkers for nonprostatic diseases, especially ovarian cancer (Luo et al, 2001; Yousef and Diamandis, 2001).
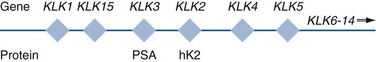
Figure 98–1 Human kallikrein gene map. Map of the human kallikrein locus and corresponding proteins as described by Yousef and Diamandis (2001).
Prostate-Specific Antigen (PSA or hK3)
The most notable marker in the kallikrein family is hK3, also known as PSA. It was first identified and purified in the late 1970s, but widespread use in clinical urology did not occur for another decade (Ablin et al, 1970; Sensabaugh, 1978; Wang, 1979; Papsidero, 1980; Kuriyama, 1980, 1981; Wang, 1981; Seamonds, 1986; Chan et al, 1987; Stamey et al, 1987; Oesterling et al, 1988). PSA is a 33-kD glycoprotein that acts as a serine protease. The ectopic expression of PSA has been reported in smaller concentrations in the tissue of malignant breast tumors (Yu et al, 1994a, 1994b, 1994c), normal breast tissue (Monne et al, 1994; Yu et al, 1995), breast milk (Yu and Diamandis, 1995), female serum (Yu et al, 1995), and adrenal and renal carcinomas (Levesque et al, 1995a); however, for practical and clinical purposes, PSA is organ specific, primarily produced by the prostatic luminal epithelial cells (Yu et al, 1995; Levesque et al, 1995b; Diamandis et al, 2000). Although it is organ specific, PSA is not cancer specific, as demonstrated by the substantial overlap in values between men with benign versus malignant prostate disease (Oesterling et al, 1988; Partin et al, 1990).
The function of this androgen-regulated protease is to liquefy semen through its action on the gel-forming proteins semenogelin and fibronectin within the semen following ejaculation (Lilja and Laurell, 1984; Lilja, 1985; Lilja et al, 1987; McGee and Herr, 1988; Christensson et al, 1990). PSA is normally found in low concentration in sera (ng/mL). Within sera, PSA circulates in both bound and unbound forms (Fig. 98–2). Most PSA in sera is bound or complexed to the antiproteases ACT and macroglobulin (MG) (Christensson et al, 1990; Lilja et al, 1991; Stenman et al, 1991). Binding of free PSA to ACT inactivates the protease, but the complex PSA-ACT remains immunodetectable by current assays (Partin et al, 2003). Binding of PSA to MG still allows some proteolytic activity but renders the PSA-MG complex undetectable by most current assays (Christensson et al, 1990). Free PSA without proteolytic activity is probably rendered inactive within the prostatic epithelial cell before release into the sera. This free inactive PSA does not form complexes with antiproteases, circulates unbound in sera, and is immunodetectable by current assays (Lilja et al, 1991). The primary release of PSA into the seminal fluid results in 106-fold higher seminal concentrations than levels measured within serum (Sensabaugh, 1978; Wang et al, 1981; Lilja and Abrahamsson, 1988; McCormack et al, 1995). The concentrations found in seminal plasma range from 0.5 to 5.0 mg/mL, whereas the normal serum concentration in men aged 50 to 80 years without prostate disease ranges between 1.0 and 4.0 ng/mL (Catalona et al, 1991).
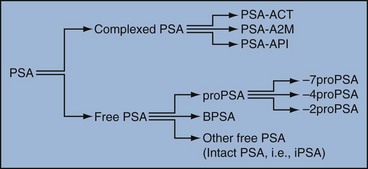
Figure 98–2 Molecular forms of prostate-specific antigen (PSA). Molecular derivatives of PSA include free PSA, such as proPSA (and the various clipped forms), BPSA (benign PSA), and other free PSA forms such as intact, inactivated PSA. Complexed PSA includes free PSA that is bound to proteases such as ACT (α1-antichymotrypsin), API (α1-protease inhibitor), and A2M (α2-macroglobulin).
Prostate cancer cells do not necessarily make more PSA than do normal prostate cells, and elevated serum levels are probably a result of cancer progression and destabilization of the prostate histologic architecture (Stamey et al, 1987). Studies have demonstrated that prostate cancer cells do not make more PSA but rather make less PSA than normal prostatic tissue (Meng et al, 2002). Evaluation of tissue from prostate cancer specimens has demonstrated up to 1.5-fold lower messenger RNA (mRNA) expression levels compared with normal prostate tissue (Meng et al, 2002).
PSA expression is strongly influenced by androgens (Young et al, 1991; Henttu et al, 1992). Immunohistochemical detection of PSA within the prostate is characterized by bimodal peaks between 0 and 6 months and after 10 years, correlating directly with testosterone levels (Goldfarb, 1986). Serum PSA becomes detectable at puberty with increases in luteinizing hormone and testosterone (Vieira et al, 1994). In the absence of prostate cancer, serum PSA levels vary with age, race, and prostate volume.
In men without BPH, the rate of change in PSA is 0.04 ng/mL per year (Carter et al, 1992b; Oesterling, 1993), compared with 0.07 to 0.27 ng/mL per year in men with BPH who are between the ages of 60 and 85 years (Carter et al, 1992b). Cross-sectional data suggest that PSA increases 4% per milliliter of prostate volume and that 30% and 5% of the variance in PSA can be accounted for by prostate volume and age, respectively (Oesterling et al, 1993a). Blacks without prostate cancer have higher PSA values than whites (Morgan et al, 1996; Fowler et al, 1999). Fowler and colleagues (1999) have demonstrated that, on a volume/volume basis, the benign prostatic tissue of black men contributes more PSA to sera than does the benign prostatic tissue of white men, a difference that increases with age.
Elevated serum PSA levels are probably a product of disruption of cellular architecture within the prostate gland (Stamey et al, 1987). The loss of the barrier afforded by the basal layer and basement membranes within the normal gland is a likely site for the egress of PSA into the circulation. This can occur in the setting of prostate disease (BPH, prostatitis, prostate cancer) and with prostate manipulation (prostate massage, prostate biopsy) (Stamey et al, 1987). Prostatic inflammation (acute and chronic) and urinary retention can cause PSA elevations to variable degrees (Armitage et al, 1988; Dalton, 1989; Nadler et al, 1995). PSA elevations may not be related to the histologic finding of inflammation in men without clinical prostatitis (Morote et al, 2000). Prostatic trauma, such as occurs after prostatic biopsy, can result in a leak of PSA into the circulation that may require more than 4 weeks for return to baseline values (Yuan et al, 1992). DRE as performed in an outpatient setting can lead to increases in serum PSA (Thompson and Zeidman, 1992). However, the change in PSA after DRE does not appear to be clinically significant, because the change is within the error of the assay and rarely causes false-positive tests (Chybowski et al, 1992; Crawford et al, 1992; Thompson and Zeidman, 1992).
Studies of the effect of ejaculation on serum PSA have shown both no significant change in PSA (Kirkali et al, 1995) and a significant decrease in serum PSA (Simak et al, 1993; Heidenreich et al, 1997) in men 30 to 40 years old or younger. However, in the age group in which PSA testing is primarily used for early detection of prostate cancer (50 years and older), ejaculation can lead to an increase in PSA that can result in a false-positive elevation (Tchetgen et al, 1996; Herschman et al, 1997). After 48 hours, this fractional increase in PSA would be expected to return to baseline levels in most men (Tchetgen et al, 1996). A history of sexual activity and a repeated PSA test after 48 hours of sexual abstinence may be helpful in the interpretation of serum PSA levels that are minimally elevated.
The presence of prostate disease (prostate cancer, BPH, and prostatitis) is the most important factor affecting serum levels of PSA (Wang et al, 1981; Ercole et al, 1987; Robles et al, 1988). PSA elevations may indicate the presence of prostate disease, but not all men with prostate disease have elevated PSA levels. Furthermore, PSA elevations are not always specific for prostate cancer.
Prostate-directed treatment (for both BPH and cancer) can lower serum PSA by decreasing the volume of prostatic epithelium available for PSA production and by decreasing the amount of PSA produced per cell. Manipulation of the hormonal environment for treatment of cancer and BPH with orchiectomy, luteinizing hormone–releasing hormone analogs, and 5α-reductase inhibition; radiotherapy; and surgery for BPH or cancer can all lead to reductions in serum PSA (Henttu and Vihko, 1992). Finasteride (5 mg) and other 5α-reductase inhibitors (dutasteride) for treatment of BPH have been shown to lower PSA levels by an average of 50% after 6 months of treatment (Guess, 1993). Thus one can multiply the PSA level by two to obtain the “expected” PSA level of a patient who has been taking a 5α-reductase inhibitor—for 6 months or more. Men who are to be treated with a 5α-reductase inhibitor should have a baseline PSA measurement before initiation of treatment and should be observed with serial PSA measurements, because this drug may decrease PSA serum levels by up to 50%. If PSA does not decrease by 50% or if there is a rise in PSA when the patient is taking a 5α-reductase inhibitor, the patient should be suspected of having occult prostate cancer and undergo further testing. Finasteride (1 mg), also marketed for the treatment of male baldness, may also lower PSA levels to a lesser extent than the 5-mg dosage. Other over-the-counter medications and neutraceutical use should always be documented. Although saw palmetto has not been shown to affect PSA levels, these unregulated supplements may contain compounds that can alter PSA levels (e.g., PC-SPES, now off the market). Interpretation of PSA values should always take into account the presence of prostate disease, previous diagnostic procedures, and prostate-directed treatments.
Molecular Derivatives of Prostate-Specific Antigen
One of the most exciting and clinically useful discoveries since the introduction of PSA testing has been the demonstration of different molecular forms of PSA in serum (Christensson and Lilja, 1994; Christensson et al, 1990, 1993; Lilja et al, 1991; Stenman et al, 1991; McCormack et al, 1995; Lilja et al, 1997; Polascik et al, 1999). Measurable PSA found circulating in the blood exists either complexed (bound, cPSA) to proteins or as a free (unbound) form (fPSA) (see Fig. 98–2). Three proteins that are known to bind to PSA in the blood are ACT, α2-macroglobulin (A2M), and α1-protease inhibitor (API) (Christensson et al, 1990, 1993, 1994; Lilja et al, 1991; McCormack et al, 1995; Tewari et al, 1996; Lilja, 1997). Figure 98–3 illustrates the molecular model of PSA and its epitope sites. The majority of PSA that enters the serum is bound (70%) to these proteins. When bound to A2M, all PSA epitope sites become masked, making this complex difficult to measure (Fig. 98–4). Of the complexed PSA derivatives found in serum, PSA bound to ACT (PSA-ACT) is immunoreactive and found in the greatest concentration. Although representing a lower proportion of total PSA in the blood, fPSA is also immunoreactive and therefore measurable. Development of new monoclonal antibodies specific for fPSA and cPSA has allowed more accurate measurement of the different molecular forms of PSA and their ratios in serum (Table 98–1) (Lilja et al, 1991; Stenman et al, 1991).
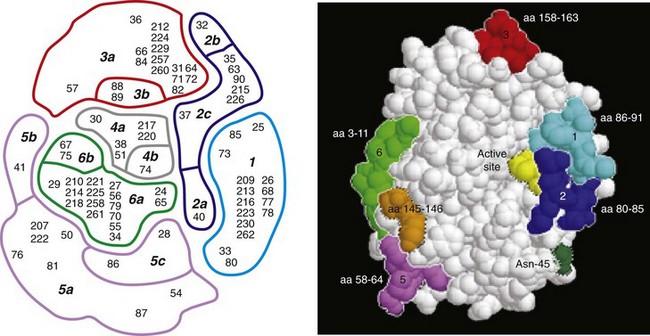
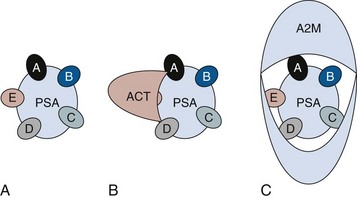
Figure 98–4 Prostate-specific antigen (PSA)–binding proteases. A, Free PSA with A to E representing immunoreactive epitopes of free PSA. B, α1-Antichymotrypsin (ACT) blocks the E epitope during binding. C, α2-Macroglobulin (A2M) blocks all immunoreactive sites on PSA, making this derivative difficult to measure in serum.
Table 98–1 Molecular Derivatives of Prostate-Specific Antigen
| PSA TYPE | % IN SERUM |
|---|---|
| Complexed PSA | 60-95 |
| PSA-ACT | 60-90 |
| PSA-API | 1-5 |
| PSA-A2M | 10-20 |
| Free PSA | 5-40 |
ACT, α1-antichymotrypsin; API, α1-protease inhibitor; A2M, α2-macroglobulin; PSA, prostate-specific antigen.
Free PSA and the Percent Free PSA
Although the majority of serum PSA is found complexed to the proteases (most to ACT), 5% to 35% of PSA exists as fPSA (McCormack et al, 1995; Tewari et al, 1996; Woodrum et al, 1998). Although prostate cancer cells do not produce more PSA than benign prostate epithelium, the PSA produced from malignant cells appears to escape proteolytic processing. Thus men with prostate cancer have a greater fraction of serum PSA complexed to ACT and a lower percentage of total PSA that is free compared with men without prostate cancer (Christensson et al, 1993; Leinonen et al, 1993; Lilja, 1993; Stenman et al, 1994; Catalona et al, 1997). Using this important observation led to the measurement of the percentage of the ratio of free to total PSA (%fPSA) and has since provided an additional degree of specificity for prostate cancer detection (Catalona et al, 1998; Partin et al, 1998). The difference in the ratio of free to total PSA (percentage of free PSA or %fPSA) is greatest when comparing men without prostate cancer who have prostate enlargement (BPH) with those with prostate cancer and no prostate enlargement. This difference may be due to differential expression of PSA isoforms by transition zone (zone of origin of BPH) tissue compared with peripheral zone (zone of most prostate cancer) tissue (Chen et al, 1997; Mikolajczyk et al, 2000). The role for %fPSA is more applicable to PSA levels less than 10 ng/mL, because the positive predictive rate of total PSA above 10 to 20 ng/mL has been demonstrated to be as high as 80%. Currently, %fPSA is approved by the Food and Drug Administration (FDA) for use to aid PSA testing in men with benign DRE and minimal PSA elevations, within the diagnostic gray zone of 4 to 10 ng/mL. If PSA levels are less than 4.0 ng/mL, more recent data have demonstrated the utility of %fPSA when deciding whether a patient requires an initial or repeat biopsy.
Christensson and coworkers (1993) measured free and total PSA fractions in men with and without prostate cancer and found that a free/total PSA cutoff of 0.18 (18% free/total PSA) significantly improved the ability to distinguish between subjects with and without cancer compared with use of total PSA alone. Other %fPSA cutoff values have also been identified to improve risk stratification. Catalona and colleagues (1995) have found that %fPSA provided independent predictive information regarding the presence or absence of cancer above that provided by other clinical indices, including age, total PSA, DRE results, and prostate size. As many as 20% to 65% of unnecessary biopsies may be avoided when using %fPSA cutoff values ranging between 14% and 28%, while maintaining sensitivity rates from 70% to 95% within the tPSA range of 4 to 10 ng/mL (Catalona et al, 1998; Partin et al, 1998; Veltri and Miller, 1999; Vessella et al, 2000; Stephan et al, 2002). In a prospective, multi-institutional study of men 50 to 75 years old with PSA levels between 4 and 10 ng/mL and palpably benign prostate glands, a %fPSA cutoff of 25% (biopsy less than 25%) detected 95% of cancers while avoiding 20% of unnecessary biopsies (Catalona et al, 1998). These data confirm that the application of %fPSA can help counsel men with PSA elevation between 4 and 10 ng/mL regarding their risk of cancer and the need for further evaluation to rule out the disease (Fig. 98–5).
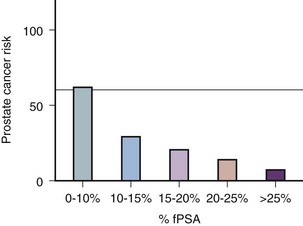
Figure 98–5 Prostate cancer risk stratification for men with prostate-specific antigen (PSA) values between 4 and 10 ng/mL (the diagnostic gray zone) based on percent free PSA (%fPSA).
(From Catalona WJ, Partin AW, Slawin KM. Percentage of free PSA in black versus white men for detection and staging of prostate cancer: a prospective multicenter clinical trial. Urology 2000;55:372–6.)
A number of other studies have demonstrated the usefulness of %fPSA in prostate cancer detection (for reviews see Polascik et al, 1999; Karazanashvili et al, 2003). Increased use of PSA as a screening tool has led to increased interest in the evaluation of PSA levels below 4.0 ng/mL. Examination of cancers detected within the PSA range 2.5 to 4.0 ng/mL has shown numbers of cancers similar to those detected in the 4 to 10 ng/mL range and also that these cancers are clinically significant and may exhibit aggressive pathologic potential (Colberg et al, 1993; Smith et al, 1998; Schroder et al, 2000; Recker et al, 2001). Djavan and colleagues (1999) demonstrated that for men with PSA levels less than 4 ng/mL, a %fPSA cutoff value of 27% could detect up to 90% of cancers while preventing 18% of unnecessary biopsies. Furthermore, comparison against PSA derivatives, such as prostate-specific antigen density (PSAD), PSA velocity, and transition zone density favored %fPSA. Haese and coworkers (1997) demonstrated that %fPSA in the total PSA (tPSA) range of 2 to 4.0 ng/mL does not substantially increase the number of biopsies needed to detect clinically significant prostate cancer compared with that in the 4 to 10 ng/mL range. In this study, a %fPSA cutoff value of 18% to 20% detected almost half of cancers while sparing 73% of men from undergoing biopsy, with a biopsy-to-cancer ratio of 3 : 1 to 4 : 1.
One study has demonstrated that a %fPSA cutoff of 25% would lead to detection of 95% of prostate cancers in both white and black men (Catalona et al, 2000), suggesting that race may not be important when using %fPSA in cancer detection. Free PSA and total PSA both decrease in men receiving finasteride. As both decline, the percentage of fPSA is not altered significantly by this medication (Keetch et al, 1997; Pannek et al, 1998).
In addition to contributing to detection, %fPSA has been shown to provide prognostic information. Serial measurement of %fPSA within archival serum demonstrated early marked and sustained differences in aggressive and nonaggressive prostate cancers (Carter et al, 1997). This group identified a statistically significant difference in %fPSA in men with and without metastatic disease up to 10 years prior to the development of prostate cancer. For the same cohort of men, total PSA levels failed to differentiate aggressive from nonaggressive prostate cancer 10 years prior to diagnosis. This study suggests that the longitudinal measurement of %fPSA changes may aid in detection and contribute information regarding disease behavior, thus providing useful information for therapeutic decision making.
Despite these encouraging results, several important factors should be kept in mind with regard to interpretation of %fPSA in clinical practice for cancer detection (Meyer et al, 1997). Such factors include prostatic manipulation, specimen handling, and assay variation (Partin et al, 1996a, 1996b; Stephan et al, 1997; Roth et al, 1998; Woodrum et al, 1998). Prostatic manipulation and urethral instrumentation have been shown to affect the interpretation of the ratio of fPSA to total PSA. Although there may be marginal changes in total PSA, fPSA levels may fluctuate, affecting the %fPSA calculation. Furthermore, because fPSA is cleared more rapidly from serum than complexed PSA forms (i.e., total PSA), the resulting calculated %fPSA is directly affected. Thus it is recommended that PSA determinations be avoided for several weeks following prostatic manipulation (surgery, biopsy, cystoscopy) (Partin et al, 1996b; Lein et al, 1997; Bjork et al, 1998).
Prostate volume has also been shown to influence the serum ratio of free to total PSA (Catalona et al, 1995; Partin et al, 1996; Haese et al, 1997; Stephan et al, 1997; Woodrum et al, 1998). The cutoff for %fPSA that optimizes sensitivity and specificity for cancer detection depends on prostate size because overlap in %fPSA is greatest among men without cancer who have enlarged prostates and men with cancer in the setting of prostate enlargement (Catalona et al, 1995). This group demonstrated that using a %fPSA cut point of 23% in men with PSA levels between 4 and 10 ng/mL and a prostate volume of less than 40 cm3 could yield 90% sensitivity. However, for men with larger prostates, the %fPSA cut point dropped to 14% in order to maintain this degree of sensitivity.
The recommended and FDA-approved use for %fPSA remains for men with PSA levels within the diagnostic gray zone of 4 to 10 ng/mL. However, many clinicians use this ratio to aid in the decision making process regarding repeat biopsy (Stephan et al, 1997; Hayek et al, 1999; Djavan et al, 2000). For an initial biopsy, %fPSA ranges of 18% to 25% are commonly suggested; however, a widely accepted cutoff value has yet to be determined. For a repeat biopsy, Stephan and colleagues (1997) reported a 5% cancer miss rate when using a %fPSA value of 21% to trigger rebiopsy. A study by Hayek and coworkers (1999) illustrated a 16% positive rebiopsy rate regardless of %fPSA and concluded that this derivative was unable to provide further risk stratification for men in their population. Djavan and colleagues concluded that %fPSA is an accurate predictor of prostate cancer at rebiopsy. This group identified a %fPSA of 30% as the most accurate predictor of cancer in repeat biopsy specimens. However, until more series mature, the aggressiveness of this application in screening and follow-up biopsies should be tailored on a case-by-case basis (Luderer et al, 1995; Catalona, 1996; Partin et al, 1996b; Stephan et al, 1997; Catalona et al, 1998; Hayek et al, 1999; Djavan et al, 2000).
Classification of free PSA isoforms can be done by assessing the presence or absence of internal cleavages, in which case the respective “forms” are termed “nicked” or “intact.” PSA originates with a 17–amino acid chain that is cleaved to yield a precursor inactive form of PSA termed proPSA (pPSA) (Zhang et al, 1995; Kumar et al, 1997, 2000; Mikolajczyk et al, 1997, 2001, 2002; Peter et al, 2001). As depicted in Figure 98–6, the precursor form of PSA contains a 7–amino acid proleader peptide, in addition to the 237 constituent amino acids of mature PSA, and is termed [–7]pPSA. Once released, the proleader amino acid chain is cleaved at the amino terminus by hK2, converting pPSA to its active 33-kD PSA form. In addition to hK2, pPSA may be activated to PSA by other prostate kallikreins, including hK4 (Takayama et al, 1997). Incomplete removal of the 7–amino acid leader chain has led to the identification of various other truncated or clipped forms of pPSA. These include pPSAs with 2, 4, and 5 leader amino acids ([–2]pPSA, [–4]pPSA, and [–5]pPSA) (Zhang et al, 1995; Kumar et al, 1997, 2000; Mikolajczyk et al, 1997, 2001, 2002; Peter et al, 2001). With cellular disruption, these inactive forms circulate as free PSA and may constitute the majority of the circulating free PSA in patients with prostate cancer (Mikolajczyk et al, 1997) (Fig. 98–7).
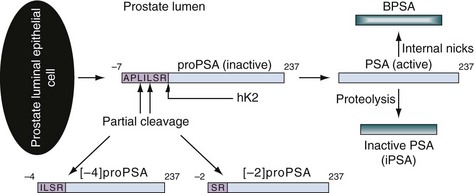
Figure 98–6 Differential cleavage and activation of pro–prostate-specific antigen (PSA). ProPSA is released from the prostate epithelial cell with a 7–amino acid leader sequence. hK2 cleaves the amino acid leader to activate PSA. Active PSA undergoes proteolysis to yield inactive PSA (iPSA) and may also undergo internal degradation to form benign PSA (BPSA). Partial cleavage of the 7–amino acid leader sequence yields inactive forms of proPSA (i.e., [–2]pPSA or [–4]pPSA).
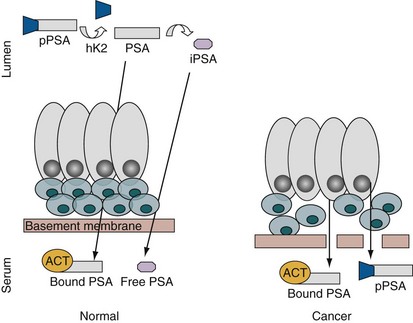
Figure 98–7 Prostate-specific antigen (PSA) synthesis in normal versus cancer tissue. ProPSA is secreted into the lumen, where the 7–amino acid leader sequence is cleaved by hK2 to yield active PSA. Some of the active PSA diffuses into the serum, where it is bound to proteases such as α1-antichymotrypsin (ACT). The luminal active PSA undergoes proteolysis, and the resulting inactive PSA (iPSA) may also enter the circulation to circulate in the unbound or free state. In prostate cancer, loss of the tissue architecture may permit a relative increase in bound PSA and proPSA in serum.
Reports by Mikolajczyk and colleagues (2000, 2001) have revealed significantly elevated levels of these truncated forms of pPSA in prostate cancer tissue. Incomplete cleavage and processing of pPSA may contribute to the relative increase of these PSA isoforms identified in prostate cancer tissue. One of these clipped forms that is cleaved between leucine 5 and serine 6 of the propeptide has been termed [–2]pPSA. The decreased PSA processing in prostate cancer may result in a relative increase in pPSA and its cleaved forms, in particular [–2]pPSA. Immunohistochemical studies by Mikolajczyk and colleagues (2001) have demonstrated increased binding of monoclonal antibodies recognizing [–2]pPSA in prostate cancer tissue. Measuring the ratio of this clipped form of PSA to total PSA may serve as a strong discriminator between men with and without prostate cancer. These truncated forms in serum are being studied as potential prostate cancer markers.
From a clinical point of view, the present literature associates some isoforms with malignant prosate cells ([–2]proPSA) and others with BPH (BPSA) (Canto et al, 2004; Slawin et al, 2005). Two studies (Khan et al, 2003; Sokoll et al, 2003) support these findings regarding cancer detection and cancer “aggressiveness,” demonstrating a positive diagnostic impact of pPSA in the early detection of prostate cancer in men with total PSA levels between 2.5 and 4 ng/mL and between 4 and 10 ng/mL. In the study by Sokoll and colleagues (2003), %pPSA detected up to 75% of cancers and avoided 59% of unnecessary biopsies (compared with 33% when %fPSA was applied) in men presenting with PSA levels between 2.5 and 4 ng/mL. In addition, studies by Catalona and colleagues (2003, 2004) showed an improved prostate cancer detection rate among men with total PSA between 2 and 4 ng/mL, where the ratio of proPSA ([–2]proPSA) to fPSA (%proPSA) spared nearly 20% of unnecessary biopsies while %fPSA only spared 10%. They also demonstrated—for PSA between 4 and 10 ng/mL—a 90% sensitivity and 31% specificity with %proPSA compared to only 20% (specificity) with %fPSA. Recently, in a multicenter validation effort sponsored by the National Cancer Institute (NCI) Early Detection Research Network (EDRN), Sokoll and colleagues (2008b) demonstrated excellent receiver operator characteristic (ROC) curves for the %[–2]proPSA assay for the diagnosis of prostate cancer. Likewise, a single institution study (Bangma et al, 2004) and a large multicenter study (Lein et al, 2005) showed no improvement in diagnostic accuracy when comparing [–5, –7]proPSA and the corresponding ratios with tPSA or f/tPSA. Further studies using other proPSA forms or tumor-associated proteins should be done.
Another isoform of fPSA, referred to as benign PSA or BPSA, represents a cleaved form of PSA that has been identified in tissue from the nodular BPH transition zone tissue (Chen et al, 1997; Mikolajczyk et al, 2000; Wang et al, 2000; Canto et al, 2004; Slawin et al, 2005). In a study by Marks and colleagues (2001), BPSA discriminated men with symptomatic BPH from men without BPH. Although serum BPSA alone is unlikely to differentiate between hyperplasia and cancer, in combination with assays for pPSA, it may allow additional discrimination.
In addition to BPSA and pPSA, other isoforms of PSA have been identified in serum and have demonstrated promise as additional tools to aid in clinical detection of prostate cancer (Mikolajczyk et al, 2001, 2002; Peter et al, 2001). An additional form of pPSA that is found intact and inactive and that does not form a complex with ACT has been identified. This form of pPSA has been termed intact PSA and has been identified in human prostate cancer cells (Nurmikko et al, 2000, 2001; Steuber et al, 2002). It is likely that pPSA exists in various forms in tissue and serum from men with and without prostate cancer. Preliminary studies have demonstrated that the ratio of intact to free PSA may improve the accuracy of prostate cancer detection (Nurmikko et al, 2000, 2001; Steuber et al, 2002). Although encouraging, these studies using subfractions of fPSA await further scrutiny.
Human Kallikrein 2 (hK2)
The human kallikrein hK2 has been found to share many important properties with PSA and has demonstrated potential as another prostate cancer tumor marker (Young et al, 1992; Darson et al, 1997; Kumar et al, 1997; Rittenhouse et al, 1998; Lovgren et al, 1999; Becker et al, 2000; Yousef et al, 2001a). Among many similarities, hK2 and PSA share 80% amino acid homology (see Fig. 98–1), exhibit similar specificity for prostate tissue, and are both hormonally regulated by androgens. The exact function of hK2 remains under further study, but this protease has been shown to perform enzymatic activities, one of which is to activate the zymogen (pPSA) to the active PSA through cleavage of the amino acid presequence (see Fig. 98–7) (Young et al, 1992; Kumar et al, 1997; Yousef et al, 2001a).
The concentration of hK2 in samples of prostatic tissue, seminal fluid, and serum is many times lower than that of PSA (Young et al, 1992; Darson et al, 1997; Lovgren et al, 1999). In prostatic tissue, the hK2 mRNA concentration represents only 10% to 50% of PSA mRNA concentrations, and in semen and serum samples, the concentration of hK2 is 1% to 3% that of PSA (Young et al, 1992; Darson et al, 1997; Lovgren et al, 1999). Together with specificity issues, cross-reactivity with PSA and the detection limits of the available assays for these low hK2 concentrations challenged earlier analytic experiments. However, the development of hK2 purification techniques and more specific monoclonal antibodies has resulted in more reliable assays and thus increased study in the clinical setting (Piironen et al, 1996; Finlay et al, 1998; Klee et al, 1999; Becker et al, 2000).
Immunohistochemical studies revealed different tissue expression patterns for hK2 and PSA. In benign epithelium, PSA is intensely expressed compared with the minimal immunoreactivity of hK2 (Tremblay et al, 1997; Darson et al, 1999). In contrast, in cancerous tissue hK2 is expressed more intensely. Furthermore, hK2 immunohistochemically stains the different Gleason grades of prostate cancer differently than does PSA. This inverse staining relationship of hK2 is seen as intense staining in high-grade (Gleason primary grade 4 or 5) cancers and lymph node metastasis compared with minimal staining in low-grade (Gleason primary grade 1 to 3) cancers and even weaker association in benign tissue, in which PSA exhibits intense staining (Darson et al, 1997, 1999; Tremblay et al, 1997; Kwiatkowski et al, 1998).
The development of improved monoclonal antibodies for hK2 has minimized the previous cross-reactivity with PSA and permitted more accurate measurement of hK2 in serum samples (Finlay et al, 1998; Klee et al, 1999; Becker et al, 2000). Since the introduction of these assays, many researchers have demonstrated elevated levels of hK2 in men with prostate cancer compared with men without cancer (Becker, 2000). Furthermore, men with low-grade disease have lower concentrations of serum hK2 than men with more aggressive cancer (Darson et al, 1999; Becker et al, 2000). Application of the ratio of hK2 to free PSA (hK2/fPSA) allows discrimination between benign tissue and cancer (Kwiatkowski et al, 1998). For men with tPSA in the 4 to 10 ng/mL range, hK2/fPSA significantly differentiated prostate cancer from BPH, whereas hK2/tPSA did not (Becker et al, 2000). Data from a multicenter study demonstrated a statistically significant difference between men with biopsies positive for cancer, looking at hK2 alone and in combination with fPSA/tPSA (Kwiatkowski et al, 1998). Combining %fPSA and hK2/fPSA, Partin and associates (1999) demonstrated an increased cancer detection rate within the tPSA range of 2 to 10 ng/mL. Furthermore, this group was able to identify up to 40% of men with cancer in the 2 to 4 ng/mL range measuring hK2/fPSA.
Additional reports have demonstrated the ability of hK2 levels to predict pathologic outcome and to aid in repeat prostate biopsy decision making (Haese et al, 2000, 2003; Nam et al, 2001). Haese and colleagues (2000, 2003) evaluated the ability of hK2 levels to distinguish between pathologic organ-confined and non–organ-confined prostate cancer. In univariate ROC and multivariate logistic regression analyses, hK2 optimally predicted organ-confined disease. Nam and coworkers (2001) showed that men found to have cancer upon repeat biopsy had higher hK2 and hK2/fPSA levels than men with a negative biopsy, suggesting that hK2 may be helpful in improving the selection criteria for repeat biopsy. Recently, Vickers and coworkers (2008) used a large cohort of men to combine, within a multivariable model, hK2 with PSA and its isoforms to better predict prostate cancer detection. Although these results are encouraging, further evaluation is under way before recommending widespread application of hK2 to the clinical armamentarium of prostate cancer tumor markers.
Additional Kallikrein Tumor Markers
In addition to PSA (hK3) and hK2, 15 other kallikrein genes have been identified (reviewed in Paliouras et al, 2007). The expression products of these genes have demonstrated diagnostic potential as prostate cancer tumor markers. Many of these proteases have a highly conserved structural organization and have been shown to contribute to biologic events such as angiogenesis and growth factor release (Diamandis and Yousef, 2001). Study of these proteins suggests interaction among the kallikreins in pathways that affect normal physiologic and pathologic processes (Yousef and Diamandis, 2002). Among these genes, the studies have evaluated some of the potential of the expression products of KLK4, KLK11, KLK14, and KLK15 as biomarkers for prostate cancer.
KLK4
The gene KLK4 encodes hK4 and is predominantly expressed in basal cells of the normal prostate (Xi, 2004). Although its function and structure continue to be evaluated, current studies suggest that this peptide is not targeted for secretion and is predominantly localized to the nucleus (Xi et al, 2004). It was originally demonstrated to be unique to prostatic expression, but improved reverse transcription polymerase chain reaction (PCR) techniques have identified KLK4 mRNA expression in the testis, adrenal, uterus, and thyroid (Nelson et al, 1999). Although hK4 expression has been shown to occur in both normal and cancerous prostate tissue, KLK4 mRNA was found to be expressed at higher levels in the majority of prostate cancer tissues compared with matched normal prostate tissues (Obiezu et al, 2002; Xi et al, 2004) and may represent a proliferative factor (Klokk et al, 2007). In ovarian cancer, hK4 is associated with advanced disease. Further evaluation is under way to explore the value of this kallikrein as a biomarker for prostate cancer.
KLK11
The gene KLK11 encodes hK11, formally referred to as hippostasin or PRSS20 (Diamandis et al, 2002). It was initially found in the serum of cancer patients, but further studies have demonstrated that this protease may aid in differentiating prostate cancer patients from those with BPH, because immunofluorometric assays have displayed lower hK11 values in prostate cancer patients compared with men with BPH (Nakamura et al, 2003a, 2003b). Applying the ratio of hK11 to total PSA resulted in a further reduction in unnecessary biopsies. Nakamura and colleagues (2003a, 2003b) have demonstrated that at 90% sensitivity, the ratio of hK11 to total PSA has a specificity of 51.5%. Confirmatory studies are under way for this promising biomarker.
KLK14
Yousef and coworkers (2001b) have identified KLK14 of the kallikrein gene family. Expression of this gene has been demonstrated in brain, spinal cord, prostate, thyroid, and testis. The expression of hK14 is similar to that of hK2 and PSA and has been noted in the secretory epithelial cells of the prostate (Hooper et al, 2001). Rabien and colleagues (2008) demonstrated the association of KLK14 levels with biochemical progression after radical prostatectomy among men with prostate cancer. Elevated levels of this protein have been demonstrated in prostate cancer tissues compared with normal prostate tissues. Although it is still early in development, this marker may aid in prognosis because this protease appears to correlate with aggressiveness of disease (Yousef et al, 2003; Rabien et al, 2008).
KLK15
The gene KLK15 encodes hK15. Although it is most notably expressed in the thyroid, lower levels of hK15 expression have also been measured from the prostate, salivary gland, adrenal, colon, testis, and kidney (Yousef et al, 2001). Using a human prostate cancer cell line, KLK15 expression was found to be upregulated compared with normal prostate tissues (Yousef et al, 2001c). As with hK14, hK15 has shown an association with tumor aggressiveness and has potential as a diagnostic and prognostic prostate cancer biomarker (Stephan et al, 2003).
Proteomic Patterns
A number of years ago, the “holy grail” of cancer biomarkers was to develop protein signatures of the disease. The goal was to discern proteomic patterns that could serve as fingerprints that would not only identify the presence of cancers but also subclassify patients into groups that may have different prognoses or potential responses to therapy. Application of sensitive tools in the study of molecular biology is becoming essential for the discovery of novel tumor markers. Identifying unique genetic expression in cancer states compared with normal tissues will provide not only insight into the molecular etiology of disease but also novel methods for detection. In addition to identifying genes that are either on or off, identification of post-translational events that are unique to disease states will undoubtedly become invaluable in the discovery of cancer biomarkers. The identification of biomarkers from human serum and body fluids has been assessed by a variety of proteomic technologies. Much of the approach to develop such fingerprints came from the use of mass spectrometric (MS) analysis of blood and/or urine samples. The early MS studies used large machines with relatively low throughput. To increase the ability of this approach to analyze larger numbers of samples more rapidly, an approach known as surface-enhanced laser desorption ionization (SELDI) was developed. A large number of these instruments were placed in centers around the world. SELDI separates relatively small fragments of proteins (peptides) and uses these patterns to distinguish patients with cancer from those with benign diseases (Malik et al, 2007). Although in principle this approach is sound, it suffers from several significant drawbacks. These include the lack of ability to define the individual protein components and therefore the inability to produce more typical antibody-based tests. Also, while operating at single institutions, the instruments performed in a reasonably reproducible fashion, but the design of the instruments was such that no two instruments performed with sufficiently high levels of concordance. After extensive investigation, it was concluded that SELDI-based approaches to analyzing serum samples are not a reliable tool with which to diagnose prostate cancer, at least at this time (McLerran et al, 2008).
In order to address these limitations, MS approaches have been developed that reveal the identities of the components. Prior to applying these approaches, a significant amount of attention has been spent on standardizing protocols by which tissue, blood, and urine samples have been collected. The apparently subtle differences in collection techniques have been shown to result in somewhat major and therefore confounding differences in proteomic patterns (Diaz et al, 2008). Much progress has been made toward this end, and the more recent findings have demonstrated the ability of MS approaches to distinguish diseased and normal populations. These include the use of two-dimensional difference gel electrophoresis (2D-DIGE) as a means to identify serum markers for the differentiation of more aggressive prostate cancer (Byrne et al, 2009). Similar studies have been performed with urine samples to develop a “urine proteome” for the identification of prostate cancer (M’Koma et al, 2007). The idea of a fingerprint for the detection and classification of prostate cancer is still one that holds much promise but still needs further investigation and validation.
Endoglin
Endoglin is a transmembrane glycoprotein that is otherwise known as CD105. Although the expression of this protein is not prostate restrictive or even prostate cancer selective, it has been shown by a number of groups to be expressed in vascular endothelial cells and therefore found to be elevated in cancerous states. Investigators have examined the possibilities for detecting endoglin in the plasma as well as in the urine of men with prostate cancer. When examining the plasma levels of the protein, the investigators demonstrated that with approximately 3 years of follow-up, preoperative endoglin levels correlate with an increased risk for biochemical progression of prostate cancer (Svatek et al, 2008). Similarly, when endoglin is used in combination with several other blood-based biomarkers, further discrimination regarding the risk for biochemical recurrence is provided (Svatek et al, 2009). Endoglin is also expressed in the urine of men with prostate cancer compared with those who are biopsy negative after each group received a DRE. These urinary levels correlate with tumor volume and appear to be more accurate than PSA in the discrimination of biopsy outcome (Fujita et al, 2009). These same investigators also examined the serum levels of endoglin and demonstrated that although the serum levels were not predictive of a diagnosis of prostate cancer, it was possible to distinguish between organ-confined and non–organ-confined disease. These initial studies have been intriguing and certainly will need validation in multi-institutional trials.
PCA-3
Using differential display and Northern blot analysis to compare normal and prostate cancer tissue, Bussemakers and colleagues (1999) identified the DD3 prostate-specific gene on chromosome 9q21-22. Study of this gene has determined that it may function as noncoding RNA because it has been found to be alternatively spliced, contains a high density of stop codons, and lacks an open reading frame. Expression of the DD3PCA-3 protein has been localized to prostatic tissue and has been found in 95% of prostate cancer and prostate metastasis specimens. de Kok and colleagues (2002) developed a real-time quantitative reverse transcriptase PCR (QRT-PCR) assay for DD3 and showed 66-fold upregulation of this protein in cancerous tissues compared with normal control tissues. Furthermore, DD3 was detected from specimens containing as little as 10% cancer, indicating that this test was capable of finding cancer within a large background of normal cells. Using this discovery, Hessels and coworkers (2003) developed a test to detect DD3 in urine specimens from men, following prostate massage and biopsy. Using QRT-PCR to analyze the urine from these men undergoing biopsy for serum PSA greater than 3 ng/mL, the test demonstrated 67% sensitivity and 83% specificity for men diagnosed with cancer after confirmatory biopsy. As also reported, a negative predictive value of 90% supports the potential of the test as a modality to reduce the number of invasive diagnostic procedures, such as transrectal ultrasonography (TRUS) biopsy. Several clinical studies and further assay development are currently under way for evaluation of DD3/PCA-3.
This urine-based biomarker has been investigated most extensively and will soon be evaluated by the FDA. After its identification in the prostate cancer tissue, investigators have been able to demonstrate its detection using RT-PCR within the urine of men with prostate cancer. To enhance the sensitivity of such assays, urine samples have been collected after an “attentive” digital rectal examination, which conceptually will loosen and shed the cells within the prostate and therefore enhance the chance of detection (Fig. 98–8). Using this approach, urine-based assays have been developed that can detect prostate cancer (Tinzl et al, 2004). Several clinical studies have been performed that evaluate the utility of PCA-3 to serve as a prostate cancer biomarker. Some studies have focused on the utility of this biomarker in the setting of individuals who have undergone at least one biopsy of their prostate for the determination of prostate cancer (Hessels et al, 2003; van Gils et al, 2008). Assaying PCA-3 has been shown to have some utility to discriminate among those who would benefit from a second biopsy in that these individuals end up with prostate cancer (Deras et al, 2008). PCA-3 has also been reported to be associated with Gleason score of men with the disease in that higher levels of the message appear to correlate with Gleason score. PCA-3 levels are reported as a ratio of PCA-3 message over PSA message within the urine. The levels of PSA message are therefore used as a means to normalize these levels. Interestingly, in a recent report, it was noted that urinary levels of PCA-3 do not appear to be elevated with increasing prostate size but do correlate with tumor volume (Whitman et al, 2008). Although this supports the concept that enlarged prostates would not by themselves result in higher PCA-3 levels, it is somewhat surprising because the PSA message is used as a normalization factor to evaluate PCA-3 levels. In men with enlarged prostates, one would expect to have an elevated level of PSA message in urine as a result of the increase in cells in the prostate. Also, a breakdown of architecture would result in more PSA message being released into the urine and therefore an actual decline in urine-based PCA-3 message. The investigators actually did not note any change in PCA-3 levels and do not provide an explanation for this result (Whitman et al, 2008).
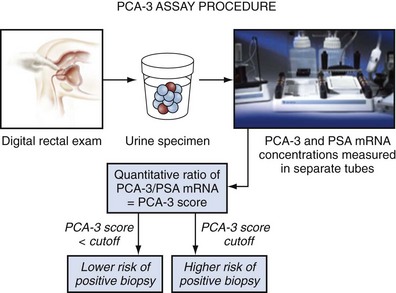
Figure 98–8 PCA-3 assay protocol. Following “attentive” digital rectal exam, urine is collected. RT-PCR determines the mRNA levels for PCA-3 and PSA. The ratio between PCA-3/PSA determines the PCA-3 score. Prostate cancer risk level suggests need for biopsy.
(From Groskopf J, Aubin SM, Deras IL, et al. APTIMA PCA3 molecular urine test: development of a method to aid in the diagnosis of prostate cancer. Clin Chem 2006;52:1089–95.)
Recently, the PCA-3 diagnostic test has been standardized for whole urine, in an easy-to-use platform retaining the 69% sensitivity and 79% specificity (area under curve [AUC]-ROC = 0.746) in men undergoing prostate biopsy (Groskopf et al, 2006). However, the AUC-ROC was only 0.69 in a larger cohort of men (Deras et al, 2008). The molecular assay has been further evaluated in a multicenter trial in Holland (van Gils et al, 2007) and in the United States (Sokoll et al, 2008a), where the test has also been performed similarly. Although these results are promising, further validation is necessary to understand fully the potential clinical utility of this test. The U.S. FDA has not yet approved the PCA-3 diagnostic test, but several reference laboratories that run the test are available in the United States.
Cellular Biomarkers
Circulating Tumor Cells
There has been significant interest over the last several years in the development and evaluation of tests that can detect circulating tumor cells. The excitement in this area of research goes back fifteen years when investigators using polymerase chain reaction (PCR)–based approaches demonstrated PCR positivity for PSA among men with advanced prostate cancer (Katz et al, 1994). The problem with this approach was that PCR positivity was also found among men with localized prostate cancer, and even in men without prostate cancer (Sokoloff et al, 1996; Thiounn et al, 1997).
As described earlier in this chapter, one of the unmet needs in prostate cancer is the ability to use a marker that can predict the presence of disease that either has the ability to spread outside of the prostate or has already spread outside of the prostate. The concept behind using detection of epithelial cells in blood is that, if present, they might indicate the presence of tumor cells that have left the prostate and therefore perhaps metastatic disease.
Using a combination of antibodies that are designed to detect epithelial cells in blood, a system has now been developed that can be used with clinical samples. The CellSearch Circulating Tumor Cell Kit is now approved by the FDA for use in disease monitoring. This system is produced by Veridex (Raritan, NJ). The CellSearch system uses antibodies against CD45, EpCAM, and cytokeratins 8, 18, and/or 19. Positive cells are indicated by negative staining for CD45 and positive staining for EpCAM and the various cytokeratins. Using a magnetic core separation system, blood samples are analyzed using the disposable cartridges provided by the system. Men with prostate cancer can have samples taken before and after a therapeutic regimen. Response to therapy is then measured by alterations in the numbers of positive cells that are observed in the system. Based upon the studies performed using this system, a circulating tumor cell (CTC) count of 5 or more cells per 7.5 mL of blood at any time during the course of the disease has been associated with a poor prognosis (Shaffer et al, 2007). A principal limitation to this approach is that only cells that stain positively for EpCAM and the cytokeratins will be detected. Any degradation of cell surface molecules, or the cells themselves, will result in a failure to detect cells that may indeed to be present in blood. In a study of 422 patients with metastatic prostate cancer, using the Veridex platform, the investigators demonstrated that there was a difference between baseline numbers of cells and those present 2 to 5 weeks post-treatment (Fig. 98–9). For example, 57% of the patients had greater than 5 cells per 7.5 mL of blood before treatment, and 39% had greater than 5 cells per 7.5 mL after treatment (Shaffer et al, 2007).
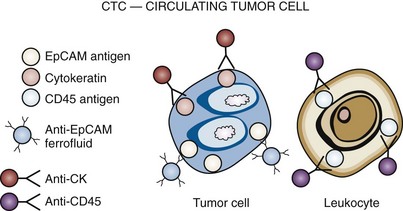
Figure 98–9 CellSearch CTC: Circulating Tumor Cell (Veridex) cell enumeration system. EpCAM, epithelial cell adhesion molecule; CK, cytokeratin; CD45, CD stands for “cluster of differentiation,” which was originally called leukocyte common antigen. The anti-EpCAM ferrofluid captures the cells, and they are then validated with cytokeratin-positive and CD45-negative staining.
Using a similar type of approach, investigators at the Harvard Medical School developed their own system to detect circulating tumor cells in blood. This microfluidic system has a number of advantages over the FDA-approved system. This “CTC-Chip” uses microposts that are embedded with anti-EpCAM antibody. The investigators have reported that they can detect 1 EpCAM-positive cell among one billion blood cells. This system provides the opportunity to subsequently isolate and therefore further study the circulating tumor cells (Nagrath et al, 2007).
In a more recent study, using the cutoff of greater than or equal to 5 CTCs per 7.5 mL of blood, patients were classified into populations that were considered to have either favorable or unfavorable responses. Among 276 men, they demonstrated that the group with the higher numbers of CTCs had a shorter overall survival and that this prediction was more accurate than the use of PSA (de Bono et al, 2008).
In general, the potential use of CTCs as a measurement of prostate cancer cells appears to be promising. At the same time, we must realize that the markers being used to select cells from the blood can detect epithelial cells but are not tumor cell–associated. This may lead to the detection of cells that are not cancerous but actually represent normal epithelial cells in blood. On the other hand, the sensitivity of the currently used CTC assays may be somewhat limited in that tumor cells may exist at metastatic sites, such as in bones, without being easily detectable in blood. It is clear that the integration of more specific antibodies, as well as other approaches that can more accurately and sensitively detect tumor cells, may further enhance the utility of these types of assays.
Autoimmune Reponses
Although we classically think of biomarkers as substances that are abnormally expressed by the tumors and which are then detectable in a body fluid such as urine, blood, or prostatic fluids, this is not the only type of biomarkers that may be predictive. The response of the body to the presence of the cancer cell can itself be used as biomarkers. The immune response to the presence of a tumor can be predictive. Using a high-throughput approach, investigators at the University of Michigan were able to develop autoimmune profiles that could distinguish individuals with prostate cancer from those without the disease (Wang et al, 2005). Although the results appeared to be promising, further studies have not validated these findings. It is still likely that the immune response to tumors can indeed be used to detect tumors, or even the presence of metastases.
Molecular Biology
New understanding of the molecular biology of carcinogenesis and prostate cancer is beginning to yield a new era in prostate cancer tumor research. Applications of sensitive tools are providing clinicians with improved methods for diagnosis and management of disease. These advances in molecular oncology have vastly improved our current understanding of prostate cancer etiology and molecular pathogenesis and have identified the importance of genomic alterations, epigenetic modifications, and gene-protein expression that contribute to the development and progression of prostate cancer.
Future Directions in Prostate Cancer Biomarker Research
Gene Susceptibility Loci
The presence of a positive family history has been known to be a risk factor for the development of prostate cancer. A number of susceptibility loci probably involved in the risk of development of cancer have been identified (Lichtenstein et al, 2000) through studies of affected families with prostate cancer. Prostate cancer susceptibility genes have been located on chromosome 1q24-25 (HPC1), 1q42-2-q43 (PCaP), 1p36 (CAPB), 16q23.2, 17p11 (ELAC2 or HPC2), 20q13 (HPC20), and Xq27-28 (HPCX) (Monroe et al, 1995; Lichtenstein et al, 2000; Nam et al, 2003; Simard et al, 2003). Key susceptibility genes that have been proposed to be involved in the inflammatory response are MSR1 and RNAEL (DeMarzo et al, 2003).
Within these families, genetic polymorphisms are likely to occur at higher frequency and contribute to the increased risk of prostate cancer. Polymorphic variants in genes encoding the androgen receptor (AR), CYP17, and 5α-reductase type 2 (SRD5A2) have been evaluated and suggest a role for infection and inflammation in the development of prostate cancer (DeMarzo et al, 2003). Other polymorphic variants in genes encoding CYP3A, vitamin D receptor, PSA, GSTT1, GSTM1, GSTP1, IGF-1, and IGF-binding protein 3 have also been studied. Among these, GSTP1 and IGF have shown a correlation with the presence of cancer on biopsy of men with elevated PSA levels (Nam et al, 2003).
Although this information has aided and continues to contribute to the study of prostate cancer, familial susceptibility genes and polymorphisms are unlikely to account completely for the development of prostate cancer. Development of a large-scale test for these genes as a screening modality in the male population would probably not be very effective. Other factors such as diet, lifestyle, and chronic inflammation have also been implicated in the cause and progression of prostate cancer (Nelson et al, 2002; Foley et al, 2004; Montironi et al, 2004).
microRNAs
Based upon the realization that a majority of the DNA in the genome does not encode protein sequences, the utility of these sequences in the regulation of gene expression has been under intense investigation. Among the most important components of this regulation are microRNAs (miRNAs). These are small (usually less than 22-nucleotide (nt) sequences that are involved in the regulation of mRNA. With the association of a number of these miRNAs with cancer, the idea of using these nucleotides as markers of the disease has been attractive. A test has been developed to detect miRNAs in the plasma of men with prostate cancer. Although the study populations were small, the investigators demonstrated that detection of miR-141 has excellent potential for distinguishing men with prostate cancer from those without the disease (Mitchell et al, 2008). Additionally, microRNAs assays have been developed that can robustly detect even small amounts of these small RNAs in human tissues (Siva et al, 2009). Although these findings need to be expanded to larger populations of individuals, there is interesting data to demonstrate that this is an interesting family of potential markers.
α-Methylacyl Coenzyme A Racemase
The α-methylacyl coenzyme A racemase (AMACR) gene, located on chromosome 5, is upregulated in prostate cancer tissues (Luo et al, 2001; Rubin et al, 2002). AMACR functions as an enzyme responsible for the beta-oxidation of branched-chain fatty acids obtained in diets consisting of beef and dairy products. Upregulated AMACR mRNA levels have been identified using immunohistochemical analysis and Western blot assays in clinical prostate cancer tissue. Luo and colleagues (2002) demonstrated that 88% of prostate cancer cases and both untreated metastasis and hormone-refractory prostate cancers were strongly positive for AMACR. Rogers and colleagues (2004) measured AMACR levels in the voided urine from 26 men following transrectal prostate biopsy. Elevated AMACR levels were detected in 18 of 26 (69%) of the men and provided 100% sensitivity (12 of 12 positive biopsies) and 58% specificity. Immunohistochemical studies by Rubin and coworkers (2002) have shown that AMACR expression in biopsy tissue may provide 97% sensitivity and 100% specificity for prostate cancer detection. Furthermore, in combination with other markers, such as TP63, that aid in identifying basal cells absent in prostate cancer, measurement of AMACR has potential for the development of molecular probes to aid in the detection of prostate cancer.
However, there is new literature examining an expanded role for AMACR in noninvasive CaP screening. For example, Rogers and coworkers (2004) assessed the feasibility of a urine test for CaP based on measuring AMACR levels. They performed immunoblot analysis on voided urine from 26 men with suspected CaP following transrectal prostate biopsy. Elevated AMACR levels were detected in 18 of 26 (69%) of these patients. All 12 men with CaP demonstrated AMACR-positive urine (100% sensitivity), while 5 of 12 men without cancer had false-positive urine tests (58% specificity). Fifty percent of men with atypical biopsies were positive for AMACR as well. Zielie and coworkers (2004) developed an assay to detect CaP based on urine samples collected after prostatic massage. The researchers used polymerase chain reaction (PCR) to detect AMACR levels from total cellular RNA collected from the spun urine. When AMACR levels were normalized to cellular PSA mRNA levels, a diagnostic cutoff value of 2 SDs above the mean correctly identified all 9 cancer-free controls (100% specificity) and 7 of 10 (70% sensitivity) patients with CaP. Such assays for the detection of CaP from urine specimens show early promise but still require additional investigation.
Prostate Breast Overexpressed Gene1 (PBOV1) or UROC28
An and colleagues (2000) have cloned and characterized a novel gene, UROC28, found to be overexpressed in prostate, breast, and bladder carcinomas. This gene is on chromosome 6q23-24, and the expression protein product is measurable in serum. Early immunohistochemical studies have demonstrated differential expression and characterization between normal and cancerous tissues. This group has also identified and measured the protein UC28 in serum. Application of the antibody to a ProteinChip and SELDI analysis has provided encouraging results that correctly distinguish cancer specimens from normal and BPH specimens. This preliminary work remains under investigation.
Annexin A3
Among the potential urine-based proteins that can be used as biomarkers for prostate cancer is annexin A3. This protein is part of a family of calcium and phospholipid binding proteins that have been shown to be altered in cancer (Wozny et al, 2007; Köllermann et al, 2008). Recently, using an immunoblot in which urine samples were blotted onto a membrane and probed for annexin A3 using an antibody, investigators were able to determine the potential clinical utility of urine-based annexin A3, either as a stand-alone biomarker or together with PSA. In a blinded study that consisted of training and evaluation sets of 243 and 264 men, respectively, the investigators were able to show that the addition of annexin A3 added to the ability of PSA to discriminate between these groups. Annexin A3 levels are inversely related to the presence of prostate cancer. Although this marker appears to have potential utility, further studies are certainly warranted to validate this work.
Hepsin
Complementary DNA (cDNA) microarray analysis has demonstrated overexpression of hepsin in prostate cancer compared with normal prostate and BPH tissues (Luo et al, 2001; Magee et al, 2001; Stamey et al, 2001). Hepsin is a type II transmembrane serine protease and was originally found as a cDNA clone in a human liver cDNA library (Leytus et al, 1988). Immunohistochemical studies have shown abundant staining of hepsin in tumor cell membranes. Stephan and coworkers (2004) have shown hepsin staining in 90% of all cases of prostate cancer. Furthermore, these authors demonstrated that in 53% of cases hepsin overexpression was more than 10-fold in cancerous tissue. In addition to providing a method for cancer detection, hepsin expression may provide prognostic information that may be used to assess prostate cancer aggressiveness.
NMP 48 (50.8 kD)
Using proteomic patterns based on surface-enhanced laser desorption ionization–time-of-flight (SELDI-TOF) mass spectroscopy, Hlavaty and colleagues (2003) discovered a unique 50.8-kD protein. This protein was subsequently characterized as a vitamin D binding protein using peptide mass fingerprinting. Using preprocessed serum samples from men with prostate cancer, BPH, and no cancer, this group was able to identify correctly vitamin D binding protein in the samples from men with cancer. SELDI-TOF identified the protein in 50 of 52 (96%) cancer cases, 5 of 20 (25%) biopsy-confirmed benign cases, 3 of 10 (30%) BPH cases, and 2 of 50 (4%) normal controls. Validation studies are under way for this potential prostate cancer tumor marker.
Metabolites
One of the characteristics of cancer cells are modifications in their metabolism. The cancer cell, in general, uses a less efficient source of generating energy and therefore surviving. Even with the explosion of molecular biology and the large amount of information that has been learned about cell cycle regulation, little attention has been given to the differences that exist between the metabolic processes of the cancer cell versus normal cells. Using a high-throughput approach that combines chromatography with mass spectroscopy, a number of potentially important differences in metabolomic profiles have been observed when comparing prostate cancer tissue with normal tissue. Among the molecules profiled, one of the differences appearing is with sarcosine, which has been demonstrated in the urine of men with prostate cancer (Sreekumar et al, 2009). Although the average levels of urine-based sarcosine are indeed different between men with prostate cancer and those without the disease, from the data provided, it seems that a cutoff able to separate these populations in a clinically robust fashion is unlikely. Despite this, there certainly is potential for the use of cancer metabolites to serve as markers of the disease, and this is an area of active investigation.
Summary
Early detection when cancer remains confined to the prostate will not only improve cure rates but also decrease mortality from this disease. Although the discovery and application of PSA have revolutionized current prostate cancer detection and management, stage migration and changes in the natural history of this cancer have outrun the currently maximized application of this tumor marker. Application of various PSA derivatives, although improving sensitivity, risks impairing specificity. Discovery of molecular derivatives of PSA and new kallikrein markers has also improved prostate cancer detection.
Innovations and new understanding in the field of molecular oncology have provided a host of potential prostate cancer tumor markers. Because prostate cancer has been shown to be a heterogeneous disease, application of a panel of markers will probably ultimately provide added sensitivity and specificity for detection of the disease. Identification of hypermethylated regions, such as for GSTP1, and over- and underexpressed proteins and genes, such as PCA-3, provides greater diagnostic and prognostic potential to improve detection of prostate cancer. As these discoveries mature, development of these markers from research into clinically applicable tools will improve detection and management of prostate cancer.
Key Points
Byrne JC, Downes MR, O’Donoghue N, et al. 2D-DIGE as a strategy to identify serum markers for the progression of prostate cancer. J Proteome Res. 2009;8(2):942-957.
de Bono JS, Scher HI, Montgomery RB, et al. Circulating tumor cells predict survival benefit from treatment in metastatic castration-resistant prostate cancer. Clin Cancer Res. 2008;14(19):6302-6309. Erratum in: Clin Cancer Res. 2009;15(4):1506
DeMarzo AM, Nelson WG, Isaacs WB, Epstein JI. Pathological and molecular aspects of prostate cancer. Lancet. 2003;361:955-964.
Deras IL, Aubin SM, Blase A, et al. PCA3: a molecular urine assay for predicting prostate biopsy outcome. J Urol. 2008;179(4):1587-1592.
Hu R, Dunn TA, Wei S, et al. Ligand-independent androgen receptor variants derived from splicing of cryptic exons signify hormone-refractory prostate cancer. Cancer Res. 2009;69(1):16-22.
Lu Q, Nunez E, Lin C, et al. A sensitive array-based assay for identifying multiple TMPRSS2:ERG fusion gene variants. Nucleic Acids Res. 2008;36(20):e130.
Paliouras M, Borgono C, Diamandis EP. Human tissue kallikreins: the cancer biomarker family. Cancer Lett. 2007;249(1):61-79.
Polascik TJ, Oesterling JE, Partin AW. Prostate specific antigen: a decade of discovery—what we have learned and where we are going. J Urol. 1999;162:293-306.
Sokoll LJ, Wang Y, Feng Z, et al. [-2]Proenzyme prostate specific antigen for prostate cancer detection: a National Cancer Institute early detection research network validation study. J Urol. 2008;180:539-543.
Sun J, Chang BL, Isaacs SD, et al. Cumulative effect of five genetic variants on prostate cancer risk in multiple study populations. Prostate. 2008;68(12):1257-1262.
Abdel-Aziz A, Elgamal AA, Holmes EH, et al. Prostate-specific membrane antigen (PSMA): current benefits and future value. [Review]. Semin Surg Oncol. 2000;18(1):10-16.
Ablin RJ, Soanes WA, Bronson P, Witebsky E. Precipitating antigens of the normal human prostate. J Reprod Fertil. 1970;22:573-574.
An G, Ng AY, Meka CS, et al. Cloning and characterization of UROC28, a novel gene overexpressed in prostate, breast, and bladder cancers. Cancer Res. 2000;60:7014-7020.
Armitage TG, Cooper EH, Newling DW, et al. The value of the measurement of serum prostate specific antigen in patients with benign prostatic hyperplasia and untreated prostate cancer. Br J Urol. 1988;62:584-589.
Bangma CH, Wildhagen MF, Yurdakul G, et al. The value of (-7, -5)pro-prostate-specific antigen and human kallikrein-2 as serum markers for grading prostate cancer. BJU Int. 2004;93(6):720-724.
Barry M, Perner S, Demichelis F, Rubin MA. TMPRSS2-ERG fusion heterogeneity in multifocal prostate cancer: clinical and biologic implications. Urology. 2007;70(4):630-633.
Bastian PJ, Nakayama M, De Marzo AM, Nelson WG. GSTP1 CpG island hypermethylation as a molecular marker of prostate cancer. Urologe A. 2004;43:573-579.
Bastian PJ, Palapattugs Lin X, et al. Preoperative serum DNA GSTP1 CpG island hypermethylation and the risk of early prostate specific antigen recurrence following radical prostatectomy. Clin Cancer Res, 11, 2005, 437-443.
Bazinet M, Meshref AW, Trudel C, et al. Prospective evaluation of prostate-specific antigen density and systematic biopsies for early detection of prostatic carcinoma. Urology. 1994;43:44-51. discussion 51–2
Becker C, Piironen T, Kiviniemi J, et al. Sensitive and specific immunodetection of human glandular kallikrein 2 in serum. Clin Chem. 2000;46:198-206.
Benson MC, Whang IS, Olsson CA, et al. The use of prostate specific antigen density to enhance the predictive value of intermediate levels of serum prostate specific antigen. J Urol. 1992;147:817-821.
Benson MC, Whang IS, Pantuck A, et al. Prostate specific antigen density: a means of distinguishing benign prostatic hypertrophy and prostate cancer. J Urol. 1992;147:815-816.
Bjork T, Ljungberg B, Piironen T, et al. Rapid exponential elimination of free prostate-specific antigen contrasts the slow, capacity-limited elimination of PSA complexed to alpha 1-antichymotrypsin from serum. Urology. 1998;51:57-62.
Bussemakers MJ, van Bokhoven A, Verhaegh GW, et al. DD3: a new prostate-specific gene, highly overexpressed in prostate cancer. Cancer Res. 1999;59:5975-5979.
Byrne JC, Downes MR, O’Donoghue N, et al. 2D-DIGE as a strategy to identify serum markers for the progression of prostate cancer. J Proteome Res. 2009;8(2):942-957.
Cairns P, Esteller M, Herman JG, et al. Molecular detection of prostate cancer in urine by GSTP1 hypermethylation. Clin Cancer Res. 2001;7:2727-2730.
Canto EI, Singh H, Shariat SF, et al. Serum BPSA outperforms both total PSA and free PSA as a predictor of prostatic enlargement in men without prostate cancer. Urology. 2004;63(5):905-910. discussion 910–11
Carter HB, Morrell CH, Pearson JD, et al. Estimation of prostatic growth using serial prostate-specific antigen measurements in men with and without prostate disease. Cancer Res. 1992;52:3323-3328.
Carter HB, Partin AW, Luderer AA, et al. Percentage of free prostate-specific antigen in sera predicts aggressiveness of prostate cancer a decade before diagnosis. Urology. 1997;49:379-384.
Carter HB, Pearson JD, Metter EJ, et al. Longitudinal evaluation of prostate-specific antigen levels in men with and without prostate disease. JAMA. 1992;267:2215-2220.
Catalona WJ. Clinical utility of measurements of free and total prostate-specific antigen (PSA): a review. Prostate Suppl. 1996;7:64-69.
Catalona WJ, Bartsch G, Rittenhouse HG, et al. Serum pro prostate specific antigen improves cancer detection compared to free and complexed prostate specific antigen in men with prostate specific antigen 2 to 4 ng/mL. J Urol. 2003;170(6 Pt. 1):2181-2185.
Catalona WJ, Bartsch G, Rittenhouse HG, et al. Serum pro-prostate specific antigen preferentially detects aggressive prostate cancers in men with 2 to 4 ng/ml prostate specific antigen. J Urol. 2004;171(6 Pt. 1):2239-2244.
Catalona WJ, Partin AW, Slawin KM, et al. Use of the percentage of free prostate-specific antigen to enhance differentiation of prostate cancer from benign prostatic disease: a prospective multicenter clinical trial. JAMA. 1998;279:1542-1547.
Catalona WJ, Partin AW, Slawin KM, et al. Percentage of free PSA in black versus white men for detection and staging of prostate cancer: a prospective multicenter clinical trial. Urology. 2000;55:372-376.
Catalona WJ, Smith DS, Ornstein DK. Prostate cancer detection in men with serum PSA concentrations of 2.6 to 4.0 ng/mL and benign prostate examination. Enhancement of specificity with free PSA measurements. JAMA. 1997;277:1452-1455.
Catalona WJ, Smith DS, Ratliff TL, et al. Measurement of prostate-specific antigen in serum as a screening test for prostate cancer. N Engl J Med. 1991;324:1156-1161.
Catalona WJ, Smith DS, Wolfert RL, et al. Evaluation of percentage of free serum prostate-specific antigen to improve specificity of prostate cancer screening. JAMA. 1995;274:1214-1220.
Chan DW, Bruzek DJ, Oesterling JE, et al. Prostate-specific antigen as a marker for prostatic cancer: a monoclonal and a polyclonal immunoassay compared. Clin Chem. 1987;33:1916-1920.
Chang SS, O’Keefe DS, Bacich DJ, et al. Prostate-specific membrane antigen is produced in tumor-associated neovasculature. Clin Cancer Res. 1999;5:2674-2681.
Chang SS, Reuter VE, Heston WD, et al. Five different anti-prostate-specific membrane antigen (PSMA) antibodies confirm PSMA expression in tumor-associated neovasculature. Cancer Res. 1999;59:3192-3198.
Chen Z, Chen H, Stamey TA. Prostate specific antigen in benign prostatic hyperplasia: purification and characterization. J Urol. 1997;157:2166-2170.
Christensson A, Bjork T, Nilsson O, et al. Serum prostate specific antigen complexed to alpha 1-antichymotrypsin as an indicator of prostate cancer. J Urol. 1993;150:100-105.
Christensson A, Laurell CB, Lilja H. Enzymatic activity of prostate-specific antigen and its reactions with extracellular serine proteinase inhibitors. Eur J Biochem. 1990;194:755-763.
Christensson A, Lilja H. Complex formation between protein C inhibitor and prostate-specific antigen in vitro and in human semen. Eur J Biochem. 1994;220:45-53.
Chybowski FM, Bergstralh EJ, Oesterling JE. The effect of digital rectal examination on the serum prostate specific antigen concentration: results of a randomized study. J Urol. 1992;148:83-86.
Clements JA. The glandular kallikrein family of enzymes: tissue-specific expression and hormonal regulation. Endocr Rev. 1989;10:393-419.
Colberg JW, Smith DS, Catalona WJ. Prevalence and pathological extent of prostate cancer in men with prostate specific antigen levels of 2.9 to 4.0 ng/ml. J Urol. 1993;149:507-509.
Crawford ED, Schutz MJ, Clejan S, et al. The effect of digital rectal examination on prostate-specific antigen levels. JAMA. 1992;267:2227-2228.
Dalton DL. Elevated serum prostate-specific antigen due to acute bacterial prostatitis. Urology. 1989;33:465.
Darson MF, Pacelli A, Roche P, et al. Human glandular kallikrein 2 (hK2) expression in prostatic intraepithelial neoplasia and adenocarcinoma: a novel prostate cancer marker. Urology. 1997;49:857-862.
Darson MF, Pacelli A, Roche P, et al. Human glandular kallikrein 2 expression in prostate adenocarcinoma and lymph node metastases. Urology. 1999;53:939-944.
de Bono JS, Scher HI, Montgomery RB, et al. Circulating tumor cells predict survival benefit from treatment in metastatic castration-resistant prostate cancer. Clin Cancer Res. 2008;14(19):6302-6309. Erratum in: Clin Cancer Res 2009;15(4):1506
de Kok JB, Verhaegh GW, Roelofs RW, et al. DD3(PCA3), a very sensitive and specific marker to detect prostate tumors. Cancer Res. 2002;62:2695-2698.
DeMarzo AM, Nelson WG, Isaacs WB, Epstein JI. Pathological and molecular aspects of prostate cancer. Lancet. 2003;361:955-964.
Deras IL, Aubin SM, Blase A, et al. PCA3: a molecular urine assay for predicting prostate biopsy outcome. J Urol. 2008;179(4):1587-1592.
Diamandis EP, Okui A, Mitsui S, et al. Human kallikrein 11: a new biomarker of prostate and ovarian carcinoma. Cancer Res. 2002;62:295-300.
Diamandis EP, Yousef GM. Human tissue kallikrein gene family: a rich source of novel disease biomarkers. Expert Rev Mol Diagn. 2001;1:182-190.
Diamandis EP, Yousef GM, Luo LY, et al. The new human kallikrein gene family: implications in carcinogenesis. Trends Endocrinol Metab. 2000;11:54-60.
Diaz JI, Cazares LH, Semmes OJ. Tissue sample collection for proteomics analysis. Methods Mol Biol. 2008;428:43-53.
Djavan B, Zlotta A, Kratzik C, et al. PSA, PSA density, PSA density of transition zone, free/total PSA ratio, and PSA velocity for early detection of prostate cancer in men with serum PSA 2.5 to 4.0 ng/mL. Urology. 1999;54:517-522.
Djavan B, Zlotta A, Remzi M, et al. Optimal predictors of prostate cancer on repeat prostate biopsy: a prospective study of 1,051 men. J Urol. 2000;163:1144-1148. discussion 1148–9
Douglas TH, Morgan TO, McLeod DG, et al. Comparison of serum prostate specific membrane antigen, prostate specific antigen, and free prostate specific antigen levels in radical prostatectomy patients. Cancer. 1997;80(1):107-114.
Eggener SE, Roehl KA, Catalona WJ. Predictors of subsequent prostate cancer in men with a prostate specific antigen of 2.6 to 4.0 ng/ml and an initially negative biopsy. J Urol. 2005;174:500-504.
Elgamal AA, Holmes EH, Su SL, et al. Prostate-specific membrane antigen (PSMA): current benefits and future value. Semin Surg Oncol. 2000;18:10-16.
Elsässer-Beile U, Bühler P, Wolf P. Targeted therapies for prostate cancer against the prostate specific membrane antigen. Current Drug Targets. 2009;10:118-125.
Ercole CJ, Lange PH, Mathisen M, et al. Prostatic specific antigen and prostatic acid phosphatase in the monitoring and staging of patients with prostatic cancer. J Urol. 1987;138:1181-1184.
Fair WR, Israeli RS, Heston WD. Prostate-specific membrane antigen. Prostate. 1997;32:140-148.
Finlay JA, Evans CL, Day JR, et al. Development of monoclonal antibodies specific for human glandular kallikrein (hK2): development of a dual antibody immunoassay for hK2 with negligible prostate-specific antigen cross-reactivity. Urology. 1998;51:804-809.
Foley R, Lawler M, Hollywood D. Gene-based therapy in prostate cancer. Lancet Oncol. 2004;5:469-479.
Fowler JEJr, Bigler SA, Kilambi NK, Land SA. Relationships between prostate-specific antigen and prostate volume in black and white men with benign prostate biopsies. Urology. 1999;53:1175-1178.
Fujita K, Ewing CM, Chan DY, et al. Endoglin (CD105) as a urinary and serum marker of prostate cancer. Int J Cancer. 2009;124(3):664-669.
Goessl C, Muller M, Heicappell R, et al. DNA-based detection of prostate cancer in blood, urine, and ejaculates. Ann NY Acad Sci. 2001;945:51-58.
Goessl C, Muller M, Heicappell R, et al. DNA-based detection of prostate cancer in urine after prostatic massage. Urology. 2001;58:335-338.
Goldfarb DA, Stein BS, Shamszadeh M, Petersen RO. Age-related changes in tissue levels of prostatic acid phosphatase and prostate specific antigen. J Urol. 1986;136:1266-1269.
Gonzalgo ML, Pavlovich CP, Lee SM, Nelson WG. Prostate cancer detection by GSTP1 methylation analysis of postbiopsy urine specimens. Clin Cancer Res. 2003;9:2673-2677.
Gopalan A, Leversha MA, Satagopan JM, et al. TMPRSS2-ERG gene fusion is not associated with outcome in patients treated by prostatectomy. Cancer Res, 4, 2009, 1400-1406. 69
Gretzer MB, Epstein JI, Pound CR, et al. Substratification of stage T1C prostate cancer based on the probability of biochemical recurrence. Urology. 2002;60:1034-1039.
Groskopf J, Aubin SM, Deras IL, et al. APTIMA PCA3 molecular urine test: development of a method to aid in the diagnosis of prostate cancer. Clin Chem. 2006;52:1089-1095.
Guess HA, Heyse JF, Gormley GJ. The effect of finasteride on prostate-specific antigen in men with benign prostatic hyperplasia. Prostate. 1993;22:31-37.
Haese A, Becker C, Noldus J, et al. Human glandular kallikrein 2: a potential serum marker for predicting the organ confined versus non-organ confined growth of prostate cancer. J Urol. 2000;163:1491-1497.
Haese A, Graefen M, Becker C, et al. The role of human glandular kallikrein 2 for prediction of pathologically organ confined prostate cancer. Prostate. 2003;54:181-186.
Haese A, Graefen M, Noldus J, et al. Prostatic volume and ratio of free-to-total prostate specific antigen in patients with prostatic cancer or benign prostatic hyperplasia. J Urol. 1997;158:2188-2192.
Harden SV, Guo Z, Epstein JI, et al. Quantitative GSTP1 methylation clearly distinguishes benign prostatic tissue and limited prostate adenocarcinoma. J Urol. 2003;169:1138-1142.
Harden SV, Sanderson H, Goodman SN, et al. Quantitative GSTP1 methylation and the detection of prostate adenocarcinoma in sextant biopsies. J Natl Cancer Inst. 2003;95:1634-1637.
Hayek OR, Noble CB, de la Taille A, et al. The necessity of a second prostate biopsy cannot be predicted by PSA or PSA derivatives (density or free:total ratio) in men with prior negative prostatic biopsies. Curr Opin Urol. 1999;9:371-375.
Hayes JD, Pulford DJ. The glutathione S-transferase supergene family: regulation of GST and the contribution of the isoenzymes to cancer chemoprotection and drug resistance. Crit Rev Biochem Mol Biol. 1995;30(6):445-600.
Heidenreich A, Vorreuther R, Neubauer S, et al. The influence of ejaculation on serum levels of prostate specific antigen. J Urol. 1997;157:209-211.
Henttu P, Liao SS, Vihko P. Androgens up-regulate the human prostate-specific antigen messenger ribonucleic acid (mRNA), but down-regulate the prostatic acid phosphatase mRNA in the LNCaP cell line. Endocrinology. 1992;130:766-772.
Henttu P, Vihko P. Steroids inversely affect the biosynthesis and secretion of human prostatic acid phosphatase and prostate-specific antigen in the LNCaP cell line. J Steroid Biochem Mol Biol. 1992;41:349-360.
Herschman JD, Smith DS, Catalona WJ. Effect of ejaculation on serum total and free prostate-specific antigen concentrations. Urology. 1997;50:239-243.
Hessels D, Klein Gunnewiek JM, van Oort I, et al. DD3(PCA3)-based molecular urine analysis for the diagnosis of prostate cancer. Eur Urol. 2003;44:8-15. discussion 15–16
Hessels D, Smit FP, Verhaegh GW, et al. Detection of TMPRSS2-ERG fusion transcripts and prostate cancer antigen 3 in urinary sediments may improve diagnosis of prostate cancer. Clin Cancer Res. 2007;13(17):5103-5108.
Hlavaty JJ, Partin AW, Shue MJ, et al. Identification and preliminary clinical evaluation of a 50.8-kDa serum marker for prostate cancer. Urology. 2003;61:1261-1265.
Hooper JD, Bui LT, Rae FK, et al. Identification and characterization of KLK14, a novel kallikrein serine protease gene located on human chromosome 19q13.4 and expressed in prostate and skeletal muscle. Genomics. 2001;73:117-122.
Horoszewicz JS, Kawinski E, Murphy GP. Monoclonal antibodies to a new antigenic marker in epithelial prostatic cells and serum of prostatic cancer patients. Anticancer Res. 1987;7:927-935.
Hu R, Dunn TA, Wei S, et al. Ligand-independent androgen receptor variants derived from splicing of cryptic exons signify hormone-refractory prostate cancer. Cancer Res. 2009;69(1):16-22.
Hu Y, Dobi A, Sreenath T, et al. Delineation of TMPRSS2-ERG splice variants in prostate cancer. Clin Cancer Res. 2008;14(15):4719-4725.
Israeli RS, Grob M, Fair WR. Prostate-specific membrane antigen and other prostatic tumor markers on the horizon. Urol Clin North Am. 1997;24:439-450.
Israeli RS, Powell CT, Corr JG, et al. Expression of the prostate-specific membrane antigen. Cancer Res. 1994;54:1807-1811.
Jones PA. DNA methylation and cancer. Oncogene. 2002;21:5358-5360.
Jones PA, Baylin SB. The fundamental role of epigenetic events in cancer. Nat Rev Genet. 2002;3:415-428.
Karazanashvili G, Abrahamsson PA. Prostate specific antigen and human glandular kallikrein 2 in early detection of prostate cancer. J Urol. 2003;169:445-457.
Katz AE, Olsson CA, Raffo AJ, et al. Molecular staging of prostate cancer with the use of an enhanced reverse transcriptase-PCR assay. Urology. 1994;43(6):765-775.
Keetch DW, Andriole GL, Ratliff TL, Catalona WJ. Comparison of percent free prostate-specific antigen levels in men with benign prostatic hyperplasia treated with finasteride, terazosin, or watchful waiting. Urology. 1997;50:901-905.
Keetch DW, Catalona WJ, Smith DS. Serial prostatic biopsies in men with persistently elevated serum prostate specific antigen values. J Urol. 1994;151:1571-1574.
Khan MA, Partin AW, Rittenhouse HG, et al. Evaluation of proprostate specific antigen for early detection of prostate cancer in men with a total prostate specific antigen range of 4.0 to 10.0 ng/ml. J Urol. 2003;170:723-726.
Kirkali Z, Kirkali G, Esen A. Effect of ejaculation on prostate-specific antigen levels in normal men. Eur Urol. 1995;27:292-294.
Klee GG, Goodmanson MK, Jacobsen SJ, et al. Highly sensitive automated chemiluminometric assay for measuring free human glandular kallikrein-2. Clin Chem. 1999;45:800-806.
Klokk TI, Kilander A, Xi Z, et al. Kallikrein 4 is a proliferative factor that is overexpressed in prostate cancer. Cancer Res. 2007;67(11):5221-5230.
Köllermann J, Schlomm T, Bang H, et al. Expression and prognostic relevance of annexin A3 in prostate cancer. Eur Urol. 2008;54(6):1314-1323.
Kumar A, Mikolajczyk SD, Goel AS, et al. Expression of pro form of prostate-specific antigen by mammalian cells and its conversion to mature, active form by human kallikrein 2. Cancer Res. 1997;57:3111-3114.
Kumar A, Mikolajczyk SD, Hill TM, et al. Different proportions of various prostate-specific antigen (PSA) and human kallikrein 2 (hK2) forms are present in noninduced and androgen-induced LNCaP cells. Prostate. 2000;44:248-254.
Kuriyama M, Wang MC, Lee CI, et al. Use of human prostate-specific antigen in monitoring prostate cancer. Cancer Res. 1981;41:3874-3876.
Kuriyama M, Wang MC, Papsidero LD, et al. Quantitation of prostate-specific antigen in serum by a sensitive enzyme immunoassay. Cancer Res. 1980;40:4658-4662.
Kuzmin I, Gillespie JW, Protopopov A, et al. The RASSF1A tumor suppressor gene is inactivated in prostate tumors and suppresses growth of prostate carcinoma cells. Cancer Res. 2002;62:3498-3502.
Kwiatkowski MK, Recker F, Piironen T, et al. In prostatism patients the ratio of human glandular kallikrein to free PSA improves the discrimination between prostate cancer and benign hyperplasia within the diagnostic “gray zone” of total PSA 4 to 10 ng/mL. Urology. 1998;52:360-365.
Laxman B, Morris DS, Yu J, et al. A first-generation multiplex biomarker analysis of urine for the early detection of prostate cancer. Cancer Res. 2008;68(3):645-649.
Lein M, Brux B, Jung K, et al. Elimination of serum free and total prostate-specific antigen after radical retropubic prostatectomy. Eur J Clin Chem Clin Biochem. 1997;35:591-595.
Lein M, Semjonow A, Graefen M, et al. A multicenter clinical trial on the use of (-5, -7) pro prostate specific antigen. J Urol. 2005;174(6):2150-2153.
Leinonen J, Lovgren T, Vornanen T, Stenman UH. Double-label time-resolved immunofluorometric assay of prostate-specific antigen and of its complex with alpha 1-antichymotrypsin. Clin Chem. 1993;39:2098-2103.
Levesque M, Hu H, D’Costa M, Diamandis EP. Prostate-specific antigen expression by various tumors. J Clin Lab Anal. 1995;9:123-128.
Levesque M, Yu H, D’Costa M, et al. Immunoreactive prostate-specific antigen in lung tumors. J Clin Lab Anal. 1995;9:375-379.
Leytus SP, Loeb KR, Hagen FS, et al. A novel trypsin-like serine protease (hepsin) with a putative transmembrane domain expressed by human liver and hepatoma cells. Biochemistry. 1988;27:1067-1074.
Li LC, Okino ST, Dahiya R. DNA methylation in prostate cancer. Biochim Biophys Acta. 2004;1704:87-102.
Lichtenstein P, Holm NV, Verkasalo PK, et al. Environmental and heritable factors in the causation of cancer: analyses of cohorts of twins from Sweden, Denmark, and Finland. N Engl J Med. 2000;343:78-85.
Lilja H. A kallikrein-like serine protease in prostatic fluid cleaves the predominant seminal vesicle protein. J Clin Invest. 76, 1985. 1899-1103
Lilja H. Significance of different molecular forms of serum PSA. The free, noncomplexed form of PSA versus that complexed to alpha 1-antichymotrypsin. Urol Clin North Am. 1993;20:681-686.
Lilja H. Prostate-specific antigen: molecular forms and the human kallikrein gene family. Br J Urol. 1997;79(Suppl. 1):44-48.
Lilja H, Abrahamsson PA. Three predominant proteins secreted by the human prostate gland. Prostate. 1988;12:29-38.
Lilja H, Christensson A, Dahlen U, et al. Prostate-specific antigen in serum occurs predominantly in complex with alpha 1-antichymotrypsin. Clin Chem. 1991;37:1618-1625.
Lilja H, Laurell CB. Liquefaction of coagulated human semen. Scand J Clin Lab Invest. 1984;44:447-452.
Lilja H, Oldbring J, Rannevik G, Laurell CB. Seminal vesicle-secreted proteins and their reactions during gelation and liquefaction of human semen. J Clin Invest. 1987;80:281-285.
Liu L, Yoon JH, Dammann R, Pfeifer GP. Frequent hypermethylation of the RASSF1A gene in prostate cancer. Oncogene. 2002;21:6835-6840.
Lopez-Corona E, Ohori M, Scardino PT, et al. A nomogram for predicting a positive repeat biopsy in patients with a previous negative biopsy session. J Urol. 170, 2003. 1184-1118
Lovgren J, Rajakoski K, Karp M, et al. Activation of the zymogen form of prostate-specific antigen by human glandular kallikrein 2. Biochem Biophys Res Commun. 1997;238:549-555.
Lovgren J, Valtonen-Andre C, Marsal K, et al. Measurement of prostate-specific antigen and human glandular kallikrein 2 in different body fluids. J Androl. 1999;20:348-355.
Lu Q, Nunez E, Lin C, et al. A sensitive array-based assay for identifying multiple TMPRSS2:ERG fusion gene variants. Nucleic Acids Res. 2008;36(20):e130.
Luderer AA, Chen YT, Soriano TF, et al. Measurement of the proportion of free to total prostate-specific antigen improves diagnostic performance of prostate-specific antigen in the diagnostic gray zone of total prostate-specific antigen. Urology. 1995;46:187-194.
Luo J, Duggan DJ, Chen Y, et al. Human prostate cancer and benign prostatic hyperplasia: molecular dissection by gene expression profiling. Cancer Res. 2001;61:4683-4688.
Magee JA, Araki T, Patil S, et al. Expression profiling reveals hepsin overexpression in prostate cancer. Cancer Res. 2001;61:5692-5696.
Malik G, Rojahn E, Ward MD, et al. SELDI protein profiling of dunning R-3327 derived cell lines: identification of molecular markers of prostate cancer progression. Prostate. 2007;67(14):1565-1575.
Marks LS, Linton HJ, Gasior CL. BPSA is a potential serum marker for benign prostatic hyperplasia (BPH). J Urol. 2001;165:266A.
Maruyama R, Toyooka S, Toyooka KO, et al. Aberrant promoter methylation profile of prostate cancers and its relationship to clinicopathological features. Clin Cancer Res. 2002;8:514-519.
McCormack RT, Rittenhouse HG, Finlay JA, et al. Molecular forms of prostate-specific antigen and the human kallikrein gene family: a new era. Urology. 1995;45:729-744.
McGee RS, Herr JC. Human seminal vesicle-specific antigen is a substrate for prostate-specific antigen (or P-30). Biol Reprod. 1988;39:499-510.
McLerran D, Grizzle WE, Feng Z, et al. SELDI-TOF MS whole serum proteomic profiling with IMAC surface does not reliably detect prostate cancer. Clin Chem.. 2008;54(1):53-60.
Meng FJ, Shan A, Jin L, Young CY. The expression of a variant prostate-specific antigen in human prostate. Cancer Epidemiol Biomarkers Prev. 2002;11(3):305-309.
Meyer A, Jung K, Lein M, et al. Factors influencing the ratio of free to total prostate-specific antigen in serum. Int J Cancer. 1997;74:630-636.
Mikolajczyk SD, Grauer LS, Millar LS, et al. A precursor form of PSA (pPSA) is a component of the free PSA in prostate cancer serum. Urology. 1997;50:710-714.
Mikolajczyk SD, Marker KM, Millar LS, et al. A truncated precursor form of prostate-specific antigen is a more specific serum marker of prostate cancer. Cancer Res. 2001;61:6958-6963.
Mikolajczyk SD, Marks LS, Partin AW, Rittenhouse HG. Free prostate-specific antigen in serum is becoming more complex. Urology. 2002;59:797-802.
Mikolajczyk SD, Millar LS, Wang TJ, et al. A precursor form of prostate-specific antigen is more highly elevated in prostate cancer compared with benign transition zone prostate tissue. Cancer Res. 2000;60:756-759.
Mitchell PS, Parkin RK, Kroh EM, et al. Circulating microRNAs as stable blood-based markers for cancer detection. Proc Natl Acad Sci U S A. 2008;105(30):10513-10518.
M’Koma AE, Blum DL, Norris JL, et al. Detection of pre-neoplastic and neoplastic prostate disease by MALDI profiling of urine. Biochem Biophys Res Commun.. 2007;353(3):829-834.
Monne M, Croce CM, Yu H, Diamandis EP. Molecular characterization of prostate-specific antigen messenger RNA expressed in breast tumors. Cancer Res. 1994;54:6344-6347.
Monroe KR, Yu MC, Kolonel LN, et al. Evidence of an X-linked or recessive genetic component to prostate cancer risk. Nat Med. 1995;1:827-829.
Montironi R, Scarpelli M, Lopez Beltran A. Carcinoma of the prostate: inherited susceptibility, somatic gene defects and androgen receptors. Virchows Arch. 2004;444:503-508.
Morgan TO, Jacobsen SJ, McCarthy WF, et al. Age-specific reference ranges for prostate-specific antigen in black men. N Engl J Med. 1996;335:304-310.
Morote J, Lopez M, Encabo G, de Torres IM. Effect of inflammation and benign prostatic enlargement on total and percent free serum prostatic specific antigen. Eur Urol. 2000;37:537-540.
Mosquera JM, Perner S, Genega EM, et al. Characterization of TMPRSS2-ERG fusion high-grade prostatic intraepithelial neoplasia and potential clinical implications. Clin Cancer Res.. 2008;14(11):3380-3385.
Nadler RB, Humphrey PA, Smith DS, et al. Effect of inflammation and benign prostatic hyperplasia on elevated serum prostate specific antigen levels. J Urol. 1995;154:407-413.
Nagrath S, Sequist LV, Maheswaran S, et al. Isolation of rare circulating tumour cells in cancer patients by microchip technology. Nature. 2007;450(7173):1235-1239.
Nakamura T, Mitsui S, Okui A, et al. Molecular cloning and expression of a variant form of hippostasin/KLK11 in prostate. Prostate. 2003;54:299-305.
Nakamura T, Stephan C, Scorilas A, et al. Quantitative analysis of hippostasin/KLK11 gene expression in cancerous and noncancerous prostatic tissues. Urology. 2003;61:1042-1046.
Nakayama M, Bennett CJ, Hicks JL, et al. Hypermethylation of the human glutathione S-transferase-Pi gene (GSTP1) CpG island is present in a subset of proliferative inflammatory atrophy lesions but not in normal or hyperplastic epithelium of the prostate: a detailed study using laser-capture microdissection. Am J Pathol. 2003;163:923-933.
Nam RK, Diamandis EP, Toi A, et al. Serum human glandular kallikrein-2 protease levels predict the presence of prostate cancer among men with elevated prostate-specific antigen. J Clin Oncol. 2000;18:1036-1042.
Nam RK, Narod SA, Trachtenberg J. Use of human kallikrein 2 (hK2) levels in patient selection for prostate biopsy. J Urol. 2001;165(Suppl.):204A.
Nam RK, Zhang WW, Trachtenberg J, et al. Comprehensive assessment of candidate genes and serological markers for the detection of prostate cancer. Cancer Epidemiol Biomarkers Prev. 2003;12:1429-1437.
Nelson PS, Gan L, Ferguson C, et al. Molecular cloning and characterization of prostase, an androgen-regulated serine protease with prostate-restricted expression. Proc Natl Acad Sci U S A. 1999;96:3114-3119.
Nelson WG, DeWeese TL, DeMarzo AM. The diet, prostate inflammation, and the development of prostate cancer. Cancer Metastasis Rev. 2002;21:3-16.
Nurmikko P, Pettersson K, Piironen T, et al. Discrimination of prostate cancer from benign disease by plasma measurement of intact, free prostate-specific antigen lacking an internal cleavage site at Lys145-Lys146. Clin Chem. 2001;47:1415-1423.
Nurmikko P, Vaisanen V, Piironen T, et al. Production and characterization of novel anti-prostate-specific antigen (PSA) monoclonal antibodies that do not detect internally cleaved Lys145-Lys146 inactive PSA. Clin Chem. 2000;46:1610-1618.
O’Dowd GJ, Miller MC, Orozco R, et al. Analysis of repeated biopsy results within 1 year after a noncancer diagnosis. Urol. 2000;55:553-559.
Obiezu CV, Soosaipillai A, Jung K, et al. Detection of human kallikrein 4 in healthy and cancerous prostatic tissues by immunofluorometry and immunohistochemistry. Clin Chem. 2002;48:1232-1240.
Oesterling JE. PSA leads the way for detecting and following prostate cancer. Contemp Urol. 1993;5:60-81.
Oesterling JE, Chan DW, Epstein JI, et al. Prostate specific antigen in the preoperative and postoperative evaluation of localized prostatic cancer treated with radical prostatectomy. J Urol. 1988;139:766-772.
Oesterling JE, Cooner WH, Jacobsen SJ, et al. Influence of patient age on the serum PSA concentration. An important clinical observation. Urol Clin North Am. 1993;20:671-680.
Oesterling JE, Jacobsen SJ, Chute CG, et al. Serum prostate-specific antigen in a community-based population of healthy men. Establishment of age-specific reference ranges. JAMA. 1993;270:860-864.
Oesterling JE, Rice DC, Glenski WJ, Bergstralh EJ. Effect of cystoscopy, prostate biopsy, and transurethral resection of prostate on serum prostate-specific antigen concentration. Urology. 1993;42:276-282.
Paliouras M, Borgono C, Diamandis EP. Human tissue kallikreins: the cancer biomarker family. Cancer Lett. 2007;249(1):61-79.
Pannek J, Marks LS, Pearson JD, et al. Influence of finasteride on free and total serum prostate specific antigen levels in men with benign prostatic hyperplasia. J Urol. 1998;159:449-453.
Papsidero LD, Wang MC, Valenzuela LA, et al. A prostate antigen in sera of prostatic cancer patients. Cancer Res. 1980;40:2428-2432.
Partin AW, Brawer MK, Bartsch G, et al. Complexed prostate specific antigen improves specificity for prostate cancer detection: results of a prospective multicenter clinical trial. J Urol. 2003;170:1787-1791.
Partin AW, Brawer MK, Subong EN, et al. Prospective evaluation of percent free-PSA and complexed-PSA for early detection of prostate cancer. Prostate Cancer Prostatic Dis. 1998;1:197-203.
Partin AW, Carter HB, Chan DW, et al. Prostate specific antigen in the staging of localized prostate cancer: influence of tumor differentiation, tumor volume and benign hyperplasia. J Urol. 1990;143:747-752.
Partin AW, Catalona WJ, Finlay JA, et al. Use of human glandular kallikrein 2 for the detection of prostate cancer: preliminary analysis. Urology. 1999;54:839-845.
Partin AW, Catalona WJ, Southwick PC, et al. Analysis of percent free prostate-specific antigen (PSA) for prostate cancer detection: influence of total PSA, prostate volume, and age. Urology. 1996;48(6A Suppl.):55-61.
Partin AW, Piantadosi S, Subong EN, et al. Clearance rate of serum-free and total PSA following radical retropubic prostatectomy. Prostate Suppl. 1996;7:35-39.
Perner S, Hofer MD, Kim R, et al. Prostate-specific membrane antigen expression as a predictor of prostate cancer progression. Hum Pathol. 2007;38(5):696-701.
Peter J, Unverzagt C, Krogh TN, et al. Identification of precursor forms of free prostate-specific antigen in serum of prostate cancer patients by immunosorption and mass spectrometry. Cancer Res. 2001;61:957-962.
Piironen T, Lovgren J, Karp M, et al. Immunofluorometric assay for sensitive and specific measurement of human prostatic glandular kallikrein (hK2) in serum. Clin Chem. 1996;42:1034-1041.
Polascik TJ, Oesterling JE, Partin AW. Prostate specific antigen: a decade of discovery—what we have learned and where we are going. J Urol. 1999;162:293-306.
Pound CR, Partin AW, Eisenberger MA, et al. Natural history of progression after PSA elevation following radical prostatectomy. JAMA. 1999;281:1591-1597.
Pound CR, Walsh PC, Epstein JI, et al. Radical prostatectomy as treatment for prostate-specific antigen-detected stage T1c prostate cancer. World J Urol. 1997;15:373-377.
Rabien A, Fritzsche F, Jung M, et al. High expression of KLK14 in prostatic adenocarcinoma is associated with elevated risk of prostate-specific antigen relapse. Tumour Biol. 2008;29(1):1-8.
Recker F, Kwiatkowski MK, Huber A, et al. Prospective detection of clinically relevant prostate cancer in the prostate specific antigen range 1 to 3 ng/ml combined with free-to-total ratio 20% or less: the Aarau experience. J Urol. 2001;166:851-855.
Riehmann M, Rhodes PR, Cook TD, et al. Analysis of variation in prostate-specific antigen values. Urology. 1993;42:390-397.
Rittenhouse HG, Finlay JA, Mikolajczyk SD, Partin AW. Human kallikrein 2 (hK2) and prostate-specific antigen (PSA): two closely related, but distinct, kallikreins in the prostate. Crit Rev Clin Lab Sci. 1998;35:275-368.
Robles JM, Morell AR, Redorta JP, et al. Clinical behavior of prostatic specific antigen and prostatic acid phosphatase: a comparative study. Eur Urol. 1988;14:360-366.
Rogers CG, Yan G, Zha S, et al. Prostate cancer detection on urinalysis for alpha methylacyl coenzyme a racemase protein. J Urol. 2004;172:1501-1503.
Rommel FM, Agusta VE, Breslin JA, et al. The use of prostate specific antigen and prostate specific antigen density in the diagnosis of prostate cancer in a community based urology practice. J Urol. 1994;151:88-93.
Roth HJ, Stewart SC, Brawer MK. A comparison of three free and total PSA assays. Prostate Cancer Prostatic Dis. 1998;1:326-331.
Rubin MA, Zhou M, Dhanasekaran SM, et al. Alpha-methylacyl coenzyme A racemase as a tissue biomarker for prostate cancer. JAMA. 2002;287:1662-1670.
Schedlich LJ, Bennetts BH, Morris BJ. Primary structure of a human glandular kallikrein gene. DNA. 1987;6:429-437.
Schroder FH, van der Cruijsen-Koeter I, de Koning HJ, et al. Prostate cancer detection at low prostate specific antigen. J Urol. 2000;163:806-812.
Seaman E, Whang M, Olsson CA, et al. PSA density (PSAD). Role in patient evaluation and management. Urol Clin North Am. 1993;20:653-663.
Seamonds B, Yang N, Anderson K, et al. Evaluation of prostate-specific antigen and prostatic acid phosphatase as prostate cancer markers. Urology. 1986;28:472-479.
Sensabaugh GF. Isolation and characterization of a semen-specific protein from human seminal plasma: a potential new marker for semen identification. J Forensic Sci. 1978;23:106-115.
Shaffer DR, Leversha MA, Danila DC, et al. Circulating tumor cell analysis in patients with progressive castration-resistant prostate cancer. Clin Cancer Res. 2007;13(7):2023-2029.
Silver DA, Pellicer I, Fair WR, et al. Prostate-specific membrane antigen expression in normal and malignant human tissues. Clin Cancer Res. 1997;3:81-85.
Simak R, Madersbacher S, Zhang ZF, Maier U. The impact of ejaculation on serum prostate specific antigen. J Urol. 1993;150:895-897.
Simard J, Dumont M, Labuda D, et al. Prostate cancer susceptibility genes: lessons learned and challenges posed. Endocr Relat Cancer. 2003;10:225-259.
Singh H, Canto EI, Shariat SF, et al. Predictors of prostate cancer after initial negative systematic 12 core biopsy. J Urol. 2004;171:1850-1854.
Siva AC, Nelson LJ, Fleischer CL, et al. Molecular assays for the detection of microRNAs in prostate cancer. Mol Cancer. 2009;8:17.
Slawin KM, Shariat S, Canto E. BPSA: A novel serum marker for benign prostatic hyperplasia. Rev Urol. 2005;7(Suppl. 8):S52-S56.
Smith DS, Carvalhal GF, Mager DE, et al. Use of lower prostate specific antigen cutoffs for prostate cancer screening in black and white men. J Urol. 1998;160:1734-1738.
Sokoll LJ, Chan DW, Mikolajczyk SD, et al. Proenzyme PSA for the early detection of prostate cancer in the 2.5-4.0 ng/ml total PSA range: preliminary analysis. Urology. 2003;61:274-276.
Sokoll LJ, Ellis W, Lange P, Noteboom J, et al. A multicenter evaluation of the PCA3 molecular urine test: pre-analytical effects, analytical performance, and diagnostic accuracy. Clin Chim Acta. 2008;389:1-6.
Sokoll LJ, Wang Y, Feng Z, et al. [-2]Proenzyme prostate specific antigen for prostate cancer detection: a national cancer institute early detection research network validation study. J Urol. 2008;180:539-543.
Sokoloff MH, Tso CL, Kaboo R, et al. Quantitative polymerase chain reaction does not improve preoperative prostate cancer staging: a clinicopathological molecular analysis of 121 patients. J Urol. 1996;156(5):1560-1566.
Sreekumar A, Poisson LM, Rajendiran TM, et al. Metabolomic profiles delineate potential role for sarcosine in prostate cancer progression. Nature. 2009;457(7231):910-914.
Stamey TA, Warrington JA, Caldwell MC, et al. Molecular genetic profiling of Gleason grade 4/5 prostate cancers compared to benign prostatic hyperplasia. J Urol. 2001;166:2171-2177.
Stamey TA, Yang N, Hay AR, et al. Prostate-specific antigen as a serum marker for adenocarcinoma of the prostate. N Engl J Med. 1987;317:909-916.
Stenman UH, Hakama M, Knekt P, et al. Serum concentrations of prostate specific antigen and its complex with alpha 1-antichymotrypsin before diagnosis of prostate cancer. Lancet. 1994;344:1594-1598.
Stenman UH, Leinonen J, Alfthan H, et al. A complex between prostate-specific antigen and alpha 1-antichymotrypsin is the major form of prostate-specific antigen in serum of patients with prostatic cancer: assay of the complex improves clinical sensitivity for cancer. Cancer Res. 1991;51:222-226.
Stephan C, Jung K, Schnorr D, et al. Re: a prospective study to evaluate the role of complexed prostate specific antigen and free/total prostate specific antigen ratio for the diagnosis of prostate cancer. I.D.C. Mitchell, B.L. Croal, A. Dickie, N.P. Cohen and I. Ross, J Urol 2001;165:1549–53. J Urol, 2002;167, 259-260.
Stephan C, Lein M, Jung K, et al. Re: editorial: can prostate specific antigen derivatives reduce the frequency of unnecessary prostate biopsies? J Urol. 1997;157:1371.
Stephan C, Yousef GM, Scorilas A, et al. Hepsin is highly over expressed in and a new candidate for a prognostic indicator in prostate cancer. J Urol. 2004;171:187-191.
Stephan C, Yousef GM, Scorilas A, et al. Quantitative analysis of kallikrein 15 gene expression in prostate tissue. J Urol. 2003;169:361-364.
Stephenson RA, Stanford JL. Population-based prostate cancer trends in the United States: patterns of change in the era of prostate-specific antigen. World J Urol. 1997;15:331-335.
Steuber T, Nurmikko P, Haese A, et al. Discrimination of benign from malignant prostatic disease by selective measurements of single chain, intact free prostate specific antigen. J Urol. 2002;168:1917-1922.
Su SL, Huang IP, Fair WR, et al. Alternatively spliced variants of prostate-specific membrane antigen RNA: ratio of expression as a potential measurement of progression. Cancer Res. 1995;55:1441-1443.
Sun J, Chang BL, Isaacs SD, et al. Cumulative effect of five genetic variants on prostate cancer risk in multiple study populations. Prostate. 2008;68(12):1257-1262.
Svatek RS, Jeldres C, Karakiewicz PI, et al. Pre-treatment biomarker levels improve the accuracy of post-prostatectomy nomogram for prediction of biochemical recurrence. Prostate. 2009;69(8):886-894.
Svatek RS, Karam JA, Roehrborn CG, et al. Preoperative plasma endoglin levels predict biochemical progression after radical prostatectomy. Clin Cancer Res. 2008;14(11):3362-3366.
Takayama TK, Fujikawa K, Davie EW. Characterization of the precursor of prostate-specific antigen. activation by trypsin and by human glandular kallikrein. J Biol Chem. 1997;272:21582-21588.
Tchetgen MB, Song JT, Strawderman M, et al. Ejaculation increases the serum prostate-specific antigen concentration. Urology. 1996;47:511-516.
Tewari PC, Bluestein BI. Multiple forms of prostate specific antigen and the influences of immunoassay design on their measurement in patient serum. J Clin Ligand Assay. 1996;18:186-196.
Thiounn N, Saporta F, Flam TA, et al. Positive prostate-specific antigen circulating cells detected by reverse transcriptase-polymerase chain reaction does not imply the presence of prostatic micrometastases. Urology. 1997;50(2):245-250.
Thompson IM, Zeidman EJ. Current urological practice: routine urological examination and early detection of carcinoma of the prostate. J Urol. 1992;148:326-329. discussion 329–30
Tinzl M, Marberger M, Horvath S, Chypre C. DD3PCA3 RNA analysis in urine—a new perspective for detecting prostate cancer. Eur Urol. 2004;46(2):182-186. discussion 187
Tomlins SA, Rhodes DR, Perner S, et al. Recurrent fusion of TMPRSS2 and ETS transcription factor genes in prostate cancer. Science. 2005;310(5748):644-648.
Tremblay RR, Deperthes D, Tetu B, Dube JY. Immunohistochemical study suggesting a complementary role of kallikreins hK2 and hK3 (prostate-specific antigen) in the functional analysis of human prostate tumors. Am J Pathol. 1997;150:455-459.
van Gils MP, Hessels D, Hulsbergen-van de Kaa CA, et al. Detailed analysis of histopathological parameters in radical prostatectomy specimens and PCA3 urine test results. Prostate. 2008;68(11):1215-1222.
van Gils MP, Hessels D, van Hooij O, et al. The time-resolved fluorescence-based PCA3 test on urinary sediments after digital rectal examination; a Dutch multicenter validation of the diagnostic performance. Clin Cancer Res. 2007;13:939-943.
Veltri RW, Miller MC. Free/total PSA ratio improves differentiation of benign and malignant disease of the prostate: critical analysis of two different test populations. Urology. 1999;53:736-745.
Vessella RL, Lange PH, Partin AW, et al. Probability of prostate cancer detection based on results of a multicenter study using the AxSYM free PSA and total PSA assays. Urology. 2000;55:909-914.
Vickers AJ, Cronin AM, Aus G, et al. A panel of kallikrein markers can reduce unnecessary biopsy for prostate cancer: data from the European Randomized Study of Prostate Cancer Screening in Göteborg, Sweden. BMC Med. 2008;6:19.
Vieira JG, Nishida SK, Pereira AB, et al. Serum levels of prostate-specific antigen in normal boys throughout puberty. J Clin Endocrinol Metab. 1994;78:1185-1187.
Wang MC, Papsidero LD, Kuriyama M, et al. Prostate antigen: a new potential marker for prostatic cancer. Prostate. 1981;2:89-96.
Wang MC, Valenzuela LA, Murphy GP, Chu TM. Purification of a human prostate specific antigen. Invest Urol. 1979;17:159-163.
Wang TJ, Slawin KM, Rittenhouse HG, et al. Benign prostatic hyperplasia-associated prostate-specific antigen (BPSA) shows unique immunoreactivity with anti-PSA monoclonal antibodies. Eur J Biochem. 2000;267:4040-4045.
Wang X, Yu J, Sreekumar A, et al. Autoantibody signatures in prostate cancer. N Engl J Med. 2005;353(12):1224-1235.
Whitman EJ, Groskopf J, Ali A, et al. PCA3 score before radical prostatectomy predicts extracapsular extension and tumor volume. J Urol. 2008;180(5):1975-1978. discussion 1978–9
Woodrum DL, Brawer MK, Partin AW, et al. Interpretation of free prostate specific antigen clinical research studies for the detection of prostate cancer. J Urol. 1998;159:5-12.
Wozny W, Schroer K, Schwall GP, et al. Differential radioactive quantification of protein abundance ratios between benign and malignant prostate tissues: cancer association of annexin A3. Proteomics. 2007;7(2):313-322.
Wynant GE, Murphy GP, Horoszewicz JS, et al. Immunoscintigraphy of prostatic cancer: preliminary results with 111In-labeled monoclonal antibody 7E11-C5.3 (CYT-356). Prostate. 1991;18(3):229-241.
Xi Z, Klokk TI, Korkmaz K, et al. Kallikrein 4 is a predominantly nuclear protein and is overexpressed in prostate cancer. Cancer Res. 2004;64:2365-2370.
Xiao Z, Adam BL, Cazares LH, et al. Quantitation of serum prostate-specific membrane antigen by a novel protein biochip immunoassay discriminates benign from malignant prostate disease. Cancer Res. 2001;61:6029-6033.
Yegnasubramanian S, Kowalski J, Gonzalgo ML, et al. Hypermethylation of CpG islands in primary and metastatic human prostate cancer. Cancer Res. 2004;64(6):1975-1986.
Young CY, Andrews PE, Montgomery BT, Tindall DJ. Tissue-specific and hormonal regulation of human prostate-specific glandular kallikrein. Biochemistry. 1992;31:818-824.
Young CY, Andrews PE, Tindall DJ. Expression and androgenic regulation of human prostate-specific kallikreins. J Androl. 1995;16:97-99.
Young CY, Montgomery BT, Andrews PE, et al. Hormonal regulation of prostate-specific antigen messenger RNA in human prostatic adenocarcinoma cell line LNCaP. Cancer Res. 1991;51:3748-3752.
Yousef GM, Diamandis EP. The new human tissue kallikrein gene family: structure, function, and association to disease. Endocr Rev. 2001;22:184-204.
Yousef GM, Diamandis EP. Human tissue kallikreins: a new enzymatic cascade pathway? Biol Chem. 2002;383:1045-1057.
Yousef GM, Kyriakopoulou LG, Scorilas A, et al. Quantitative expression of the human kallikrein gene 9 (KLK9) in ovarian cancer: a new independent and favorable prognostic marker. Cancer Res. 2001;61:7811-7818.
Yousef GM, Magklara A, Chang A, et al. Cloning of a new member of the human kallikrein gene family, KLK14, which is down-regulated in different malignancies. Cancer Res. 2001;61:3425-3431.
Yousef GM, Scorilas A, Jung K, et al. Molecular cloning of the human kallikrein 15 gene (KLK15). Up-regulation in prostate cancer. J Biol Chem. 2001;276:53-61.
Yousef GM, Stephan C, Scorilas A, et al. Differential expression of the human kallikrein gene 14 (KLK14) in normal and cancerous prostatic tissues. Prostate. 2003;56:287-292.
Yu H, Diamandis EP. Prostate-specific antigen in milk of lactating women. Clin Chem. 1995;41:54-58.
Yu H, Diamandis EP, Levesque M, et al. Ectopic production of prostate specific antigen by a breast tumor metastatic to the ovary. J Clin Lab Anal. 1994;8:251-253.
Yu H, Diamandis EP, Levesque M, et al. Expression of the prostate-specific antigen gene by a primary ovarian carcinoma. Cancer Res. 1995;55:1603-1606.
Yu H, Diamandis EP, Sutherland DJ. Immunoreactive prostate-specific antigen levels in female and male breast tumors and its association with steroid hormone receptors and patient age. Clin Biochem. 1994;27:75-79.
Yu JX, Chao L, Chao J. Prostasin is a novel human serine proteinase from seminal fluid purification, tissue distribution, and localization in prostate gland. J Biol Chem. 1994;269:18843-18848.
Yuan JJ, Coplen DE, Petros JA, et al. Effects of rectal examination, prostatic massage, ultrasonography and needle biopsy on serum prostate specific antigen levels. J Urol. 1992;147:810-814.
Zhang WM, Leinonen J, Kalkkinen N, et al. Purification and characterization of different molecular forms of prostate-specific antigen in human seminal fluid. Clin Chem. 1995;41:1567-1573.
Zielie PJ, Mobley JA, Ebb RG, et al. A novel diagnostic test for prostate cancer emerges from the determination of alpha-methylacyl-coenzyme a racemase in prostatic secretions. J Urol. 2004;172:1130-1133.