Laboratory Values for Nutritional Assessment and Monitoring
I Principles of Nutritional Laboratory Testing
Sections of this appendix were written by Mary Litchford, RD, PhD, for the previous edition of this text.
Laboratory-based nutritional testing, used to estimate nutrient availability in biologic fluids and tissues, is critical for assessment of both clinical and subclinical nutrient deficiencies. Laboratory data are the only objective data used in nutrition assessment that are “controlled”—that is, the validity of the method of its measurement is checked each time a specimen is assayed by also assaying a sample with a known value. The known sample is called a control, and if the value obtained for the sample is outside the range of normal analytic variability, both the specimen and control are measured again. The nutrition professional can use laboratory data to support subjective data and clinical assessment findings. Furthermore, because numeric values do not themselves connote personal judgment, this kind of data can often be passed on to a patient or client without implicit or perceived blame.
B Specimen Types
Ideally the specimen to be tested reflects the total body content of the nutrient to be assessed. However, often the best specimen is not readily available. The most common specimens for analysis are the following:
Whole blood—Must be collected with an anticoagulant if entire content of the blood is to be evaluated. The two common anticoagulants for whole blood analyses are ethylenediaminetetraacetic acid, a calcium chelator used in hematologic analyses, and heparin (maintains the blood in its most natural state).*
Blood cells—Separated from anticoagulated whole blood for measurement of cellular analyte content.
Plasma—The uncoagulated fluid that bathes the formed elements (blood cells).
Serum—The fluid that remains after whole blood or plasma has coagulated. Coagulation proteins and related substances are missing or significantly reduced.
Urine—Contains a concentrate of excreted metabolites.
Feces—Important in nutritional analyses when nutrients are not absorbed and therefore are present in fecal material.
Hair—An easy-to-collect tissue; usually a poor indicator of actual body levels.
Other tissues—Buccal cells and solid organ biopsy specimens are rarely used in nutrition laboratory assessment.
C Interpretation of Laboratory Data
As with all data, nutrition data may be quantitative (e.g., how much, how often, how fast), semiquantitative (e.g., many, most, few, a lot, usually, majority, several), or qualitative (e.g., color, shape, species). The advantage of quantitative data is that they are less ambiguous or more objective than other types of observations. Although objective laboratory data are extremely important resources in nutrition assessment, one should be extremely cautious about using a single isolated laboratory test value to make an assessment. One value is often misleading, especially when taken out of the context of an individual’s habits, clinical status, and dietary and medical histories. The best data are obtained from analysis of changes in laboratory values. When monitoring patients for changes in nutrition test values, one must consider how much change is necessary to give confidence that a difference is significant. The change required for statistical significance has been called the critical difference. It is calculated from measurement of the variances calculated from repeated measurements of an analyte: (1) specimens that have been obtained, at several different times, from each of several healthy persons (intrasubject variation); and (2) separate samples from a large specimen pool (analytic variation).
The critical differences for some plasma proteins of nutritional significance are the following:†

The statistical probability that two consecutive albumin measurements are statistically different requires that the concentration change by 8% or more. Therefore an albumin increase, for example, from 30 g/L to 32.4 g/L indicates that a statistically significant change has occurred. For prealbumin, an increase from 30 mg/dL to 39.6 mg/dL would be significant. There are two reasons for the large discrepancy in the critical differences for these three proteins. The major reason is that the albumin level is very stable in healthy persons, whereas prealbumin concentrations vary considerably. Also contributing to these differences is the fact that the currently available methods measure albumin more precisely than prealbumin. In practice, assessments are not based on the measurement of a single analyte at one point in time. Changes in laboratory tests may have biologic significance (e.g., patient’s condition is improving) long before statistical significance is achieved. The changes in laboratory data may precede changes in other nutritional indices, but generally, although not always, the data available should point to the same conclusion.
D Reference Ranges
To determine whether a particular laboratory value is abnormal, particularly when serial data are not available, the value is generally compared to a reference range. The reference range is constructed from a large number of test values (20 to >1000). The average value and the standard deviation for these data are determined, and the reference range is calculated from the mean ±2 standard deviations. If the sample group is representative of the reference population, the reference range will include values that reflect those found in approximately 95% of the reference population. Approximately 2.5% of this normal population will have values greater than the upper end of the reference range, and 2.5% will have values less than the lower end. This means that one normal individual in 20 would have a value below or above the reference range.
Reference ranges can be made for different populations. For example, reference ranges based on gender, age, race, and so forth, can be developed. In practice, the differences between populations are often ignored because the importance of small differences in a nutrient analyte is not usually significant. However, in the event of borderline values, the possible influence differences between the population of which the patient is a member and the reference population may need to be taken into account. Reference ranges often are determined by obtaining blood from personnel working in or near the clinical laboratory. This population is often skewed toward younger persons, has few minorities, and is overrepresented by women.
E Units
Many types of units are used in reporting nutrient-dependent laboratory values. Two basic systems of units are in common use: the conventional system and the Système Internationale d’Unités (SI) system.‡ The conventional system sometimes lacks convention; thus different laboratories adopt different units to report the same analyte. For example, the conventional report of an ionized calcium value could be 2.3 mEq/L, 46 mg/L or 4.6 mg/dL. However, in the SI system only 1.15 mmol/L is allowed.
F Nature of Nutritional Testing and Types of Tests
Typically laboratory tests are static assays (i.e., the concentration of an analyte is measured in a biologic fluid [e.g., a fasting blood specimen] at a point in time). Assessment of nutrient status made by this approach is often inaccurate or distorted. Some nutrients can be assessed by tests that are based on measurements that reflect the endogenous availability of a nutrient to a measurable biologic function (e.g., biochemical, tissue, or organ). Most often, functional assessment of nutrient status may be done by measurement of a biochemical marker (i.e., a normal or abnormal metabolite) of function. The results of this type of testing can be reliably considered to reflect the adequacy of a nutrient pool.
 New Directions
Bioelectrical Impedance Analysis (BIA)—A New Functional Test?
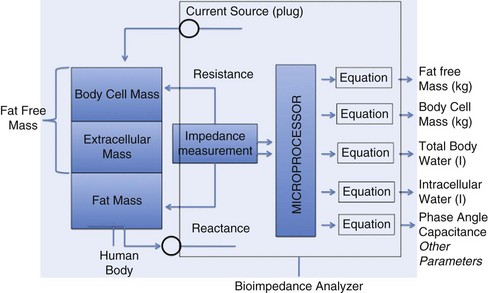
Nutrition assessment is taking on a new level of specificity with the explosion of technology and discoveries of the pathophysiology of disease and functions of the human body. These breakthroughs assist in molecular level identification of nutrition status. Bioelectrical Impedance Analysis (BIA) has a credible history of use in research, but recently has found an increasing use as a clinical tool in nutrition assessment.
BIA estimates body composition and cellular activity by measuring the bulk electrical impedance of the body. The testing procedure involves application of conductors (electrodes) to a person’s hand and foot, and sending a small alternating electric current through the body. The different electrical conductive properties of various body tissues (adipose, muscular and skeletal) affect the impedance measurement. An algorithm derived from statistical analysis of BIA measurements is used to calculate the various parameters that can be measured by this technique. Normal hydration is critical for results to be valid, with guidelines prior to testing: drink water (16-24 oz during 4 hours prior to test), and no alcohol (12 hours), food or caffeine drinks (4 hours), or exercise (12 hours) prior to test. Contraindications to BIA testing are pregnancy, or the presence of implants like pacemakers or defibrillators. Follow-up monitoring testing should attempt to be near the same time of day.
There are commercially available BIA devices that measure only body fat % and weight. But professional BIA instruments are available that provide reliable, more comprehensive data, and automatically calculate total body water, intracellular & extracellular water, fat-free mass, percent body fat, phase angle, capacitance and body cell mass. They are very useful in being to track changes in an individual’s progress over time.
The multiple parameters measured in a BIA test provide three categories of data:
1. Anthropometric: BMI, BMR, Body Fat %, and Lean Body Mass %. These measurements are used with weight management, monitoring wasting syndromes, and acute care formulation of dietary prescriptions. Weight/height/age/gender date must be entered to obtain these results.
2. Cellular metabolism: Phase angle (cell membrane fluidity/prognostic marker of mortality), Capacitance (electrical resistance cell membrane), Body Cell Mass (metabolically active cells). Using these three measurements provide an easy-to-use, non-invasive, and reproducible technique to evaluate changes in body composition and nutritional status. Phase angle (BIA) detects changes in tissue electrical properties and is hypothesized as a marker of malnutrition for investigating various diseases in the clinical setting. Lower phase angles suggest cell death or decreased cell integrity, while higher phase angles suggest large quantities of intact cell membranes (Selberg).
3. Hydration: Total Body Water (lb. & %), Intracellular water (lb. & %), Extracellular water (lb. & %) Examples for clinical use: general health management, wound care, prevention of pressure ulcers.
Every professional practicing nutrition therapy can now consider adding a reasonably priced BIA instrument to their nutritional assessment tool box so as to assist their management of a client or patient. The three companies from which professional BIA instruments can be obtained are:
These companies also provide informative education on the technology and operation of their bioimpedance instruments.
Bauer JM, et al: The Mini Nutritional Assessment (R)—its history, today’s practice, and future perspectives, Nutr Clin Pract 23:388-396, 2008.
Davis MP, et al: Bioelectrical impedance phase angle changes during hydration and prognosis in advanced cancer, Am J Hosp Palliat Care June/July 26(3):180-187, 2009.
Gupta D, et al: The relationship between bioelectrical impedance phase angle and subjective global assessment in advanced colorectal cancer, Nutrition Journal 7:19, 2008.
Gupta D, et al: Bioelectrical impedance phase angle as a prognostic indicator in breast cancer, BMC Cancer 8:249, 2008.
Hengstermann S, et al: Nutrition status and pressure ulcer: what we need for nutrition screening, JPEN J Parenter Enteral Nut 31:288-294, 2007.
Kyle UG: Bioelectrical impedance analysis-part II: utilization in clinical practice, The American Journal of Clinical Nutrition 23:1226-1243, 2004.
Methods of Body Composition Tutorials (Interactive). Dept. of Nutrition and Food Sciences, University of Vermont. http://nutrition.uvm.edu/bodycomp/ Accessed May 19, 2011.
Norman K, et al: Cutoff percentiles of bioelectrical phase angle predict functionality, quality of life, and mortality in patients with cancer, Am J Clin Nutr 92:612-619, 2010.
Selberg O, Selberg D: Norms and correlates of bioimpedance phase angle in healthy human subjects, hospitalized patients, and patients with liver cirrhosis, Eur J Appl Physiol 86:509-516, 2002.
Van Loan MD, et al: Use of bioimpedance spectroscopy (BIS) to determine extracellular fluid (ECF), intracellular fluid (ICF), total body water (TBW), and fat free mass (FFM). In Ellis K, editor: Human Body Composition: In Vivo Measurement and Studies, New York, 1993, Plenum Publishing Co., pp 6770.
A1AT, alpha 1 antitypsin; AACE, American Association of Clinical Endocrinologists; A/C ratio, albumin/globulin ratio; AGA, antigliadian antibodies; ALA, alpha linolenic acid; ALB, albumin; ALP, alkaline phosphatase; ALT, alanine amino transferase; Anti-TG, antithyroglobulin antibody; Anti-TPO, antithyroid peroxidase antibody; AST, aspartate aminotransferase; BAL, bronchoalveolar lavage; BCAA, branched-chain amino acid; BILI T/D, Bilirubin Total/Direct: BUN, blood urea nitrogen; CAPD, continuous ambulatory peritoneal dialysis; CBC, complete blood count; CD, cardiac disease; CHD, coronary heart disease; Cr, chromium; CRP, C-reactive protein; CSF, cerebrospinal fluid; CVD, cardiovascular disease; DGLA, dihomo-gammalinolenic acid; DGP, deamidated gliadin peptide antibody; DHA, docosahexaenoic acid; DNA, deoxyribonucleic acid; DRI, dietary reference intake; DRT, diet readiness test; EDTA, ethylenediaminetetraacetic acid; EFA, essential fatty acid; EMA, endomysium antibody; EPA, eicosapentaenoic acid; FAD, flavin adenine dinucleotide; FIGLU, formiminoglutamic acid; FBG, fasting blood glucose; FBS, fasting blood sugar; FPG, fasting plasma glucose; FRAP, ferric-reducing ability of plasma; GGT, gamma glutamyl transferase; GH, growth hormone; GI, gastrointestinal; GLOB, globulin; GOT, glutamic-oxalacetic transaminase; GPT, glutamic-pyruvate transaminase; GR, glutathione reductase; GU, urea generation rate; HBT-lactose, hydrogen breath test-lactose; HBT-fructose, hydrogen breath test-fructose; HCT, hematocrit; Hcy, homocysteine; Hgb, hemoglobin; HLA, human leukocyte antigen; HPLC, high performance liquid chromotography; hs-CRP, high-sensitivity C-reactive protein; I, iodine; ICA, ionized calcium; Ig, immunoglobulin; IGF, insulin-like growth factor; IGT, impaired glucose tolerance; IV, intravenously; KrU, residual renal urea clearance; Kt/Vurea, urea kinetics(kinetic dialyzer) x time(min)/volume urea(ml); LA, linoleic acid; LDL, low-density lipoprotein; MCV, mean cell volume; MLC, mixed lymphocyte culture; N, nitrogen; NCEP, National Cholesterol Education Program; NSAID, nonsteroidal antiinflammatory disease; nPCR, normalized protein catabolic rate; ORAC, oxygen radical absorbance capacity; PAB, prealbumin; PCR, protein catabolic rate; PEM, protein-energy malnutriton; PLP, pyridoxal phosphate; PNA, protein equivalent of nitrogen appearance; PT, prothrombin time; PTH, parathyroid hormone; PTT, partial thromboplastin time; PUFA, polyunsaturated fatty acid; RBC, red blood cell; RBP, retinol-binding protein; RDW, RBC distribution width; ROS, reaction oxygen species; RXR, retinoid X receptor; SAMe, s-adenosylmethionine; SNP, single nucleotide polymorphism; T3, triiodothyronine; T4, thyroxine; T1DM, type 1 diabetes mellitus; TEAC, trolox-equivalent antioxidant capacity; Tf-sat, transferrin saturation; TG, triglyceride; TIBC, total iron-binding capacity; TLC, total lymphocyte count; TP, total protein; TPN, total parenteral nutrition; TPP, thiamin pyrophosphate; Trp, tryptophan; TSAT, transferrin saturation; tTG, tissue transglutaminase; TUN, total urinary nitrogen; U : Cr, urea/creatine ratio; UUN, urea urinary nitrogen; VLDL, very-low-density lipoprotein; WBC, white blood cell; XA, xanthuric acid.
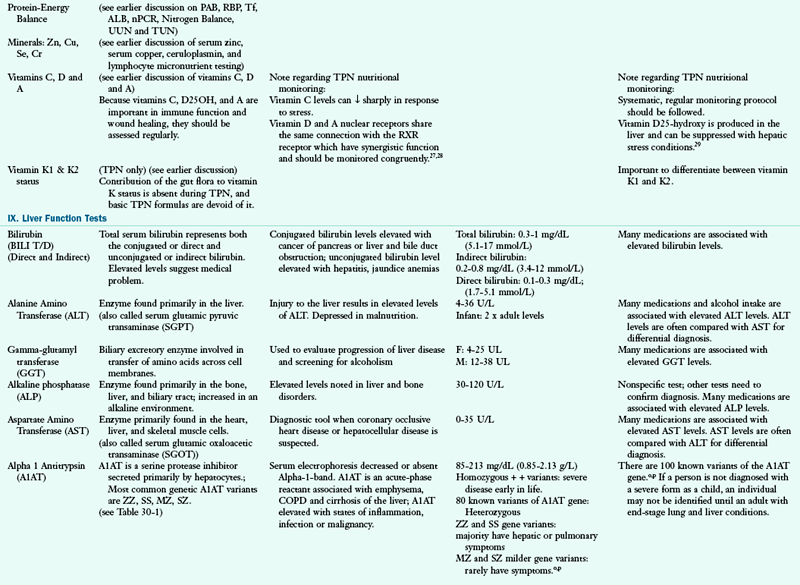
f PLP is a rate-limiting co-enzyme in the transamination of amino acids (ALT and AST). PLP found primarily in liver and muscles.
j These tests are combined with serum glucose, creatinine, and BUN on a test battery or panel. This set of tests is among the first and most frequently administered laboratory tests.
1Parrish CR, Series Ed: Serum proteins as markers of nutrition: what are we treating? Nutr Issues in Gastroenterology, Series 43, Prac Gastroenterol October, 2006.
2Juarez-Congelosi M et al: Normalized protein catabolic rate versus serum albumin as a nutrition status marker in pediatric patients receiving hemodialysis, J Renal Nutr 17 (4):269, 2007.
3Harty JC et al: The normalized protein catabolic rate is a flawed marker of nutrition in CAPD patients, Kidney Int 45:103, 1994.
4Beck FK, Rosenthal TC: Prealbumin: a marker for nutritional evaluation, Am Fam Physician 65:1575, 2002.
5Wu X et al: Joint effect of insulin-like growth factors and mutagen sensitivity in lung cancer risk, J Natl Cancer Inst 92:737, 2000.
6Rowlands MA: Circulating insulin-like growth factor peptides and prostate cancer risk: a systematic review and meta-analysis, Int J Cancer 124:2416, 2009.
7Gonen B et al: Haemoglobin A1: An indicator of the metabolic control of diabetic patients, Lancet 2(8041):734, 1977.
8Riese H et al: Covariance of metabolic and hemostatic risk indicators in men and women, Fibrinolysis Proteolysis 15(1):9, 2001.
9Bo S et al: Dietary magnesium and fiber intakes and inflammatory and metabolic indicators in middle-aged subjects from a population-based cohort 1,2,3, Am J Clin Nutr 84:1062, 2006.
10Douglas D: MedScape Today News. Improved Diagnosis Does Not Change Celiac Mortality, Reuters Health Information, Feb 1, 2011.
11Grainge MJ et al: Causes of Death in People With Celiac Disease Spanning the Pre- and Post-Serology Era: A Population-Based Cohort Study From Derby, UK, Am J of Gastroenterol 106:933, 2011.
12Lewis NR: Risk of Morbidity in Contemporary Celiac Disease, Expert Rev Gastroenterol and Hepatol 4:767, 2010.
13Donaldson MR et al: Strongly positive tissue transglutaminase antibodies are assodciated with Marsh 3 histopathology in adult and pediatric celiac disease. J Clin Gastroenterol 42:256, 2008.
14Vermeersch P et al: Use of likelihood ratios improves clinical interpretation of IgG and IgA anti-DGP antibody testing for celiac disease in adults and children, Clin Biochem 44:248, 2011.
15Vermeersch P et al: Diagnostic performance of IgG anti-deamidated gliadin peptide antibody assays is comparable to IgA anti-tTG in celiac disease, Clin ChimActa 411:931, 2010.
16Sharifi N et al: Celiac disease in patients with type-1 diabetes mellitus screened by tissue transglutaminase antibodies in northwest of Iran, Int J Diab Dev Ctries 28:95, 2008.
17Lampasona V et al: Antibodies to tissue transglutaminase C in type I diabetes, Diabetologia 42:1195, 1999.
18Holopainena P et al: Candidate gene regions and genetic heterogeneity in gluten sensitivity, Gut 48:696, 2001.
19Feingold KR et al: Infection decreases fatty acid oxidation and nuclear hormone receptors in the diaphragm, J Lipid Res 50:2055, 2009.
20Lord R, Bralley JA, editors: Laboratory evaluations for integrative and functional medicine, ed 2, Duluth, GA, 2008, MetaMetrix Institute.
21Sypniewska G: Pro-inflammatory and prothrombotic factors and metabolic syndrome, Department of Laboratory Medicine, Collegium Medicum, Nicolae Copernicus University, Bydgoszcz, Poland, 2007.
22Ng KY et al: Vitamin D and vitamin A receptor expression and the proliferative effects of ligand activation of these receptors on the development of pancreatic progenitor cells derived from human fetal pancreas, Stem Cell Rev 7:53, 2011.
23Aslam A et al: Vitamin E deficiency induced neurological disease in common variable immunodeficiency: two cases and a review of the literature of vitamin E deficiency, Clin Immunol 112(1):24, 2004.
24Kim K et al: Associations of visceral adiposity and exercise participation with C-reactive protein, insulin resistance, and endothelial dysfunction in Korean healthy adults, Metabolism 57:1181, 2008.
25Finney L et al: Copper and angiogenesis: unravelling a relationship key to cancer progression, Clin Exp Pharmacol Physiol 36:88, 2009.
26Charney P, Malone AM: ADA pocket guide to nutrition assessment, ed 2, Chicago, IL, 2009, American Dietetic Association.
27Snellman G et al: Determining vitamin D status: a comparison between commercially available assays, PLoS One 5(7):e11555, 2010.
28Katz K et al: Suspected Nonalcoholic Fatty Liver Disease Is Not Associated with Vitamin D Status in Adolescents after Adjustment for Obesity, J Obes 2010; 2010. Published online Feb. 2011.
29Ahmed A: The role of 11b-hydroxysteroid dehydrogenase type 1 and hepatic glucocorticoid metabolism in the metabolic syndrome, Doctoral thesis to College of Medical and Dental Sciences, University of Birmingham, 2010.
30Yu W et al: RXR: a coregulator that enhances binding of retinoic acid, thyroid hormone, and vitamin D receptors to their cognate response elements, Cell 67:1251, 1991.
31Longnecker MP, Michalek JE: Serum dioxin level in relation to diabetes mellitus among Air Force veterans with background levels of exposure, Epidemiol 11:44, 2000.
aFactor = 5.95 for TPN; reflects severity of metabolic stress.
bFactor = 5.95 for TPN; reflects severity of metabolic stress; TUN gives the most accurate estimation of total protein catabolism.
cRed blood cells are separated from plasma by centrifugation and washed with saline; after hemolyzing the cells, the intracellular material is analyzed for vitamin availability.
dNo biochemical tests have been developed to assess B3 status; the fraction of whole blood niacin as NAD is a potentially useful test (see Powers HJ: Current knowledge concerning optimum nutritional status of riboflavin, niacin, and pyridoxine, Proc Nutr Soc 58:435, 1999).
eALT and GPT are the same enzyme; AST and GOT are the same enzyme.
gMicrobiologic growth assays, the deoxyuridine suppression test, and recently developed research tests for folate and vitamin B12 are not generally offered in the contemporary clinical laboratory.
hMore sensitive procedures for measurement of vitamin K include serum chromatography and determination of the serum level of vitamin K–dependent bone protein called osteocalcin. Deficiency significantly increases the amount of abnormal forms of this protein. These tests are not yet widely available.
iThese substances are measured by similar techniques when the concentration in urine or other body fluids is determined.
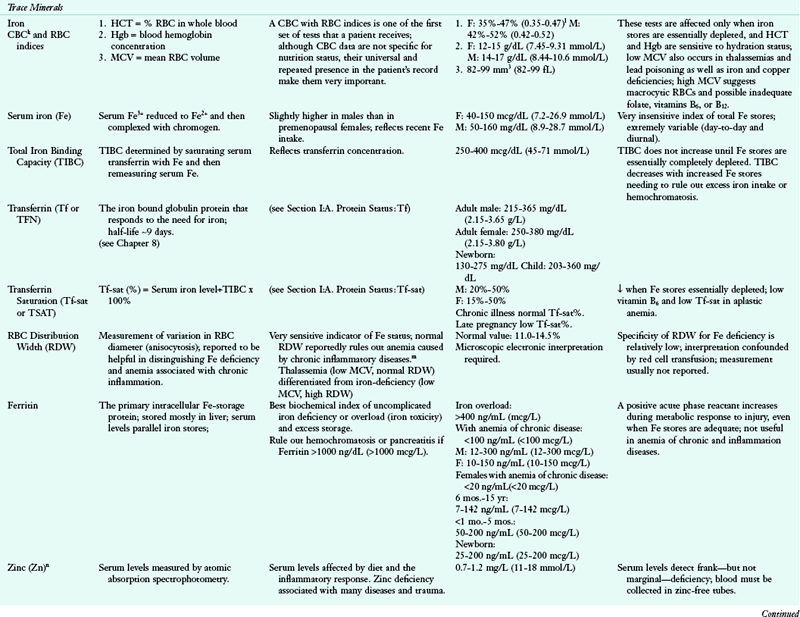
kThe CBC includes the red cell count, the red cell indices, Hb concentration, HCT, MCV, mean cell hemoglobin (MCH), mean cell hemoglobin concentration (MCHC), and white cell and platelet counts. Only HCT, Hb, and MCV are discussed here (see Savage RA: The red cell indices: yesterday, today, and tomorrow, Clin Lab Med 13:773-785, 1993).
lRanges are for adult men and premenopausal women. Pregnant women, infants, and children have different reference ranges.
mSee van Zeben D et al: Evaluation of microcytosis using serum ferritin and red cell distribution width, Eur J Haematol 44:106-109, 1990.
nTaste acuity tests can be used to supplement laboratory methods (see, e.g., Gibson RS et al: A growth limiting mild zinc deficiency syndrome in some Southern Ontario boys with low growth percentiles, Am J Clin Nutr 49:1266,1989)
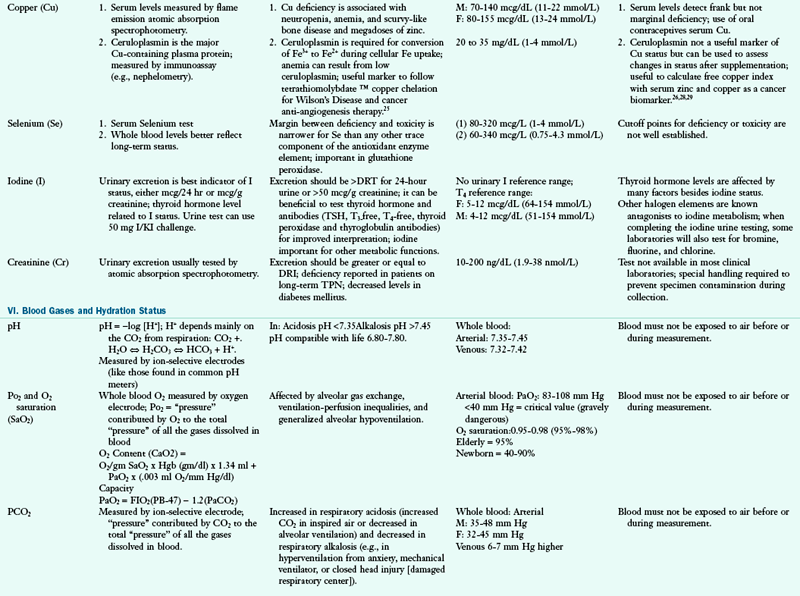
oAACE supports target TSH level between 0.3- and 3.0 mIU/mL to reduce the incidence of risks associated with subclinical hypothyroidism. AACE Task Force Thyroid Guidelines, Endocr Pract. 8:466, 2002.
pMore recent awareness of the highly undiagnosed common disease of A1AT is improving education of healthcare providers regarding this condition. Kohnlein, T, Welte T: alpha-1 antitrypsin deficiency: pathogenesis, clinical presentation, diagnosis, and treatment, The Am J of Med 121:3, 2008.
qorganic acid functional markers for metabolic effects of micronutrient inadequacies, toxic exposure, neuroendocrine activity and intestinal bacterial overgrowth. Lord R, Bralley J: Organics in urine: assessment of gut dysbiosis, nutrient deficiencies and toxemia. Nutr Pers 1997:20:25.
*Samples obtained for blood coagulation tests are diluted with solutions containing sodium citrate (a calcium chelator). Because of the dilutional effect of the anticoagulant solutions, citrated samples are not suitable for measurement of the concentrations of analytes.
†Clark GH, Fraser CG: Biological variation of acute phase proteins, Ann Clin Biochem 30:373, 1993.
‡Monsen ER: The Journal adopts SI units for clinical laboratory values, J Am Diet Assoc 37:356, 1987.