Growth Measurements
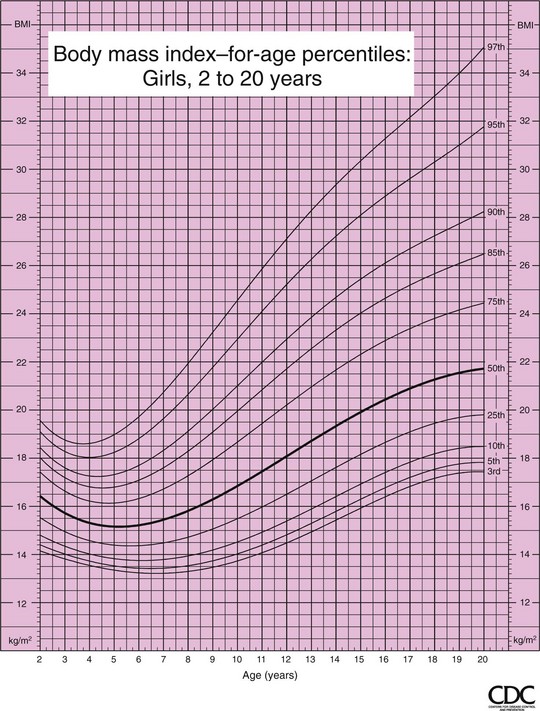
Body Mass Index Formula

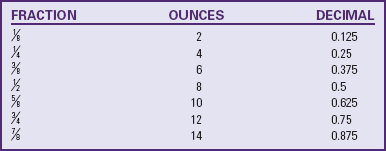
Fractions and ounces must be entered as decimal values.
 inches tall.


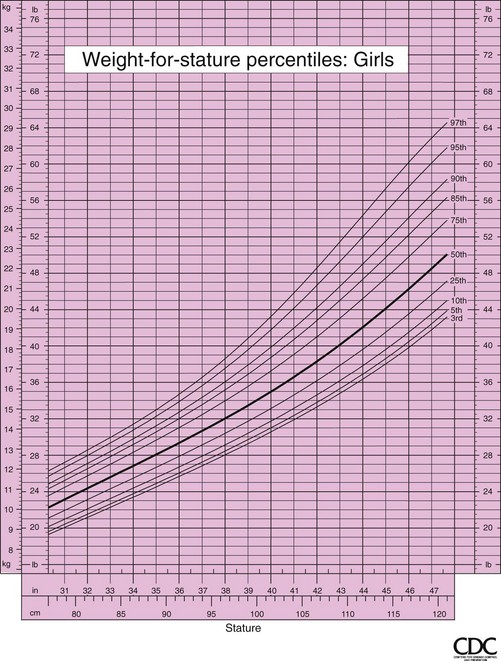
Example: A 16.9-kg child is 105.2 cm tall.

From Kuczmarski RJ, et al: CDC growth charts: United States: advance data from vital and health statistics, no 314, Hyattsville, Md, June 8, 2000, National Center for Health Statistics; retrieved from www.cdc.gov/nchs/about/major/nhanes/growthcharts/fullreport.htm.
HEIGHT AND WEIGHT MEASUREMENTS FOR BOYS
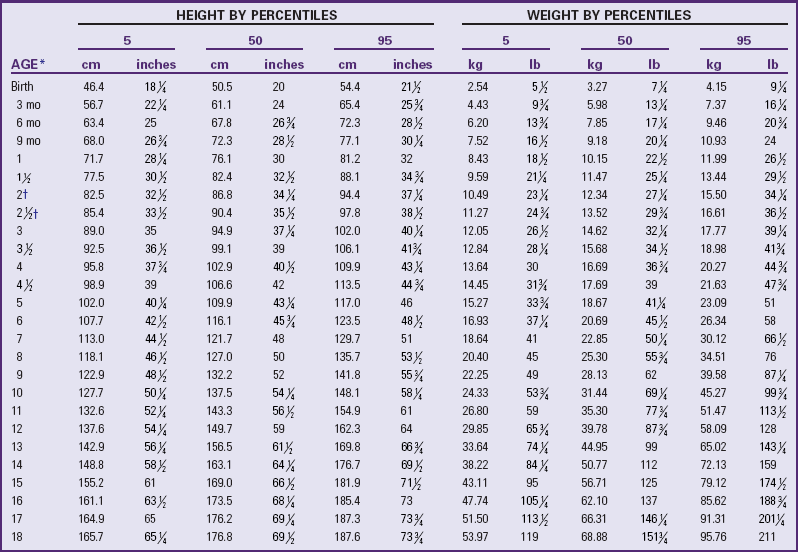
Conversion of metric data to approximate inches and pounds by Ross Laboratories.
*Years unless otherwise indicated.
†Height data include some recumbent length measurements, which make values slightly higher than if all measurements had been of stature (standing height).
Modified from National Center for Health Statistics, Health Resources Administration, Department of Health, Education and Welfare, Hyattsville, Md.
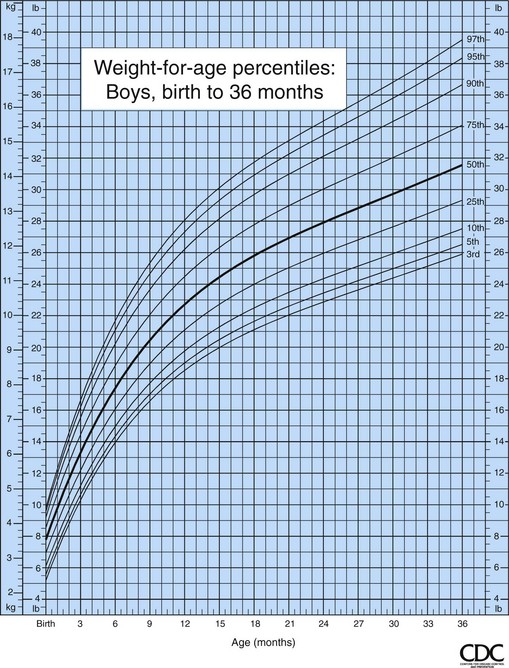
Fig. B-1 Weight-for-age percentiles, boys, birth to 36 months, CDC growth charts: United States. (Developed by the National Center for Health Statistics in collaboration with the National Center for Chronic Disease Prevention and Health Promotion, 2000.)
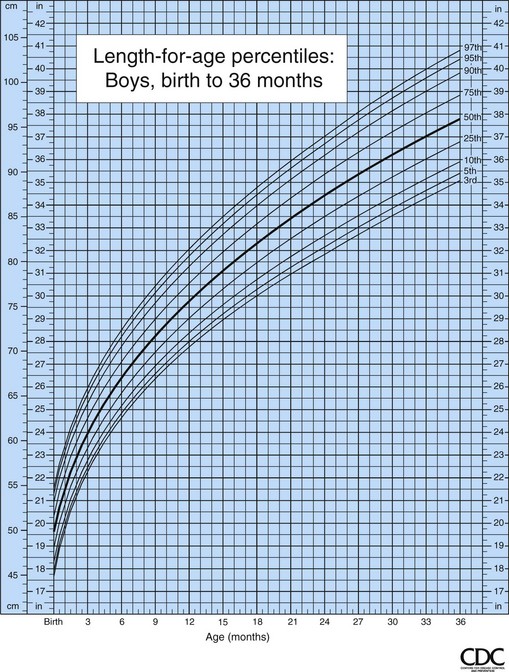
Fig. B-2 Length-for-age percentiles, boys, birth to 36 months, CDC growth charts: United States. (Developed by the National Center for Health Statistics in collaboration with the National Center for Chronic Disease Prevention and Health Promotion, 2000.)
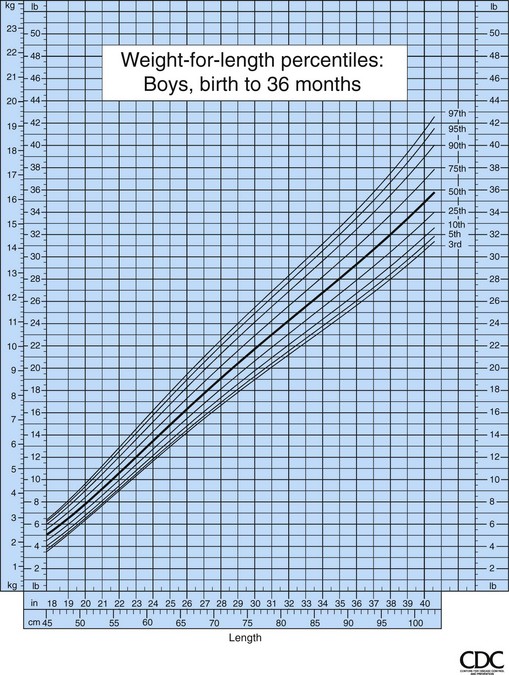
Fig. B-3 Weight-for-length percentiles, boys, birth to 36 months, CDC growth charts: United States. (Developed by the National Center for Health Statistics in collaboration with the National Center for Chronic Disease Prevention and Health Promotion, 2000.)
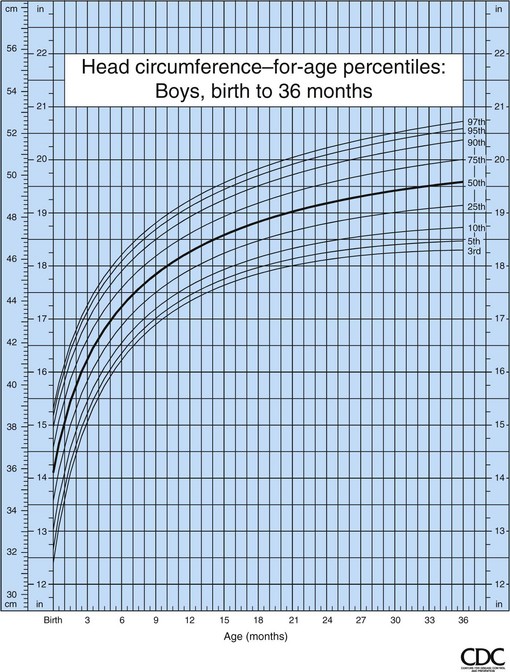
Fig. B-4 Head circumference–for-age percentiles, boys, birth to 36 months, CDC growth charts: United States. (Developed by the National Center for Health Statistics in collaboration with the National Center for Chronic Disease Prevention and Health Promotion, 2000.)
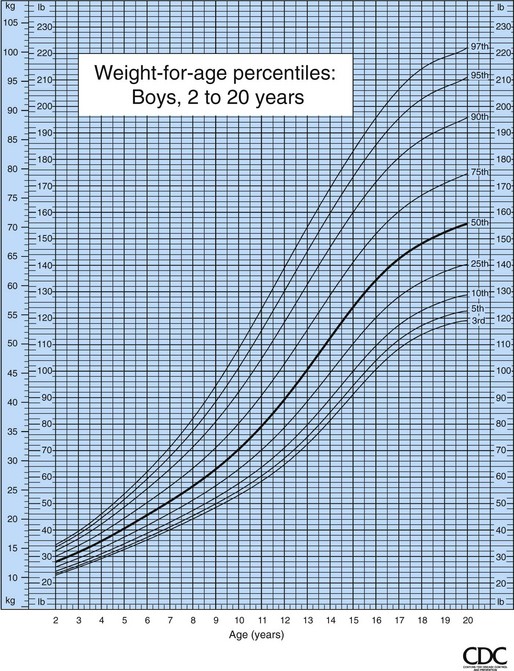
Fig. B-5 Weight-for-age percentiles, boys, 2 to 20 years, CDC growth charts: United States. (Developed by the National Center for Health Statistics in collaboration with the National Center for Chronic Disease Prevention and Health Promotion, 2000.)
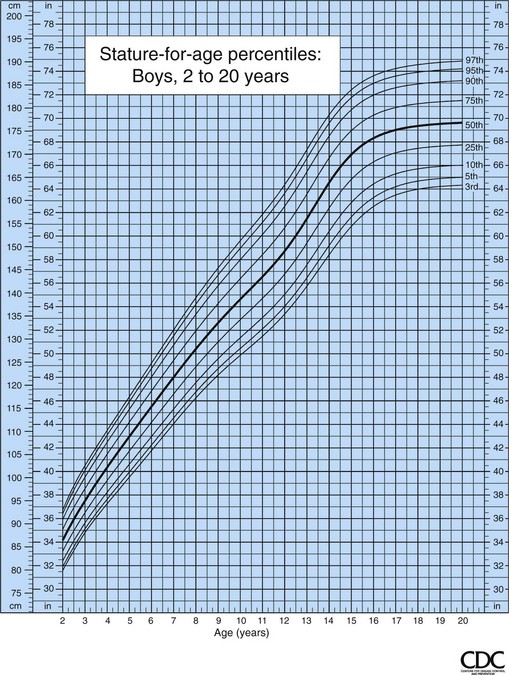
Fig. B-6 Stature-for-age percentiles, boys, 2 to 20 years, CDC growth charts: United States. (Developed by the National Center for Health Statistics in collaboration with the National Center for Chronic Disease Prevention and Health Promotion, 2000.)
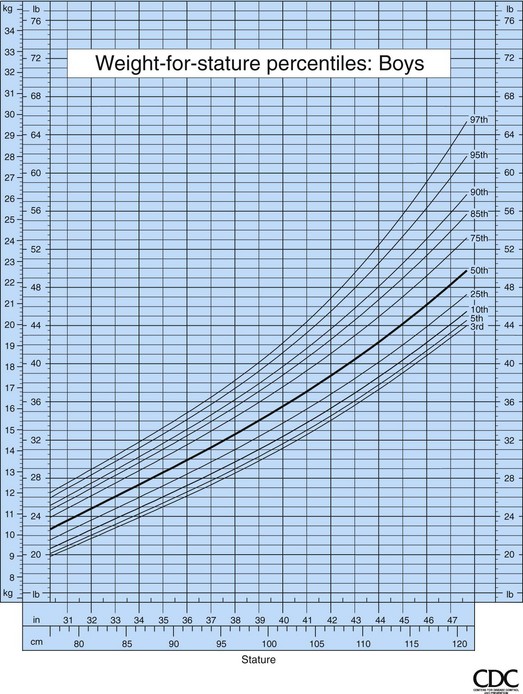
Fig. B-7 Weight-for-stature percentiles, boys, CDC growth charts: United States. (Developed by the National Center for Health Statistics in collaboration with the National Center for Chronic Disease Prevention and Health Promotion, 2000.)
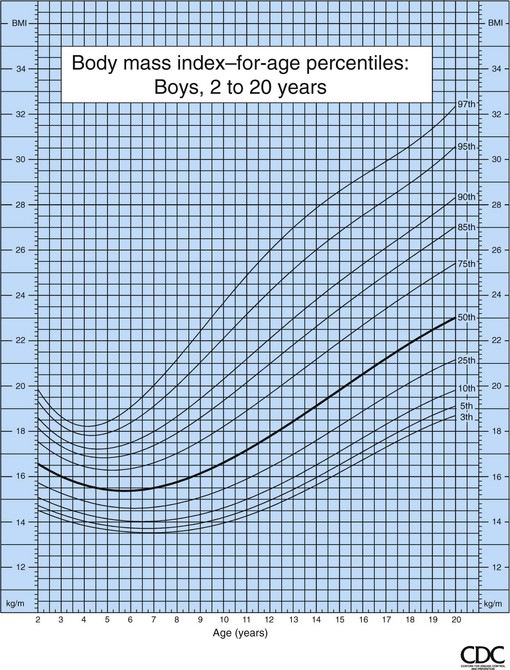
Fig. B-8 Body mass index–for-age percentiles, boys, 2 to 20 years, CDC growth charts: United States. (Developed by the National Center for Health Statistics in collaboration with the National Center for Chronic Disease Prevention and Health Promotion, 2000.)
HEIGHT AND WEIGHT MEASUREMENTS FOR GIRLS
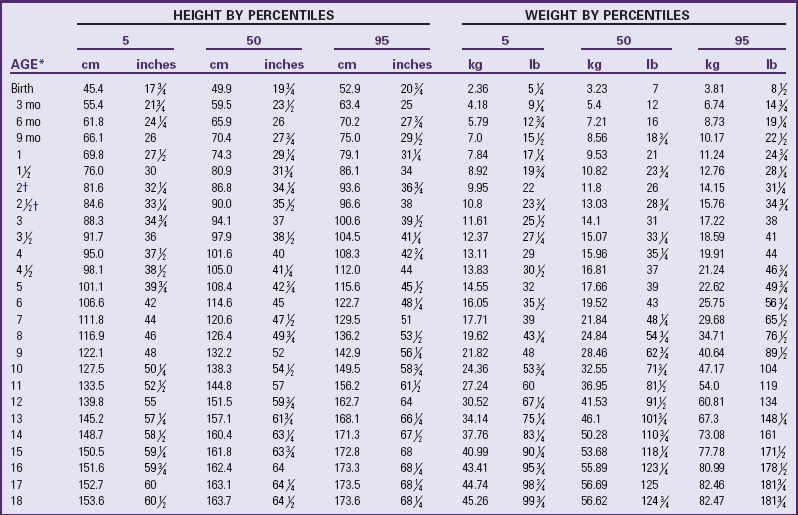
Conversion of metric data to approximate inches and pounds by Ross Laboratories.
*Years unless otherwise indicated.
†Height data include some recumbent length measurements, which make values slightly higher than if all measurements had been of stature.
Modified from National Center for Health Statistics, Health Resources Administration, Department of Health, Education and Welfare, Hyattsville, Md.
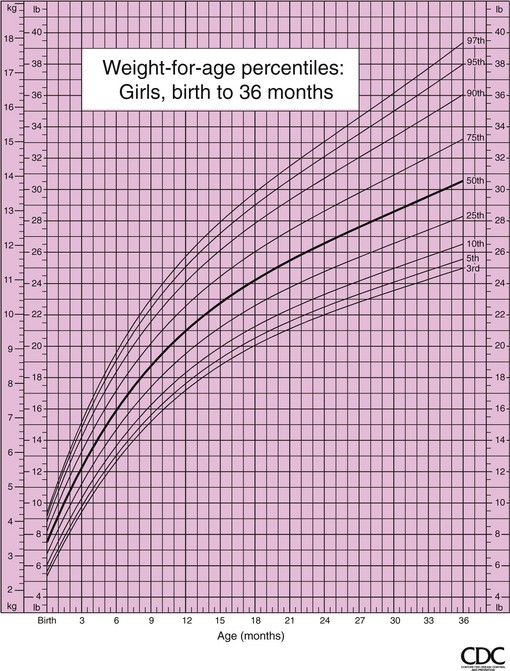
Fig. B-9 Weight-for-age percentiles, girls, birth to 36 months, CDC growth charts: United States. (Developed by the National Center for Health Statistics in collaboration with the National Center for Chronic Disease Prevention and Health Promotion, 2000.)
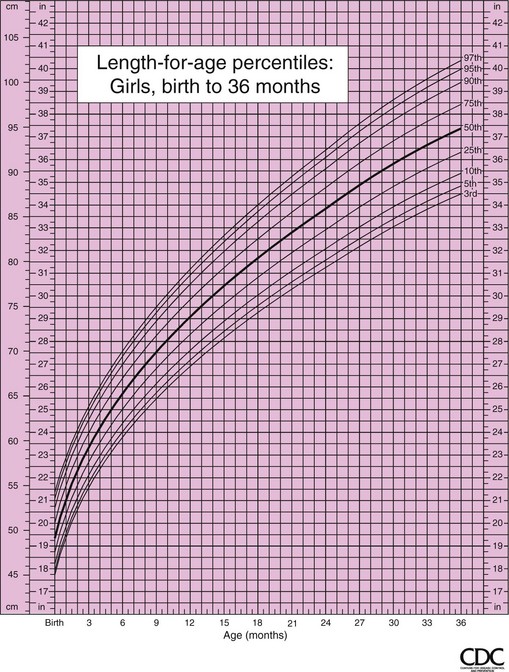
Fig. B-10 Length-for-age percentiles, girls, birth to 36 months, CDC growth charts: United States. (Developed by the National Center for Health Statistics in collaboration with the National Center for Chronic Disease Prevention and Health Promotion, 2000.)
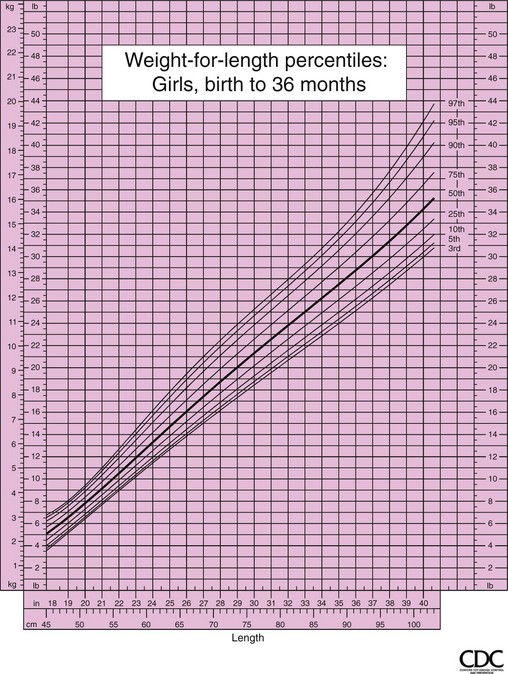
Fig. B-11 Weight-for-length percentiles, girls, birth to 36 months, CDC growth charts: United States. (Developed by the National Center for Health Statistics in collaboration with the National Center for Chronic Disease Prevention and Health Promotion, 2000.)
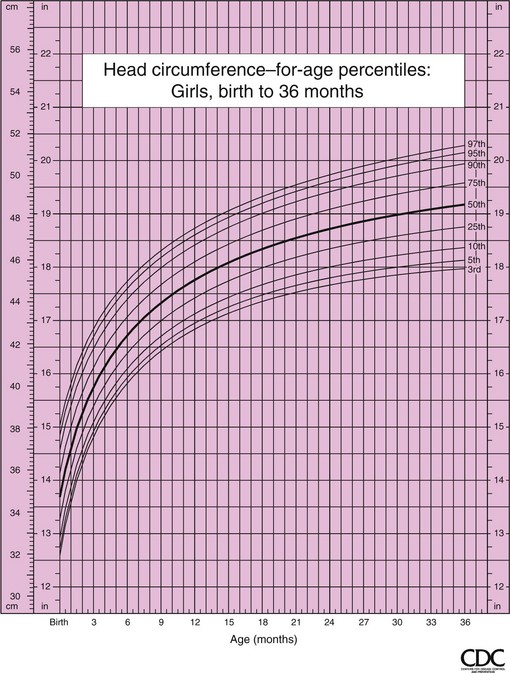
Fig. B-12 Head circumference–for-age percentiles, girls, birth to 36 months, CDC growth charts: United States. (Developed by the National Center for Health Statistics in collaboration with the National Center for Chronic Disease Prevention and Health Promotion, 2000.)
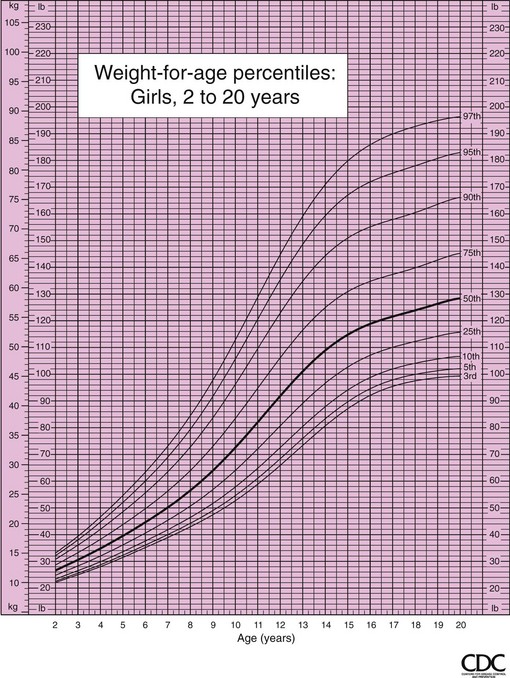
Fig. B-13 Weight-for-age percentiles, girls, 2 to 20 years, CDC growth charts: United States. (Developed by the National Center for Health Statistics in collaboration with the National Center for Chronic Disease Prevention and Health Promotion, 2000.)
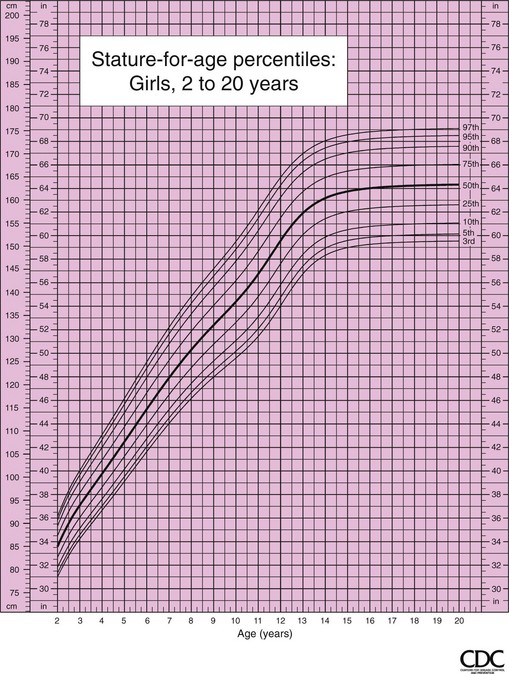
Fig. B-14 Stature-for-age percentiles, girls, 2 to 20 years, CDC growth charts: United States. (Developed by the National Center for Health Statistics in collaboration with the National Center for Chronic Disease Prevention and Health Promotion, 2000.)