Positron Emission Tomography/Computed Tomography Scanners*
Computed tomography (CT) of the patient can provide exquisite anatomical detail that is often invaluable for diagnosis. On the other hand, positron emission tomography (PET) provides functional information regarding the patient. For example, malignant tumors tend to be more highly metabolic because of a higher rate of glycolysis than surrounding normal tissue. Therefore, a radioactive pharmaceutical that distributes in the body according to glucose metabolic rate, such as fluorine-18–labeled 2-fluoro-2-deoxy-D-glucose (FDG) can yield additional diagnostic information to that provided by the CT scan. However, the FDG PET scan lacks anatomical detail, and thus it is often difficult to accurately localize features with high uptake. For these reasons, it is extremely useful, if not essential, to correlate the functional information provided by PET with the anatomy shown on CT. In many cases, viewing the PET and CT studies separately is adequate to make the diagnosis, but in a number of cases it is very helpful to “register” the two data sets such that they are displayed as a single “fused” image. Figure 16-1, A, shows a small region with high FDG uptake, but it is difficult to discern where within the thorax the feature resides. In Figure 16-1, B, the registered PET study is shown overlaid on the CT scan and it is much easier to determine its location. This registration and fusion of the PET and CT data can be performed either by using software approaches that determine the transformation that will best match the PET to the CT or by using a hybrid PET/CT scanner that combines both modalities into a single gantry. This chapter briefly describes the basics behind PET imaging, basic approaches to PET and PET/CT instrumentation, imaging considerations, and a review of some of the clinical applications for PET and PET/CT.
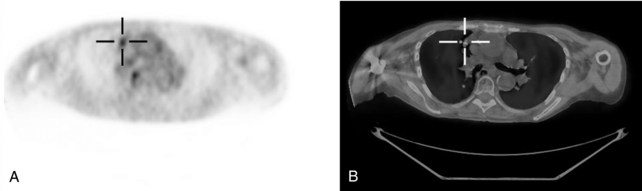
FIGURE 16-1 PET/CT scan of lung tumor. A, FDG PET scan of patient with a lung tumor. Although the tumor clearly shows enhanced uptake, it is difficult to localize. B, PET is overlaid on the registered CT scan, and the tumor can be localized much more easily.
PRINCIPLES OF POSITRON EMISSION TOMOGRAPHY IMAGING
The atomic nucleus contains a number of protons and neutrons. In some instances, there may be too many of one or the other or they may be configured in such a way as to make the nucleus unstable. Such atoms are said to be “radioactive.” In these cases, the nucleus may seek to become more stable by undergoing a nuclear transformation with the emission of a particle such as a γ ray or an α or β particle. If the nucleus contains too many protons, the nucleus may transform itself by emitting a positive β particle, also known as a positron, or by capturing an orbital electron. A positron is a positively charged β particle. It has the same mass as an electron but a positive rather than a negative charge (Cherry et al, 2003; Evans, 1982). One of the advantages of PET compared with other nuclear imaging is that many of the radioactive isotopes of elements of biological interest, such as carbon, oxygen, and nitrogen, are positron emitters, and therefore pharmaceuticals incorporating these radioisotopes can be imaged with a PET scanner. In addition, radioactive fluorine can also be very useful because it can often be chemically substituted for a hydrogen atom or a hydroxyl (OH) group. Thus, radiopharmaceuticals such as oxygen-15–labeled water, nitrogen-13–labeled ammonia, carbon-11–labeled methionine, carbon-11–labeled raclopride, or FDG can be produced. These are administered to a patient and the in vivo distribution can be imaged with a PET scanner. Such studies can provide quantitative in vivo images of blood flow, protein synthesis, neuroreceptor site density, or glucose metabolic rate.
Consider an 18F-labeled radiopharmaceutical that has been administered to a patient and one of the 18F atoms has been incorporated into the cell of a tumor. As shown in Figure 16-2, after some time the 18F atom will transform to an oxygen-18 atom by emitting a positron. The positron will travel several millimeters (mm) in the tissue until it loses most of its kinetic energy, at which point it will combine with a neighboring electron to form an entity known as positronium. After a very short time (≈10−10 seconds), the positron-electron pair will “annihilate,” converting its mass into two photons that are emitted back to back, almost exactly in opposite directions. The energy of the two photons is determined using Einstein’s equation:
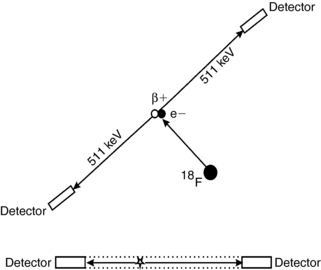
FIGURE 16-2 Annihilation coincidence detection. The positron (or β+) is emitted from the 18F atom and combines with an electron, and the pair annihilate, leading to two 511-keV photons. The site of the annihilation is assumed to be located along the line that connects the two detectors, the “LOR.”

where m is the mass of the electron (or positron) and c is the speed of light. Therefore, the two photons each have energy of 511 kiloelectron volts (keV).
If each of these photons interact with detectors on opposite sides of the PET scanner and are detected within a short time window (5-15 nanoseconds [i.e., 5-15 × 10−9 seconds]), a “coincidence” detection occurs, and the annihilation event can be assumed to have occurred along the line that connects the two detectors, referred to as the line of response (LOR). More accurately, the event can be localized to within the envelope defined by the two detectors and shown as the dotted lines in Figure 16-2. Thus, to a first approximation, the spatial resolution of a PET scanner is determined by the size of the radiation detectors used in the scanner. Therefore, if the scanner uses 4-mm detectors, the spatial resolution can be assumed to be about 4 mm. Modern clinical PET scanners use detectors between 4 and 7 mm in size. On the other hand, even if the annihilation event could be localized exactly, this is really not the locus of interested. One really wants to know from where was the positron emitted (i.e., the location of the 18F atom within the tissue). Because the positron traveled several mm before annihilation (referred to as the positron range), the radiopharmaceutical distribution cannot be localized exactly. In addition, the two photons may not be emitted at exactly 180 degrees to each other. If the positron-electron pair was not completely at rest when annihilation occurred, conservation of momentum would dictate that they would be emitted at an angle slightly different than 180 degrees. These two factors, the positron range and the slight noncolinearity of the two photons, lead to the best possible spatial resolution that could be obtained, even in a perfect PET scanner, of about 3 mm for a whole-body PET scanner and 1 mm for a small-bore animal PET scanner (Levin and Hoffman, 1999; Palmer et al, 2005).
Two small detectors on either side of the patient would not collect very many photons, and thus the placement of a large number of small detectors about the patient is necessary to acquire high-resolution PET data in a reasonable amount of time. In Figure 16-3, a single detector on one side of the patient is not only in coincidence with one detector on the opposite side but with several hundred detectors. In this manner, each detector maps out a fan beam with the detectors on the opposite side with which they are in coincidence. In a single ring, there may be as many as 500 to 700 small detectors. To acquire PET data simultaneously from a number of imaging planes, several detector rings can be placed back to back. Thus, a single detector module becomes a rectangular mosaic of small detectors (Casey and Nutt, 1986). Figure 16-4 shows a detector block from a PET scanner that is a 6 × 6 array of small scintillating detectors with two dual-channel photomultiplier tubes behind it. In this case, each scintillating detector measures 4 × 8 mm, so the entire 6 × 6 array is 24 × 48 mm. By taking the weighted sum of the signal from the photomultiplier tubes, the system determines within which of the 36 detectors the interaction occurred. A modern PET scanner may have several hundred such blocks of detectors and, thereby, the scanner contains a total of tens of thousands of small scintillating detectors.
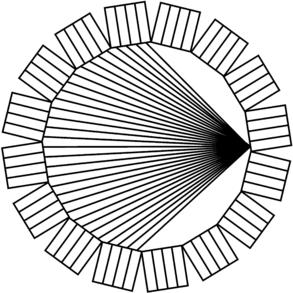
FIGURE 16-3 Ring of detectors. In a modern PET scanner, the object is surrounded by a ring of detectors. A single detector is allowed to be in coincidence with many detectors on the opposite side of the scanner.

FIGURE 16-4 Block detector module from a PET scanner. A single detector module from a PET scanner consisting of a rectangular array of small detector elements and a photomultiplier tube array.
Not all coincidence detection events are of the same quality as shown in Figure 16-5. When both annihilation photons exit the patient without incident and are detected in coincidence, this is referred to as a true coincidence detection. This is shown at the top of Figure 16-5. However, there is a possibility that one of the photons will undergo Compton scattering before exiting the patient, as shown in the middle of Figure 16-5. In this case the LOR associated with this coincidence detection may not pass through the annihilation event and therefore does not accurately localize the event. This is referred to as a scatter coincidence detection. Last, there is a possibility at higher count rates that two independent events occur simultaneously and that two photons are randomly detected in coincidence, as shown at the bottom of Figure 16-5. The resulting LOR does not accurately localize either annihilation event. This is referred to as a random or accidental coincident detection, and, without compensation, leads to background activity that reduces image contrast. The random coincidence rate can be reduced by either reducing the detector count rates or by reducing the coincidence timing window (Hoffman and Phelps, 1986).
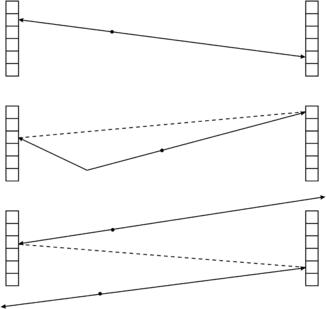
FIGURE 16-5 True, scatter, and random coincidence events. If an annihilation event occurs and the two 511-keV annihilation photons are detected without incident, this is referred to as a “true” coincidence event (top). If one of the photons scatters before detection, this is referred to as a “scatter” coincidence event (middle). If two unrelated events are detected at the same time, this is referred to as a “random” coincidence event (bottom).
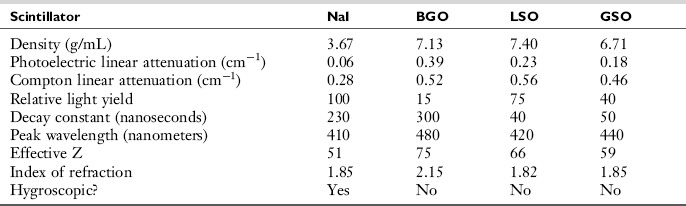
The crystals used in the construction of PET scanner detectors in PET scanners are scintillators. Photons interact in the crystal resulting in the emission of light, which is collected by an array of photomultiplier tubes as shown in Figure 16-4. Table 16-1 lists some common scintillating materials that have been used for PET detectors. Sodium iodide (NaI), the material used in γ cameras, emits the most light per photon, and thereby yields the best energy resolution. However, the lower density and lower effective Z number (the average number of protons per atom) leads to lower detection efficiency (i.e., a smaller fraction of the photons that strike the detector will interact). Bismuth germanate (BGO) has both a higher density and effective Z number, and therefore higher detection efficiency. However, both NaI and BGO emit their scintillation light rather slowly and thus require a 12-nanosecond coincidence timing window. Lutetium oxyorthosilicate (LSO) and gadolinium oxyorthosilicate (GSO) are newer scintillating materials that have reasonably high detection efficiency (densities and effective Z numbers almost as high as that of BGO) and emit their light much more quickly (Daghighian et al, 1993; Surti et al, 2000). This allows the coincidence timing window to be reduced by at least a factor of two (from 12 to 5 or 6 nanoseconds). Because the random coincidence rate is proportional to the coincidence timing window, this results in a corresponding reduction in randoms rate.
One approach to reducing scatter coincidences is to introduce absorbing septa between the detector rings. These septa act similarly to the antiscatter grids routinely used in radiography and thereby greatly reduce interplanar scatter within the scanner. In addition, these septa can reduce the contributions to the random coincidence rate attributed to activity that is outside the axial field of view. For example, in imaging the neck of a patient, photons from activity in the brain can increase the detector count rates and thereby the randoms coincidence count rate. However, placement of interplane septa will shield the detectors from this out-of-field activity, leading to a reduction in the random coincidence rate. With the septa in place, detectors are allowed to be in coincidence with either detectors in the same ring or adjacent rings, and thus the data can be reconstructed as a series of two-dimensional (2D) transverse planes. This is referred to as 2D PET acquisition mode. Removal of the septa will allow detectors in one ring to be in coincidence with detectors from many rings. Acquiring PET data without the use of interplane septa is referred to as three-dimensional (3D) PET acquisition mode because a 3D algorithm must be used for its reconstruction. The use of 3D mode leads to a substantial increase in sensitivity, particularly in the center of the axial field of view. In the center of the scanner, the sensitivity may be as much as ten times higher for 3D mode compared with 2D mode. However, on the periphery of the axial field of view, the sensitivity is not different than for 2D, and thus the overall sensitivity gain is about a factor of 4 or 5. The disadvantage of 3D mode compared with 2D mode is the higher scatter fraction (35%-50% for 3D compared with 10%-20% for 2D) and increased random coincidences from activity out of the field of view. For these reasons, 3D is typically used in brain PET, whereas thoracic or abdominal PET may be performed with either 2D or 3D PET (Badawi et al, 1996; El Fakhri et al, 2002; Lartizien et al, 2004). Some scanners have retractable septa and thus allow the radiologic technician to select either 2D or 3D mode, but other scanners do not have septa and thus acquire data solely in 3D mode.
The ring diameter of most clinical PET scanners is about 1 meter. Thus, it takes about 3 nanoseconds for an annihilation photon to traverse the scanner. If the scintillating material emits its light fast enough and the coincidence electrons are appropriately accurate, one might be able to time the arrival of the annihilation photons and discern not only the LOR of a particular annihilation event, but where along the LOR the event occurred. This approach is referred to as time of flight PET. Such localization data could be used by the reconstruction algorithm and lead to a more accurate reconstruction of the PET data. Even localizing this event to within a few centimeters (cm) along the LOR could substantially improve the quality and accuracy of the reconstructed PET data (Kuhn et al, 2004; Lewellen, 1998). Faster scintillating materials are currently being used, and the scanner electronics are constantly being improved; thus PET scanners that can use time-of-flight information are starting to be introduced into the marketplace.
ATTENUATION CORRECTION
The probability of detecting the photons from an annihilation event from the center of an object is less than that for an event on the periphery because at least one of the photons is more likely to be absorbed or scattered if it has to travel through more material. Thus, if there are two features, each with exactly the same amount of activity, the one on the periphery will have a much higher signal than the one at the center. To achieve uniform quantitative accuracy, the spatial variation in attenuation must be corrected (Cherry et al, 2003).
Consider two PET detectors in coincidence and the intersection of the LOR and an object of uniform attenuating material where L is the length of the LOR within the object. Also consider an annihilation event that occurs at a point within the object along this LOR. This is shown in Figure 16-6. If the distance from this point to the edge of the object in one direction is x and in the other direction it is (L – x), the probability of one of the annihilation photons escaping the object without being attenuated is e−μx and in the other direction it is e−μ(L – x), where μ is the linear attenuation coefficient for the material in question and e is equal to about 2.718 and is the base of the natural logarithm. Thus, the probability of both photons escaping without being attenuated is the product of these two probabilities:
Thus the total probability that both photons escape without attenuation does not depend on where along the LOR the event occurs. It only depends on the thickness of the object along the LOR, L. If x is small, photons traveling in the x direction are less likely to be attenuated, but those moving in the other direction are more likely and the total probability remains the same. So, to know how many annihilation events would have been detected along this LOR if there were no photons attenuated, it is necessary to divide the number of detected events by e−μL or, alternatively, multiply the number of detected events by eμL. If the attenuating material is uniform and the object outline can be defined, then the value of L can be determined for each LOR and the previous formula used to apply corrections to each LOR before reconstruction. The resultant reconstructed data would be free of the attenuation artifact. This process is referred to as calculated attenuation correction.
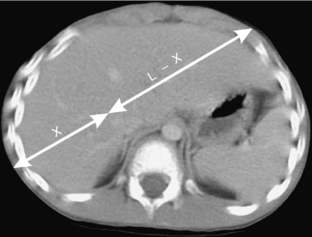
FIGURE 16-6 Photon attenuation in PET. This figure illustrates an annihilation event in the abdomen of a patient. The photon going in one direction must traverse a distance of x, whereas the photon going in the opposite direction must traverse L − x. The total probability that both photons will escape the body is given by e−μL, which depends only on the total thickness of the patient along the LOR and not on the location of the event along the LOR.
The object is considered to consist of materials of varying attenuation coefficients. For example, in a thoracic PET scan, LORs may pass through varying amounts of soft tissue, bone (in the spine), and lung. In this case, it is necessary to determine the degree of attenuation along each LOR rather than just the extent. In transmission tomography it is this variation in attenuation that makes the CT scan possible, but for emission imaging, this confounds the data and therefore a correction for it must be applied. One approach is to use an external, photon-emitting source that rotates about the patient to acquire a “transmission scan.” First, a transmission scan is acquired without the object (or patient) in place, referred to as a blank scan. Then the patient is placed within the scanner and another transmission scan is acquired. For each LOR, the number of counts in the blank scan is divided by the number of counts in the transmission scan to determine the attenuation correction factor. A separate attenuation correction factor is calculated for LOR. Later, after the PET emission scan is acquired, the number of events along each LOR is multiplied by the attenuation correction factor for that LOR and the resultant data are reconstructed. Note that this approach need not make any assumptions about the attenuation material along the LOR, be it soft tissue, bone, or lung. It only looks at the ratio of events acquired with and without the patient in place, that is, the transmission and blank scans, respectively. This approach is referred to as measured attenuation correction.
With measured attenuation correction, two sets of noisy data (the blank and transmission scan) are taken and used to correct a third noisy data set. Thus, its application can lead to a substantial increase in the noise in the final reconstructed PET scan. One approach to reducing this noise is to process a reconstructed version of the attenuation correction factors in such a way that the radiologist determines which pixels are most likely bone, which are most likely soft tissue, and which are lungs and applies a single value depending on the type of material for that particular tissue. This is referred to as image segmentation because the pixel values are categorized into tissue segments. This greatly reduces the noise associated with the attenuation correction and allows the transmission data to be acquired for a shorter amount of time. The second approach is to use a single photon-emitting source rather than a positron-emitting source.
CT–BASED ATTENUATION CORRECTION
A third approach to attenuation correction in PET is to use the data from a CT scan that is registered to the PET data; that is, it is the same size and in the same orientation and sliced along the same planes as the PET scan (Kinahan et al, 2003). Such registration can be achieved by acquiring both data sets with a hybrid PET/CT scanner or by applying a software registration algorithm to PET and CT data that were acquired on separate machines.
CT inherently provides images of the attenuation properties of the object being imaged. The pixel values are recorded in CT or Hounsfield units (HU) where
where μ and μwater are the linear attenuation coefficients, at the CT x-ray energy, of the material within the pixel and water, respectively. HU for water is zero, for air –1000, for soft tissue –100 to 100, and for bone about 1000. Therefore, if CT data are available, it is reasonable to use these data for PET attenuation correction. However, there are several major differences between the attenuation data available from CT and that necessary for PET attenuation correction. First, photons used in CT have substantially lower energy than the annihilation photons from PET. The tube voltages typically used in CT are between 80 and 140 peak kilovolts (kVp), leading to mean energies in the 35 to 50 keV range compared with the 511 keV photons used in PET. In Figure 16-7, A the linear attenuation coefficients for soft tissue, air, bone, and iodine are plotted as a function of energy, and there is a substantial difference between those in the CT energy range (35-140 keV) and those at 511 keV. Thus, a transformation must be applied between CT HU values and the linear attenuation coefficient suitable for 511 keV. One such transformation is shown in Figure 16-7, B. The linear attenuation coefficient for soft tissue at 511 keV is 0.0925 cm−1 which corresponds to the value of the transformation at HU equals 0. For HU values between –1000 and 0, the material is assumed to be a mixture of air and soft tissue, which on a per-density basis have very similar attenuation properties, and thus there is a single linear slope in this region. For HU values greater than 0, the material is assumed to be a mixture of soft tissue and bone and therefore the linear transformation has a different slope (Lonn, 2003).
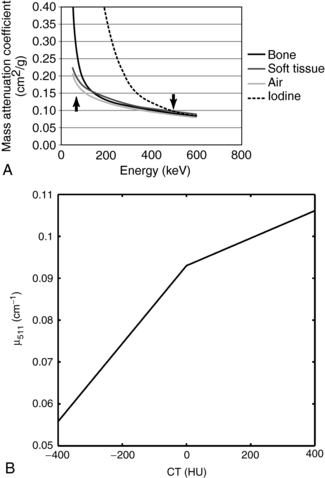
FIGURE 16-7 CT-based attenuation correction for PET. A, The mass attenuation coefficients (that is, the linear attenuation coefficient per unit mass) for bone, soft tissue, air, and iodine as a function of photon energy. The arrow on the left of the figure denotes the mean energy range for CT, whereas the arrow on the right indicates 511 keV. B, Multilinear transformation from CT HU to the linear attenuation coefficient for 511 keV for PET attenuation correction.
There is also a substantial difference in the spatial resolution between CT (on the order of 1.0 mm) and PET (6-8 mm). Applying a very sharp CT correction to smoother PET data can lead to artifacts at the edge of structures within the object. To compensate for this, the transformed CT data are smoothed to a spatial resolution more typical of PET. The resultant transformed, smoothed CT data are subsequently reprojected into an array of attenuation correction factors that can be applied to the PET emission data on reconstruction. Compared with traditional PET measured attenuation correction, the CT data have substantially less noise, and thus the application of CT-based attenuation correction adds very little additional noise to the reconstructed image. Also, the CT data are acquired in a very short amount of time (less than 1 minute) compared with the PET transmission scan (typically 3 minutes per bed position and 18 minutes for a six-bed whole body study).
INSTRUMENTATION
The majority of state-of-the-art PET scanners use the block design previously described. Typically, the individual scintillation detectors are 4 to 7 mm in the transverse direction (around the ring) and 6 to 8 mm in the axial direction (into the ring) and 20 to 30 mm thick. The scanner may consist of 18 to 40 detector rings over a 15-cm axial field of view with a total of 500 to 700 small detectors per ring. Therefore, a modern PET scanner may consist of 9000 to 25,000 small scintillation detectors. The spatial resolution of modern scanners ranges from 4.8 to 6.5 mm depending on the detector size. A scintillation material with high detection efficiency such as BGO, LSO, or GSO is used. Scanners using scintillators that emit their light more quickly (such as LSO and GSO) can reduce their coincidence timing window and thereby reduce the number of random coincidences when imaging high activity concentrations (Fahey, 2001; Fahey 2003).
The availability of interplane septa allows for the acquisition of PET data in 2D mode, which substantially reduces the amount of interplane scatter and random coincidences from activity that is outside the axial field of view. Alternatively, 3D mode leads to an increase by a factor of 4 or 5 in sensitivity. Some modern scanners have retractable septa that provide the option of acquiring data in 2D or 3D mode, whereas other scanners do not have septa and can only be operated in 3D mode. The use of scintillating material with higher and faster light output may reduce scatter and random coincidences so that 3D PET can provide whole body studies with excellent image quality.
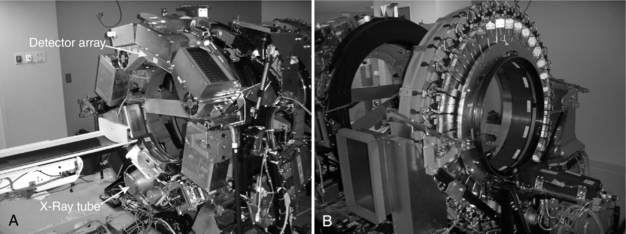
All new scanners are now hybrid PET/CT scanners. The CT portion of hybrid PET/CT systems takes advantage of recent developments in multidetector CT technology. Early PET/CT systems used single-detector or four-detector helical CT systems, but modern hybrid scanners may incorporate CT with 8, 16, 64, or even more slices. Figure 16-8 shows two views of a PET/CT system. As is typical, Figure 16-8, A, shows the CT component of the system, and Figure 16-8, B, shows the PET component. In reality, PET/CT scanners are two separate machines in close proximity with a single bed that moves the patient between the two. The PET and CT data are acquired sequentially.
CLINICAL PET AND PET/CT DATA ACQUISITION
The following describes a typical workflow of a clinical PET procedure. The patient arrives in the PET center, is taken to a preparatory/injection room and injected with the PET radiopharmaceutical. The patient may wait in this room while the radiopharmaceutical distributes within the body. The amount of waiting time will depend on the biokinetics associated with that particular tracer. The patient is then escorted to the scanner room and placed on the imaging table, and the PET emission scan is acquired. In a hybrid scanner, the CT scan is typically acquired just before the PET emission acquisition. In that manner, the CT scout view can be used to position the study anatomically. In a PET-only scanner, a transmission scan may also be acquired, typically just before or just after emission acquisition in each bed position. These data are then reconstructed and processed, and the resultant images are interpreted and analyzed by the physician. Each part of this workflow is briefly reviewed.
One of the great advantages of PET is the fact that many of the elements that are considered biologically pertinent (e.g., carbon, nitrogen, and oxygen) have isotopes that are positron emitters. Therefore, many naturally occurring substrates can be made into radiopharmaceuticals by the simple substitution of a nucleus with a positron-emitting isotope. Some examples are 15O-labeled water, 15O carbon monoxide, 13N ammonia, and 11C methionine. Additionally, 18F can often be substituted for a hydrogen or an OH group such as with 18F FDG or 18F fluorothymidine. However, the disadvantage of the use of these isotopes is their relatively short half-lives, that is, 2, 10, 20, and 110 minutes for 15O, 13N, 11C, and 18F, respectively. Although 18F has a sufficiently long half-life that its radiopharmaceuticals can be produced in regional radiopharmacies and delivered to clinical PET centers, the other three radioisotopes must be produced on site with the use of a medical cyclotron. These cyclotrons typically can generate accelerated charge particle beams in excess of 10 megaelectron volts (MeV) and can be used for the routine production of 11C, 13N, 15O, and 18F.
In some cases, a radiopharmaceutical generator system, similar to the molybdenum-99 (99Mo)–technetium-99m (99mTc) generator routinely used in conventional nuclear medicine, can be used to deliver PET radioisotopes. For example, the strontium-82 (82Sr)–rubidium-82 (82Rb) generator can be used to provide 82Rb to the PET clinic. 82Sr (25-day half-life) decays to 82Rb (75-second half-life). The 82Sr is chemically bound to a ceramic column. Some of the 82Sr will decay to 82Rb, which has different chemistry and, thereby, will no longer be bound to the column. The column is eluted with saline solution and 82Rb is washed away into a vial, where it is available to be administered to the patient. 82Rb distributes to the myocardium in a manner similar to that of thallium-201 (201Tl) and thus provides a PET alternative to measuring myocardial perfusion and viability. Its use has been shown to be of significant clinical value, particularly in larger patients. The PET clinic can purchase a generator every 4 to 6 weeks and have 82Rb available every day without relying on a regional radiopharmacy.
By far, the most commonly used radiopharmaceutical for PET imaging is FDG, which is a radioactive analog of glucose and thereby distributes in tissues that are actively metabolizing glucose. This makes FDG a useful radiopharmaceutical for a number of very different clinical applications, including neurology, cardiology, and oncology. More specifics of the clinical use of FDG are presented in a later section. Although some PET clinics have their own medical cyclotrons, most receive delivery of their FDG in unit doses from a regional radiopharmacy. They contact the radiopharmacy the previous day and inform them of which types of studies will be performed and how much activity they need for each examination. On the day of the examination, the clinic receives a shipment of the syringes needed for that day. Before injection, the syringe is assayed in the dose calibrator to ensure that the appropriate amount of activity is in the syringe for that study.
Consider, as an example, a whole-body FDG scan. Once the patient arrives at the clinic and is registered, he or she is taken to the preparatory/injection room. The patient is injected with the FDG and then must wait for the radiopharmaceutical to distribute within the body. This uptake waiting period is typically 40 to 60 minutes and 45 to 90 minutes for brain and whole-body imaging, respectively. Because most of the time the patient will be sitting in this room with radioactivity on board, the room should be sufficiently removed from the PET scanner and other γ-counting or imaging equipment or appropriately shielded. After the uptake period, the patient is moved to the imaging room and placed on the imaging table. Because the imaging session will take at least 30 minutes, it may be helpful to secure the patient with hook-and-loop (Velcro) wraps or tape.
Most modern PET scans have an axial field of view of at least 15 cm. If the portion of the patient to be scanned is larger than that, multiple scans are acquired at different axial offsets by moving the couch in precisely controlled steps. The resultant reconstructed images will be formatted so that they can be reviewed as one continuous study. The time to acquire the emission scan at each position may range from 3 to 10 minutes depending on the equipment used and the diagnostic task at hand. If measured attenuation correction is to be applied, a transmission scan (3 to 5 minutes per position) will be acquired at each position. It is desirable to acquire the transmission scan as close as possible to the time of the emission scan and, because it takes time to move the radioactive sources used for the transmission scan in and out of their shielded housings, the emission and transmission scans might be interleaved as follows: emission—transmission—move bed—transmission—emission—move bed—emission—transmission until the study is complete. A whole-body PET scan typically incorporates data from the patient’s thighs up to the eyes and, thus, on a machine with a 15-cm axial field of view, would be composed of as many as six or seven bed positions. With both emission and transmission scans, such a study may take an hour or more to acquire. If a CT scan is used rather than transmission scan data for attenuation correction, the CT acquisition takes less than a minute to acquire, so this would reduce the time to complete the study by 20 minutes or so.
ADVANTAGES AND LIMITATIONS OF POSITRON EMISSION TOMOGRAPHY/CT
Hybrid PET/CT scanners were introduced in the 1990s, but the technology did not reach clinical acceptance until more recently (Steinert and von Schulthess, 2002; Wahl, 2004). From the very first use of the early commercial units, it became clear that the combination of these two modalities provided a number of significant advantages over the PET-only devices. The advantages of PET/CT include precise, accurate, and rapidly measured attenuation correction and anatomical correlation for the functional PET scans. However, there are some limitations to the technology that also need to be considered. These include expense, additional radiation dose to the patient, and potential attenuation artifacts that can confound the interpretation of the scans. Although the advantages, in most cases, far outweigh the limitations, it is prudent to be cognizant of their extent and nature.
As described previously, CT-based attenuation correction enables precise and accurate attenuation correction of PET emission data. The number of photons that comprise a CT scan is far in excess of those acquired in a transmission scan using a rotating rod source. For this reason, the magnitude of the noise in the CT scan is substantially lower than in the transmission scan, and thus the noise in the reconstructed CT-based attenuation corrected PET scan is substantially lower. Figure 16-9 shows the effect of various approaches to attenuation correction on a 20-cm-diameter cylindrical phantom uniformly filled with activity. The images are of the same slice reconstructed with no attenuation correction (Fig. 16-9, A), calculated attenuation correction (Fig. 16-9, B), CT-based attenuation correction (Fig. 16-9, C), and conventional measured attenuation correction measured by transmission scanning (Fig. 16-9, D). In Figure 16-9, A, the effect of not applying attenuation correction can be seen, with the center of the phantom appearing to have a much lower activity concentration than the periphery. In Figure 16-9, B, a calculated attenuation correction was applied and thereby no additional noise was added to the data. The quantum noise present in the reconstructed image is solely due to the emission data. In Figure 16-9, C, CT-based attenuation correction was used, and it is noted that this figure is almost identical to Figure 16-9, B. The very slight additional noise added to the resultant corrected image is virtually imperceptible with CT-based attenuation correction. In Figure 16-9, D, the measured attenuation correction was performed by acquisition of a 3-minute transmission scan using rotating rod sources of an equilibrium mixture of germanium-68 and gallium-68. It is noted that substantially more noise is added to the subsequent reconstruction from this measured attenuation correction than from the CT-based approach. In addition, the use of CT-based attenuation correction substantially reduces the time necessary for the overall PET study. Conventional measured attenuation correction requires a transmission scan be acquired at each bed position, potentially adding 3 to 5 minutes for each bed position. On the other hand, the entire CT scan can be acquired in under a minute, thus reducing the scan time by 15 to 20 minutes.
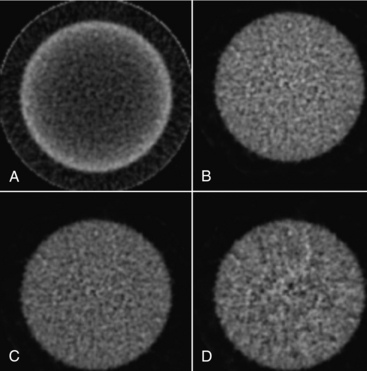
FIGURE 16-9 Attenuation correction of a uniform phantom. A cylindrical phantom filled with 18F was imaged in a PET/CT scanner and reconstructed without applying attenuation correction as well as with three types of attenuation correction. A, No attenuation correction was applied. B, Calculated attenuation correction was applied. C, CT-based attenuation correction was applied. D, Measured attenuation correction using rotating rod sources of 68Ge/68Ga was applied.
As illustrated in the clinical examples in a later section, the combination of the anatomical information from the CT scan with the functional information provided by PET can be invaluable for the diagnosis of the patient’s condition. In some instances it can be extremely valuable in localizing and determining the extent of the pathology. Conversely, the CT scan can better help to define normal anatomy with high uptake and rule out pathological conditions. A good example of this is in identifying brown fat. Brown fat is adipose tissue containing a dark pigment present more commonly in small children and related to the regulation of body temperature that can have a very high FDG uptake and thus could be confused with either tumor or metastatic disease located in lymph nodes. The CT scan can often identify those areas of brown fat as distinct from disease. In some cases, the CT acquired in conjunction with the PET is only used for anatomical correlation, whereas in other cases it can be acquired as a diagnostic CT scan. Acquiring the PET scan together with a diagnostic CT scan in the same imaging session can be an efficient use of the imaging equipment and usually much more convenient to the patient.
Despite the substantial advantages of hybrid PET/CT, one disadvantage is the higher radiation dose delivered to the patient. The radiation dose delivered by CT depends on a number of factors, including tube voltage, tube current, and exposure time (Fahey et al, 2007). In addition, the effective dose to the patient would depend on the region of the body that is scanned. Typical effective doses for helical CT of the chest and abdomen/pelvis are 7.5 to 12.9 and 12.4 to 16.1 millisieverts (mSv) (750 to 1290 and 1240 to 1610 millirads), respectively (Cohnen et al, 2003). Because the CT portion of a PET/CT is acquired over an extended part of the body, it is reasonable to assume that the effective dose for this is closer to 20 mSv. This can be compared with the typical effective dose for a FDG PET study involving a 520 megabecquerels (MBq) injection of 10 mSv (International Committee on Radiation Protection, 1998). Therefore, the effective dose to the patient arising from the CT portion of the study can be double that from the PET portion. In some cases, a diagnostic CT scan may not be indicated for this type of study (e.g., for brain imaging, where magnetic resonance imaging (MRI) is the anatomical imaging modality of choice), and thus the CT scan is only used for attenuation correction. Even if CT is indicated, a diagnostic CT scan may be acquired in addition to the PET/CT scan. In some instances, if the patient has moved between the acquisition of the CT scan and the PET scan, then another CT scan may have to be acquired. In all these cases, the acquisition of a CT scan with a much lower radiation dose may be appropriate. A CT scan adequate for attenuation correction can be obtained with a much reduced tube current (10 milliamperes [mA] instead of 200 mA or more) and in the case of smaller patients, lower tube voltages (as low as 80 kVp) can be used. Lowering the tube current from 200 to 10 mA reduces the radiation dose by a factor of 20, and reducing the tube voltage from 120 to 80 kVp can lead to a further reduction by at least a factor of 3 (Fahey et al, 2007). Although such reduction in tube current and voltage would still lead to an adequate attenuation correction, the utility of the resultant CT images for anatomical correlation would be limited because of the excessive quantum noise.
In some cases, the use of CT-based attenuation correction can lead to artifacts in the reconstructed PET data. There are two assumptions associated with CT-based attenuation correction, and if either one of these is not met, notable artifacts can occur that can sometimes affect the ability to interpret the study. The first assumption is that the patient is in exactly the same position and state during the acquisition of both the CT and PET scans. The second assumption is that the transformation used to convert CT HU values to the linear attenuation coefficient at 511 keV is appropriate for all materials within the field of view. Typically, the CT scan is acquired first, starting at the head and moving toward the feet. As previously noted, this acquisition can take less than 1 minute. The PET scan is then acquired, starting below the bladder and moving toward the head. This acquisition can take 20 to 40 minutes to acquire. Thus for the head and neck in a whole body PET scan, there can be 30 to 40 minutes between the time the CT scan was acquired and when the PET scan was acquired. It is possible that the patient could move in this time so that the CT and PET scans are no longer registered. This can lead to an artifact in the reconstructed PET data. For example, if the CT scan is shifted laterally relative to the PET scan, then one side of the patient will be undercorrected and the other side will be overcorrected. The asymmetry introduced could be interpreted as being the result of a pathological condition. Therefore, it is crucial to keep the patient immobilized from the beginning of the CT scan until the end of the PET scan. In addition, the final reconstructed data should be visually evaluated for the presence of this artifact. If this artifact is suspected, the PET data can be reconstructed without attenuation correction to see whether the asymmetry exists in the underlying emission data. If this artifact is noted and the patient is still on the imaging table, it might be possible to acquire a low-dose CT scan to be used for attenuation correction of this part of the body, or a calculated attenuation correction could be applied.
Even if the patient is kept very still, the motion of internal organs from breathing can also lead to artifacts in the reconstructed PET data. It is routine practice in conventional CT of the chest to have the patient hold the breath during the acquisition of the helical CT scan. However, because it takes 30 to 40 minutes to acquire the PET emission scan, it is impossible to have the patient hold the breath for that period of time, so the patient is typically instructed to breathe quietly during the PET scan. The attenuation in the area of the diaphragm during the PET study will be an average over the entire breathing cycle and over many cycles. Applying attenuation correction from the CT data acquired during a particular instant over the liver and diaphragm can lead to substantial overcorrections in regions of the lung, resulting in regions of apparent high uptake in the lungs that could either be confused for tumor or obscure actual conditions. Several approaches have been used to better control breathing during the data acquisition to help minimize these artifacts (Goerres et al, 2003). One approach is to allow the patient to breathe during the acquisition of the CT scan. The patient can also be instructed to hold the breath at mid or end expiration rather than at end inspiration. This probably leads to the diaphragm being in about the same position in the two studies. A more complicated technical approach is to gate the CT and PET acquisitions on the respiratory cycle and use these data to better register the two data sets. In these studies, an apparatus is used to monitor the breathing cycle during the data acquisition. This leads to a number of scans acquired at different parts of the respiratory cycle. The resultant data can be averaged over the breathing cycle before attenuation correction so that it more closely matches the PET data. In addition to providing better registration between the CT and the PET data for artifact-free attenuation correction, respiratory gating can also improve the quantification of lung tumors by reducing the blurring resulting from breathing motion.
The use of contrast material in CT can also lead to artifacts in the reconstructed PET data. Barium contained in oral contrast media and iodine contained in intravenous contrast media are high atomic number elements (Z of 56 and 53, respectively). At CT photon energies (less than 140 keV), on a per unit mass basis, barium and iodine attenuate x-ray photons to a much greater degree than does tissue. This is precisely why they are used as contrast materials in diagnostic CT. At 511 keV, however, attenuation per unit mass of barium, iodine, and all the tissue components is virtually the same. The attenuation map obtained by transforming HUs from a CT image containing contrast material is therefore inaccurate. The transformed attenuation coefficient for 511-keV photons will be too high because of the presence of contrast material leading to an overcorrection of the PET emission image. This can be either focal hot spots that might be misinterpreted as pathological conditions or larger regions or structures that may be recorded with higher uptake values in quantitative analyses.
Increased activity in PET images as a result of contrast material being present in high concentrations in the CT images used for attenuation correction are typically on the order of 10% to 20%. The advantages of using contrast materials and the improvement in diagnostic quality probably outweigh the problems associated with these errors. For this reason, the routine use of oral and intravenous contrast materials in conjunction with PET/CT is becoming more common. One method to reduce these errors is to use alternative transformation curves that compensate for the presence of contrast media. This option is available on commercial PET/CT scanners. It must be understood, however, that this solution is a compromise because the revised curve must assume some typical mix of water, bone, and now iodine, for example, to explain higher-density pixels. Another method is to have available routinely the uncorrected emission images and use them to rule out false-positive findings that might appear in areas where contrast material pools. This latter method has the advantage that it can also be used to rule out a number of artifacts introduced by attenuation correction errors, such as motion between CT and PET acquisitions and the presence of metallic prostheses (Antoch et al, 2002).
CLINICAL EXAMPLES
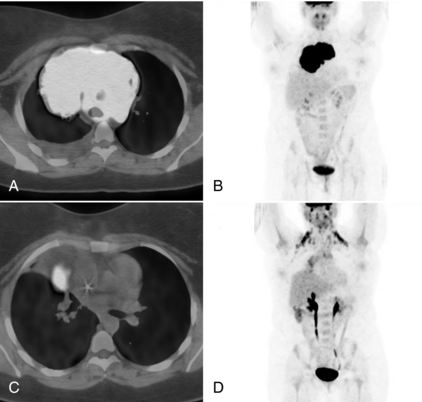
PET with FDG is a powerful imaging modality for use in the initial diagnosis, staging, and follow-up of lung cancer. Most lung cancer nodules are FDG avid and are generally surrounded by tissue with relatively low FDG uptake. Figure 16-10 illustrates a case of lung cancer in a 66-year-old man. Panels A through C contain transaxial CT, PET, and PET/CT fusion images, respectively, through the primary lung tumor mass (labeled p on the PET image). A collapsed portion of the lung adjacent to the mass is also clearly visible on the CT scan. Panels D through F contain transaxial sections inferior to the previous set and illustrate a metastasis in the adrenal gland (a). High activity seen in the kidney (k), however, is a normal finding.
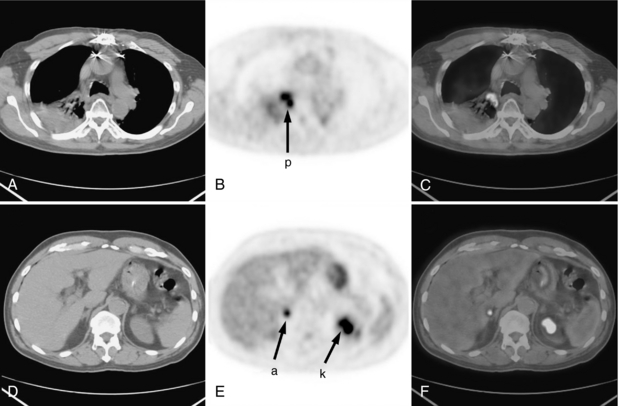
FIGURE 16-10 FDG PET/CT scan in patient with lung cancer. FDG PET/CT scan for 66-year-old man with lung cancer. A, Transaxial CT scan. B, Transaxial PET scan. C, Fused PET/CT fusion images. The primary lung tumor mass is labeled p on the PET image. D, E, and F, Transaxial sections inferior to the previous set illustrating a metastasis in the adrenal gland (a). High activity seen in the kidney (k) is a normal finding.
Oncology—Lymphoma
Another disease where PET is invaluable is lymphoma. Figure 16-11 contains images of a 17-year-old female patient with Hodgkin’s lymphoma acquired for initial staging (A and B) and follow-up about 6 weeks later at mid treatment (C and D). Transaxial sections through the primary site of involvement are shown in panels A and C. Panels B and D contain the whole-body maximum intensity projection (MIP) images. These images document a dramatic reduction in FDG avidity from initial scan to follow-up. The whole-body MIP images also show other areas of normal high FDG uptake in the brain, bladder, kidneys, and ureters. Also visible at the base of the neck in panel D are areas of high FDG uptake corresponding to metabolically active brown fat.
Cardiac Fluorine-18–Labeled 2-Fluoro-2-Deoxy-D-Glucose
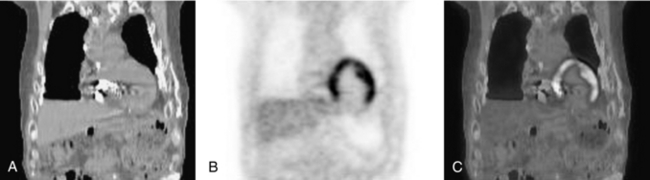
Although the clinical mainstay of PET with FDG is in oncology, there is growing interest in cardiac applications. The myocardium is normally quite variable in its affinity for FDG, but it can be made to be FDG avid to assess myocardial viability. In an FDG myocardial viability study, the patient is first given a drink high in glucose followed by a series of insulin injections. When blood glucose has returned to normal, the FDG is injected. Figure 16-12 shows coronal reconstructions through the chest of a 72-year-old man who was administered 500 MBq (14 millicuries) of FDG 45 minutes before image acquisition. The PET images clearly show little or no uptake in the inferior myocardial wall, which indicates the lack of viable tissue there. Often this study would be performed and interpreted in conjunction with a myocardial perfusion single-photon emission CT study.
Epilepsy
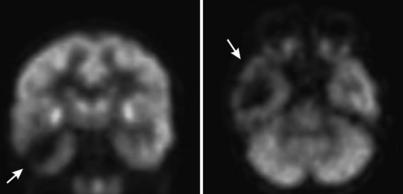
FDG PET has also been shown to be useful in the localization of epileptic seizures (Ollenberger et al, 2005). Seizure foci tend to be hypometabolic on the interictal PET scan, that is, a scan acquired when the patient is not having a seizure. Figure 16-13 shows a transverse and coronal slice through the FDG PET scan of a patient with right-sided intractable temporal lobe epilepsy. It is clearly shown that the patient’s right temporal lobe (on the viewer’s left) has substantially reduced signal on the FDG PET compared with the left temporal lobe. This information can be invaluable to the neurosurgeon treating this patient. For example, this scan indicates that this patient has unilateral disease that is limited to the right temporal lobe, indicating that this is an appropriate candidate for surgical intervention.
SUMMARY
In the past 10 years, PET has become an invaluable clinical tool, particularly in oncology but also in cardiology and neurology. PET can provide outstanding images of function and metabolism that augments the anatomical information provided by CT and MRI. For these reasons, it is very useful to register the functional and anatomical data to each other to provide a more complete view of the patient. Thus, in the past 5 years, hybrid PET/CT scanners have been developed that can provide both anatomical and functional imaging in a single setting. Although there are many advantages to this hybrid approach, there are also some limitations of which the technologist needs to be cognizant to more optimally use these devices and to better interpret their data. In the near future, further advancements in imaging technology along with the development of novel radiopharmaceuticals will continue the rapid growth of PET and PET/CT in the new era of molecular medicine.
REFERENCES
Antoch, G, et al. Focal tracer uptake: a potential artifact in contrast-enhanced dual-modality PET/CT scans. J Nucl Med. 2002;43:1339–1342.
Badawi, RD, et al. Optimization of noise-equivalent count rates in 3D PET. Phys Med Biol. 1996;41:1755–1776.
Casey, ME, Nutt, R. A multicrystal 2-dimensional BGO detector system for positron emission tomography. IEEE Trans Nucl Sci. 1986;33:460–463.
Cherry, SR, et al. Physics in nuclear medicine, 3. Philadelphia: WB Saunders, 2003.
Cohnen, M, et al. Effective doses in standard protocols for multi-slice CT scanning. Eur Radiol. 2003;13:1148–1153.
Daghighian, P, et al. Evaluation of cerium doped lutetium oxyorthosilicate (LSO) scintillation crystal for PET. IEEE Trans Nucl Sci. 1993;40:1045–1047.
El Fakhri, G, et al. Impact of acquisition geometry and patient habitus on tumor detectability in whole-body FDG-PET: a channelized hotelling observer study. In: IEEE Nuclear Science Symposium Conference Record. Piscataway, NJ: Institute of Electrical and Electronics Engineers; 2002:1082–3654.
Evans, RD. The atomic nucleus. New York: Kreiger, 1982.
Fahey, FH. Positron emission tomography instrumentation. Radiol Clin North Am. 2001;39:919–929.
Fahey, FH. Instrumentation in positron emission tomography. Neuroimag Clin North Am. 2003;13:659–669.
Fahey FH et al: Dosimetry and adequacy of CT-based attenuation correction for pediatric PET, Radiology 243:96-104, 2007.
Goerres, GW, et al. Respiration-induced attenuation artifact at PET/CT: technical considerations. Radiology. 2003;226:906–910.
Hoffman, EJ, Phelps, ME. Positron emission tomography: principles and quantitation. In: Phelps ME, et al, eds. Positron emission tomography and autoradiography: principles and applications for the brain and heart. New York: Raven, 1986.
ICRP Report 80: radiation dose to patients from radiopharmaceuticals. International Commission on Radiation Protection: Oxford, 1998:49–110.
Kinahan, PE, et al. X-ray-based attenuation correction for positron emission tomography/computed tomography scanners. Semin Nucl Med. 2003;33:166–179.
Kuhn, A, et al. Design of a lanthanum bromide detector for time-of-flight PET. IEEE Trans Nucl Sci. 2004;51:2550–2557.
Lartizien, C, et al. A lesion detection observer study comparing 2-dimensional versus fully 3-dimensional whole-body PET imaging protocols. J Nucl Med. 2004;45:714–723.
Levin, CS, Hoffman, EJ. Calculation of positron range and its effect on the fundamental limit of positron emission tomography system resolution. Phys Med Biol. 1999;44:781–799.
Lewellen, TK. Time-of-flight PET. Semin Nucl Med. 1998;28:268–275.
Lonn A: Evaluation of method to minimize the effect of x-ray contrast attenuation correction. In 2003 IEEE Nuclear Science Symposium: Conference Record-19-25, October 2003, Portland, Oregon, vol 3, Piscataway, NJ: Institute of Electrical and Electronics Engineers, 2004, pp. 2220-2221.
Ollenberger, GP, et al. Assessment of the role of FDG PET in the diagnosis and management of children with refractory epilepsy. Eur J Nucl Med Mol Imaging. 2005;32:1311–1316.
Palmer, MR, et al. Modeling and simulation of positron range effects for high resolution PET imaging. IEEE Trans Nucl Sci. 2005;52:1392–1395.
Steinert, HC, von Schulthess, GK. Initial clinical experience using a new integrated in-line PET/CT system. Br J Radiol. 2002;75:S36–S38.
Surti, S, et al. Optimizing the performance of a PET detector using discrete GSO crystals on a continuous lightguide. IEEE Trans Nucl Sci. 2000;47:1030–1036.
Wahl, RL. Why nearly all PET abdominal and pelvic cancers will be performed as PET/CT. J Nucl Med. 2004;45:82S–95S.
*Please visit http://evolve.elsevier.com/Seeram/ and click on the Image Collection link to view color versions of the figures in this chapter.