Computed Tomography of the Head, Cerebral Vessels, Neck, and Spine
Beginning in 1972, computed tomography (CT) has provided anatomical information about the body in ways that have greatly increased the diagnosis of pathological conditions in a noninvasive fashion. Neuroradiology is the subspecialty of radiology that deals with the central nervous system and conditions affecting the head and neck. It was revolutionized by CT scanning. It became possible to see inside the brain (i.e., inspect the gray and white matter without the need for a brain biopsy) and to see inside the spinal canal and evaluate disks.
With the advent of multiple detector CT scanners at the beginning of the twenty-first century, visualizing the entire vascular tree in a few seconds after an intravenous contrast injection has become feasible. More uses will follow, with further technical developments.
INDICATIONS
CT is valuable for assessing intracranial pathological conditions, especially in the acute stage. It is performed to guide further investigations and therapy. It is fast and causes no security concerns, in contrast to magnetic resonance imaging (MRI). (Patients must be screened before being positioned in the MRI machine, which causes delays.) Motion can cause artifacts, but it is less of an issue than with MRI. (Terminology commonly found on imaging requests is written in italics, to help the student identify conditions. Not all the conditions mentioned later are illustrated.)
A common indication for CT scanning is acute neurological dysfunction, often presenting as paralysis (stroke) or transient ischemic attack (TIA). The neurological deficit can be caused by a cerebral infarction from blockage of a blood vessel in the neck or head, by a spontaneous brain hemorrhage caused by hypertension or an underlying blood vessel abnormality such as an aneurysm, by an infection (viral encephalitis or bacterial abscess), or by a primary or metastatic tumor.
Cerebral infarction is the result of loss of adequate blood supply to a portion of the brain. In the early stages, it may be difficult to see the location of the infarcted tissue on CT. Early edema (as seen in Fig. 17-1, A) causes loss of gray-white matter differentiation, which is the earliest CT sign of infarction. As the infarct matures, it becomes more obvious and better defined. Because of the increased water content of the infarcted tissue, the density is decreased (i.e., dark) (Fig. 17-1, B).
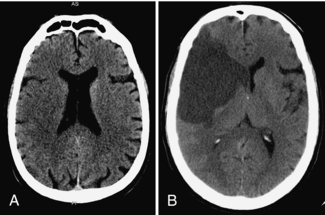
FIGURE 17-1 A, Early subtle infarction. B, Late well-defined cerebral infarction. Subtle loss of the distinction between the gray and the white matter is present on the early CT, in the right middle cerebral artery territory, with good delineation of the affected area on the later CT.
Hemorrhage in the brain substance (Fig. 17-2, A) can occur spontaneously, either because of an underlying vascular anomaly, such as a tumor or an arteriovenous malformation (AVM) or because the patient’s hypertension has weakened the walls of the capillary vessels. Hemorrhage can also occur in the subarachnoid space (Fig. 17-2, B), resulting in bloody cerebrospinal fluid (CSF) (from a leaking aneurysm) or between the brain and its meninges (epidural and subdural spaces). Acutely extravasated blood is of increased density (i.e., white). The degree of mass effect caused by the hematoma is reflected in the amount of brainstem compression from the shift of the midline structures. This affects the patient’s level of consciousness, which is measured by the Glascow Coma Scale (range 3-15). A normal score is 15 and the lowest score is 3. Delay in scanning any patient with a score less than 13 or 14 after a head injury should be avoided because this score can change in less than 5 minutes in the presence of an expanding intracranial hematoma. The technologist should always advise the medical personnel immediately if a dramatic change in level of consciousness is seen while the patient is in the scanner. (This is one type of patient who should not be left unsupervised, while waiting for transport, for example.)
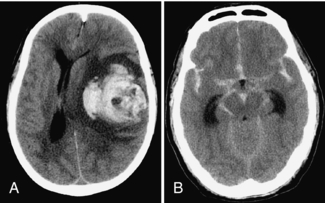
FIGURE 17-2 A, Large left parenchymal hematoma causing a marked midline shift to the right. B, Severe subarachnoid hemorrhage outlining all the cisterns of the skull base.
Hematomas evolve in density over time, becoming less and less dense and finally approaching CSF in density. The clot will be jellylike in the acute phase and will eventually liquefy and shrink. Chronic subdural hematoma is the most common condition followed up by repeated CT scanning to document its complete disappearance. Reaccumulation of a chronic subdural hematoma is also common, requiring repeated drainage.
When a traumatic brain or facial injury is suspected, CT provides rapid information about contusions (brain bruise) and hematomas (blood clot) in the brain and in the spaces between skull and brain (epidural and subdural hematomas). Facial and skull fractures are easily seen (Fig. 17-3, A), except linear cranial vault fractures coursing in the plane of section. The depth of depressed bone fragments can be measured (Fig. 17-3, B). The results of corrective surgery and the location of metallic hardware in the face, as well as the degree of healing callus, are easily appreciated on follow-up examinations.
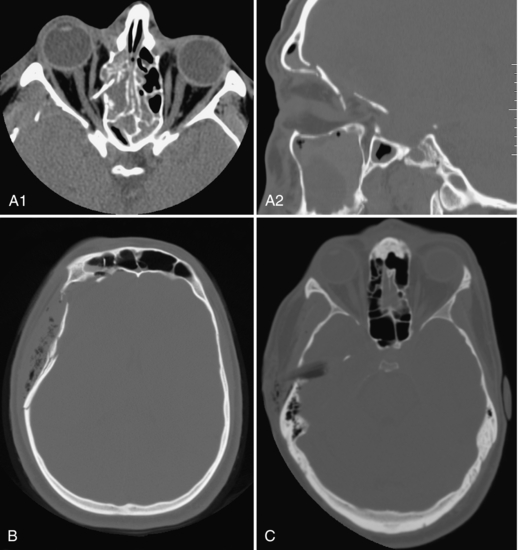
FIGURE 17-3 A, Orbital roof fractures; the transverse image on orbit settings shows the bone fragment spearing the right medial rectus muscle and the sagittal image on bone windows shows the rotation of this fragment. B, Comminuted depressed skull fracture with subcutaneous emphysema and fluid in the right frontal sinus. C, Wooden stick piercing the right temporal bone and lobe, displacing a fragment of bone into the brain, better appreciated on wide windows (it mimics air on routine brain windows, not shown).
The most common brain tumor is a metastasis; metastases are often multiple (Fig. 17-4, A). Common primary brain tumors are meningioma and glioblastoma multiforme (GBM) (Fig. 17-4, B). Their location and pattern of enhancement is used to predict their histological grade preoperatively.
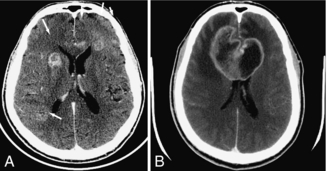
FIGURE 17-4 A, Multiple ring enhancing metastases in both frontal lobes. B, Enhancing bifrontal (butterfly) GBM; it is surrounded by edema, causing mass effect on the frontal horns.
Stereotaxic procedures by various methods are commonplace in neurosurgery. They are used to accurately localize the lesion before biopsy or resection. The preoperative studies can be obtained with fiducial markers applied to the scalp or with the head in a stereotaxic frame. Different systems are available, with some frames attaching to the CT table, in place of the head holder. Newer systems are frameless, using a combination of computer programs to superimpose the images and correlate them to the patient’s anatomy.
In the case of meningitis or encephalitis, it is useful to analyze the CSF for the presence of cells and various compounds, such as glucose, proteins, antibodies, and bacteria and viruses. A lumbar puncture (LP) can only be safely performed if the possibility of an intracranial mass (hydrocephalus [Fig. 17-5, A], tumor or abscess) has been ruled out. Many physicians prefer the certainty of CT before proceeding with the LP because signs of an intracranial mass are not always present. Brain atrophy can also result in large ventricles and must be distinguished from hydrocephalus (Fig. 17-5, B).
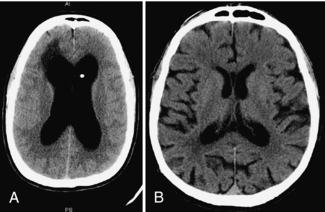
FIGURE 17-5 A, Shunted hydrocephalus (enlarged ventricles caused by obstruction to CSF flow) can fail, requiring shunt revision. B, Brain atrophy can also result in large ventricles, without CSF obstruction.
Many congenital brain abnormalities are diagnosed in childhood, whereas others are only recognized in adulthood. Some types of seizure disorders are caused by localized arrested brain development (for example, cortical dysplasia). Surgery may alleviate the seizures. Some brain anomalies remain asymptomatic and are an imaging curiosity (for example, cavum of the septum pellucidum, cisterna magna).
Apart from the brain, conditions affecting other components of the head, such as the sinuses, temporal bones, and orbits are commonly evaluated by CT scanning.
Sinus disease (sinusitis, tumor) is readily seen with CT (Fig. 17-6, A). Sinus anatomy shows many variations important to the ear, nose, and throat surgeon. To avoid complications such as entering the brain or orbit inadvertently, sinus surgery is often performed with direct correlation with the CT images, a procedure known as functional endoscopic sinus surgery, or FESS.

FIGURE 17-6 A, Paranasal sinuses obtained prone to better see the drainage pathways of the maxillary sinuses (known as the ostia). B, Reformatted three-dimensionl image of the mandible. The image can be rotated on the computer to evaluate all the margins of this curved bone.
The mandible, being a curved bone, is not optimally assessed for pathological conditions with plain films; it is easily evaluated with CT by using two-dimensional and three-dimensional (3D) reformatted images; a 3D reformatted mandible is shown in Figure 17-6, B.
Orbital CT scan images should always be available in at least two planes (transverse and coronal) because of the pyramidal shape of the bony orbit. The intraorbital fat delineates the optic nerve, extraocular muscles, and superior ophthalmic veins. For example, CT accurately localizes radiopaque foreign bodies for the surgeon. Wood is not radiopaque and may mimic air, so bone windows should be available (shown in Fig. 17-3, C). Although orbital ultrasonography is used widely to study the ocular globe, CT is better at characterizing orbital mass lesions and identifying the cause of proptosis (displacement of the globe).
Other uses of CT include looking for pituitary microadenoma in the pituitary gland situated in the sella turcica (cause of many endocrine problems) and masses in the middle ear (cholesteatoma) and internal auditory canal (acoustic neuroma) as causes for hearing loss (Fig. 17-7).
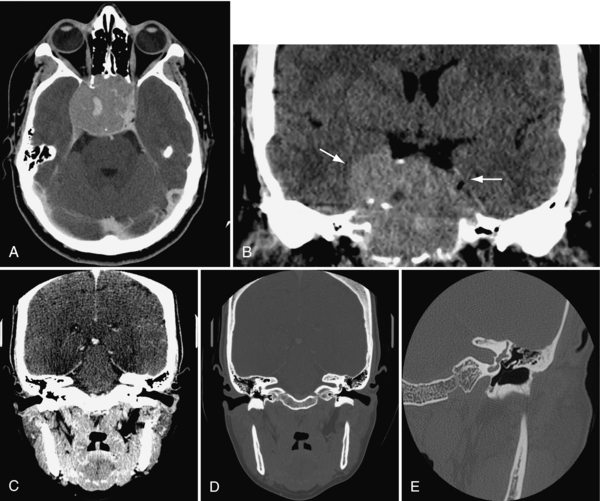
FIGURE 17-7 A and B, Very large pituitary adenoma, filling the sphenoid sinus but not abutting on the optic chiasm, imaged in transverse plane and reformatted in coronal plane. C and D, Direct (i.e. with neck extension) coronal images of the internal auditory canals (IAC), on soft tissue (C) and bone (D) algorithms. E, Left petrous bone, acquired in direct coronal plane, showing the ossicles in the middle ear, surrounded by air.
Cerebral Blood Vessels
Helical scanning makes it possible to image structures during the continued intravenous (IV) injection of a bolus of iodinated contrast medium. Multislice CT scanners extend the length of the vascular tree that can be imaged with one contrast injection; because of the speed of image acquisition, a pump is used to inject the contrast. A greater scan length (i.e., length of travel of the tabletop) is possible with a greater number of simultaneous slices. At this time, the artifacts caused over the carotid arteries by metal in the mouth (dental fillings, caps, braces) cannot be completely eliminated. Magnetic resonance angiography (MRA) or catheter angiography may be necessary to rule out or confirm a vascular abnormality suggested by CT angiography (CTA).
CTA can outline the cerebral blood vessels from their origin on the aortic arch to their various intracranial branches, as shown in Figure 17-8, A and B. Because of the ease and convenience of CTA, the number of patients being investigated for vascular conditions has multiplied. The vessels supplying the brain originate from the aortic arch (the innominate or brachiocephalic trunk, left common and left subclavian arteries). Both the subclavian and the vertebral arteries, the common carotid artery bifurcations (site of most stenoses), the internal carotid arteries, the intracranial arteries (anterior, middle and posterior cerebral, basilar, and cerebellar) arteries (aneurysm sites) are readily visible (Fig. 17-9).
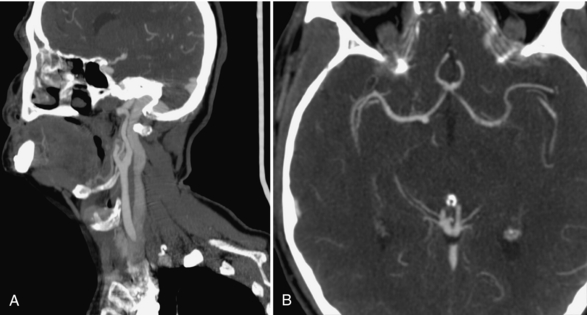
FIGURE 17-8 A, Normal CTA of the common carotid bifurcation, showing the Y-shaped arteries and the large jugular vein posterior to it. B, Normal CTA of the circle of Willis, showing the anterior communicating artery and both middle cerebral arteries.
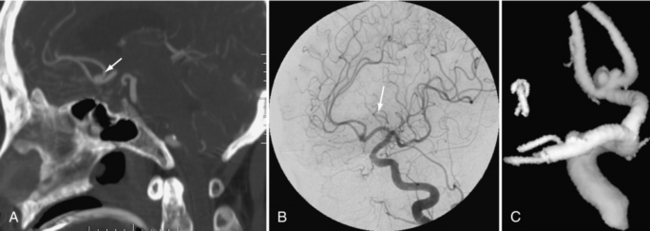
FIGURE 17-9 A to C, The same anterior communicating artery aneurysm is shown on the CTA, the cerebral angiogram, and the 3D model constructed from this angiogram.
A delay of a few seconds between injection and acquisition of images of the entire brain increases the visualization of the jugular veins and dural sinuses (sagittal and transverse sinuses), sites of possible thrombosis. This is known as a CT venogram (CTV) (not shown).
An important use of CTA is in suspected acute cerebral infarction because rapid intervention may result in lessening the extent of brain damage. After a non contrast CT of the brain to rule out hemorrhage, CT perfusion (CTP) at the level of the suspected infarct is obtained (in some centers) to delineate the amount of brain at risk for permanent damage; CTA of the cerebral vessels follows to identify the presence of clot in a major intracranial artery (usually the middle cerebral or the basilar artery) before a “clot-busting” drug, known as a thrombolytic agent (such as thrombin plasminogen activator, or TPA) is administered.
Patients with a hemorrhage caused by, for example, a suspected aneurysm or an AVM can undergo a CTA to confirm the diagnosis before being transferred to a more specialized treatment center. This is particularly useful in smaller or more remote localities where a neurosurgeon or neurologist is not available.
Spine and Neck
In many centers CT has replaced plain films of the cervical spine in cases of trauma because it shows injuries not detectable otherwise (see examples of fractures in Fig. 17-10). A certain amount of “pathology” overlap is seen in the cervical region because conditions affecting the vessels, the bones, and the soft tissues are often found when one type of cervical examination is being carried out. This is most evident when the study is a CTA covering the neck; in addition to bone and vessels, abnormalities of the thyroid gland, the salivary glands, lymph nodes, and neck muscles can be appreciated.
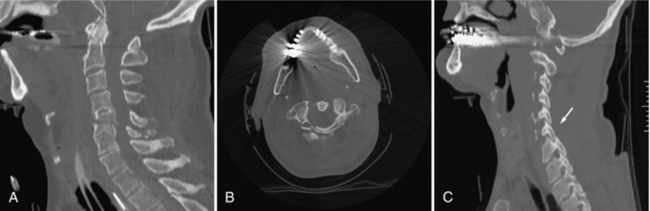
FIGURE 17-10 A, Reformatted image of the cervical spine showing fractures of C2 and C5. Multiple spinal fractures are not uncommon. B, Metal causes streak artifacts but still demonstrates the C1 fracture. C, Alignment is a critical component of spinal assessment. A facet lock is present.
In the case of trauma, the carotid or vertebral arteries may be injured (resulting in a dissection or occlusion) during the violent neck motion that caused a spinal fracture or dislocation. Patients with carotid stenosis caused by arteriosclerosis are usually older; the cervical spine often shows disk herniation or osteophytes causing nerve root compression or spinal stenosis. The converse is also true. Studies looking for cervical disk herniation may also show carotid bifurcation calcification, a possible cause of symptomatic carotid artery disease and a potential cause of stroke or TIA.
Masses can occur along the chains of lymph nodes in the neck (for example, lymphoma, Hodgkin’s disease), along nerves (such as vagus nerve schwannoma), or adjacent to the vessels (carotid body tumor; Fig. 17-11, A). Tumors occurring in the salivary glands, nasopharynx, tongue, and floor of the mouth can metastasize to the neck nodes, changing the tumor grade and treatment protocol and the survival rate (Fig. 17-11, B).
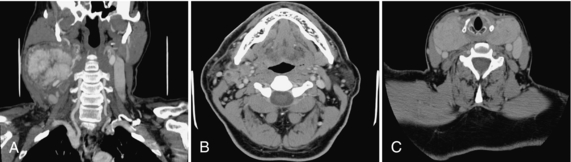
FIGURE 17-11 A, Large vascular mass (carotid body tumor) shown on CTA. B, Metastatic ring enhancing necrotic lymph nodes, abutting on the right submandibular gland. C, Large thyroid goiter encircling the trachea.
Preservation of the voice can be achieved in localized laryngeal cancers when treatment consists of a partial laryngectomy. This emphasizes the need for accurate delineation of tumor.
Enlargement of the thyroid gland as the result of a goiter is a frequent incidental finding when the neck is imaged for any reason (Fig. 17-11, C). When large, a goiter can plunge into the superior mediastinum and cause airway obstruction. Thyroid hormone production can be abnormal, resulting in various symptoms.
Many infections start in the disk space (diskitis, osteomyelitis) at any level of the spine; they can spread to the epidural space (epidural abscess), resulting in spinal cord compression and paralysis. Other infections extend into the prevertebral or paraspinal tissues; in the neck, they can obstruct the airway or cause difficulty swallowing and drooling. An acutely swollen neck can be life threatening because of the potential for obstruction of the airway, particularly in children.
Tumors affecting the spine or spinal cord can originate as primary tumors or metastasize from other sites to bone or soft tissue, affecting the vertebral bodies, the pedicles, laminae, and facet joints. Their treatment often requires removal of much bone, resulting in possible instability of the spine. Bone grafts and metallic instrumentation are frequently inserted to preserve patient mobility. Metallic instrumentation may fail, requiring frequent follow-up by imaging (plain films/CT) and occasionally surgical revision.
Instrumentation of the spine is also used in treating atlantoaxial (C1-2) instability in rheumatoid arthritis and in treating scoliosis, spine fractures, spinal stenosis and spondylolisthesis. It requires accurate placement of pedicle screws, hooks, wires, and plates. CT accurately depicts the position of the instrumentation. In some cases, screws may traverse a foramen and impinge on a nerve root or a vertebral artery; a neurologic deficit or pain can ensue (Fig. 17-12, A).
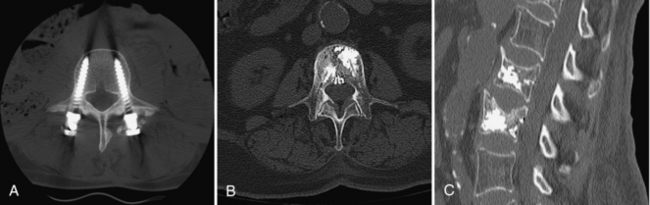
FIGURE 17-12 A, Pedicle screws in the lumbar spine, with bone graft material around the head of the left screw. B and C, Vertebroplasty: radiopaque cement is injected through the pedicles into the vertebral body: transverse and sagittal images.
Another type of spinal procedure is vertebroplasty. Radiopaque cement (methylmethacrylate) is injected under fluoroscopic control into spinal compression fractures to reduce pain and in some cases to decrease the kyphosis.
Postprocedure CT scans of the many types of spinal interventions described previously are common to assess the results (Fig. 17-12, B and C).
ROLE OF CT COMPARED WITH OTHER IMAGING MODALITIES
The recent advent of multislice CT scanners with the capacity to image multiple organ systems at one sitting, without having to move the patient, has revolutionized the evaluation of a number of acute conditions. Multiple trauma patients in particular are being assessed from head to toe by CT scan, in many cases replacing plain radiographs and catheter angiography. The sequencing of these examinations is important to increase diagnostic accuracy while minimizing the radiation dose and the volume of IV contrast. Ideally, the sequence should evaluate the patient for the most life-threatening conditions first on the basis of the initial assessment.
The noncontrast head CT (using thin slices for later reformatted images if facial fractures are readily apparent) should be followed by CTA of the thoracic aorta (to rule out a dissection) and CT of the chest, abdomen, and pelvis (to look for solid and hollow organ injury). CTA of the neck vessels can be obtained last.
Reformatted images of the entire spine on bone algorithm in three planes, obtained from the previous series, are used to rule out spine fractures and evaluate alignment. Reformatted facial bone and mandible images, also on bone algorithm, are produced if required.
More subtle fractures can be diagnosed with CT than with plain films. Nursing practices (for example, turning the patient in the intensive care unit to avoid bed sores) can be influenced by the presence of spine fractures not visible on plain films.
Such multiple studies can easily result in 2000 to 2500 images in total. Better quality images are obtained if the patient’s arms can be moved (down for the head and neck CTA and up for the chest-abdomen) (i.e., if the patient has no clavicle, scapula, or humeral fractures). Some trauma cases also require other orthopedic scans (e.g., pelvis, hips) or a CT cystogram.
CTA can complement duplex ultrasonography. It is not hampered by calcification, unlike ultrasonography. Also unlike ultrasonography, it cannot determine direction or velocity of blood flow. The CTA can image the cervical blood vessels over a longer segment than can duplex ultrasonography.
Transcranial Doppler imaging (another form of ultrasonography) can be used to evaluate flow in intracranial vessels, but it is not widely available. The CTA images are more “user friendly” than ultrasonography for most clinicians. MRA currently does not provide the same rapid answers as CTA in acute stroke, in most institutions.
Enlarged thyroid glands can indicate an increased or decreased production of thyroid hormone, resulting in symptoms affecting various organ systems. Initial evaluation of a thyroid goiter by ultrasonography allows for fine-needle aspiration. Gadolinium-enhanced MRI of the neck does not affect thyroid iodine metabolism. It can be used as a substitute for CT when iodine therapy of a thyroid nodule is planned.
Although MRI is the preferred imaging technique for the spinal cord and the intervertebral disks, CT scanning continues to provide valuable information about calcification and the bones. Similar to brain CT, spine lesions such as tumor and infection will enhance with IV contrast. CT can thus be used when MRI is dangerous, as in the presence of a cardiac pacemaker or the older types of cerebral aneurysm clips.
In the absence of trauma, CT (or MRI) can be used when acute spinal cord compression is diagnosed by the sudden loss of sensation, motor function, or bowel or bladder function. Common causes include epidural abscesses in IV drug users and spinal metastasis. (Symptoms caused by metastasis to the brain or spine are often the presenting complaint in individuals with no known primary cancer; up to half of new cases of cancer are discovered because of their metastases.)
CT-guided procedures such as nerve root blocks, facet blocks, and spine biopsies require scanning the same levels repeatedly. Some CT scanners have a “fluoroscopy” option to assist in these procedures. These procedures are also performed on the usual fluoroscopic units.
Patients with spinal instrumentation sometimes need reevaluation of the contents of their spinal canal. Metallic artifacts can impede CT and MRI diagnosis because the spinal canal is obscured or distorted by the artifact. Some newer CT scanners can reduce this metallic spray artifact by extending the Hounsfield units thanks to a special metal artifact reduction software program.
Another way around this problem is a myelogram followed by a CT scan: water-soluble contrast medium specific for subarachnoid use is injected under fluoroscopy by LP or C1-2 puncture into the subarachnoid space by the radiologist. After suitable fluoroscopic images are obtained, CT images are acquired on bone algorithm (kernel) and reformatted in the appropriate planes. Adhesions of spinal cord or nerve roots (arachnoiditis), spinal cord cavities (syrinx), and other conditions obscured by the metallic artifacts can be diagnosed and treated appropriately (Fig. 17-13).
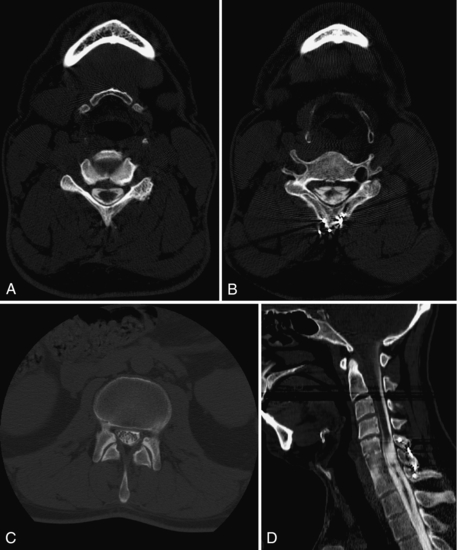
FIGURE 17-13 A, CT myelogram delineates a normal cervical spinal cord and nerve roots. B, The cervical spinal cord (outlined by contrast) is distorted by injury. C, The normal lumbar nerve roots are outlined by the intrathecal contrast. D, A sagittal reformatted image shows how using the bone algorithm (or equivalent) minimizes the artifact caused by the posterior metallic wiring of the spine.
SECTIONAL ANATOMY: A REVIEW
R. A Nugent, revised by J. S. Lapointe
Image acquisition is obtained in the transverse (axial) plane with the patient in a (usually) supine position or (occasionally) in a prone or decubitus position. Knowledge of sectional anatomy is mandatory. A readily available reference text is an invaluable tool.
Because the acquisition of images with most CT scanners now in use is multiplanar (i.e., 4 to 64 slices), the review of coronal and sagittal reformatted images is now commonplace. These planes, by presenting the anatomy in a more traditional fashion, illustrate variations in the expected anatomy and the spread of disease. The student gains a better understanding of sectional anatomy by correlating transverse images with reformatted images in the other two planes. The angle of an oblique structure, such as the lateral wall of the orbit, is subsequently easier to appreciate.
As with plain radiographs, such as a chest x-ray, transverse (axial) images and coronal reformatted images are viewed with the patient’s right side on the viewer’s left (i.e., as if facing the individual). Local preference (usually the radiologist) dictates whether the transverse (axial) images are viewed from top to bottom or vice versa and if the sagittal images are viewed from right to left or left to right. Labeled scout (topogram, scanogram) images must be available, to decrease uncertainty about slice location and for accurate reporting.
Head
Transverse Sections: The anatomical structures of the normal appearance of the brain by use of a standard algorithm are shown in Figure 17-14. Slices through the skull base (Fig. 17-15) give exquisite detail of the foramina, facial structures, pituitary fossa, and temporal bones. CSF in the basal cisterns and ventricles helps define the anatomy, as does calcium in normal structures such as the choroid plexus, pineal gland, and falx cerebri. Differentiation of white and gray matter allows for definition of the basal ganglia, thalamus, and external and internal capsules.
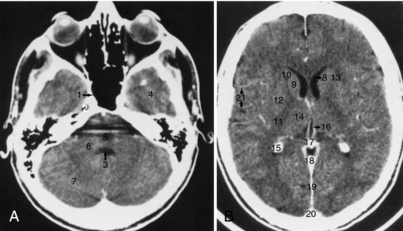
FIGURE 17-14 A and B, Brain. The normal appearance of the brain using a standard algorithm and 5-mm thick images, obtained with IV contrast enhancement. 1, Sphenoid sinus; 2, trigeminal ganglion; 3, fourth ventricle; 4, temporal lobe; 5, pons (partly obscured by streak artifact); 6, middle cerebellar peduncle; 7, cerebellar hemisphere; 8, frontal horn of the lateral ventricle; 9, head of the caudate nucleus; 10, anterior limb of the internal capsule; 11, posterior limb of the internal capsule; 12, lentiform nucleus; 13, external capsule; 14, thalamus; 15, calcified choroid plexus; 16, internal cerebral vein; 17, pineal calcification; 18, straight sinus; 19, falx cerebri; 20, superior sagittal sinus; 21, branches of the middle cerebral artery. The use of a standard algorithm with a relatively narrow window (80 units) results in good contrast between white and gray matter.

FIGURE 17-15 A 1.5-mm thick axial slice through the base of the skull using the bone algorithm shows excellent spatial resolution. 1, Opening of the nasolacrimal duct; 2, nasal septum; 3, maxillary sinus; 4, lateral orbital wall; 5, zygomatic arch; 6, mandibular condyle; 7, pterygopalatine fossa; 8, vidian (pterygoid) canal; 9, foramen ovale; 10, foramen spinosum; 11, ascending carotid canal; 12, horizontal carotid canal; 13, jugular fossa; 14, jugular tubercle; 15, mastoid air cells.
Coronal Sections: Coronal images (Figs. 17-16 through 17-19) are particularly useful for assessing bone when the plane of the bone runs parallel to the axial slice. Coronal images therefore are valuable for scans of the floor and roof of the orbit, the skull base, and the top of the cranial vault. The pituitary gland is well defined as a fairly rectangular structure within the sella turcica that is intersected in the midline, slightly posteriorly, by the pituitary stalk. The cranial nerves in the cavernous sinus can be identified on either side of the pituitary gland.
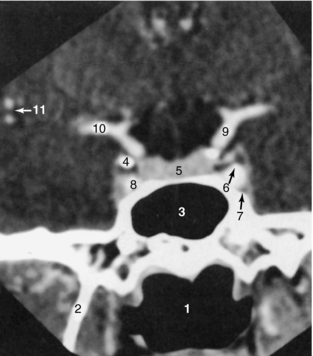
FIGURE 17-16 Sella turcica. A 1.5-mm thick coronal slice through the sella turcica, obtained with IV contrast enhancement, demonstrates these structures: 1, oropharynx; 2, lateral pterygoid plate; 3, sphenoid sinus; 4, anterior clinoid; 5, pituitary gland; 6, cranial nerve III; 7, cranial nerve VI; 8, cavernous portion of the internal carotid artery; 9, supraclinoid portion of the internal carotid artery; 10, middle cerebral artery; 11, branches of the middle cerebral artery.
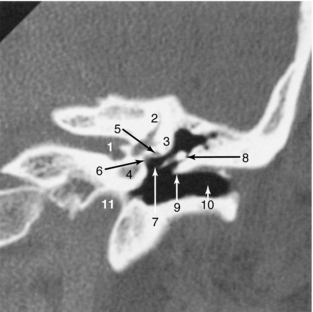
FIGURE 17-17 Temporal bone. A 1-mm coronal image through the left temporal bone using the high-resolution bone algorithm is demonstrated. The thinness of the slice, as well as the smaller FOV, helps maximize the spatial resolution. 1, Internal auditory canal; 2, superior semicircular canal; 3, lateral semicircular canal; 4, cochlea; 5, horizontal portion of the facial canal; 6, oval window; 7, stapes; 8, malleus; 9, Chausse spur; 10, external auditory canal; 11, carotid canal.
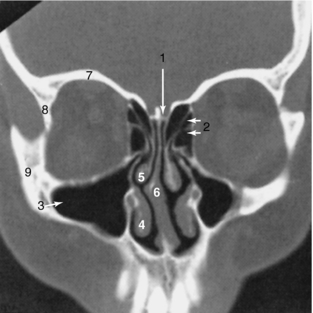
FIGURE 17-18 Paranasal sinuses and facial bones. A 3-mm thick coronal image using the bone algorithm demonstrates the air-containing paranasal sinuses and nasal airway. 1, Cribriform plate; 2, ethmoid sinuses; 3, maxillary sinus; 4, inferior turbinate; 5, middle turbinate; 6, nasal septum; 7, roof of the orbit; 8, lateral orbital wall; 9, zygoma.
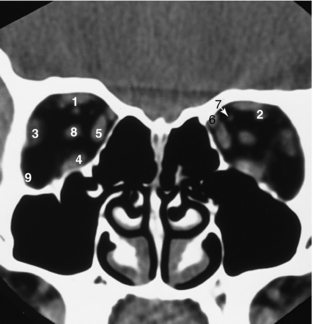
FIGURE 17-19 Orbits. A 3-mm thick coronal view of the orbits, obtained without IV contrast enhancement, demonstrates that orbital fat produces excellent contrast, resulting in good definition of the extraocular muscles and optic nerve. 1, Superior rectus muscle; 2, superior ophthalmic vein; 3, lateral rectus muscle; 4, inferior rectus muscle; 5, medial rectus muscle; 6, superior oblique muscle; 7, ophthalmic artery; 8, optic nerve.
Coronal images of the temporal bone can highlight the relationships of the ossicles and structures along the medial wall of the middle ear, including the facial canal, oval window, and lateral semicircular canal. Coronal images intersect the tentorium and demonstrate its tentlike appearance. They help define whether a lesion is supratentorial or infratentorial, which aids in surgical planning.
A tumor that abuts a ventricle can be assessed in the coronal plane to determine whether it arises from or is extrinsic to the ventricle.
Neck
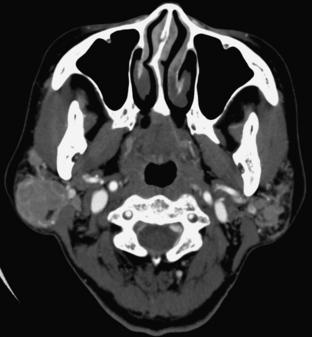
When an IV contrast medium is used to enhance images, major vascular structures such as the carotid arteries and jugular veins can be identified. Both the superficial mucosa and the submandibular glands enhance. The parotid gland, with its high fat content, demonstrates an intermediate density between those of fat and muscle (Fig. 17-20).
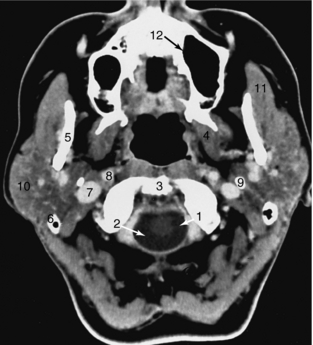
FIGURE 17-20 Neck. This 3-mm thick axial slice through the upper neck was obtained with IV contrast enhancement. 1, Spinal cord; 2, cerebrospinal fluid; 3, top of the odontoid; 4, pterygoid muscles; 5, mandible; 6, tip of the mastoid; 7, internal jugular vein; 8, internal carotid artery; 9, styloid process; 10, parotid gland; 11, masseter muscle; 12, maxillary sinus.
Thin sections of the larynx show the relationship of the cartilages to the adjacent soft tissue. The level of the true vocal cords is defined by the position of the arytenoid cartilages (Fig. 17-21).
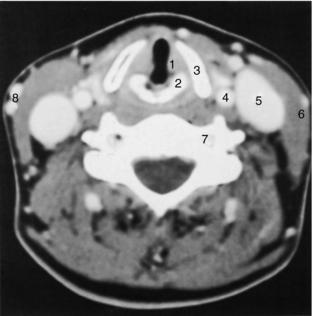
FIGURE 17-21 Larynx. A 3-mm thick axial slice through the larynx obtained at the level of the vocal cords demonstrates prominent enhancement of the vascular structures. The laryngeal cartilages are better defined on the bone setting, which is not included here. 1, True vocal cord; 2, arytenoid cartilage; 3, thyroid cartilage; 4, common carotid artery; 5, internal jugular vein; 6, sternocleidomastoid muscle; 7, vertebral artery; 8, superficial veins.
Spine
The sectional anatomy of the lumbar and cervical spines is illustrated in Figures 17-22 and 17-23, respectively. Spine images are acquired in the transverse plane, either helically or by varying the gantry tilt. Coronal or sagittal images can now be obtained easily with multiplanar CT scanners. CT differentiates the disk from the adjacent ligamentum flavum, thecal sac, intraspinal fat, and bone. The nerve roots are easily identified as they exit through the intervertebral foramina. Epidural veins can be seen, particularly in the lumbar spine, but are better visualized with contrast medium enhancement.
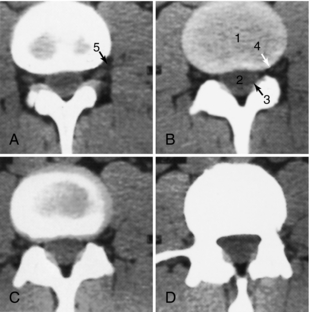
FIGURE 17-22 Lumbar spine. Four sections (A-D) through the L3-L4 disk space were obtained every 4 mm using a slice thickness of 5 mm. The disk (1) is slightly higher in density than the adjacent paravertebral muscle and the thecal sac (2). The ligamentum flavum (3) is also slightly more dense than the thecal sac. Fat in the spinal canal and intervertebral foramen (4) helps define the root sleeve (5).
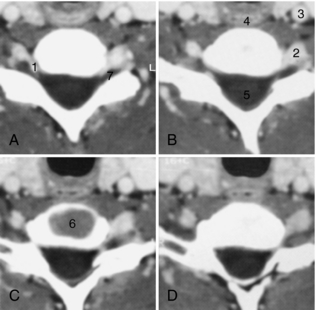
FIGURE 17-23 Cervical spine. Sequential 3-mm thick images (A-D) obtained every 2 mm through the C6-C7 disk space demonstrate prominent enhancement of the epidural veins (1), vertebral artery (2), and carotid artery (3), as well as the esophagus (4), spinal cord (5), and disk (6). The dorsal root ganglion (7) is outlined by the epidural veins.
PATIENT PREPARATION
Little preparation is needed in most cases. Attention to the following details will minimize artifacts, ensure patient safety and comfort, and produce a study of optimal diagnostic quality.
• Metallic objects: The area to be scanned should be free of all jewellery, hairpins, metal gown snaps, wires attached to the patient, and other devices. They can be moved out of the field when they are noted on the scout (scanogram, topogram) images, without having to repeat the scout in most cases. Glasses are removed but contact lenses remain in place for brain scanning.
• Fasting is not required. However, if IV contrast is being used, a large meal immediately before the CT scan is discouraged in case the contrast causes nausea or vomiting.
• An empty bladder is important, especially if the time in the CT scan may be prolonged, as for a CT-guided biopsy or nerve root block.
• Patient anxiety may be eased by the technologist’s calm demeanor. After confirming the patient’s identity, the technologist introduces himself or herself, gives a short explanation of the procedure and the reason for using contrast, and describes expected sensations (heat, noise, table movement, need for staying still).
• Contrast injection requires a review of known drug/contrast allergies and of the renal function to minimize contrast reactions and kidney impairment resulting from contrast-induced nephropathy. (This step may be done before the study is scheduled, but the technologist should be aware of this information before contrast is administered.) The appropriate needle size and injection site for the requested study can then be chosen.
• Cardiac medications may indicate poor cardiac function. This is relevant information for CTA.
• A comfortable position on the scanning table, with holding straps and warm blankets or cushions under the knees and elbows, may result in less motion, reducing image repetition and radiation dose.
• The eyes should be closed when the laser positioning light is used near the eyes.
The following may be helpful when the technologist is faced with challenging patients:
• Combative or uncooperative patients (because of, for example, head injury, psychiatric problems, dementia, and alcohol) require special precautions. More restraints than usual may be needed to obtain a diagnostic study. Use of rapid helical scanning (for example, 800 milliseconds, instead of the usual 1000 to 2000 milliseconds) reduces the resolution between gray and white matter, but the study will be of sufficient quality to demonstrate life-threatening lesions, such as an intracerebral hematoma and the degree of midline shift it has caused, necessitating urgent surgical intervention. The technologist must be very vigilant to avoid personal injury.
• Body fluid protection should always be observed (the minimum is gloves when dealing with a trauma patient). When appropriate, the patient or the technologist will need to wear a mask and gown (e.g., carriers of antibiotic-resistant bacteria, termed MRSA (for methicillin-resistant Staphylococcus aureus) or VRE (for vancomycin-resistant Escherichia coli).
POSITIONING
Image acquisition is obtained with the patient in a supine position. Occasionally, the prone position is required, as for paranasal sinuses, sella turcica, and some CT-guided procedures such as biopsies or nerve root or facet blocks.
A decubitus position, which is seldom used, is reserved for patients who cannot tolerate the supine position. The images can be rotated to a correct position on the reporting console. However, proper annotation of the images, as to side, is necessary for accurate reporting.
Patients with ankylosing spondylitis may present a special positioning challenge because of their severe kyphosis. Stabilizing the patient with cushions or folded blankets minimizes motion. If tilting the gantry to the desired plane is not feasible, helical images reformatted in the usual plane are often diagnostic. Severe scoliosis can be assessed in a similar fashion.
The technologist must center the area to be scanned in the center of the gantry, both horizontally and vertically. Choosing the correct field of view (FOV) to encompass the anatomy in question ensures a quality study. The reference detectors must not receive interference from equipment or coverings, such as restraints or blankets, to produce accurate CT numbers.
SCANNING PROTOCOLS
CT scanners are equipped with preset protocols/techniques and a variety of slice thicknesses, which may vary depending on the model and the manufacturer. Adjustments to radiation dose can be made on the basis of patient size. Locally developed protocols can also be used. This usually consists of choosing a slice thickness and a plane of section for the organ or structure in question, as well as determining the route of contrast administration and dose.
Standardized departmental protocols, developed in collaboration with the radiologists, help to ensure image quality and facilitate patient throughput. Technological changes/updates will require protocol adjustments from time to time.
The following information is based on current usage at a single institution, which has four different types of helical CT scanners (single slice, eight slice, 16 slice, and 64 slice scanners). Protocols are adjusted to approximate results from each of the four scanners for the sake of uniformity. Some studies are only carried out on certain scanners to optimize the images (for example, temporal [petrous] bone).
Circumstances such as excessive motion may require changing the technique (milliamperage, time). Image quality will be decreased when a shorter scanning time is used, but the study should be adequate to rule out a surgical emergency.
Head and Its Contents
Two transverse scanning planes are widely used in brain imaging. In adults, the orbitomeatal baseline (OM line, also called Reid’s baseline or RBL) joining the infraorbital rim to the superior border of the external auditory meatus is favored because it results in better images of the orbits, sella turcica, posterior fossa, and brainstem. Some centers use the canthomeatal line (CM line), which joins the lateral canthus of the eye to the center of the external auditory canal. The angle measured between these two lines is 10 degrees.
In children, a steeply angled plane, commonly 20 to 25 degrees to the OM or CM line is used to scan the brain to avoid radiating the ocular lens leading to early cataracts (see Fig. 17-26, A, later in this section).
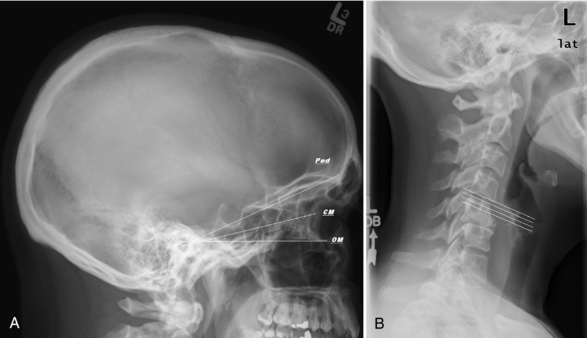
FIGURE 17-26 A, Lateral scout of skull with a selection of scanning planes: orbitomeatal (OM), canthomeatal (CM), and steeper “pediatric” angle to avoid the lens. B, Lateral scout of the cervical spine shows the optimum plane of section for imaging the cervical disks and larynx/vocal cords.
The transverse plane is still the most used plane for image interpretation of the skull and its contents. If reformatted images are required, it is better to acquire thin slices initially and to reformat the images. This technique is useful when scanning the orbits; for example, the lenses of the eyes are scanned only once, dental amalgam artifact is eliminated, and images in true coronal plane (perpendicular to the hard palate) are generated. Patient comfort is also increased compared with direct coronal imaging, when the neck must be hyperextended to achieve a near coronal position and the gantry tilted appropriately. Coronal sections are particularly useful when structures that run parallel to the transverse plane are assessed, such as the floor and roof of the orbits, the sella turcica and adjoining cavernous sinuses, and the skull base and vertex.
Exceptions to this approach exist. Direct coronal images of the temporal petrous bones/internal auditory canals and sella turcica are preferred because the resolution of the 0.6 to 1.25 millimeter (mm) slices is greater than with reformatted images and the orbits are avoided. Prone direct coronal images are also preferred in some centers for the study of paranasal sinuses because air-fluid levels tend to pool away from the path of drainage, known as the ostia, resulting in a better study than the supine transverse or hyperextended (supine coronal) positions. Thin transverse images with sagittal and coronal reformatted images are used when extension of the neck is not possible.
Sagittal images have not been used routinely in the past but are gaining in popularity. They are particularly useful when assessing midline structures and midline abnormalities of the brain and spine.
The algorithm (or kernel) chosen will affect the resolution of the images. In some cases, it may be possible to acquire diagnostic images using a low milliamperage, as with paranasal sinuses or facial bones. Fractures, sinusitis, and nasal polyps can easily be assessed this way, using only a bone algorithm or equivalent kernel. Temporal (petrous) bones, on the other hand, need a higher milliamperage to get accurate detail of the densest bone in the body and its small structures, such as the cochlea, semicircular canals, and ossicles.
Contrast enhancement is not visible on bone algorithm or bone windows. When contrast is used, images on soft tissue algorithms (standard or equivalent) are also required to see the enhancing tissue, such as with sinus tumors and chronic sinus infections.
Neck, Spine, and Cerebral Blood Vessels
Traditionally, the transverse plane was the preferred plane for interpretation. However, multiplanar reconstructions in coronal, sagittal, and oblique planes greatly enhance the radiologist’s ability to diagnose conditions affecting these areas, which contain bony curves (cervical lordosis, mandible), soft tissue curves (carotid bifurcation, cervical disk), and many overlapping organ systems (salivary glands, airway, lymph nodes).
To avoid artifacts on soft tissue algorithm caused by dental amalgam and capped teeth, when possible, transverse angled images on either side of the teeth can be obtained by tilting the gantry. The artifacts are not as distracting if only a bone algorithm (kernel) is needed, for example, to study only the bones; in that case, a single set of images may be acquired. Newer computer software allows reformation of images scanned with a different gantry tilt. This software may be on the scanner workstation or on the PACS (picture archiving communications systems) unit used for reporting.
The Neck: The face and neck contain salivary glands, chains of lymph nodes, and blood vessels. Fat delineates many compartments in the neck. Neck studies usually include images from the nasopharynx to the manubrium/jugular notch. IV contrast is used to help distinguish blood vessels from lymph nodes and muscles because metastatic lymph nodes are common in head and neck cancer.
Patients with neck masses may have difficulty breathing in the supine position. This presents a special challenge in positioning the patient. Some patients require a tracheostomy to lie supine, often resulting in the presence of subcutaneous emphysema marring some images.
Transverse images acquired in the same plane as the cervical disks are preferred because they are in the same plane as the true vocal cords, which are situated at the level of the small bilateral arytenoid cartilages. Sequential, rather than helical, acquisition is used because it improves resolution.
Special phonation techniques are occasionally used to assess the mobility of the vocal cords. After the routine image acquisition, the level of the true vocal cords is determined. A limited number of slices are then acquired while the patient vocalizes EEEEEE (in expiration) or a reversed EEEE (in inspiration).
The larynx is surrounded by a number of cartilages (Fig. 17-24).They can be fractured or dislocated with a blow to the front of the neck, affecting the airway and the voice. This is why bone algorithm of the cartilages of the neck is sometimes requested. The thyroid cartilage is larger and more calcified in men than in women. Reformatted sagittal and coronal images depict the cartilaginous abnormality to best advantage before repair.

FIGURE 17-24 A, Extensive subcutaneous emphysema outlines a normal thyroid cartilage. B, The thyroid gland is lacerated in the same patient.
The salivary glands include the parotid glands, the submandibular glands, the sublingual glands, and minor salivary glands scattered throughout the mouth. Benign and malignant tumors arise in them (Fig. 17-25). Calculi can obstruct salivary gland ducts.
The Spine: Spine imaging is acquired either perpendicular to the tabletop or by tilting the gantry to align the plane of section with the vertebral body end plate, as seen on the lateral scout image (Fig. 17-26, B).
The use of sequential versus helical scanning depends on the type of equipment available as well as the need for reformatted images. The equipment may or may not allow a gantry tilt with helical scanning. Depending on the indication for spine imaging, bone algorithm (kernel), with or without soft tissue algorithm is obtained.
Disk disease, spinal stenosis, and trauma do not require IV contrast. The disk, as shown in Figure 17-27, A, can be differentiated from the dural sac (filled with spinal cord, nerves, and CSF), intraspinal fat, ligaments (ligamentum flavum, posterior longitudinal ligament), and bones.
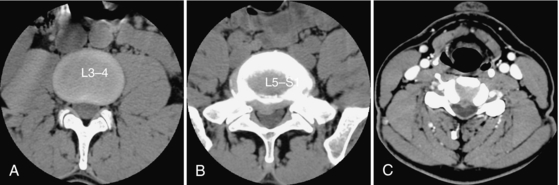
FIGURE 17-27 A, Normal lumbar disk (no contrast used). Lumbar (B) and cervical disk (C) herniations: the herniation of the smaller cervical disk is better seen when IV contrast is used.
Reformatted sagittal and coronal images help in the assessment of the alignment and the evaluation of scoliosis and spondylolisthesis. They show the nerves in the intervertebral foramina; they help to determine whether the nerves are being compromised by disk herniation or osteophytes. Quality coronal images are produced when the curves (kyphosis and lordosis) seen on the sagittal images are taken into account.
Because of its curved outline and smaller size, a cervical disk herniation is more difficult to diagnose than a lumbar disk herniation. Because IV contrast highlights the epidural veins and a herniated disk will displace these veins, IV contrast is used frequently (but not by everyone) to better outline a cervical disk herniation (Fig. 17-27, B). A continuous drip infusion or preferably a pump injection will highlight these veins.
Cerebral Blood Vessels: CTP is one form of CTA used in suspected acute brain infarction to determine the amount of brain tissue at risk of permanent damage. The perfusion study is usually followed immediately by the CTA study. The CTP and CTA each require injection of a bolus of contrast. The amount of contrast is adjusted to limit the total amount used in this instance. Our current practice is to use 50 milliliters (ml) of contrast for the CTP and 100 ml for the CTA. A CTA without CTP receives 100 to 150 ml of contrast, our limit for a single dose study (see Contrast Media Usage later).
A limited area of brain is repeatedly scanned (two-four locations currently) during the first contrast bolus for the CTP. These levels are determined by the radiologist or neurologist from the findings on the unenhanced CT and from the presumed area of infarction on the basis of the neurological examination.
Bolus tracking is used for the CTA to time the image acquisition to the peak of contrast in the cervical vessels by sampling the carotid just below the skull base. This is immediately followed by the second bolus (if a CTP preceded the CTA) and acquisition of images from the aortic arch to the circle of Willis.
The technologist can produce maximum intensity projection (MIP) reformatted images or 3D surface-shaded images while the radiologist evaluates the CTP study on an independent workstation using a CTP software program provided by the manufacturer. Values of cerebral blood flow, blood volume, and mean transit time are determined by the radiologist to further evaluate the brain infarction and the amount of potentially salvageable brain.
A CTV images the head from the skull base to the vertex to look for thrombus in the dural (sagittal and transverse) sinuses and in the cortical veins. An 8- to 10-second delay is added to the CTA protocol before images are acquired. Sagittal and coronal reformatted images delineate the patency of these channels.
RADIOGRAPHIC TECHNIQUE
Milliamperage, Kilovoltage, Helical Pitch, and Rotation Time
The preset techniques and protocols supplied by manufacturers are helpful. However, the technologist must be able to manipulate milliamperage, kilovoltage, helical pitch, scan time, and slice thickness to suit the circumstances.
Increasing the milliamperage and the kilovoltage will improve the signal-to-noise ratio. Sufficiently high technique is necessary for contrast resolution of soft tissue in the brain (gray-white matter differentiation). Similarly, spine imaging in large patients can be improved by increasing the technique (by using the maximum kilovoltage and increasing the scan time).
Increasing the scan rotation time will result in better resolution because each image is generated from more projections.
Increasing the helical pitch results in a shorter scan time but reduces the overall image quality because of more interpolation in the scan data and vice versa.
Longer scan times can result in longer tube cooling and the possibility of patient motion (often a result of back pain).
Slice Thickness
Slice thickness should be adapted to the area of interest. Studies requiring reformatted images are acquired helically, with thin slices. Sequential image acquisition is preferred for brain, petrous bones, and neck masses, for better resolution.
Thin transverse sections show the base of the skull well, giving excellent definition of the temporal bones, pituitary fossa, facial bones, and foramina. Thicker slices increase the definition of gray and white matter in the brain.
The low density of various brain tissues, such as fat (in the myelin of white matter) and CSF, outlines components of the brain such as frontal and temporal lobes, basal ganglia, and ventricles. The high density of calcium is found in many normal structures inside the skull (pineal gland, choroid plexus) and must be differentiated from pathological calcium (tumor, AVM).
Spatial resolution is improved with thinner slices, at the cost of a decreased signal-to-noise ratio. Increasing the milliamperage and kilovoltage will improve the signal-to-noise ratio but will also increase the radiation dose.
The average slice thickness has decreased over the years, with the old 10-mm slice of the brain now being 2.5 to 5 mm. Our current practice for a routine head scan consists of 2.5- to 3-mm sequential slices in the posterior fossa and 5-mm slices for the rest of the head.
Orbits are studied with 1- to 2-mm helical slices and a small FOV (13-15 cm).
Temporal bone images are sequential 0.6 to 1 mm thick with a 10-cm field of view.
CTA image acquisition is 1-mm helical. CTP, on the other hand, uses cine mode and 5- to 10-mm thick slices; the tabletop may toggle back and forth during CTP image acquisition, depending on the scanner.
The cervical spine is imaged with helical 1- to 2-mm slices every 1 to 2 mm when good bone detail is needed. On the other hand, 2.5- to 3-mm sequential slices overlapped every 2 mm are used to look for a disk herniation. Wide shoulders present a challenge. Enlarging the field of view and increasing the technique may not always be successful in preventing overrange artifacts from the humeral heads. A swimmer’s position is used in some settings to decrease these artifacts.
Lumbar images consist of 3- to 5-mm sequential slices every 3 to 4 mm. One method uses overlapping thicker slices (for example, 7-mm slices every 4 to 5 mm) to improve visualization of herniated lumbar disks, for example, when scatter radiation is increased because of a large girth.
Matrix Size and Reconstruction Algorithms
Matrix size is predetermined at 512 × 512 on most current equipment. Some systems have a 1024 × 1024 matrix (e.g., Philips).
Many reconstruction algorithms are available. The three basic algorithms used for the brain, neck, and spine are the standard, the bone, and the detail algorithms (General Electric) or the Siemens kernels (31, 70, and 45 seconds).
The standard algorithm (and its equivalents) is chosen for most soft tissue imaging, such as the brain and the intervertebral disk, because it provides good contrast resolution. It is important to distinguish gray from white matter when looking for acute cerebral infarction.
The detail algorithm is useful when studying the soft tissues of the neck. It increases edge definition, especially when good definition of lymph nodes and fat planes is required.
The bone algorithm is used to increase the sharpness of the bony detail. This algorithm optimizes spatial resolution; contrast resolution is poor. This is why it should not be used in isolation when IV contrast is administered because tissue enhancement is not visible on bone windows or bone settings. However, bone algorithm is the preferred technique when subarachnoid (intrathecal) contrast has been injected by LP. This is true whether the imaging is of the spine (post myelography CT) or of the brain (CT cisternography).
CONTRAST MEDIA USAGE
Intravenously injected iodinated contrast media have been used since the early days of CT scanning to improve visualization of normal and abnormal structures. In recent years, safer nonionic and iso-osmolar contrast media have become available. Iodinated contrast does not interfere with MRI studies done on the same day.
By further attenuating the x-ray beam, structures containing the iodinated contrast are denser and thus more visible. In the brain, a number of normal structures enhance, including the blood vessels, the choroid plexus, the pineal gland, the pituitary stalk, and the meninges.
In the spine, the enhanced epidural veins, situated along the posterior margin of the vertebral bodies outline the disk margin along the spinal canal and adjoining nerve roots; the ability to diagnose a small disk herniation by the displacement of these veins is increased. In the neck, the enhanced vessels make the lymph nodes distinct because the nodes run chainlike along the vessels.
Abnormal tissue can enhance, either because the blood-brain barrier has been breached (e.g., malignant tumor or abscess in the brain) or because of an inflammatory response (e.g., scarring in the postoperative spine). The degree of enhancement is related to the method of contrast administration (drip infusion versus pump injection) and the dose and concentration of contrast received, as well as the delay between contrast administration and image acquisition.
In the brain and spine, most studies are performed with the IV drip method. This allows the contrast to “percolate” and enhance lesions such as meningioma and metastasis. At least 3 to 5 minutes is required after most of the contrast has been injected to reach satisfactory enhancement. A delay in image acquisition (up to 1 hour) can result in more pronounced enhancement. Because enhancement persists for hours, at least 6 to 8 hours should elapse after a contrast scan before an unenhanced CT is obtained. This will confirm that the enhancement is real and not the result of calcification or hematoma.
CT angiography (CTA and CTP) requires the opposite method. Images are acquired during rapid contrast injection by a pump to best opacify the cerebral blood vessels.
An antecubital vein and a large-bore needle (18 to 20 gauge) help deliver the contrast efficiently, at a rate of 3 to 5 ml per second. Care to avoid contrast extravasation in the arm is required. The volume injected per second in the vein should take its size in consideration. (Skin necrosis caused by extravasation may require a skin graft.) Specific instructions on what to do in such a case must be available to the technologist.
Use of indwelling catheters, such as percutaneous indwelling central venous catheter lines, is not recommended for pump infusion because their small size cannot handle the rate (volume/second) of injection. Site-specific instructions should be respected.
Pump injection is also used in studying the pituitary gland (sella turcica) for the presence of a microadenoma and the cervical spine for disk disease (to best outline the epidural veins) and neck masses.
Nonionic contrast media have decreased the number of mild and moderate contrast reactions (nausea, vomiting, urticaria, rigor) but have not altered the risk of anaphylactic reaction and death. Efforts to minimize contrast use and contrast volume are encouraged.
A standard dose of contrast is administered for each type of examination on the basis of patient weight up to a maximum. For example, our adult-only practice uses 3 ml of nonionic contrast per kilogram (kg), to a maximum of 150 ml for both the drip and pump methods. The current contrast concentration is 320 milligrams (mg) per ml of iodine. A single dose of iodine is thus 48 grams (gm) of iodine and a double dose is limited to 200 ml of contrast or 68 gm of iodine.
Variations do occur. Sella turcica studies use a bolus of 100 ml of contrast (32 gm of iodine).
Postoperative lumbar studies looking for epidural fibrosis (scar) use 200 ml of contrast, by the drip method (unless the patient weighs less than 100 pounds/45 kg.) because enhancement can be quite subtle with a single dose.
In younger patients with lung carcinoma, a workup for brain metastasis consists of 200 ml of contrast and at least a 30-minute delay to allow the contrast to enhance small (< 3 to 5 mm) metastases. Patients older than 75 years of age receive a single dose to protect their renal function.
Great care must always be exercised when iodinated contrast is administered. Contrast induced nephropathy (deteriorated kidney function as a result of iodine-based contrast) has been shown to significantly increase morbidity (and length of stay in hospital) and mortality rates. Patients at risk of having borderline or poor renal function, such as diabetics, heart patients, hypertensives, and the elderly, should have documented laboratory values such as a creatinine and estimated glomerular filtration rate (eGFR) before the contrast CT. A creatinine level in the normal range does not mean that the renal function is normal. The eGFR is a better indicator of normal function.
Our current practice is to look for alternative imaging if the creatinine is greater than 120 micromoles per liter (normal in our laboratory is 45-110 micromoles per liter) or the eGFR is less than 60 ml per minute per 1.73 square meters (normal >59).
Exceptions include acute trauma, when life is in danger from bleeding, and acute stroke, when “time is brain.”
Contrast media can be used (cautiously) in patients with multiple myeloma and a normal renal function. Reevaluation of the kidney function in the days after the CT is desirable. Good hydration after the CT may help prevent worsening of kidney function.
All our patients are encouraged to increase their intake of water or juice (but not coffee or cola, which are diuretic) in the hours before and after the examination.
Other types of central nervous system contrast media include air and subarachnoid iodinated contrast. Both are types of intrathecal (subarachnoid) contrast media.
Air was used, by an LP, to outline the internal auditory canal before the advent of MRI to look for an intracanalicular acoustic neuroma as a cause of deafness. When air is found today in the brain or spinal canal, it indicates that a communication exists between the environment and the central nervous system (such as a penetrating injury), raising the possibility of meningitis, or that a recent LP has been performed.
Iodinated subarachnoid contrast is used to look for leakage of CSF from the nose or ear (rhinorrhea, otorrhea) or in the spine (intracranial hypotension) and to study instrumented spines (postmyelogram). This type of contrast remains visible on CT for hours, even when it is no longer visible on fluoroscopy or plain films, so CT can be used to “rescue” a myelogram. A CT study in the first hour after intrathecal contrast injection is preferable. Occasionally, repeat CT scans after 6-, 12-, or 24-hour delays are used to detect clearance or accumulation of contrast, for example, in a spinal cord syrinx.
A CT of the brain obtained less than 24 hours after a myelogram will have an unusual appearance because of the reabsorption of the contrast by the brain before excretion by the kidneys; it will show greater gray-white matter differentiation than normal. This finding is most puzzling when the history of a myelogram performed at another institution in the prior 24 hours is not provided.
The assistance of CT technologists Donna Lopez and Ron Chitsaz in the preparation of the manuscript is very much appreciated. Any inaccuracy is entirely my own.