Computed Tomography of the Body
In the early years of computed tomography (CT), many were skeptical about its usefulness outside the central nervous system (CNS). Earlier scanners were unsuitable for examining the body because of the image degradation that occurred with patient motion and movement of internal organs during the 2 to 5 minutes required for a single slice. Within several decades, however, astonishing technologic advances including helical scanning techniques, multidetector arrays, subsecond scan times, near real-time reconstruction of images, and advanced viewing workstations have completely revolutionized CT. The latest generation of scanners can obtain up to 64 slices simultaneously at 0.5-millimeter (mm) collimation with 400 millisecond scan times. This enables extended ranges of coverage with thinner collimation and increased speed, allowing for large volume data acquisitions during single short breathholds. The resultant three-dimensional (3D) and multiplanar reformations (MPRs) are outstanding. CT of the body has therefore not only fulfilled but in fact surpassed the expectations of its early supporters and has become an important means of evaluating many pathological conditions. Magnetic resonance imaging (MRI) has replaced CT as the primary method of investigation for most diseases of the cranium, spinal cord, and musculoskeletal system; however, CT is still superior to MRI for most clinical indications in the chest and abdomen.
CLINICAL INDICATIONS
In addition to CT, a wide variety of radiological techniques are available for studying diseases of the body, including plain radiographs, barium studies, angiography, nuclear medicine, ultrasonography, and MRI. Clinicians are faced with the dilemma of which imaging method or methods to use and in what order. Often too many examinations are requested or studies are performed in the wrong sequence before a diagnosis is reached. For these reasons, the use of algorithms or flowcharts has become popular. The suggested approach, however, may not be the most appropriate for the individual institution when the limitations of available equipment and expertise are considered. The radiologist, acting as a consultant, should discuss the clinical problem with the referring physician and choose the most expeditious and cost-effective method or methods for answering the clinician’s questions. This chapter presents the major indications for CT of the body.
Chest and Mediastinum
Mediastinum: Almost all mediastinal abnormalities detected on chest radiographs (typically suspected masses) or suspected from clinical evidence can be confirmed with CT (Gamsu, 1992). CT is most commonly used to detect lymphadenopathy in patients suspected of having bronchogenic carcinoma, lymphoma, or other malignancies (Fig. 18-1). Although highly sensitive, CT and MRI have some limitations; they are less efficient at detecting tumors within normal-size nodes or differentiating between enlarged hyperplastic nodes without a tumor and tumor-containing nodes. CT is useful in patients known to have or suspected of having bronchogenic carcinoma; in these cases, CT is used to determine the extent of invasion of the chest wall, mediastinum, and diaphragm and to detect extrathoracic metastases in the liver and adrenal glands. MRI better demonstrates chest wall invasion and is more accurate in detecting mediastinal invasion and staging apical tumors (Manfredi et al, 1996; Tateishu et al, 2003).
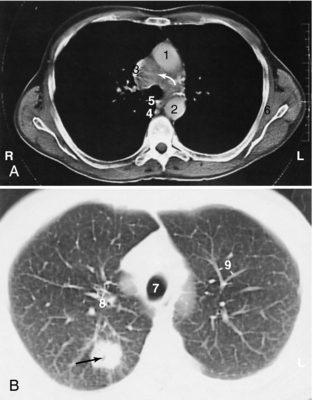
FIGURE 18-1 Bronchogenic carcinoma (black arrow) with pretracheal mediastinal lymphadenopathy (white arrow). 1, Ascending aorta; 2, descending aorta; 3, superior vena cava; 4, azygos vein; 5, esophagus; 6, subscapular muscle; 7, trachea; 8, segmental bronchi; 9, pulmonary vessels.
With enhancement of vascular structures in the mediastinum by use of intravenous (IV) contrast medium, an aneurysm can be differentiated from other mediastinal masses (Posniak et al, 1989) (Figs. 18-2 and 18-3). CT is highly accurate and comparable to MRI and transesophageal echo in detecting and defining the extent of traumatic aortic ruptures and aortic dissections (Sommer et al, 1996). Angiography is now rarely used to confirm these diagnoses.
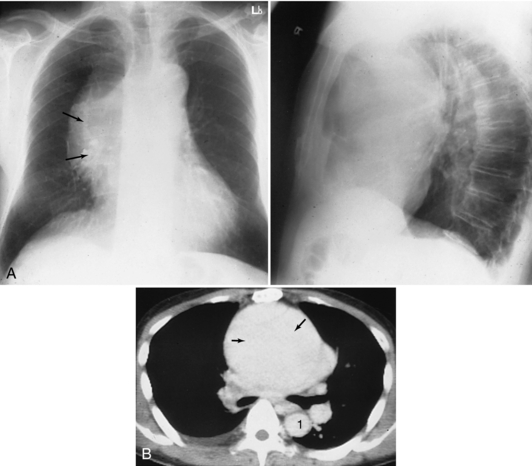
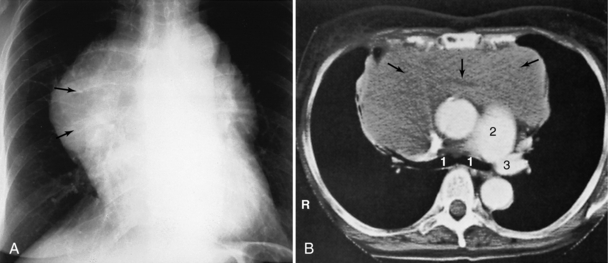
FIGURE 18-3 Lymphoma seen as an anterior mediastinal mass involving the thymus on helical CT scan (arrows). 1, Right and left main stem bronchi; 2, main pulmonary artery; 3, left pulmonary artery.
In patients with myasthenia gravis, CT can detect thymic masses not evident on chest radiographs (Fon et al, 1982). Cysts and fatty deposits are distinguished by their characteristic CT numbers. A specific diagnosis cannot be made with most other masses, but the relationship of the mass to surrounding structures and its location and extension within the mediastinum can be readily defined and a differential diagnosis suggested.
Lung: CT is the most sensitive technique for detecting pulmonary metastases (Muhm et al, 1978; Schaner et al, 1978). However, the increased sensitivity is achieved at the price of decreased specificity.* Benign lesions such as subpleural lymph nodes and granulomas can be detected, as well as a greater number of metastatic lesions. CT therefore is most useful in patients being evaluated for resection of metastatic pulmonary nodules, such as patients with osteogenic sarcoma. In the appropriate clinical setting, high-resolution CT (HRCT) can be diagnostic for lymphangitic carcinomatosis (Munk et al, 1988). CT also can be used to detect occult primary lung tumors in patients who show malignant cells on sputum cytological studies but who have normal chest x-ray films. Some investigators have used nodule densitometry (i.e., the measurement of nodule density with Hounsfield numbers) (Zerhouni et al, 1986) or the degree of contrast enhancement (Swensen et al, 1996) on CT to evaluate solitary pulmonary nodules that are indeterminate for malignancy on conventional radiographs.
Helical CT is more sensitive than ventilation/perfusion scans and of equal specificity in detecting pulmonary emboli (Mayo et al, 1997). Emboli are seen as filling defects in the enhanced pulmonary arteries (Fig. 18-4). CT will miss clots in the smaller subsegmental branches, but this may not be clinically significant unless the patient has severe underlying cardiac or pulmonary disease (Stein et al, 1995).
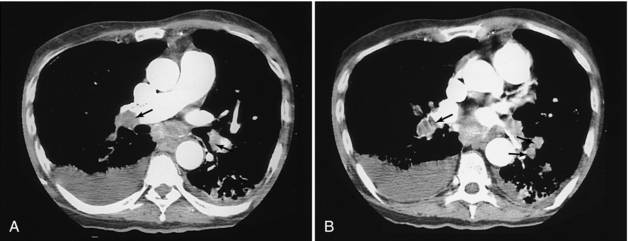
FIGURE 18-4 Multiple filling defects caused by pulmonary emboli in the pulmonary arteries of both lungs (arrows).
HRCT using thin sections has become the established method for evaluating diffuse lung diseases (Muller, 1991) (Fig. 18-5). When the CT findings are analyzed in the context of the clinical history, physical findings, pulmonary function tests, and laboratory data, characteristic HRCT findings may allow a confident diagnosis in conditions such as asbestosis, silicosis, and idiopathic pulmonary fibrosis. In some cases such as allergic alveolitis, HRCT findings may preclude the need for lung biopsy, or it can be used as a guide in selecting the best site for a biopsy. HRCT is more sensitive than chest radiography for detecting emphysema (Fig. 18-6), and it has replaced bronchography as the definitive method for detecting bronchiectasis (Pang et al, 1989).
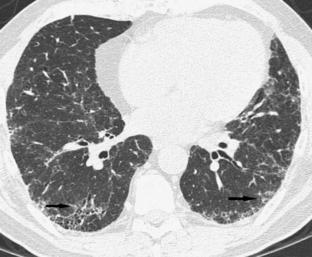
FIGURE 18-5 Peripheral interstitial changes (arrows) in both lungs typical of usual interstitial pneumonia. Image courtesy Dr. Nestor Muller, Vancouver Hospital.
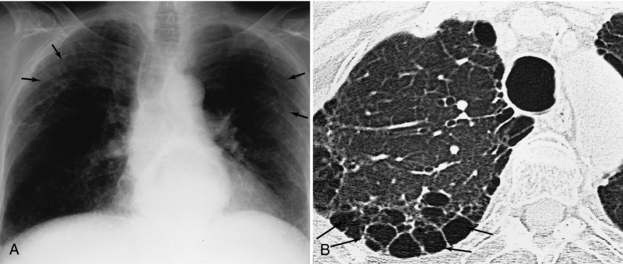
FIGURE 18-6 Additional interstitial changes (arrows) on plain films (A) are shown to have occurred as a result of paraseptal emphysema on high-resolution thin sections (B).
Multislice CT is the most effective way to image patients after blunt chest trauma, which is second only to CNS injury as a cause of posttrauma death. A myriad of injuries may result, including pulmonary contusion or laceration, pneumothorax, hemothorax, tracheobronchial laceration, diaphragmatic injury, and chest wall and spinal injuries. Although the chest radiograph is useful in detecting a number of potentially life-threatening conditions (e.g., tension pneumothorax, gross hemothorax), chest radiography is simply not sensitive enough to reliably identify or quantify the extent of most thoracic injuries.
Screening CT studies of the lungs to detect nodules has recently become popular, but this remains a highly controversial indication. This is primarily due to the high false-positive rate caused by benign nodules such as granulomas and lymph nodes and current lack of adequate studies to confirm decreased mortality rates from earlier tumor detection (Swensen et al, 2002).
Cardiac
The technology of the latest generation of CT scanners combining very rapid scanning with thin collimation, extended range, and electrocardiographic gating is enabling for the first time the ability to accurately study the coronary arteries noninvasively. It is possible to assess the degree of coronary artery calcification, to obtain angiograms of the coronary arteries, and to display these images in 3D and multiple other projections, in some cases eliminating the need for more invasive and risky catheter angiography. The same technology is also enabling the determination of ventricular volume as a function of time from which cardiac output, ejection fraction, stroke volume, and so forth can be calculated.
Coronary artery calcium scoring examinations are now widely performed to detect the extent of calcification in the coronary arteries and help clinicians manage patients at risk for a myocardial infarction. “Coronary artery disease is the single most important cause of death in North America, but traditional Framingham risk factor assessment* predicts only 60-65% of acute myocardial infarctions or sudden cardiac deaths. Coronary artery calcification has been shown to be an accurate marker for atherosclerotic disease” (Forster and Isserow, 2005). Typically 45 to 65 images are obtained, areas of calcification in the five major coronary branches are marked, and each plaque is assigned a score on the basis of its area and density. All the scores are added and adjusted for age and sex on the basis of existing data files.
The coronary arteries represent the ultimate challenge for CT angiography because of their small size, tortuous course, and pronounced rapid motion. Catheter coronary angiography has been the undisputed gold standard for many years; however, recent studies by Leschka et al (2005) and Raff et al (2005) have shown that CT can reliably identify significant coronary stenoses in vessels as small as 1.5 mm with a sensitivity of 94% to 95%, a specificity of 90% to 97%, and, very important, negative predictive values of 93% to 98%.* The latter indicates that multislice CT angiography (CTA) can be reliably used to noninvasively exclude significant coronary artery disease in patients with chest pain of uncertain etiology or whose other test results may be inconclusive or conflicting. The image quality is truly impressive.
Liver
Although CT is more sensitive than ultrasonography in the initial screening of the liver for focal lesions, ultrasonography continues to play a significant role in this regard because of the large volume of patients. CT is always used when ultrasonography results are inconclusive or when more detailed localization and characterization of lesions are required (Fig. 18-7).
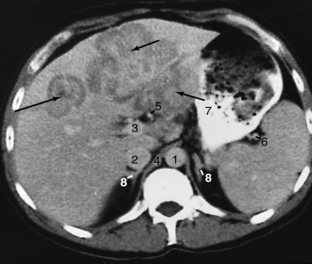
FIGURE 18-7 Hepatoma (arrows) involving the lateral and medial segments of the left lobe of the liver. 1, Aorta; 2, inferior vena cava; 3, portal vein; 4, crus; 5, hepatic artery; 6, splenic artery; 7, stomach; 8, adrenals.
Proper use of an IV contrast medium is important for detecting focal masses in the liver. Helical CT used with power injection boluses of contrast medium, with or without the help of bolus-tracking software, allows a so-called triphasic examination of the liver. This examination includes one series during the early arterial phase, a second during the venous phase, and a delayed scan. Dynamic CT, which involves multiple repeat scans at the same level or several selected levels, is helpful for demonstrating the characteristic contrast medium–enhancement pattern seen with hemangiomas (Freeny and Marks, 1986) (Fig. 18-8). CT hepatic angiography and CT arterial portography are probably still the most sensitive methods available for detecting additional tumor nodules (Hori et al, 1998) and are especially useful for planning hepatic resection. The introduction of multidetector scanners, however, has allowed the use of very thin scans (e.g., 2.5-mm collimation through the entire liver), and a study by Weg et al (1998) confirmed higher rates of detection and improved conspicuity of small liver lesions (less than 10 mm) compared with 5- to 10-mm collimation.
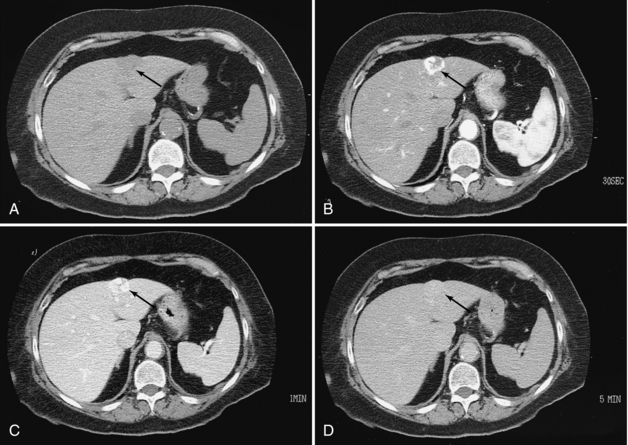
FIGURE 18-8 Hemangioma of the liver. A, Low-density mass in the left lobe (arrow). B, Arterial phase study demonstrates dense, lobulated peripheral enhancement (arrow). C, Venous phase study demonstrates that the lesion is filling in with the contrast medium (arrow). D, Delayed scan demonstrates complete filling in of the lesion, which is nearly isodense (arrow).
With a few exceptions, diffuse liver disease cannot be diagnosed by CT. Hemachromatosis, amiodarone therapy, and some glycogen storage diseases are associated with dense livers on CT (Goldman et al, 1985), whereas fatty infiltration is evidenced by a liver that is less attenuating than the spleen on unenhanced scans (Alpern et al, 1986).
CT and ultrasonography are equally accurate in demonstrating intrahepatic and extrahepatic bile ducts in jaundiced patients (Baron et al, 1982) (Fig. 18-9). CT is performed only if the ultrasound technique is unsuccessful. If dilated ducts are demonstrated and the obstructing lesion is not delineated, the next investigation usually is direct cholangiography (transhepatic cholangiography or endoscopic retrograde cholangiopancreatography) or MRI cholangiography.
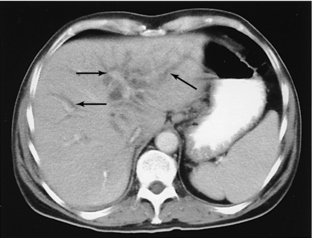
FIGURE 18-9 Dilated intrahepatic ducts (arrows) in a jaundiced patient known to have cholangiocarcinoma.
The liver is the second most common solid abdominal organ to be injured in blunt trauma; however, the majority of injuries can be treated conservatively. Contrast-enhanced CT can identify hematomas which may be subcapsular or parenchymal, lacerations, and evidence of active hemorrhage, which could mean the presence of a more severe vascular injury involving the inferior vena cava, portal veins, or hepatic artery (Shanmuganathan, 2004).
Spleen
The spleen is the most commonly injured solid organ in the abdomen, and trauma is the most common indication for scanning the spleen. Contrast-enhanced CT can diagnose the principal types of injury, namely, hematoma, laceration, and vascular injury (Fig. 18-10). The latter two more often require surgical intervention (Shanmuganathan 2004). Although focal masses can be seen in the spleen with both CT and ultrasonography, the results of spleen assessment in patients with lymphoma has unfortunately remained poor for both methods (Castellino et al, 1984).

Bowel
Barium studies and endoscopy traditionally have been the mainstays of alimentary tract investigation, CT is assuming an ever-increasing role because of its ability to delineate not only the lumen but also the bowel wall and adjacent structures. Virtual colonoscopy, or CT colonography, is a new development in gastrointestinal (GI) radiology that is challenging the barium enema and even colonoscopy in the detection of colon polyps (Hara et al, 1997). This technique involves cleansing the colon with a standard bowel preparation, insufflating the colon with air or carbon dioxide (or both), performing thin-section helical scans (typically 2-3 mm with overlapping reconstruction in both the supine and prone positions), and subsequently reviewing the images in cine or movie mode, as well as performing MPR. The data also can be volume rendered and displayed in a “fly through” navigation mode simulating colonoscopy (Fenlon et al, 1999). The results of preliminary studies have been extremely encouraging, rivaling or surpassing those of conventional methods (Pickhardt et al, 2003).
Although CT has proved not very accurate for staging of GI malignancies, it is still widely used for this purpose, primarily to prevent unnecessary surgery in cases that demonstrate strong evidence of unresectability because of local invasion or distant metastases, such as to the liver (Davies et al, 1997).
Plain radiographs are diagnostic in only about 50% to 60% of small bowel obstructions, equivocal in 20% to 30%, and normal or nonspecific in 10% to 20% (Mucha, 1987). CT can confirm an obstruction, determine the level and perhaps the cause, and often indicate whether vascular compromise is present in uncertain cases (Fig. 18-11) (Balthazar, 1994).
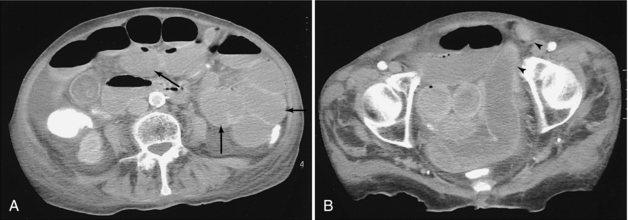
FIGURE 18-11 A, Small bowel obstruction as evidenced by the multiple dilated loops of proximal small bowel (arrows). B, A herniated loop in the left groin (arrowheads).
Barium studies remain the primary procedure for evaluating patients with inflammatory bowel disease, but CT is the key to studying the mural extent and detecting any extraintestinal involvement or complications such as phlegmons, abscesses, sinus tracts, and fistulas (Gore et al, 1996).
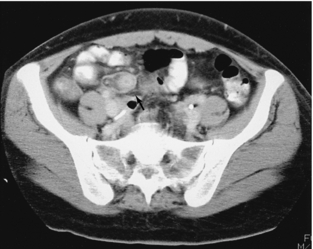
In approximately 20% to 33% of patients suspected of having appendicitis, the clinical presentation is atypical (Berry et al, 1984), requiring imaging. We prefer to perform graded compression sonography as the initial test; however, a number of studies have demonstrated greater accuracy with CT and therefore this should be considered an alternative, especially in obese patients or if the sonogram is inconclusive (Lane et al, 1997) (Fig. 18-12). Clinically, patients with diverticulitis typically have a fever and a tender mass in the left lower quadrant. CT can accurately determine the severity of involvement and whether a complicating abscess is present (Ambrosetti et al, 1997).
Although bowel injury resulting from blunt trauma is uncommon, CT can be used to differentiate between a full-thickness bowel wall injury that requires surgery and a less serious bowel wall contusion/hematoma or serosal tear.
Retroperitoneum
Pancreas: Previously the pancreas was a difficult organ to evaluate, clinically or with routine radiological studies. Cross-sectional imaging methods such as ultrasonography, CT, and MRI now permit direct demonstration of the pancreas. The role of MRI in the diagnosis of pancreatic disorders is still questionable, and the technique probably offers no significant advantages over CT. When the pancreas is well visualized on a sonogram, the accuracy is comparable to that of CT. In general, the success rate for delineating the entire pancreas is much higher with CT than with ultrasonography because bowel gas often obscures part or all of the pancreas (Hessel et al, 1982) (Fig. 18-13).
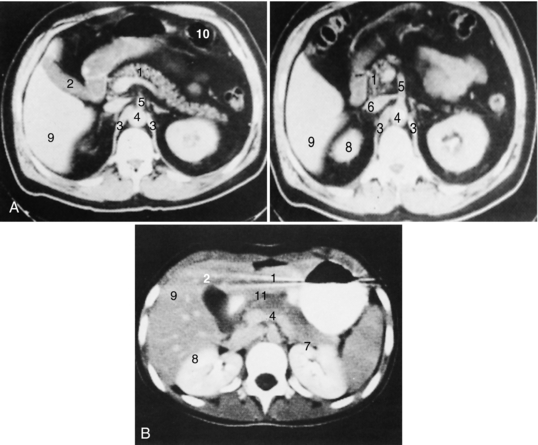
FIGURE 18-13 Normal pancreas in patient with abundant (A) and little (B) intra-abdominal fat. 1, Pancreas; 2, gallbladder; 3, crus of the diaphragm; 4, aorta; 5, superior mesenteric artery; 6, inferior vena cava with left renal vein; 7, left kidney; 8, right kidney; 9, liver; 10, bowel; 11, splenoportal confluence.
Acute pancreatitis is a clinical diagnosis, and normally neither CT nor ultrasonography is necessary. Imaging should be performed only when the diagnosis is uncertain, when complications are suspected (Siegelman et al, 1980), or when the clinical course is severe or unexpected. With acute pancreatitis CT is preferred mainly because of the high incidence of associated paralytic ileus, which obscures visualization of the pancreatic region by sonogram (Fig. 18-14). Larger pseudocysts can be monitored with ultrasonography, although CT generally provides a more graphic and complete delineation of the extent of involvement, and smaller changes in size and extent can be appreciated. A specific diagnosis of chronic pancreatitis can be made with CT if pancreatic calcification (often not seen on plain films) and pancreatic ductal dilation are noted.
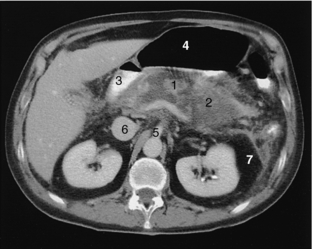
FIGURE 18-14 Acute pancreatitis. Necrotic pancreas (1) surrounded by fluid (2), duodenum (3), air-filled stomach (4), superior mesenteric artery (5), inferior vena cava (6), and perirenal fat (7).
Biphasic or triphasic examinations of the pancreas are helpful when searching for potential solid lesions in the pancreas. The arterial phase study with MPR or 3D reconstruction can delineate the vascular anatomy and help stage lesions by determining whether any vascular invasion is present. The parenchymal phase identifies adenocarcinomas as an area of diminished density because they tend to be hypovascular, whereas islet cell tumors, which are small and often difficult to identify (Rossi et al, 1985), appear as increased in density because of their hypervascularity. Solid pancreatic masses may be caused by a tumor (Fig. 18-15) or by focal inflammation, and differentiation may be difficult unless an ancillary finding such as liver metastases is also present. In most cases percutaneous aspiration or core needle biopsy under CT or ultrasonographic guidance for cytological and histological diagnosis is required (Sundaram et al, 1982) (Fig. 18-16).
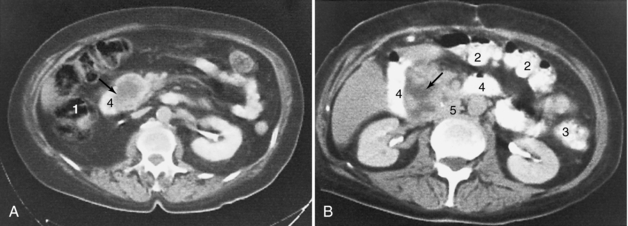
FIGURE 18-15 Enlargement of the head of the pancreas (arrows) caused by carcinoma (A) and pancreatitis that has occurred as a result of a perforated ulcer (B). 1, Ascending colon; 2, transverse colon; 3, descending colon; 4, duodenum; 5, inferior vena cava.

FIGURE 18-16 A, Carcinoma of the neck of the pancreas (arrows) with associated atrophy and dilation of the pancreatic duct. B, Aspiration biopsy of the mass with a 22-gauge needle. 1, Spleen; 2, gallbladder; 3, inferior vena cava with left renal vein; 4, dilated pancreatic duct with cystic changes; 5, needle tip.
Kidneys: Renal ultrasonography and excretory urography (or IV pyelography) traditionally have been the primary means of investigating the kidney, but CT has rapidly gained ground and conventional IV pyelography is now rarely performed. The investigation of renal colic, which was the exclusive domain of the IV pyelogram now is more effectively and rapidly diagnosed with noncontrast CT (Chen and Zagoria, 1999) (Fig. 18-17). CT is more sensitive in detecting stones (Smith et al, 1995), can delineate signs associated with obstruction (Smith et al, 1996), and aids in treatment planning primarily by determining stone size and location (Fielding et al, 1998). Although this study can certainly identify other causes of abdominal pain that may mimic renal colic, it is a limited examination because no contrast is administered and significant pathological conditions such as renal tumors may be missed. Another concern is the radiation dosage, especially if repeated studies might be needed.
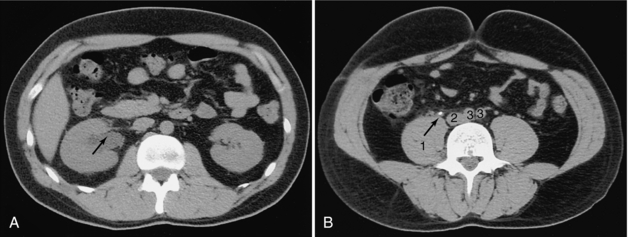
FIGURE 18-17 A, Dilated right renal pelvis (arrow). B, Calculus (arrow) in the right ureter. 1, Psoas muscle; 2, inferior vena cava; 3, iliac arteries.
In most cases, ultrasonography can distinguish a cystic from a solid mass. When a solid lesion is identified, CT is useful for preoperative staging (Johnson et al, 1987). It is also useful for detecting local recurrence after a nephrectomy. Bowel loops and displaced normal organs make ultrasonographic evaluation difficult. In patients with polycystic kidneys, the demonstration of cysts with higher attenuation is consistent with a diagnosis of an infected cyst or bleeding into a cyst (Levine and Grantham, 1985). Angiomyolipomas have a characteristic CT appearance demonstrating areas of fatty attenuation (Totty et al, 1981). Occasionally calculi may appear as filling defects in the renal pelvis, mimicking tumors or blood clots on pyelography. In these cases CT may be useful for differentiating a tumor (Fig. 18-18) from a faintly calcified stone, a distinction that may not be evident on plain film (Pollack et al, 1981). CT IV pyelographic examinations that combine two contrast injections with MPRs of the kidneys and collecting system are used to assess patients for unexplained hematuria, which previously required IV or retrograde pyelography studies.
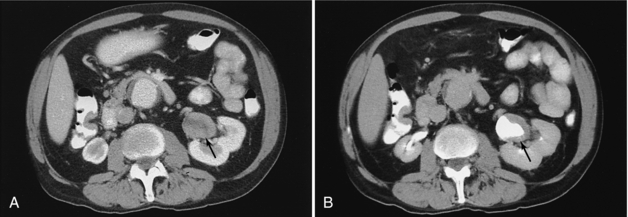
FIGURE 18-18 Solid mass in the renal pelvis (arrow) before (A) and after (B) contrast opacification of the renal pelvis.
Preoperative assessment of renal donors with 3D CT CTA studies provides the surgeon with a very graphic road map that demonstrates the number and location of renal arteries.
Adrenal Glands: CT has made it possible to delineate healthy adrenal glands easily and reliably, except when the patient is extremely thin (Abrams et al, 1982). If clinical and biochemical evidence of hyperfunction is present, CT usually is the only imaging method necessary. Pheochromocytomas and tumors causing Cushing’s and Conn’s syndromes that are larger than 5 mm are consistently demonstrated on CT. In adrenal hyperplasia, the adrenals may appear normal in size or may be slightly enlarged. Because small aldosteronomas may be missed on CT, adrenal venous sampling and venography are still important (Geisinger et al, 1983). Adrenal metastases, most commonly seen with bronchogenic and breast carcinomas, are readily demonstrated on CT and can be confirmed by biopsy.
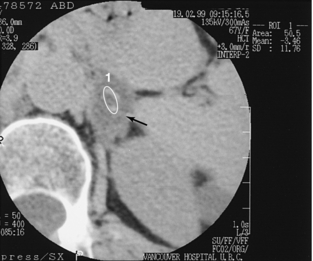
A common clinical problem is the incidentally discovered, nonfunctioning small adrenal mass. These masses most often are nonfunctioning adenomas with a high lipid content. Recent studies have concluded that if the attenuation coefficient of the mass is low (10 or lower) on a noncontrast scan or if there is >50% washout of enhancement on 10-minute delayed scanning compared with an 80-second delayed scan, a confident diagnosis of adenoma can be made (Mayo-Smith et al, 2001) (Fig. 18-19).
Miscellaneous: The other main indications for imaging of the retroperitoneum are detection of lymphomatous or metastatic lymph nodes (Fig. 18-20) and assessment of abdominal aortic aneurysms.
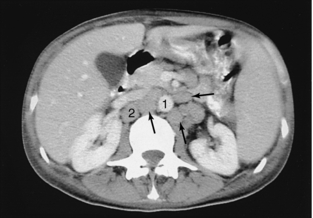
FIGURE 18-20 Enlarged paraaortic and paracaval lymph nodes (arrows). 1, Aorta; 2, inferior vena cava.
The retroperitoneum often is obscured on a sonogram because of bowel gas, fat, and bony structures. CT therefore is the superior and obvious imaging method of choice. Because the main criterion for abnormality is lymph node enlargement, false-negative CT results may occur when the internal architecture of the lymph node is distorted without any associated enlargement.
Ultrasonography is adequate for sizing and following up on abdominal aortic aneurysms. Preoperative assessment, however, generally requires CT (Siegel et al, 1994) or MRI (Prince et al, 1995) to determine the relationship of the aneurysm to the renal arteries, to precisely size the entire aneurysm, and to assess the iliac arteries, especially if endovascular grafting is considered. CT is also more useful when complications are suspected, such as rupture of an aneurysm (Fig. 18-21).
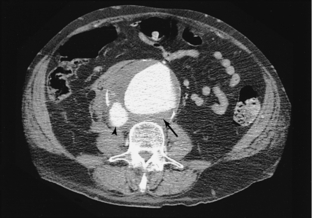
FIGURE 18-21 Large abdominal aortic aneurysm (arrow) that has ruptured into the IVC (arrowhead), resulting in abnormally dense contrast within the IVC.
Primary retroperitoneal tumors tend to be large when first suspected clinically. When masses are large enough to be detected on physical examination, an ultrasound examination can differentiate a cystic lesion from a solid one. CT is often performed, however, because it can provide additional information about the extent of disease and the relationship to normal structures.
Pelvis
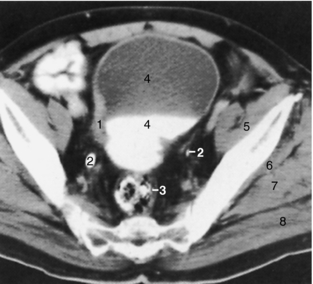
Ultrasonography remains the primary means of pelvic assessment. The main role of CT in the pelvis, apart from assessment of the bowel and as part of an overall trauma assessment, remains staging the extent of tumor involvement of the bladder (Fig. 18-22), prostate, uterus, and ovaries and documenting any change after treatment. However, MRI, because of its superior soft tissue contrast and multiplanar capability, is assuming a greater role in staging pelvic neoplasms.
Trauma
Trauma is the leading cause of death of individuals less than age 45 years (Novelline et al, 1999). CNS injuries as the cause of death rank the highest, followed by blunt chest trauma and then blunt abdominal trauma. Because of its high sensitivity, specificity, negative predictive value, speed, and ability to provide comprehensive information about not only abdominal injuries but also extra-abdominal injuries such as pelvic, spinal fractures, skull and facial fractures, pulmonary contusions, and pneumothorax, CT has become an integral component of the assessment of blunt abdominal and chest trauma, especially in specialized trauma centers (Shuman, 1997). A full-body trauma protocol can be completed in minutes, allowing scanning of all but the most hemodynamically unstable patients, who may require immediate surgery. By acquiring very thin helical axial slices (e.g., 0.5 mm), it is possible to subsequently use this same data to acquire MPR images to specifically assess the spine or major vascular structures (e.g., aorta). Grading schemes are available to help determine the extent of injury to various organs, which helps determine whether immediate surgery is required or whether conservative management is appropriate. Findings that are worrisome include evidence of active arterial extravasation, evidence of hypotension such as a collapsed inferior vena cava (IVC) or a small aorta, and the presence of free fluid. Measuring the Hounsfield units (HU) of fluid can be helpful for characterization purposes: extravasated contrast 85 to 350 HU, unclotted blood 25 to 50 HU, clotted blood 40 to 75 HU, and ascites, bile, urine, bowel contents 5 to 10 HU (Rhea, 2004).
CT has largely replaced other imaging methods and considerably reduced the need for exploratory laparotomies. The so-called FAST ultrasonography (focused abdominal sonogram in trauma), which is useful in screening for free intraperitoneal fluid, sometimes is performed first to identify patients more likely to have a positive CT result. However, FAST ultrasonography has a limited ability to define the extent and site of injury and cannot assess the retroperitoneal structures thoroughly (Molina et al, 1998).
Vascular System
The use of CT for aortic injury, dissection, coronary arteries, pulmonary arteries, renal arteries, and abdominal aortic aneurysms has already been discussed. CTA has largely replaced standard catheter angiography for the diagnosis of peripheral vascular disease. CTA can provide an angiographic caliber study that includes the entire aorta to the digital arteries in the foot (Fig 18-23). Catheter angiography is now largely reserved for interventional procedures such as angioplasty or stenting.
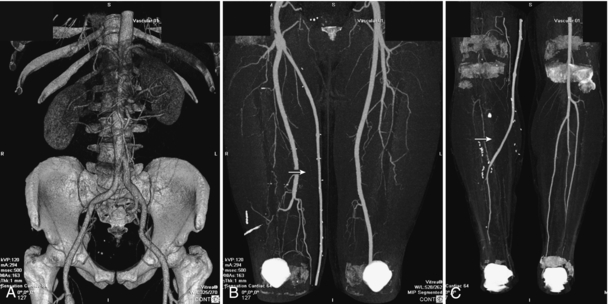
FIGURE 18-23 CT runoff angiogram demonstrating the entire vascular tree from the aorta to the lower calves. 3D reconstruction of the aorta and iliac arteries (A). Maximum intensity projection image of the thighs (B) demonstrating a femoral graft on the right (arrow) replacing the occluded superficial femoral artery. Maximum intensity projection image of the calves (C) demonstrating that the graft (arrow) has been anastomosed to one of the runoff branches. Most of the bony structures have been segmented and removed. Images courtesy Dr. Mike Martin, Vancouver Hospital.
Interventional Applications
Abscess Drainage: An abscess is a potentially curable condition. Because the morbidity and mortality rates associated with an undrained abscess are high, it is important to use whatever means are available to localize the abscess accurately, to determine the relationship to adjacent structures, including bowel loops, and to institute prompt treatment through the placement of drainage catheters (Callen, 1979; Gerzof et al, 1981; Halber et al, 1979). The advantage of CT over ultrasonography is that it is not limited by wounds, drains, ostomies, bandages, or bowel gas associated with paralytic ileus, which is common in postoperative patients. Extraluminal gas, although not always present, is the most specific CT sign of an abscess (Fig. 18-24). This may be missed on a sonogram because differentiation from normal bowel gas can be extremely difficult.

Biopsy: Cytological aspiration biopsy and core biopsy have proved to be effective, safe, and simple techniques for establishing a cytological or histological diagnosis for masses anywhere in the body (Ferrucci et al, 1980). The exact location of the needle tip relative to the tumor (see Fig. 18-19, B) can be displayed on CT; therefore even small lesions deep in the abdomen can be approached. This capability was enhanced by the introduction of CT fluoroscopy, which allows the radiologist to directly monitor the position of the needle tip by continuous scanning. The biopsy thus can be performed under direct vision rather than using the conventional “blind” approach of advancing the needle and then determining its location. Problems arising from erratic patient breathing are diminished, the procedure time is reduced, and the patient’s safety and comfort are improved.
Musculoskeletal System
CT generally is a problem-solving technique. It is often performed after plain films or radionuclide bone scans have already been used. Conventional tomography and arteriography, which formerly were used to determine the extent of disease, are now rarely used. With bony tumors, CT is useful in showing the location of the tumor in the bone, evaluating cortical integrity, articular involvement and intermedullary extent, and defining extraosseous extension (Schreiman et al, 1986). When soft tissues are involved, the relationship of these masses to important neurovascular structures can be determined (Fig. 18-25). However, because of its superior soft tissue contrast resolution (Boyko et al, 1987; Petasnik et al, 1986), MRI has replaced CT for many musculoskeletal applications.
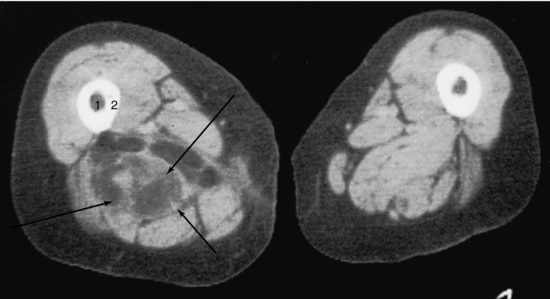
FIGURE 18-25 Liposarcoma (arrows) involving the right adductor magnus muscle. 1, Medullary canal; 2, cortex.
Skeletal trauma generally can be studied by standard radiographs. In complex anatomical regions, however, such as the pelvis, shoulder, foot, and ankle, more precise information about the presence, location, orientation, and relationship of fracture fragments can be obtained with CT (Guyer et al, 1985; Lange and Alter, 1980). In this regard, multiplanar reformations and 3D reconstructions can be extremely useful.
EXAMINATION PREPARATION
After the radiologist has determined that a CT scan is clinically indicated, the radiologist and technologist must plan the patient preparation, including the potential use of oral or IV contrast media, and the scanning protocol to be used. This can be done verbally or by written instructions. Patients need to be screened for potential contrast allergies and status of renal function. Patients with compromised renal function generally defined as a calculated glomerular filtration rate (GFR) of <60 have a threefold greater risk for development of contrast-induced nephropathy (CIN) compared with healthy individuals (McCullough et al, 1997). Two studies have found that CIN may occur in up to 15% of unselected patients undergoing contrast studies (Iakovou et al, 2003; McCullough et al, 2006). Each site should have in place specific protocols based on the patient’s calculated GFR. This may determine whether contrast is administered, which contrast agent is used (i.e., low osmolar or iso-osmolar), whether extra hydration is required, or whether the patient may require N-acetyl cysteine or sodium bicarbonate infusion.
The use of standard protocol sheets may be helpful. When these instructions are different from those routinely followed, it is important for the technologist to discuss the case individually with the radiologist so that the examination can be tailored specifically to the clinical problem. This is even more crucial with helical multislice scanners, which have a myriad of new and very specialized protocols. After reviewing the initial scans, the radiologist may extend, modify, or terminate the examination.
Patient Information
The “high-tech” aspect of CT does not diminish the importance of establishing good rapport with the patient. Patient cooperation can mean the difference between a poor-quality examination and a high-quality result. It is essential that the technologist explain procedures clearly before and during the CT study. The explanations should be brief and given in “lay” terms so that patients know what to expect and what is expected of them. A patient information sheet may be helpful, and pictures of scans may be of interest to the person.
Before the examination, the technologist should:
1. Briefly explain the process of CT.
2. Describe the examination to be performed, including the area of the body to be studied, and give an estimate of the duration of the examination.
3. Emphasize the importance of keeping still because of the image degradation that occurs with motion.
4. Give appropriate breathing instructions.
5. Have the patient empty the bladder immediately before the examination so that the patient is more comfortable and less likely to move, especially if the study involves use of an IV contrast medium.
6. If a contrast medium is to be used, explain the reason for its use and question the patient about allergies. A description of any unpleasant sensations the patient may feel from injection of the contrast material also should be given (this is especially important when mechanical power injectors are used).
7. Reassure the patient that the technologist, although not in the room, will be able to see and talk to the patient.
The patient should always be encouraged to ask questions about the examination. If the questions are more medical in nature, the patient should speak directly with the radiologist. It is important to remember that, although the examination is routine to the staff, it is not for the patient. In addition to being anxious and worried about the results of the examination, patients are fearful and concerned about the examination itself. The staff should try to make the “high-tech” study a “high-touch” experience and constantly be sensitive to the patient’s feelings.
Oral Contrast Media
The use of dilute oral contrast material to opacify the entire GI tract has been the typical standard of practice so that homogeneous, fluid-filled bowel loops are not mistaken for masses (Fig. 18-26) or gas-filled loops of bowel for abscesses. Proper opacification of the GI tract can be especially valuable in very thin patients who lack the amount of intra-abdominal fat necessary to outline various structures (see Fig. 18-13, B). To simplify the preparation for outpatients by not requiring them to pick up contrast before the scan and because of the improved resolution and multiplanar capabilities of current CT scanners, some radiologists are now satisfied to only administer water as the sole bowel preparation. A typical regimen is 1 liter (L) of water the night before followed by 1.5 L 1 to 2 hours before the scan and 300 to 400 milliliters (ml) immediately before the scan. If positive contrast agents are required, dilute barium sulfate solution (e.g., Readi-Cat 2.0% weight/weight 225 ml mixed with 275 ml of water and ingested the evening before and again 1 hour before the scan) and water-soluble iodinated contrast solutions (e.g., Telebrix 10 ml diluted in 900 ml of water or juice, 400 ml of this mixture ingested 2 hours before, 400 ml 1 hour before, and the remaining 100 ml immediately before the scan) are commonly used. The latter has the advantage of being able to more quickly opacify the entire small and large bowel, and therefore it is especially useful for inpatients who may require somewhat more urgent scanning. Barium sulfate suspension should not be used for patients suspected of having a GI perforation. However, when there is concern about a contrast reaction to iodinated compounds, barium sulfate solution should be used instead. Failure to give the patient the first dose, however, is not a reason to cancel or postpone the procedure; a small-volume contrast enema (150 to 250 ml) can be given to opacify the rectum and distal large bowel. The enema also distends the colon, whereas perioral techniques do not.
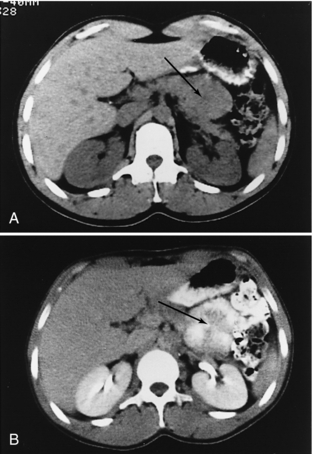
FIGURE 18-26 A, An apparent mass of the body of the pancreas (arrow). B, When an oral contrast medium is used, the mass is revealed to be multiple small bowel loops (arrow).
For assessment of gastric neoplasms, water alone with or without gas may be given instead of a positive contrast medium to distend the stomach. Some investigators distend the stomach with air or gas alone. An effervescent agent similar to that used in double-contrast upper GI examinations can be administered or a carbonated soft drink can be administered. This method allows good visualization of the gastric wall. If a patient cannot drink the oral contrast medium because of nausea and vomiting, air can be introduced through a nasogastric tube. However, the radiopaque markers used in nasogastric tubes to indicate their position on conventional radiographs can produce artifacts on CT; therefore, these should be removed before the examination, if possible, or at least replaced by ones that are not radiopaque.
If the patient has had a recent barium examination of the GI tract, sufficient time should be allowed for elimination of the contrast medium, or the colon can be cleansed of residual barium. Because residual barium can result in considerable image degradation caused by streak artifacts, the technologist should seek the advice of the radiologist if contrast is detected on the scout scan as the examination may need to be postponed.
CT colonography typically requires the use of purgatives, hydration, and dietary restriction to ensure a clean colon, although some recent studies have shown promising results without a full bowel preparation but instead tagging stool with contrast agents.
Intravenous Contrast Agents
IV contrast material is used for several purposes. The initial vascular opacification may be useful for anatomical localization, distinguishing vessels from a mass, determining the extent of vascular displacement or invasion by a tumor, assessing specific vascular disease such as aneurysms, stenoses, or loss of vascular integrity resulting in extravasation of the contrast medium. The subsequent extravascular distribution of contrast medium into various tissues helps confirm an intact blood supply of body organs and, to a limited extent, provides some functional assessment such as in opacification of the urinary tract. Often tumors and normal parenchyma do not enhance to the same extent or at the same time. This differential enhancement, which increases the attenuation difference between normal and abnormal tissue (Fig. 18-27), can be used to advantage to maximize lesion detectability. However, the timing of the scans and the contrast injection protocols must be chosen carefully because some lesions may be masked by tissue enhancement.
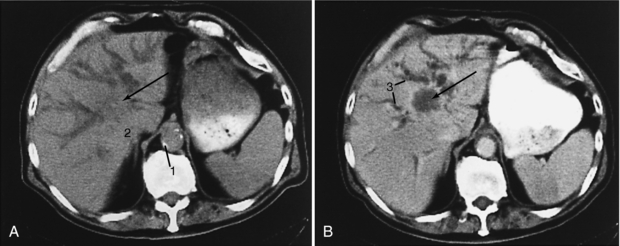
FIGURE 18-27 Cholangiocarcinoma (arrow). A, Precontrast scan. B, Postcontrast scan. The large mass at the porta hepatis is more evident on the postcontrast scan, which also better differentiates dilated bile ducts from blood vessels. 1, Aortic calcification; 2, adrenal gland; 3, dilated intrahepatic ducts.
The degree of contrast medium enhancement is the result of a combination of complex factors, including the rate, amount, and concentration of contrast material administered, the speed of injection, the timing of the scans, cardiac output, plasma expansion, extravascular redistribution, and renal filtration and excretion of the contrast material. Various approaches to IV administration of contrast material have been used, reflecting the inadequacies of any one method (Nelson, 1991). Drip infusion of contrast medium usually does not result in ideal enhancement because of inconsistent flow rates, which result in too slow a rise in the plasma iodine concentration. This method has largely been replaced by bolus injections, with some notable exceptions such as routine contrast medium–enhanced head scans and postoperative lumbar spine and cervical spine scans.
A mechanical injector is mandatory for use of injection rates as high as 5 or 6 ml per second and to obtain a sustained, reproducible level of contrast medium enhancement. This usually requires insertion of an 18- or 19-gauge short IV needle catheter into a medially directed antecubital vein connected to tubing capable of withstanding the pressures generated in high-flow injections. It is imperative that any air bubbles in the syringe and tubing be cleared before the final connection is made to the needle to prevent the possibility of a potentially fatal cerebral air embolus. The major disadvantage of a power injector is the slight risk of extravasation of contrast material into the soft tissues. It therefore is imperative that the patient be able to alert the technologist immediately if a local “burning” sensation occurs so that the injection can be stopped, preventing tissue damage. Most often the injector is loaded with 100 to 180 ml of 60% contrast medium, with injection rates varying from 1 to 6 ml per second depending on the specific indication.
Different delay times are used to match scanning with the arrival of contrast medium at the appropriate vessels and organs. These delays can be set empirically on the basis of experience and published data, or they can be tailored individually through the use of bolus tracking or automated techniques such as “SmartPrep” (General Electric) or “SureStart” (Toshiba). With use of helical or spiral volumetric acquisition, a large region (typically 30 centimeters [cm] or more) such as the entire liver can be easily examined in several seconds. The latest generation of scanners, with subsecond and multislice technology, enhances this capability (Berland and Smith, 1998) further by allowing even greater ranges or thinner collimation or both.
With a single bolus injection of contrast medium, the pattern of vascular enhancement during the first circulation and the pattern of vascular and tissue enhancement during recirculation can be studied. This method is useful for studying aortic dissection, in which flow in the false lumen is often delayed, and for evaluation of a possible hemangioma (see Fig. 18-8). In these a specific area may be examined dynamically and repeatedly over a period of time without table movement.
Other, more specialized techniques include selective catheterization and injection of specific vessels followed by CT scanning such as the proper hepatic artery for CT hepatic arteriography and the superior mesenteric artery or splenic artery for CT arterial portography (Nelson, 1991). These studies are reported to be more sensitive for detecting small liver lesions (less than 2 cm) than either MRI or biphasic CT (Hori et al, 1998).
SCANNING PROTOCOLS
Developing routine protocols is helpful. These protocols serve as general guidelines and can be modified as required, tailoring the examination to a particular patient’s clinical problem. In addition to the details specific to a region, scanning protocols should optimize the radiographic technique to maximize lesion detection. This requires careful consideration in choosing the appropriate kilovoltage (kV), milliamperage (mA), collimation, reconstruction interval, pitch, range, field of view (FOV), reconstruction matrix, field size, reconstruction algorithm, postprocessing filters, and window widths and levels.
Scanning protocols can vary significantly from site to site, primarily on the basis of the type of scanner that is being used and to some extent on the preference of the radiologists. The following protocols deal exclusively with helical (spiral) multislice scanners. Even among multislice scanners significant variations exist between 4-, 8-, 16-, 32-, and 64-slice scanners. Many centers with multislice scanners, especially 16 slice or greater, will use the narrowest detector collimation possible (typically 0.5 to 0.75 mm) to obtain a volume data set. These initial scans are used to obtain near isotropic voxels that enable excellent quality MPRs and 3D images. According to study requirements and department preferences, scans of varying thickness and in the axial, sagittal, or coronal planes may be reconstructed for diagnosis and documentation. Typically these will consist of contiguous or overlapping 2- to 5-mm thick images that are reconstructed from the initial volume data set.
Thorax
In most thoracic examinations, scanning begins superiorly from the level of the clavicles and extends to the posterior costophrenic angle. When a neoplasm is suspected, the scans should include the liver and adrenal glands. Because detection of liver metastases is maximized when scans are obtained immediately after administration of a contrast medium, it may be more appropriate to scan in a caudocranial direction through the liver and adrenal glands first and then superiorly through the remainder of the chest, where a high plasma iodine concentration is not as critical (Foley, 1989b). This is not necessary with current multislice scanners.
Scans are typically obtained in full inspiration during a single breath-hold therefore misregistration artifacts are no longer a problem (Costello et al, 1991). When the posterior lung base is the region of primary concern, prone scans may be helpful to increase aeration to this area. Lateral decubitus scans also are helpful in rare instances in distinguishing between complex pleural and pulmonary pathological conditions, such as differentiating an empyema from a large lung abscess.
Thoracic CT scans should be viewed with at least two different window width settings (Fig. 18-28). One of these should be optimized for the mediastinum and chest wall and the other for the lungs. If necessary, an additional setting for the bones should be used. The use of higher frequency filters for the lung parenchyma is helpful.
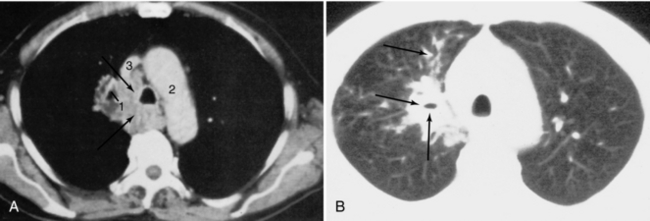
FIGURE 18-28 Bronchogenic carcinoma (arrows) involving the right hilum with mediastinal invasion and distal obstructive pneumonitis in the right upper lobe. A, Mediastinal window. B, Lung window. 1, Right superior segmental bronchus of the right upper lobe; 2, aortic arch; 3, superior vena cava.
Scans of the chest are generally obtained with the patient supine and the arms elevated. The arms should not be so high as to obstruct the flow of IV contrast material. Therefore some radiologists prefer to leave the arm with the IV line by the patient’s side, especially for high flow rate examinations, even though some artifacts will result.
Some radiologists believe that an IV contrast medium need not be used routinely because the anatomy of the mediastinal structures is not complicated and they are generally well delineated by the mediastinal fat. Contrast medium is useful, however, for better defining the mediastinum, for determining the relationship of the mass to the mediastinal vessels, or for checking for vascular abnormalities.
CT examination of the thorax usually begins with a digital localizing radiograph (e.g., scout view, topogram, or scanogram), typically in the anteroposterior projection. Scan levels can be prescribed from this image, and the scans obtained can be displayed on it. This can be helpful in correlating the CT images with a plain film abnormality and may be of some value in planning radiation therapy and guiding biopsy. Thicker slices (2.5 to 7 mm) obtained at 1.25- to 5-mm slice intervals are routinely used. Thinner sections of 1 to 2 mm may be used to improve spatial resolution, particularly in assessing the hila, fissures, and airways. When HRCT is used for assessing diffuse lung disease, 1- to 2-mm thick sections are used, often with a smaller FOV with target reconstruction and a high spatial frequency algorithm to improve spatial resolution (Mayo, 1991) (see Fig. 18-6).
Before the current generation of multidetector scanners, it was impractical to examine the entire chest by using contiguous thin slices. The examination therefore was tailored to the particular clinical indication. For the assessment of bronchiectasis and diffuse infiltrative lung disease, 1- to 2-mm thick sections obtained at 10-mm intervals was used most often. In assessing asbestos-related disease, a more limited examination consisting of five to eight scans spaced throughout the middle and lower thorax usually was sufficient. With multidetector scanners it is now feasible to examine the entire chest with contiguous thin slices, the main consideration being to balance benefit with risk with respect to radiation exposure, especially with repeated examinations. Because of the high intrinsic contrast, HRCT can be performed by using lower radiation (low mAs) techniques. Occasionally, selected scans obtained in expiration may be useful for determining the presence or extent of air trapping.
Abdomen and Pelvis
Scans are most commonly obtained with the patient supine. Scanning in the prone position may be useful for biopsy of posterior structures, such as the adrenal glands or retroperitoneal lymph nodes. CT kidneys-ureter-bladder (KUB) studies for renal colic are also typically performed in the prone position because bladder stones that are not impacted at the ureterovesical junction will be located in the dependent portion of the bladder.
All abdominal and pelvic scans are acquired helically using the narrowest detector collimation available. A general survey type examination generally consists of axial images reconstructed as 5-mm contiguous or overlapping slices. Adrenal and pancreatic studies are reconstructed at 2- to 3-mm thickness and generally with some overlap. Newer multislice scanners permit extended coverage and reduce scan times to 5 to 10 seconds for an average abdominal examination. Helical data acquisition using detector collimation of 0.5 to 0.75 mm allows retrospective reconstruction of varying slice thickness at closer intervals, including overlapping slices, if the raw data are saved. This provides tremendous flexibility in protocols, largely solves problems of volume averaging and provides excellent multiplanar reformations.
Images obtained without the use of a contrast medium usually are of limited value with the following exceptions: identification and characterization of calcific masses or renal calculi or to localize a hepatic lesion before rapid, contrast medium–enhanced, dynamic scans are obtained at the same level without table movement.
IV contrast medium generally is essential, particularly for evaluating the liver and pancreas. Several factors are important in the detection and differential diagnosis of liver lesions, including (1) the liver has a dual blood supply, from the hepatic artery and the portal vein; (2) arterial inflow occurs earlier than portal inflow; and (3) most neoplasms receive their blood primarily from the hepatic artery, whereas normal hepatocytes primarily receive their blood from the portal vein.
The early “arterial phase” scans with typical scan delays of 20 to 30 seconds best visualize highly vascular lesions, both benign and malignant, such as focal nodular hyperplasia, hepatic adenoma, hepatocellular carcinoma, and hypervascular metastases such as from the kidney, breast, and islet cell tumors (Fig. 18-29). The later “venous phase” scans with scan delays of 70 to 80 seconds are best suited for studying hypovascular lesions such as colon metastases that, lacking a portal venous supply, enhance much less than normal hepatocytes (Baron, 1994). The trend therefore is to perform these so-called biphasic examinations for many hepatic studies. In some cases delayed scans (e.g., 10 minutes) may be helpful in studying cholangiocarcinoma, which may show delayed enhancement and hemangioma by demonstrating contrast “filling in.”
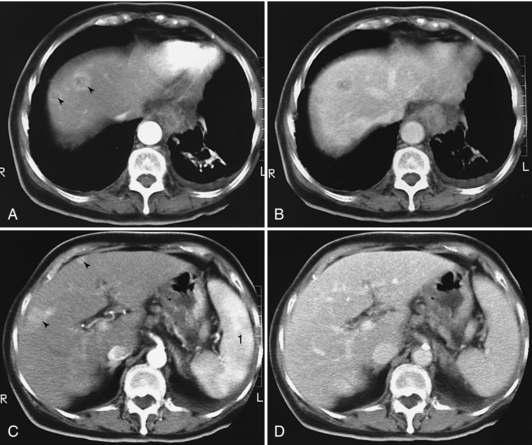
FIGURE 18-29 A and C, Scans obtained within 2 minutes of administration of a contrast medium reveal four hypervascular lesions. B and D, In “early delayed” scans (i.e., scans obtained approximately 5 minutes after injection of the contrast medium), two of the lesions have “disappeared” and two others are much less conspicuous. 1, Normal inhomogeneous appearance of the spleen during early enhancement by the contrast medium.
A biphasic protocol for pancreatic scans is also useful. The earlier arterial phase with injection of 100 to 120 ml of contrast medium at a rate of 4 to 5 ml per second, reconstructing thin (2.5 to 3 mm) overlapping images (every 1.5 to 2.5 mm) and a scan delay set to the time of aortic peak plus 5 seconds, optimally enhances the arteries and pancreatic parenchyma, allowing visualization of small hypodense or hyperdense masses (islet cell tumors) and demonstrating any vascular invasion (Hollett et al, 1995). The later venous phase with a scan delay of 70 seconds and 2.5- to 5-mm overlapping reconstructed images through the liver and pancreas delineates the peripancreatic veins, further helping to stage a pancreatic carcinoma. This phase is also best for detecting hepatic metastases from non-islet-cell tumors, which tend to be hypovascular.
Renal CT typically is performed to further characterize a renal mass or to stage a tumor. This is best done with a three-phase study: examination of the kidneys without a contrast medium (0.5-0.75 mm detector collimation, 2.5- to 5-mm slice thickness, 1.25- to 2.5-mm slice intervals) followed by examination after administration of the contrast medium (100 to 120 ml at 3.5 to 4 ml per second) with an early study in the corticomedullary phase (minimum 70-second delay) and by a later scan (3- to 5-minute delay) in the nephrographic or pyelographic phase (Fig. 18-30). The unenhanced scan is useful for detecting stones and fatty tumors (e.g., angiomyolipomas) and for establishing a baseline for determining whether a mass is enhancing. Performing two studies after administration of the contrast medium improves the detection of masses and provides better characterization and more accurate staging (Kopka et al, 1997).
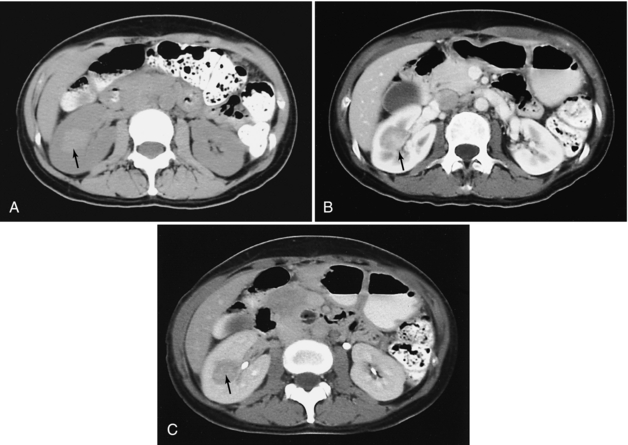
FIGURE 18-30 Renal carcinoma. A, Scan obtained before administration of a contrast medium demonstrates a mass of higher density (arrow) than renal parenchyma. This is atypical because most renal carcinomas are isodense or hypodense on studies done without use of a contrast medium; the higher density likely indicates recent hemorrhage. B, A corticomedullary phase scan demonstrates that the mass (arrow) is enhancing, but less than normal renal cortex. C, A nephrographic phase scan demonstrates the mass (arrow) with greater conspicuity because of the now homogeneous enhancement of the cortex and medulla. Contrast medium is also seen within the collecting system.
The protocol for the so-called CT KUB is designed specifically to identify renal and ureteral calculi, typically in the acute phase. Neither oral nor IV contrast material is administered. The range scanned extends from the top of the kidneys to the symphysis pubis. Our preferred protocol is to use 0.6-mm detector collimation with 5-mm thick slices reconstructed every 2.5 mm. The images are transferred to a workstation to be reviewed in cine or movie mode to facilitate interpretation. Only every third image is filmed. The radiation dosage can be significantly diminished by lowering the mA to 80 to 120 because more noisy images are adequate for the purposes of this examination.
For “routine” abdominal scans with less specific indications, an adequate protocol generally is 2.5- to 5-mm thick scans, administration of 100 to 120 ml of contrast medium at a rate of 2.5 ml per second, and a scan delay of 70 seconds.
The use of oral contrast medium has already been emphasized. When the pelvis is examined, use of a tampon is an easy means of anatomical localization of the vagina.
Musculoskeletal System
Because the anatomy of the musculoskeletal system varies from one region to another, the technique used for each patient should be tailored to the clinical problem. A computed radiograph is helpful for visualizing any bony abnormalities to determine the number, location, and range of images needed and to correlate with plain films.
Precise positioning is important. Whenever possible, the normal extremity should also be examined. The two sides should be symmetrically positioned and displayed to facilitate side-to-side comparison. Slice thickness and interval are determined by the clinical problem. For assessing most tumors and masses, 2.5- to 5-mm slices are adequate. Smaller lesions require 1- to 3-mm slices, and examination of smaller structures such as the ankle and wrist often requires 0.5- to 1-mm slices.
Once the images have been obtained, they should always be displayed and viewed at two window settings, soft tissue and bone settings. In some cases reconstruction of the images with higher resolution algorithms and higher spatial frequency filters may be necessary to improve bony detail. Multiplanar and 3D reconstructions can be helpful with complicated anatomy, particularly in the evaluation of fractures.
When tumors and their relationship to neurovascular structures are assessed, bolus injection of IV contrast material is required. Intra-articular injection of a contrast medium or air can be useful when joints are being evaluated, but these arthrographic examinations are now more often performed as MRI studies.
REFERENCES
Abrams, HI, et al. Computed tomography versus ultrasound of the adrenal gland: a prospective study. Radiology. 1982;143:121–128.
Alpern, MB, et al. Focal hepatic masses and fatty infiltration detected by enhanced dynamic CT. Radiology. 1986;158:45–49.
Ambrosetti, P, et al. Computed tomography in acute left colonic diverticulitis. Br J Surg. 1997;84:532–534.
Balthazar, EJ. CT of small bowel obstruction. AJR Am J Roentgenol. 1994;162:255–261.
Baron, RL, et al. A prospective comparison of the evaluation of biliary obstruction using computed tomography and ultrasonography. Radiology. 1982;145:91–98.
Baron, RL. Understanding and optimizing use of contrast material for CT of the liver. AJR Am J Roentgenol. 1994;163:323–331.
Berland, LL, Smith, JK. Multidetector-array CT: once again, technology creates new opportunities. Radiology. 1998;209:327–329.
Berry, J, Jr., Malt, RA. Appendicitis near its centenary. Ann Surg. 1984;200:567–575.
Boyko, OB, et al. MR imaging of osteogenic and Ewing’s sarcoma. AJR Am J Roentgenol. 1987;148:317–322.
Callen, PW. Computed tomographic evaluation of abdominal and pelvic abscesses. Radiology. 1979;131:171–175.
Castellino, RA, et al. Computed tomography, lymphography and staging laparotomy: correlations in initial staging of Hodgkin’s disease. AJR Am J Roentgenol. 1984;143:37–41.
Chen, MY, Zagoria, RJ. Can noncontrast helical computed tomography replace intravenous urography for evaluation of patients with acute urinary tract colic? J Emerg Med. 1999;17:299–303.
Costello, P, et al. Pulmonary nodule: evaluation with spiral volumetric CT. Radiology. 1991;179:875–876.
Davies, J, et al. Spiral computed tomography and operative staging of gastric carcinoma: a comparison with histopathological staging. Gut. 1997;41:314–319.
Fenlon, HM, et al. A comparison of virtual and conventional colonoscopy for the detection of colorectal polyps. N Engl J Med. 1999;341:1496–1503.
Ferrucci, JT, Jr., et al. Diagnosis of abdominal malignancy by radiologic fine needle biopsy. AJR Am J Roentgenol. 1980;134:323–330.
Fielding, JR, et al. Unenhanced helical CT of ureteral stones: a replacement for excretory urography in planning treatment. AJR Am J Roentgenol. 1998;171:1051–1053.
Foley, WD. Dynamic hepatic CT. Radiology. 1989;170:617–622.
Fon, GT, et al. Computed tomography of the anterior mediastinum in myasthenia gravis. Radiology. 1982;142:135–141.
Forster, BB, Isserow, S. Coronary artery calcification and subclinical athersclerosis: what’s the score? BCMJ Br Columbia Med Assoc Journal. 2005;47:181–187.
Freeny, PC, Marks, WM. Hepatic hemangioma: dynamic bolus CT. AJR Am J Roentgenol. 1986;147:711–719.
Gamsu, G. The mediastinum. In Moss AA, et al, eds.: Computed tomography of the upper body with magnetic resonance imaging, 2, Philadelphia: WB Saunders, 1992.
Geisinger, MA, et al. Primary hyperaldosteronism: comparison of CT, adrenal venography, and venous sampling. AJR Am J Roentgenol. 1983;141:299–302.
Gerzof, SG, et al. Percutaneous abscess drainage. Semin Roentgenol. 1981;16:62–71.
Goldman, IS, et al. Increased hepatic density and phospholipidosis due to amiodarone. AJR Am J Roentgenol. 1985;144:541–546.
Gore, RM, et al. CT features of ulcerative colitis and Crohn’s disease. AJR Am J Roentgenol. 1996;167:3–15.
Guyer, BH, et al. Computed tomography of calcaneal fractures: anatomy, pathology, dosimetry, and clinical relevance. AJR Am J Roentgenol. 1985;145:911–919.
Halber, MD, et al. Intraabdominal abscess: current concepts in radiologic evaluation. AJR Am J Roentgenol. 1979;133:9–13.
Hara, AK, et al. Detection of colorectal polyps with CT colography: initial assessment of sensitivity and specificity. Radiology. 1997;205:59–65.
Hessel, SJ, et al. A prospective evaluation of computed tomography and ultrasound of the pancreas. Radiology. 1982;143:129–133.
Hollett, M, et al. Quantitative evaluation of pancreatic enhancement during dual-phase helical CT. Radiology. 1995;195:359–361.
Hori, M, et al. Sensitivity in detection of hypervascular hepatocellular carcinoma by helical CT with intraarterial injection of contrast medium and by helical CT and MR imaging with intravenous injection of contrast medium. Acta Radiol. 1998;39:144–151.
Iakovou, I, et al. Impact of gender on the incidence and outcome of contrast-induced nephropathy after percutaneous coronary intervention. J Invasive Cardiol. 2003;15:18–22.
Johnson, CD, et al. Renal adenocarcinoma: CT staging of 100 tumors. AJR Am J Roentgenol. 1987;148:59–63.
Kopka, L, et al. Dual-phase helical CT of the kidney: value of the corticomedullary and nephrographic phase for evaluation of renal lesions and preoperative staging of renal cell carcinoma. AJR Am J Roentgenol. 1997;169:1573–1578.
Lane, MJ, et al. Unenhanced helical CT for suspected acute appendicitis. AJR Am J Roentgenol. 1997;168:405–409.
Lange, TA, Alter, AJ. Evaluation of complex acetabular fractures by computed tomography. J CAT. 1980;6:849–852.
Leschka, S, et al. Accuracy of MSCT coronary angiography with 64-slice technology: first experience. Eur Heart J. 2005;10:1093–1100.
Levine, E, Grantham, JJ. High-density renal cysts in autosomal dominant polycystic kidney disease demonstrated by CT. Radiology. 1985;154:477–482.
Manfredi, R, et al. Accuracy of computed tomography and magnetic resonance imaging in staging bronchogenic carcinoma. MAGMA. 1996;4:257–262.
Mayo, JR. The high-resolution computed tomography technique. Semin Roentgenol. 1991;26:104–109.
Mayo, JR, et al. Pulmonary embolism: prospective comparison of spiral CT with ventilation-perfusion scintigraphy. Radiology. 1997;205:447–452.
Mayo-Smith, WW, et al. State-of-the-art adrenal imaging. Radiographics. 2001;21:995–1012.
McCullough, PA, et al. Acute renal failure after coronary intervention: incidence, risk factors, and relationship to mortality. Am J Med. 1997;103:368–375.
McCullough, PA, et al. Risk prediction of contrast-induced nephropathy. Am J Cardiol. 2006;98:5K–13K.
Molina, PL, et al. Computed tomography of thoracoabdominal trauma. In Lee JKT, et al, eds.: Computed body tomography with MRI correlation, 3, New York: Raven Press, 1998.
Mucha, P, Jr. Small intestinal obstruction. Surg Clin North Am. 1987;67:597–620.
Muhm, JR, et al. Comparison of whole lung tomography and computed tomography for detecting pulmonary nodules. AJR Am J Roentgenol. 1978;131:981–984.
Muller, NL. Differential diagnosis of chronic diffuse infiltrative lung disease on high-resolution computed tomography. Semin Roentgenol. 1991;26:132–142.
Munk, PL, et al. Pulmonary lymphangitic carcinomatosis: CT and pathologic findings. Radiology. 1988;166:705–709.
Nelson, RC. Techniques for computed tomography of the liver. Radiol Clin North Am. 1991;29:1199–1212.
Novelline, RA, et al. Helical CT of abdominal trauma. Radiol Clin North Am. 1999;37:591–612.
Pang, JA, et al. Value of computed tomography in the diagnosis and management of bronchiectasis. Clin Radiol. 1989;40:40–44.
Petasnick, JT, et al. Soft tissue masses of the locomotor system: comparison of MR imaging with CT. Radiology. 1986;160:125–133.
Pickhardt, PJ, et al. Computed tomographic virtual colonoscopy to screen for colorectal neoplasia in asymptomatic adults. N Engl J Med. 2003;349:2191–2200.
Pollack, HM, et al. Computed tomography of renal pelvic filling defects. Radiology. 1981;138:645–651.
Posniak, HV, et al. Computed tomography of the normal aorta and thoracic aneurysms. Semin Roentgenol. 1989;24:7–21.
Prince, MR, et al. Breath-hold gadolinium-enhanced MR angiography of the abdominal aorta and its major branches. Radiology. 1995;197:785–792.
Raff, GL, et al. Diagnostic accuracy of noninvasive coronary angiography using 64-slice spiral computed tomography. J Am Coll Cardiol. 2005;46:552–557.
Rhea, JT. CT of abdominal trauma: part 1. In: RSNA categorical course in diagnostic radiology: emergency radiology. Oak Brook, Ill: Radiological Society of North America; 2004:91–99.
Rossi, P, et al. CT of functioning tumours of the pancreas. AJR Am J Roentgenol. 1985;144:57–60.
Schaner, EG, et al. Comparison of computed and conventional whole lung tomography in detecting pulmonary nodules: prospective radiologic-pathologic study. AJR Am J Roentgenol. 1978;131:51–54.
Schreiman, JS, et al. Osteosarcoma: role of CT in limb-sparing treatment. Radiology. 1986;161:485–488.
Shanmuganathan, K. CT of abdominal trauma: part II. In: RSNA categorical course in diagnostic radiology: emergency radiology. Oak Brook, Ill: Radiological Society of North America; 2004:101–112.
Shuman, WP. CT of blunt abdominal trauma in adults. Radiology. 1997;205:297–306.
Siegel, CL, Cohan, RH. CT of abdominal aortic aneurysms. AJR Am J Roentgenol. 1994;163:17–29.
Siegelman, SS, et al. CT of fluid collections associated with pancreatitis. AJR Am J Roentgenol. 1980;134:1121–1132.
Smith, RC, et al. Acute flank pain: comparison of non-contrast-enhanced CT and intravenous urography. Radiology. 1995;194:789–794.
Smith, RC, et al. Acute ureteral obstruction: value of secondary signs on helical unenhanced CT. AJR Am J Roentgenol. 1996;167:1109–1113.
Sommer, T, et al. Aortic dissection: a comparative study of diagnosis with spiral CT, multiplanar transesophageal echocardiography, and MR imaging. Radiology. 1996;199:347–352.
Stein, PD, et al. Untreated patients with pulmonary embolism. Chest. 1995;107:931–935.
Sundaram, M, et al. Utility of CT-guided abdominal aspiration procedures. AJR Am J Roentgenol. 1982;139:1111–1115.
Swensen, SJ, et al. Lung nodule enhancement at CT: prospective findings. Radiology. 1996;201:447–455.
Swensen, SJ, et al. Screening for lung cancer with low-dose spiral computed tomography. Am J Respir Crit Care Med. 2002;165:508–513.
Tateishu, U, et al. Chest wall tumors: radiologic findings and pathologic correlation, 2: malignant tumors. Radiographics. 2003;23:1491–1508.
Totty, WG, et al. Relative value of computed tomography and ultrasonography in the assessment of renal angiomyolipoma. J CAT. 1981;5:173–178.
Weg, N, et al. Liver lesions: improved detection with dual-detector-array CT and routine 2.5-mm thin collimation. Radiology. 1998;209:417–426.
Zerhouni, EA, et al. CT of the pulmonary nodule: a cooperative study. Radiology. 1986;160:319–327. [The authors would like to thank Marilyn Stuart and Mary Jane Li for their help in typing and preparing the manuscript. They also would like to thank the CT technologists who helped acquire the CT scans and Dean Malpass and Rhonda Lancaster for manuscript assistance.].
*Sensitivity is defined as the likelihood that a test will be positive in an individual who has disease (i.e., the ability to detect disease). Specificity is defined as the likelihood that a test will be negative in an individual who has no disease (i.e., the ability to detect normalcy).
*Framingham risk factor assessment is a predictive algorithm that estimates the risk for development of angina, myocardial infarction, or coronary disease death over the course of 10 years. The factors considered include age, blood cholesterol levels, blood pressure, cigarette smoking, and diabetes mellitus.
*Negative predictive value is defined as the likelihood that a patient with a negative test truly has no disease.