Physics of Cardiac Imaging with Multiple-Row Detector Computed Tomography*
Mahadevappa Mahesh, MS, PhD and Dianna D. Cody, PhD*
Coronary heart disease (CHD) represents the major cause of morbidity and death in Western populations (American Heart Association, 2003). In 2003 alone, more than 450,000 deaths were associated with CHD in the United States; that translates to nearly one of every five deaths (American Heart Association, 2003). The economic burden on health care as a result of CHD is also enormous. Advances in multiple-row detector computed tomography (CT) technology have made it feasible for imaging the heart and to evaluate CHD noninvasively. Calcium scoring, CT angiography, and assessment of ventricular function can be performed with multiple-row detector CT (Mahnken et al, 2005). Coronary artery calcium scoring (Budoff et al, 2003; Ulzheimer and Kalender, 2003) allows patients at intermediate risk for cardiovascular events to be risk stratified. Coronary arterial anatomy and both noncalcified and calcified plaques are visible at coronary CT angiography (Dewey et al, 2004; Pannu et al, 2006b). Vessel wall disease and luminal diameter are depicted, and secondary myocardial changes may also be seen (Dewey et al, 2004; Pannu et al, 2006b; Schoenhagen et al, 2004).
Although the prime diagnostic tool to evaluate and treat CHD is coronary angiography (an x-ray fluoroscopy-guided procedure) and the fluoroscopically guided images are considered the standard of reference for comparing coronary artery image quality, the procedure is invasive and requires longer examination times than CT angiography, including patient preparation and recouping times. Images obtained with 16-row and 16+-row detector CT scanners are increasingly becoming comparable to those of the standard of reference (Hoffman et al, 2004).
The prospect of imaging the heart and coronary arteries with CT has been anticipated since the development of CT more than 3 decades ago. The lack of speed and poor spatial and temporal resolution of previous generations of CT scanners prevented meaningful evaluation of the coronary arteries and cardiac function. Most early assessments of the coronary arteries with CT were performed with electron beam CT, developed in the early 1980s (McCollough and Morin, 1994). Electron-beam CT has been used mostly for noninvasive evaluation of coronary artery calcium (Detrano, 1996), but other applications including assessment of coronary artery stenosis have been reported in limited cases. However, electron-beam CT is expensive and is not widely available.
Recent advances in CT technologies, especially multiple-row detector CT, have dramatically changed the approach to noninvasive imaging of cardiac disease. With submillimeter spatial resolution (<0.75 millimeters [mm]), improved temporal resolution (80-200 milliseconds [ms]) (Mahesh, 2006), and electrocardiographically (ECG) gated or triggered mode of acquisition, the current generation of CT scanners (16- to 64-row detectors) makes cardiac imaging possible (Flohr et al, 2005; Gerber et al, 2004; Klingenbeck-Regn, 1999, 2002; Nikolaou et al, 2004, Pannu et al, 2003) and has the potential to accurately characterize the coronary tree.
The purpose of this article is to describe the physics of cardiac imaging with multiple-row detector CT. The factors affecting temporal and spatial resolution are discussed along with scan acquisition and reconstruction methods, reconstruction algorithms, reconstruction interval, pitch, radiation dose, and geometric efficiency.
KEY ISSUES IN CARDIAC IMAGING WITH MULTIPLE-ROW DETECTOR CT
The primary challenge required to image a rapidly beating heart is that the imaging modality should provide high temporal resolution. It is necessary to freeze the heart motion to image coronary arteries located close to heart muscles because these muscles show rapid movement during the cardiac cycle. Because the most quiescent part of the heart cycle is the diastolic phase, imaging is best if performed during this phase. Hence, it is required to monitor the heart cycle during data acquisition. The subject’s ECG is recorded during scanning because the image acquisition and reconstruction are synchronized with the heart motion. Also, the imaging modality should provide high spatial resolution to resolve very fine structures such as proximal coronary segments (right coronary ascending and left anterior descending arteries) that run in all directions around the heart. These requirements impose greater demands on multiple-row detector CT technology. One of the primary goals of the rapid development of CT technology has been to achieve these demands to make cardiac CT imaging a clinical reality.
UNDERSTANDING THE PHYSICS OF CARDIAC IMAGING
To better demonstrate and understand the necessity for high temporal resolution in cardiac imaging, Figure C-1 shows how the length (in time) of the diastolic phase changes with heart rates. The least amount of cardiac motion is observed during the diastolic phase; however, the diastolic phase narrows with increasing heart rate. With rapid heart rates, the diastolic phase narrows to such an extent that the temporal resolution needed to image such subjects is less than 100 ms. The desired temporal resolution for motion-free cardiac imaging is 250 ms for heart rates up to 70 beats per minute and up to 150 ms for heart rates greater than 100 beats per minute. Ideally, motion-free imaging for all phases requires temporal resolution to be around 50 ms. The standard of reference for comparing the temporal resolution obtained with multiple-row detector CT is fluoroscopy, wherein the heart motion is frozen during dynamic imaging to a few milliseconds (1-10 ms). Therefore, the demand for high temporal resolution implies decreased scan time required to obtain data needed for image reconstruction; the scan time is usually expressed in milliseconds.
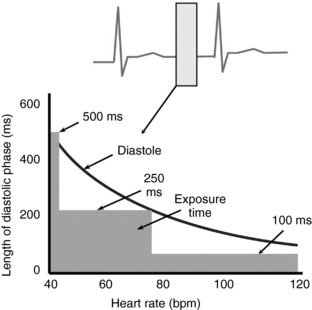
FIGURE C-1 Diagram shows the range of diastolic regions for varying heart rates. The desired temporal resolution for cardiac CT is approximately 250 milliseconds (ms) for average heart rates of less than 70 beats per minute (bpm); for higher heart rates, the desired temporal resolution is approximately 100 ms.
The demand for high spatial resolution that enables the visualization of various coronary segments (such as the right coronary artery, left anterior descending artery, and circumflex artery) that run in all directions around the heart with decreasing diameter is high. These coronary segments range from a few millimeters in diameter (at the apex of the aorta) and decrease to a few submillimeters in diameter as they traverse away from the aorta in all directions. The need to image such small coronary segments requires small voxels, and this is key to cardiac imaging with multiple-row detector CT. Spatial resolution is generally expressed in line pairs per centimeter or line pairs per millimeter. Like temporal resolution, the standard of reference for comparing spatial resolution is the resolution obtained during fluoroscopy. However, one of the major goals of multiple-row detector CT technology development has been to obtain similar spatial resolution in all directions, also expressed as isotropic spatial resolution (Mahesh, 2002).
In addition, a sufficient contrast-to-noise ratio is required to resolve small and low-contrast structures such as plaques. In CT, low-contrast resolution is typically excellent. However, it can degrade with the increasing number of CT detectors in the z direction as a result of increased scattered radiation that can reach detectors in the z direction. It is important to achieve adequate low-contrast resolution with minimum radiation exposure. The need to keep the radiation dose as low as reasonably possible is essential for any imaging modality that uses ionizing radiation.
Overall, cardiac imaging is a very demanding application for multiple-row detector CT. Temporal, spatial, and contrast resolution must all be optimized with an emphasis on minimizing radiation exposure during cardiac CT imaging.
Temporal Resolution
There are a number of factors that influence the temporal resolution achieved with multiple-row detector CT scanners. Among them, the key factors are the gantry rotation time, acquisition mode, type of image reconstruction, and pitch.
Gantry Rotation Time: Gantry rotation time is defined as the amount of time required to complete one full rotation (360 degrees) of the x-ray tube and detector around the subject. The advances in technology have considerably decreased the gantry rotation time to as low as 330 to 370 ms. The optimal temporal resolution during cardiac imaging is limited by the gantry rotation time. The faster the gantry rotation, the greater the temporal resolution achieved. However, with increasing gantry rotation speed, there is also an increase in the stresses on the gantry structure because rapid movement of heavy mechanical components inside the CT gantry results in higher gravitational forces, making it harder to achieve a further reduction in gantry rotation time. In fact, even a small incremental gain in the gantry rotation time requires great effort in the engineering design.
In the past, the minimum rotation time was as high as 2 seconds; in the past few years, gantry rotation time has decreased steadily to less than 400 ms. As discussed in the previous section and in Figure C-1, because the currently available gantry rotation time is not in the desired range for obtaining reasonable temporal resolution, various methods have been developed to compensate, such as different types of scan acquisitions or image reconstructions to further improve temporal resolution.
Acquisition Mode: For imaging the rapidly moving heart, projection data must be acquired as fast as possible to freeze the heart motion. This is achieved in multiple-row detector CT either by prospective ECG triggering or by retrospective ECG gating (Desjardins and Kazerooni, 2004).
Prospective Electrocardiographic Triggering: Prospective ECG triggering is similar to the conventional CT “step-and-shoot” method. The patient’s cardiac functions are monitored through ECG signals continuously during the scan. The CT technologist sets up the subject with ECG monitors and starts the scan. Instructions are built into the protocol to start the x rays at a desired distance from the R-R peak, for example, at 60% or 70% of the R-R interval. The scanner, in congruence with the patient’s ECG pulse, starts the scan at the preset point in the R-R internal period (Fig. C-2). The projection data are acquired for only part of the complete gantry rotation (i.e., a partial scan).
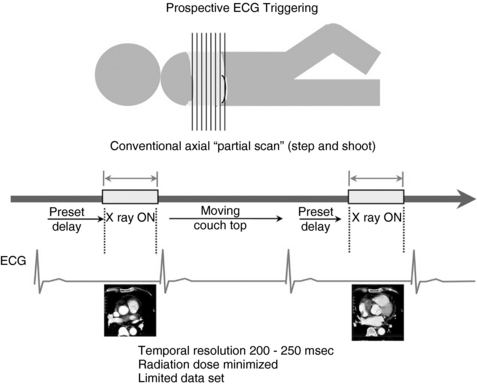
FIGURE C-2 During the prospective ECG-triggered scan mode, the patient’s ECG is continuously monitored, but the x rays are turned on at predetermined R-R intervals to acquire sufficient scan data for image reconstruction. The table is then moved to the next location for further data acquisition. These types of scans are always sequential and not helical and result in a lower patient dose because the x rays are on for a limited period. Calcium scoring scans are typically performed in this scan mode.
The minimum amount of projection data required to construct a complete CT image is 180 degrees plus the fan angle of the CT detectors in the axial plane. Hence, the scan acquisition time depends on the gantry rotation time. The best temporal resolution that can be achieved in the partial scan mode of acquisition is slightly greater than half the gantry rotation time. Once the desired data are acquired, the table is translated to the next bed position and, after a suitable and steady heart rate is achieved, the scanner acquires more projections. This cycle repeats until the entire scan length is covered, typically 12 to 15 centimeters (cm) (depending on the size of the heart).
With multiple-row detector CT, the increasing number of detectors in the z direction allows a larger volume of the heart to be covered per gantry rotation. For example, by use of a multiple-row detector CT scanner capable of obtaining 16 axial sections (16 rows of detectors with 16 data acquisition system channels in the z direction) and with each detector width of 0.625 mm, the technologist can scan a 10-mm (16 × 0.625 mm) length per gantry rotation. Similarly, with a 64-section multiple-row detector CT scanner (64 rows of detectors with 64 data acquisition system channels) and each detector 0.625 mm wide, about 40 mm per gantry rotation can be scanned. Typically, the cardiac region ranges from 120 to 150 mm, which can be covered in three to four gantry rotations with a 64-row detector CT scanner. This has a major advantage in terms of the decreased time required for breath holding to minimize motion artifacts (critical when sick patients are scanned).
One of the advantages of the prospective triggering approach is reduced radiation exposure because the projection data are acquired for short periods and not throughout the heart cycle. Temporal resolution with this type of acquisition can range from 200 to 250 ms. Prospective triggering is the mode of data acquisition used for calcium scoring studies because calcium scoring analysis is typically performed in axial scan mode. The scan technique such as tube current (milliamperes) for a calcium scoring protocol can be quite low, yielding low radiation dose because calcium has a high CT number and is easily visible even with a noisier background. Also, each data set is obtained during the most optimal ECG signal to reduce motion artifacts.
Retrospective Electrocardiographic Gating: Retrospective gating is the main choice of data acquisition in cardiac coronary artery imaging with multiple-row detector CT. In this mode, the subject’s ECG signals are monitored continuously, and the CT scan is acquired continuously (simultaneously) in helical mode (Fig. C-3). Both the scan projection data and the ECG signals are recorded. The information about the subject’s heart cycle is then used during image reconstruction, which is performed retrospectively, hence the name retrospective gating. The image reconstruction is performed either with data corresponding to partial scan data or with segmented reconstruction.
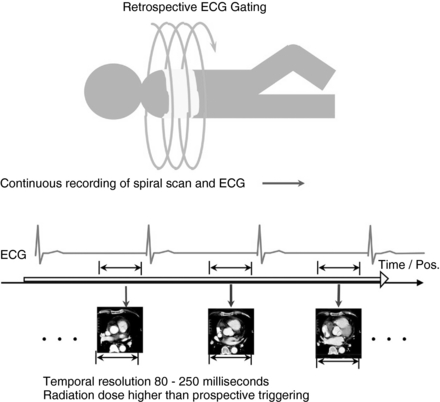
FIGURE C-3 During the retrospective ECG-gated scan mode, the patient’s ECG is continuously monitored and the patient table moves through the gantry. The x rays are on continuously, and the scan data are collected throughout the heart cycle. Retrospectively, projection data from select points within the R-R interval are selected for image reconstruction. Radiation dose is higher in this type of scan mode compared with that in the prospective triggering mode. Pos, Position.
In segmented reconstruction, data from different parts of the heart cycle are chosen so that the sum of the segments equates to the minimal partial scan data required for image reconstruction. This results in further improvements in temporal resolution. Temporal resolution with this type of acquisition can range from 80 to 250 ms.
The disadvantage of the retrospective gating mode of acquisition is the increased radiation dose because the data are acquired throughout the heart cycle, although partial data are actually used in the final image reconstruction. Also, because this scan is performed helically, the tissue overlap specified by the pitch factor is quite low, indicating excessive tissue overlap during scanning, which also increases radiation dose to the patients. The need for low pitch values or excessive overlap is determined by the need to have minimal data gaps in the scan projection data required for image reconstruction. The need for low pitch values is discussed in detail in the section on pitch.
Reconstruction Method: Cardiac data acquired with either prospective ECG triggering or retrospective ECG gating are used in reconstructing images. High temporal resolution images are obtained by reconstructing the data either with partial scan reconstruction or with multiple-segment reconstruction.
Partial Scan Reconstruction: Among the methods of image reconstruction in cardiac CT, the most practical solution is the partial scan reconstruction. Partial scan reconstruction can be used for both prospective triggering and retrospective gating acquisitions. The minimum amount of data required to reconstruct a CT image is at least 180 degrees plus the fan angle of data in any axial plane. This determines the scan time to acquire projection data needed for partial scan reconstruction and also limits the temporal resolution that can be achieved from an acquisition. The CT detectors in the axial plane of acquisition extend in an arc that covers at least a 30- to 60-degree fan angle. Therefore, during partial scan reconstruction, the scan data needed for reconstruction are obtained by rotating the x-ray tube by 180 degrees plus the fan angle of the CT detector assembly (Fig. C-4).
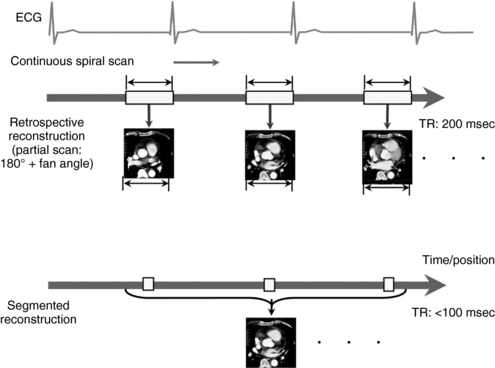
FIGURE C-4 Differences between partial scan reconstruction versus multiple-segment reconstruction. Top, During partial scan reconstruction, sufficient data from a prescribed time range within the R-R interval of one cardiac cycle are selected for reconstruction. Bottom, In multiple-segment reconstruction, sufficient data segments of the same phase from multiple cardiac cycles are selected for image reconstruction. Higher temporal resolution (TR) can be achieved with this type of reconstruction. msec, Milliseconds.
If the gantry rotation time is 500 ms, the time required to obtain the minimum scan data is slightly greater than half the gantry rotation time. This means that, for a gantry rotation of 500 ms, the scan time for acquiring data for partial scan reconstruction is around 260 to 280 jms. This value represents the limit of temporal resolution that can be achieved through partial scan reconstruction. To achieve further improvements in temporal resolution, the CT manufacturers are driving scanner gantry rotation time faster and faster. To date, the fastest commercially available gantry rotation time is 330 ms. In such scanners, the partial scan reconstruction temporal resolution can be as high as 170 to 180 ms. At the same time, the gravitational force generated from rapid gantry motion is growing exponentially and is reaching a limit for the existing technology. The demand for even higher temporal resolution has led to the development of dual-source CT, and some are even considering developing multiple x-ray source CT scanners.
Multiple-Segment Reconstruction: The primary limitation to achieving high temporal resolution with the partial scan approach is the gantry rotation time. To achieve even higher temporal resolution, multiple-segment reconstruction was developed (Flohr et al, 2005). The principle behind multiple-segment reconstruction is that the scan projection data required to perform a partial scan reconstruction are selected from various sequential heart cycles instead of from a single heart cycle (Fig. C-4). This is possible only with a retrospective gating technique and a regular heart rhythm. The CT projection data are acquired continuously throughout many sequential heart cycles.
The multiple-segment reconstruction method selects small portions of projection data from various heart cycles so that, when all the projections are combined, they constitute sufficient data to perform partial scan reconstructions. For example, if the technologist chooses to select half of the data set required for partial scan reconstruction from one heart cycle and the rest from another heart cycle, this results in temporal resolution that is about one fourth of the gantry rotation time. This is done by using projection data from two separate segments of the heartbeat cycle for image reconstruction. Further improvement in temporal resolution can be achieved by cleverly selecting projection data from three or four different heart cycles, resulting in temporal resolution as low as 80 ms.
In general, with multiple-segment reconstruction, the temporal resolution can range from a maximum of TR/2 to a minimum of TR/2M, where TR is the gantry rotation time (seconds) and M is the number of segments in adjacent heartbeats from which projection data are used for image reconstruction. Usually, M ranges from 1 to 4.
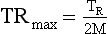
If TR = 400 ms and M = 1, then TRmax is as follows:

If TR = 400 ms and M = 2, then TRmax is as follows:

If TR = 400 ms and M = 3, then TRmax is as follows:
The advantage of multiple-segment reconstruction is the possibility to achieve high temporal resolution. The disadvantage is that, because projection data sets are obtained from different heartbeat cycles, a misregistration caused by rapid motion can result in the degradation of image spatial resolution. This method also allows selection of different packets of data for reconstructing an image for patients with irregular heart rates.
Overall, the temporal resolution of cardiac CT depends on the gantry rotation time. A gantry rotation time of 330 to 500 ms is possible with 16- to 64-channel multiple-row detector CT scanners. With such rapid gantry rotation time, one can achieve a temporal resolution of 80 to 250 ms through multiple- and partial-segment reconstruction, respectively. Temporal resolution improves with multiple-segment reconstruction (Fig. C-5); however, the spatial resolution can degrade as a result of misregistration of motion artifacts because projection data sets are selected from different heartbeats.
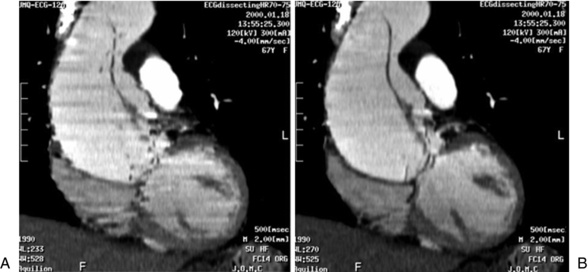
FIGURE C-5 Effect of temporal resolution on reconstructed images from the same patient. A, Partial scan reconstruction with temporal resolution of approximately 250 milliseconds. B, Multiple-segment reconstruction (two segments) yields a temporal resolution of approximately 105 milliseconds. The stairstep artifacts are less visible and the structures in the sagittal plane have a smooth edge compared with the appearance of partial scan reconstruction.
With both types of reconstruction, there is a demand for a significant amount of projection overlap during data acquisition, which is indicated by the pitch. Usually, the pitch ranges from 0.2 to 0.4 for cardiac CT protocols. This is quite different from routine body CT protocols, which are typically performed with pitch values of 0.75 to 1.50.
Spatial Resolution
There are a number of factors that influence the spatial resolution achieved with multiple-row detector CT scanners. Among them are the detector size in the longitudinal direction, reconstruction algorithms, and patient motion.
Effect of Detector Size: The effect of detector size in the z direction or out-of-plane spatial resolution is very significant and has become one of the driving forces in the advancement of multiple-row detector CT technology. Also, larger volume coverage in combination with a larger number of thin images requires more detectors in the z direction, which is the hallmark of technological advance in multiple-row detector CT. On the other hand, scan plane or axial spatial resolution has been very high from the beginning and is dependent on the scan field of view (SFOV) and image reconstruction matrix. Axial pixel size is the ratio of SFOV to image matrix; for example, for a conventional 512 × 512 matrix, the transverse pixel size for a 25-cm SFOV is 0.49 mm. On the other hand, the longitudinal or z-axis resolution mainly depends on the image thickness. The z-axis spatial resolution (image thickness) ranges from 1 to 10 mm in conventional (nonhelical) and in helical single-row detector CT. With multiple-row detector CT, the z-axis detector size is further reduced to submillimeter size.
Initially, with the introduction of multiple-row detector CT technology, the thinnest detector size was 0.5 mm and there were only two such detectors. However, within a few years, the technology improved to provide 16 of these thin detectors, ranging from 0.625 to 0.5 mm. With 64-section multiple-row detector CT scanners, the detector array designs are as shown in Fig. C-6; 64 thin detectors (0.625 mm) are currently available, resulting in z-axis coverage of up to 40 mm per gantry rotation (Mahesh, 2006). The increased spatial resolution with multiple-row detector CT scanners is demonstrated in Figure C-7. Cardiac CT images can be comparable in delineating details of the coronary vessels to the cardiac images obtained with fluoroscopy (Hoffman et al, 2004).
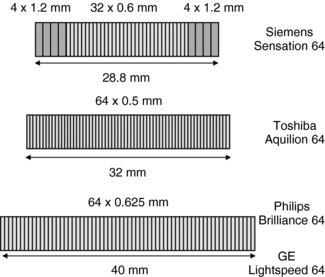
FIGURE C-6 Detector array designs for multiple-row detector CT scanners that can yield 64 sections per gantry rotation.
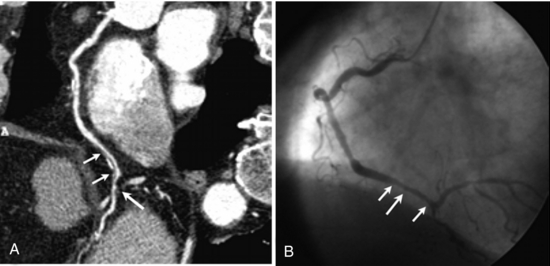
FIGURE C-7 Images from cardiac CT angiography (A) and fluoroscopically guided coronary angiography (B) show a right coronary artery (long arrow) with calcification (short arrows). The spatial resolution and delineation of details of CT angiography are comparable with those of coronary angiography. Reprinted with permission from Hoffmann MH et al: Noninvasive coronary imaging with MDCT in comparison to invasive conventional coronary angiography: a fast-developing technology, AJR Am J Roentgenol 182:601-608, 2004.
Reconstruction Interval: The reconstruction interval defines the degree of overlap between reconstructed axial images. It is independent of x-ray beam collimation or image thickness and has no effect on scan time or patient exposure. The reason for decreased reconstruction interval (or increased overlap) is to improve z-axis resolution, especially for three-dimensional (3D) and multiplanar reformation (MPR) images. If a diagnosis is made on the basis of only axial images, the reconstruction interval is not an issue. But frequently, physicians are also reading MPR and 3D images; this is especially true for cardiac CT.
For example, in a single examination the same cardiac data set (acquired at 0.5-mm detector configuration) was reconstructed with three different values of reconstruction interval (Fig. C-8). Overlapping axial images results in a relatively large number of images but can also result in improved lesion visibility in MPR and 3D images without increasing the patient dose. For routine MPR and 3D applications, a 30% image overlap is generally sufficient (1-mm section thickness with 0.7-mm reconstruction interval). For cardiac images, at least 50% overlap is desirable (0.5-mm section thickness with 0.25-mm reconstruction interval).
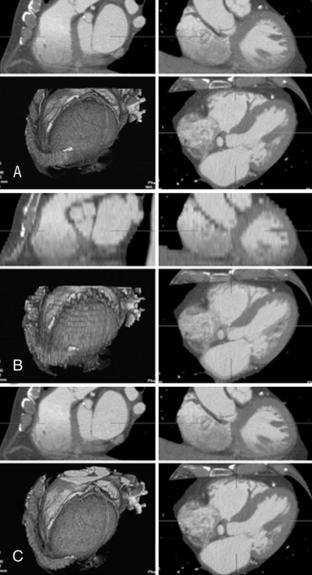
FIGURE C-8 Effect of reconstruction interval on image quality. All three sets of images are from the same data set reconstructed with 0.5-mm section thickness. However, the reconstruction intervals are different, which affects the number of reconstructed images and 3D image quality. A, A reconstruction interval of 0.3 mm yields 301 images and implies a 60% overlap. B, A reconstruction interval of 5 mm yields only 19 images and results in a staggered appearance of 3D images. C, A reconstruction interval of 0.5 mm yields 184 images and results in image quality similar to that of a. Normally, a 50% overlap is sufficient for optimum image quality for MPR and 3D images.
It should be recognized that too much overlap results in a large number of images, increases reconstruction time, can result in longer interpretation periods, and can put undue strain on image handling overhead costs (image transfer, image display, image archiving, and so forth) with no significant gain in image quality.
Overall, spatial resolution in the axial or x-y plane has always been quite high and is on the order of 10 to 20 line pairs per centimeter. The z-axis spatial resolution is influenced by the detector size, reconstruction thickness, and other factors such as pitch and is around 7 to 15 line pairs per centimeter. The efforts toward obtaining isotropic resolution are leading further developments in multiple-row detector CT technology.
Pitch: The concept of pitch was introduced with the advent of spiral CT; it is defined as the ratio of table increment per gantry rotation to the total x-ray beam width (International Electrotechnical Commission, 2002; Mahesh et al, 2002) (Fig. C-9). Pitch values less than 1 imply overlapping of the x-ray beam and higher patient dose; pitch values greater than 1 imply a gapped x-ray beam and reduced patient dose (Mahesh, 2002). Cardiac imaging demands low pitch values because higher pitch values result in data gaps (Fig. C-10), which are detrimental to image reconstruction. Also, low pitch values help minimize motion artifacts, and certain reconstruction algorithms work best at certain pitch values, which are lower than 0.5 in cardiac imaging. Typical multiple-row detector CT pitch factors used for cardiac imaging range from 0.2 to 0.4.
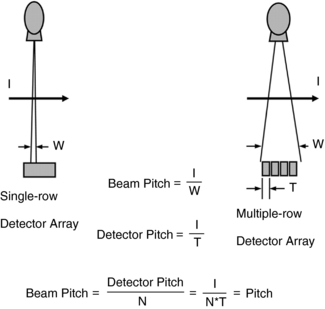
FIGURE C-9 Pitch is defined as the ratio of table feed per gantry rotation to the total x-ray beam width. This definition is applicable to both single-row detector CT and multiple-row detector CT (International Electrotechnical Commission, 2002). I, Table travel (mm) per rotation; N, number of active data acquisition channels; T, single data acquisition channel width (mm); W, beam width (mm).
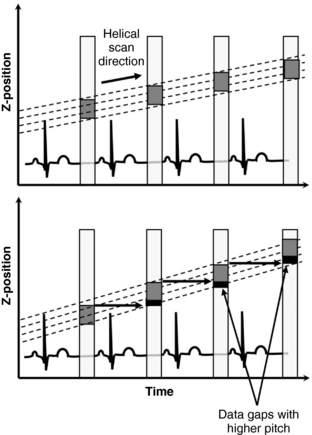
FIGURE C-10 Graphs demonstrate the necessity for scanning at low pitch values during helical cardiac CT data acquisition. If the table feed becomes greater than the beam width, it results in a data gap, which is detrimental for image reconstruction.
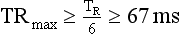
The pitch required for a particular scanner is affected by several parameters, as shown in the following equation. For single-segment reconstruction (partial scan acquisition), the pitch factor is influenced heavily by the subject’s heart rate (Ohnesorge et al, 2002).
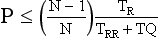
where N = number of active data acquisition channels, TR = gantry rotation time (milliseconds), TRR = time for a single heartbeat (milliseconds), and TQ = partial scan rotation time (milliseconds). For heart rates of 45 to 100 beats per minute (TRR of 1333-600 ms), TR of 500 ms, and TQ of 250 to 360 ms, the required pitch factor ranges from 0.375 to 0.875. At higher pitch, there are substantial data gaps. As a result, most cardiac CT protocols require injecting β-blockers (Pannu et al, 2006a) to lower the subject’s heartbeat within the desirable range of less than 70 beats per minute.
When the subject’s heart rates are rapid and difficult to control, the diastolic ranges are smaller, so images are reconstructed by multiple-segment reconstruction to improve temporal resolution. With multiple-segment reconstruction, the number of segments used in the reconstruction further restricts the pitch factors.
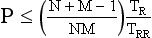
where N = number of active data acquisition channels, M = number of segments or subsequent heart cycles sampled, TR = gantry rotation time (milliseconds), and TRR = time for a single heartbeat (milliseconds). For a heart rate of 60 beats per minute with a TR of 400 ms, N = 16, and M = 2, the required pitch is ≈0.21; similarly, for M = 3, the required pitch is ≈0.15.
The pitch factor plays a significant role in improving both the temporal and spatial resolution but at the same time has a dramatic effect on the overall radiation dose delivered during a cardiac CT examination. Because radiation dose is inversely proportional to the pitch, the low pitch values characteristic of cardiac CT protocols substantially increase radiation dose to patients undergoing cardiac imaging with multiple-row detector CT.
In cardiac CT imaging, the need for high spatial and temporal resolution in turn requires the pitch values to be as low as 0.2 to 0.4. This results in a radiation beam overlap of nearly 80% to 60%, respectively, and an increase in radiation dose of up to a factor of five times compared with a pitch of 1. Hence, proper choice and optimization of pitch factor is critical in cardiac imaging. In fact, the demand for reducing radiation dose and faster scans is driving the technology to introduce either an even higher number of thin detectors in the z direction (256 rows) or flat-panel technology so that the entire cardiac area can be covered in a single gantry rotation without the necessity for tissue overlap (low pitch values).
Radiation Risk
One of the disadvantages of cardiac imaging with multiple-row detector CT is its use of ionizing radiation. The radiation dose delivered is highly dependent on the protocol used in cardiac CT (Gerber et al, 2005). Among the most widely known protocols such as calcium scoring studies, the effective dose is relatively small, 1-3 millisieverts (mSv) (Hunold et al, 2003). However, for retrospective gating, used for coronary vessel stenosis assessment and CT angiography, effective doses of 8 to 22 mSv and higher have been reported. By comparison, the radiation dose of an uncomplicated diagnostic coronary angiography study performed under fluoroscopic guidance ranges from 3 to 6 mSv (Hunold et al, 2003; Mahesh, 2006) and for typical body CT protocols ranges from 2 to 10 mSv (Morin et al, 2003) (Table C-1). Across the board, radiation doses are higher with multiple-row detector CT compared with the doses delivered with electron beam CT and fluoroscopically guided diagnostic coronary angiography and similar procedures (Hunold et al, 2003). One approach to reduce the high dose associated with retrospective gating, called ECG dose modulation (Jakobs et al, 2002), is directed at reducing the tube current during specific parts of the cardiac cycle, particularly during systole, where image quality is already degraded by motion artifacts and these portions of the cardiac cycle are not used in the image reconstruction. When dose modulation is implemented, a 10% to 40% dose reduction (Jakobs et al, 2002) can be achieved; however, the savings must be evaluated for each specific CT protocol. It is important that any steps taken to reduce radiation exposure should not jeopardize the image quality because poor image quality may result in repeat scans, which would result in additional radiation doses to patients.
TABLE C-1
Typical Effective Doses for Various Cardiac Imaging and Routine Computed Tomography Procedures
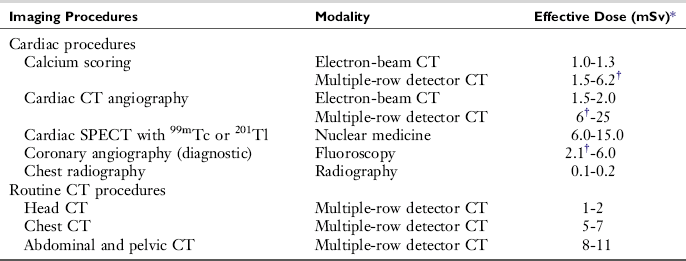
CT, Computed tomography; SPECT, single-photon emission CT; 99mTc, technetium 99m; 201T1, thallium 201.
*10 mSv = 1 rem.
†Indicated data are from Hunold P et al: Radiation exposure during cardiac CT: effective doses at multi-detector row CT and electron-beam CT, Radiology 226:145-152, 2093.
Geometrical Efficiency: Dose efficiency (also called geometric efficiency) is of particular concern with the earlier four-channel multiple-row detector CT scanners, for which the x-ray photon beam has to be quite uniform as it strikes the detector array. This requirement means that the natural shadowing of the beam (penumbra) attributable to the finite-sized focal spot is intentionally positioned to strike the neighboring nonactive detector elements. Thus, some amount of radiation transmitted through the patient does not contribute to image generation. The width of the penumbra is fairly constant with each scanner, generally in the range of 1 to 3 mm.
The proportion of radiation wasted relative to the overall width of the x-ray beam varies with the protocol used. If very thin images are required and the overall x-ray beam width is small—5 mm, for example—then the proportion of wasted x rays could be 20% to 60% (resulting in a dose efficiency of 40%-80%). If thin images are not required and a wider x-ray beam can be used—20 mm, for example—then the proportion of wasted x-rays would be 5% to 15% (resulting in a dose efficiency of 85%-95%). Dose efficiency may be displayed on the scanner console. More recent multiple-row detector CT scanners have been engineered so that this problem is very much diminished.
Artifacts
In cardiac imaging, owing to the inherent nature of imaging a rapidly moving organ, there arise many unique artifacts (Choi et al, 2004; Nakanishi et al, 2005); among them, the most common artifacts are due to cardiac pulsation (Nakanishi et al, 2005). Figure C-11 shows disconnect in the lateral reconstructed image as a result of pulsation. These types of artifacts are minimized by multiple-segment reconstruction or by scanning at even higher temporal resolution on the order of 50 milliseconds. The second types of artifacts are the banding artifacts resulting from increased heart rate during the scan. In the example shown in Figure C-12, the heart rate varied from 51 to 69 beats per minute during the scan and resulted in banding artifacts (Nakanishi et al, 2005). The other types of cardiac artifacts commonly observed are due to incomplete breath holding. These types of artifacts are not observed on axial images but are visible on coronal or sagittal views (Fig. C-13).
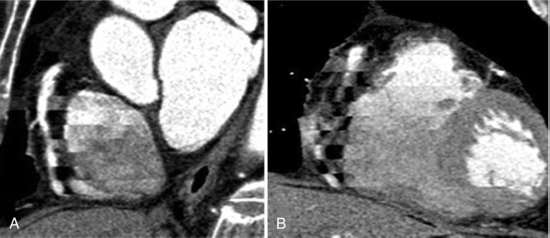
FIGURE C-11 Left anterior oblique (A) and anterior (B) MPR images show cardiac pulsation artifacts resulting from a rapid heartbeat. Reprinted with permission from Nakanishi T et al:. Pitfalls in 16-detector row CT of the coronary arteries, Radiographics 25:425-440, 2005.
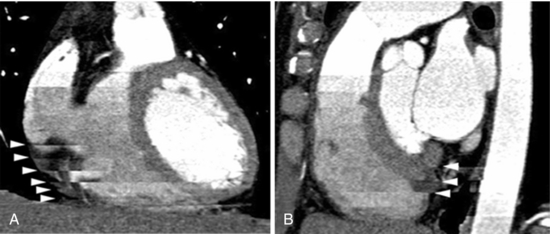
FIGURE C-12 Banding artifacts resulting from an increased heart rate from 51 to 69 beats per minute. Coronal (A) and sagittal (B) reformatted images of the heart obtained from CT data show banding artifacts (arrowheads). Reprinted with permission from Nakanishi T et al:. Pitfalls in 16-detector row CT of the coronary arteries, Radiographics 25:425-440, 2005.
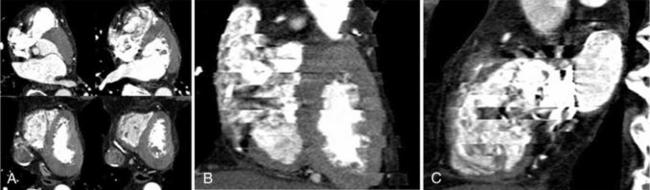
FIGURE C-13 Artifacts resulting from incomplete breath holding. A, Axial images show no motion artifacts. Coronal (B) and sagittal (C) reformatted images show banding artifacts. Reprinted with permission from Nakanishi T et al: Pitfalls in 16-detector row CT of the coronary arteries, Radiographics 25:425-440, 2005.
When subjects with previous stents or coils in the coronary artery undergo CT imaging, we observe streak artifacts around these highly attenuating objects. Often these artifacts can dominate the artery region and obscure other structures. As shown in Figure C-14, the metallic structures appear on axial images with no streak artifact but are very distinct and disturbing in coronal or sagittal planes (Nakanishi et al, 2005). These types of artifacts are to some extent handled by special artifact reduction software developed by manufacturers. The blooming artifacts are caused primarily by the combination of very highly attenuating objects and the inherent limiting resolution of the scanner.
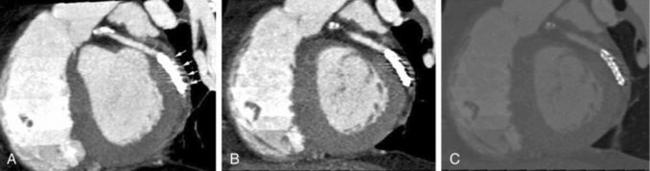
FIGURE C-14 Streak artifacts visible in the presence of a stent. Thin-slab maximum intensity projection image (A), MPR image (B), and thin-slab maximum intensity projection image obtained with a wide window (C) show streak artifacts (arrows in a). Reprinted with permission from Nakanishi T et al:. Pitfalls in 16-detector row CT of the coronary arteries, Radiographics 25:425-440, 2005.
FUTURE DIRECTIONS IN CARDIAC IMAGING
The demand for higher temporal and spatial resolution has already led to the development of a dual-source CT scanner (Flohr et al, 2006) and a 256-row detector CT scanner (Mori et al, 2005). In dual-source CT, there are two x-ray tubes positioned 90 degrees apart providing 64 axial sections for a complete gantry rotation, which yields further improvement in temporal resolution. As mentioned earlier, the minimum amount of data needed to reconstruct an image is 180 degrees plus the fan angle; therefore, with two tubes positioned at 90 degrees, it is sufficient to acquire data for one fourth of a gantry rotation and then coordinate the data from two sets of detectors to reconstruct the image. This can yield temporal resolution as low as one fourth the gantry rotation speed. With scanner gantry rotation speeds at below 330 ms, the temporal resolution can be as low as 80 ms. With this scanner, the pitch factor may be increased for higher heart rates with a potential to reduce radiation dose.
Similarly, the demand for higher spatial resolution has led to the development of a 256-row detector CT scanner, which can cover the entire heart in one gantry rotation (12.8-cm beam width at isocenter). In the 256-row detector CT scanner, the 256 detectors in the longitudinal direction can cover an area of 12.8 mm per gantry rotation and therefore can eliminate the need for overlapping pitch. In this type of scanner, it is possible to obtain complete data from one heart cycle, further diminishing the need for excessive tissue overlaps (low pitch values) and therefore reducing radiation dose and also reducing motion artifacts. Ideally, the combination of a 256-row detector assembly in the dual-source CT scanner would be phenomenal because that would not only give high temporal resolution but also high spatial resolution with minimal motion artifacts.
CONCLUSIONS
Cardiac imaging is a highly demanding application of multiple-row detector CT and is possible only because of recent technological advances. Understanding the tradeoffs between various scan parameters that affect image quality is key in optimizing protocols that can reduce patient dose. Benefits from an optimized cardiac CT protocol can minimize the radiation risks associated with these cardiac scans. Cardiac CT has the potential to become a reliable tool for noninvasive diagnosis and prevention of cardiac and coronary artery disease.
REFERENCES
American Heart Association. International cardiovascular disease statistics. Dallas, Tex: American Heart Association, 2003.
Budoff, MJ, et al. Clinical utility of computed tomography and magnetic resonance techniques for noninvasive coronary angiography. J Am Coll Cardiol. 2003;42:1867–1878.
Choi, HS, et al. Pitfalls, artifacts, and remedies in multi-detector row CT coronary angiography. Radiographics. 2004;24:787–800.
Desjardins, B, Kazerooni, EA. ECG-gated cardiac CT. AJR Am J Roentgenol. 2004;182:993–1010.
Detrano, RC. Coronary artery scanning using electron beam computed tomography. Am J Card Imaging. 1996;10:97–100.
Dewey, M, et al. Coronary artery disease: new insights and their implications for radiology. Eur Radiol. 2004;14:1048–1054.
Flohr, TG, et al. Multi-detector row CT systems and image-reconstruction techniques. Radiology. 2005;235:756–773.
Flohr, TG, et al. First performance evaluation of a dual-source CT (DSCT) system. Eur Radiol. 2006;16:256–268.
Gerber, B, et al. Physical principles of cardiovascular imaging. In: St John Sutton M, Rutherford J, eds. Clinical cardiovascular imaging: a companion to Braunwald’s heart disease. Philadelphia: Elsevier-Saunders, 2004.
Gerber, TC, et al. Techniques and parameters for estimating radiation exposure and dose in cardiac computed tomography. Int J Cardiovasc Imaging. 2005;21:165–176.
Hoffmann, MH, et al. Noninvasive coronary imaging with MDCT in comparison to invasive conventional coronary angiography: a fast-developing technology. AJR Am J Roentgenol. 2004;182:601–608.
Hunold, P, et al. Radiation exposure during cardiac CT: effective doses at multi-detector row CT and electron-beam CT. Radiology. 2003;226:145–152.
International Electrotechnical Commission. Medical electrical equipment, part 2-44: particular requirements for the safety of x-ray equipment for computed tomography, IEC Publication No. 60601-2-44. Geneva, Switzerland: International Electrotechnical Commission, 2002.
Jakobs, TF, et al. Multi-slice helical CT of the heart with retrospective ECG gating: reduction of radiation exposure by ECG-controlled tube current modulation. Eur Radiol. 2002;12:1081–1086.
Klingenbeck-Regn, K, et al. Subsecond multi-slice computed tomography: basics and applications. Eur J Radiol. 1999;31:110–124.
Klingenbeck-Regn, K, et al. Strategies for cardiac CT imaging. Int J Cardiovasc Imaging. 2002;18:143–151.
Mahesh, M. Search for isotropic resolution in CT from conventional through multiple-row detector. Radiographics. 2002;22:949–962.
Mahesh, M, Cardiac imaging: technical advances in MDCT compared with conventional x-ray angiography. Boulton E, ed. US cardiology 2006: the authoritative review of the clinical and scientific issues relating to cardiology with perspectives on the future. Touch Briefings: London, UK, 2006. (http://www.touchcardiology.com).
Mahesh, M, et al. Dose and pitch relationship for a particular multi-slice CT scanner. AJR Am J Roentgenol. 2001;177:1273–1275.
Mahnken, AH, et al. Multislice spiral computed tomography of the heart: technique. current applications, and perspective, Cardiovasc Intervent Radiol. 2005;28:388–399.
McCollough, CH, Morin, RL. The technical design and performance of ultrafast computed tomography. Radiol Clin North Am. 1994;32:521–536.
Mori, S, et al. Clinical potentials of the prototype 256-detector row CT-scanner. Acad Radiol. 2005;12:148–154.
Morin, RL, et al. Radiation dose in computed tomography of the heart. Circulation. 2003;107:917–922.
Nakanishi, T, et al. Pitfalls in 16-detector row CT of the coronary arteries. Radiographics. 2005;25:425–440.
Nikolaou, K, et al. Advances in cardiac CT imaging: 64-slice scanner. Int J Cardiovasc Imaging. 2004;20:535–540.
Ohnesorge, B, et al. Multi-slice CT in cardiac imaging. Heidelberg, Germany: Springer, 2002.
Pannu, HK, et al. Current concepts in multi-detector row CT evaluation of the coronary arteries: principles, techniques, and anatomy. Radiographics. 2003;23:S111–S125.
Pannu, HK, et al. Beta-blockers for cardiac CT: a primer for the radiologist. AJR Am J Roentgenol. 2006;186(6 Suppl 2):S341–S345.
Pannu, HK, et al. Coronary CT angiography with 64-MDCT: assessment of vessel visibility. AJR Am J Roentgenol. 2006;187:119–126.
Schoenhagen, P, et al. Noninvasive imaging of coronary arteries: current and future role of multi-detector row CT. Radiology. 2004;232:7–17.
Ulzheimer, S, Kalender, WA. Assessment of calcium scoring performance in cardiac computed tomography. Eur Radiol. 2003;13:484–497.
*From Radiographics 27:1495-1509, 2007. Reprinted by permission of the Radiological Society of North America and the authors.
*From the Russell H. Morgan Department of Radiology and Radiological Science, Johns Hopkins University School of Medicine, Baltimore, Md (M. M.), and the Department of Imaging Physics, University of Texas M.D. Anderson Cancer Center, Houston, Tex (D. D. C)