64 Hypothyroidism
It is tempting to think that the diagnosis of hypothyroidism is completely resolved by the accuracy of modern thyroid function tests (TFTs). Unfortunately, three factors complicate the diagnosis:
Prevalence
The prevalence of overt, as opposed to subclinical, hypothyroidism varies with age and sex as shown in Table 64.1.1
Table 64.1 Prevalence of hypothyroidism
| Population | Prevalence | 95% confidence interval |
|---|---|---|
| Women aged 40–60 | 0.5% | 0.3–0.7% |
| Women aged >60 | 0.7% | 0.5–0.9% |
| Women aged 70–80 | 2% | 1.5–2.8% |
| Men aged 40–60 | 0.5% | 0.3–1.0% |
| Men aged >60 | 0.7% | 0.4–1.2% |
Clinical diagnosis
The clinical features of hypothyroidism are well described in medical textbooks. A review has summarised the likelihood ratios attached to individual features.2 No single symptom or sign is diagnostic, with the highest LR+ being for coarse skin (5.6) and the lowest LR− for the absence of periorbital oedema (0.6) and of an enlarged thyroid (0.6). It is not clear how the various features can be combined to produce a post-test probability; the likelihood ratios cannot be applied sequentially because they are not necessarily independent of each other.
In attempts to provide an overall assessment, two types of scoring systems have been devised: one, the Billewicz score, which combines the history and examination3 (Table 64.2), and more recent scores based on the number of suggestive symptoms.
Table 64.2 The Billewicz score in the diagnosis of hypothyroidism3
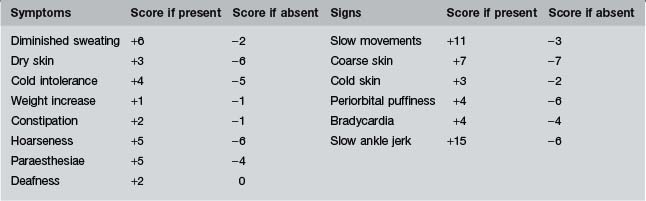
The Billewicz score
In Billewicz’s patients, a score of +25 or over correctly identified 34 hypothyroid patients, gave no false positives, but missed 22 who had scores between −29 and +24. A score below −30 correctly identified 95 patients out of 162 as euthyroid, included none who were hypothyroid, but was no help in sorting out the 123 patients who had scores between −29 and +24, of whom 56 were hypothyroid (see Table 64.3 for the likelihood ratios and probabilities derived from these figures).
Table 64.3 The probability of hypothyroidism, according to the Billewicz score, at an initial risk of hypothyroidism of 5%
| Score | Likelihood ratio (95% CI) | Probability of hypothyroidism |
|---|---|---|
| Score very high ≥+25 | Infinity (14 706–infinity) | 100% |
| 0.4 (0.3–0.5) | 2% | |
| Score intermediate +10 to +24 | 7.3 (2.9–18) | 28% |
| 0.5 (0.3–0.8) | 3% | |
| Score very low ≤− 30 | 0.0 (0.0–0.1) | 0–0.5% |
| 2.4 (2.0–2.9) | 11% |
Follow each row from left to right to see how the score alters the probability of hypothyroidism.
The initial risk of 5% might be that of a 70-year-old woman with a facial appearance suggestive of hypothyroidism.
Be careful in interpreting Table 64.3. The post-test probability of 11% for a score that is above −30 includes those with scores from −29 to 0 and above. It is therefore less useful than the more precise probabilities given for scores of +10 to +24 and 25 and above.
How to use the Billewicz score
The scores may be used in two ways: either as a guide to what are the most discriminating symptoms (feeling cold, dry skin and hoarseness) and signs (slow movements, coarse skin and a sluggish ankle jerk); or as a complete score from which the post-test probabilities can be calculated.
When applying the score to an individual patient, very high or very low scores make the pre-test probability irrelevant. The LR+ of a high score is so high that, even if the pre-test probability is hardly more than the general population (because, say, of a vague complaint such as fatigue), a score of +25 or above makes hypothyroidism virtually certain. Similarly, a score of −30 or below virtually rules it out. However, a score of −29 to +24 rules it neither in nor out. It is in these cases that the post-test probability matters, when it becomes the pre-test probability in the interpretation of laboratory tests.
Scoring systems based on symptoms alone
More recent studies have confirmed that a firm diagnosis, or the firm exclusion of the diagnosis, is rarely possible, based on symptoms alone.4 In one study, only 30% of cases had symptoms recognisable as thyroid-related and 17% of controls had at least one of the same symptoms.5 The older the patient, the less likely is it that typical symptoms will be present.6
However, what does emerge is that a simple count of the number of suggestive symptoms, regardless of which ones they are, is useful. The more symptoms the patient has, the more likely is the diagnosis of hypothyroidism.5
 current symptoms, of which only a hoarse voice, dry skin and muscle cramps were significantly more common in patients with hypothyroidism than in controls; and symptoms which have changed over the last year, of which 13 were identified as significant. In decreasing order of usefulness they are: a voice that is deeper or hoarser, finding mental arithmetic more difficult, drier skin, puffier eyes, more often constipated, feeling colder, memory worse, thinking slower, muscle cramps more often, muscles weaker, more depressed, more tired.
Menstrual changes and hypersomnia were not significantly more common in cases than controls and nor was coarser hair (because too few cases reported it for the difference to reach significance).
From this study, the most useful likelihood ratios proved to be those related to a simple count of symptoms. A change in seven or more symptoms had an LR+ of 8.7 (95% CI 3.8 to 20) and an unhelpful LR− of 0.7 (95% CI 0.6 to 0.8) while a change in three or more symptoms had an LR+ of 2.8 (95% CI 2.0 to 4.1) and an LR− of 0.5 (95% CI 0.4 to 0.7).
Summary of the implications of the clinical examination
If the clinical picture of hypothyroidism is strong (Billewicz score ≥+25), the correct diagnosis is very likely to be hypothyroidism. If the clinical picture is strongly against hypothyroidism (Billewicz score −30), the patient is almost certainly not hypothyroid. However, if the clinical picture is less clear (−29 to +24) the diagnosis could go either way.
If symptoms only are assessed, without, as in the Billewicz score, the examination being included, a score of 7 or more suggestive symptoms which have changed in the last year shifts the probabilities usefully in favour of the diagnosis while a low score shifts the probability only slightly against it.
The value of the history and examination is not in making a definitive diagnosis but in assisting the clinician to gauge the pre-test probability before performing thyroid function tests.
Does a family history of thyroid disease alter the probabilities?
The US study quoted above5 found that a family history of thyroid disease was present in 42% of those who were hypothyroid but was also present in 18% of controls. This gave an LR+ of 2.5 (95% CI 1.6 to 4.0) and an LR− of 0.7 (95% CI 0.6 to 0.9). A family history therefore increases the probability of hypothyroidism slightly and its absence reduces it slightly. The value of the question lies more in gaining an understanding of what the patient’s experience of thyroid disease might be, rather than in assisting with the diagnosis.
Thyroid function tests
Table 64.4 The probability of hypothyroidism, according to the TSH
| Initial risk of hypothyroidism | Likelihood ratio | Probability of hypothyroidism |
|---|---|---|
| 1.5% | 99 | 60% |
| 0.01 | <0.1% | |
| 50% | 99 | 99% |
| 0.01 | 1% |
Follow each row from left to right to see how the TSH alters the probability of hypothyroidism.
The initial risk of 1.5% is that of the 70-year-old woman. A risk of 50% is that of a woman aged 70 with a Billewicz score of 20.
Note that the lower initial probability means that a raised TSH supports the diagnosis but does not prove it, while a normal result rules it out. Conversely, the higher initial probability means that the TSH rules the diagnosis in, if raised, but cannot totally rule it out if normal.
Caution: the TSH can be depressed by concomitant illness and is occasionally raised during recovery. During concomitant illness, its sensitivity remains high at 99% but its specificity falls to 95%.7
The classic feedback loop. Put simply, thyroid function is controlled by the pituitary production of TSH, which in turn is regulated by feedback to the hypothalamus and the pituitary of plasma T4 and T3. If the thyroid gland fails, plasma T4 and T3 levels fall and so plasma TSH rises. In mild disease, this rise may return T4 and T3 levels to normal. If the hypothalamus or pituitary fails, free T4, T3 and TSH fall, or, at least, TSH is inappropriately low (while possibly within the normal range) for the low T4 and T3.
Sick euthyroid syndrome. Serious concomitant illness, and old age, can disturb this picture by reducing peripheral conversion of T4 to T3. Certain drugs; lithium, amiodarone, non-selective beta-blockers in high dosage and corticosteroids, can do the same. Free T3 may be low but the patient has no thyroid disease; and TSH and free T4 may be low because the failure of conversion of T4 to T3 in the hypothalamus and pituitary reduces TSH secretion.
Total T4 and T3 are unreliable because they are dependent on the concentration of thyroid binding proteins, which are raised in pregnancy, use of oral contraception and other drugs.
Misleading elevation of the TSH. The TSH may be artificially raised due to:
What level of TSH is abnormal?
The normal range is usually quoted as 0.45 mU/L to 4.5 mU/L with a mean of 1.5 mU/L.10 However, these cut-off points are arbitrary. Patients at the upper range of normal may have subclinical hypothyroidism; indeed, those with a TSH >2.5 mU/L have serum cholesterol levels higher than those with low-normal values, suggesting that some of them are hypothyroid.9
What is the cause of the hypothyroidism?
Other causes are uncommon or rare:
Deciding on the aetiology
Subclinical hypothyroidism
Definition.
Elevated TSH with a normal FT4 in a patient with no clinical evidence of hypothyroidism. The elevated TSH should not be due to one of the causes in the box on p. 420.
Prevalence.
This is high and rises with age. A US study found that 4.6% of the population, thought to be free from thyroid disease, had a raised TSH; in 4.3%, the hypothyroidism was subclinical.11 In the UK, the Whickham study found a similar prevalence.12 In those aged 65 and over, the prevalence is triple (1.7% overt, 13.7% subclinical).11
Of those with subclinical hypothyroidism, 2–5% progress to overt hypothyroidism each year.10 The risk is higher in those with higher TSH levels and in those with anti-thyroid antibodies. A therapeutic trial of thyroxine is needed to see whether any symptoms are due to the condition or are coincidental. About 20% of patients report subjective improvement. If thyroxine is not given they need regular surveillance; only in 5% does the TSH revert to normal.10
A 72-year-old woman is found to have atrial fibrillation. Thyroid function tests are performed but, far from showing hyperthyroidism, they show a raised TSH and FT3 and FT4 that are borderline low. Her GP has to decide whether this is overt or subclinical hypothyroidism.
He questions her along the lines of the Billewicz score but finds himself unable to score her answers. She says she ‘doesn’t sweat and never has’, her skin has ‘always been dry’ she’s ‘always hated the cold’, she’s deaf ‘but isn’t everyone my age?’ etc. He decides to use the US criteria in which only a change in symptoms counts as positive. This works better and her score is only 2 (she is more tired and her memory is worse).
He calculates that this lowers the probability of hypothyroidism from the baseline of 2% for her age to 1% (Fig. 64.1). Examination adds nothing and he concludes that her hypothyroidism is subclinical.
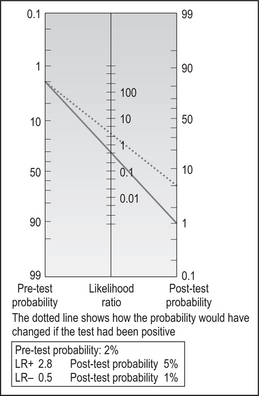
He presents this patient’s case to his partners at a clinical meeting and they question whether the formal scoring was worthwhile. He argues that it was. Without it he would have worried that her tiredness and deterioration in memory might be due to hypothyroidism. He might have been tempted into a trial of thyroxine and a positive placebo response might have meant that she was inappropriately treated long-term. As it is, he will monitor her without treatment.
1 Helfand M, Redfern C. Screening for thyroid disease: an update. American College of Physicians. Ann Intern Med. 1998;129:144-158.
2 McGee S. Evidence-based physical diagnosis. Philadelphia: Saunders, 2001.
3 Billewicz W, Chapman R, Crooks J, et al. Statistical methods applied to the diagnosis of hypothyroidism. Q J Med. 1969;150:255-266.
4 Indra R, Patil S, Joshi R, et al. Accuracy of physical examination in the diagnosis of hypothyroidism: a cross-sectional, double-blind study. J Postgrad Med. 2004;50:7-10.
5 Canaris G, Steiner J, Ridgway E. Do traditional symptoms of hypothyroidism correlate with biochemical disease? J Gen Intern Med. 1997;12:544-550.
6 Doucet J, Trivalle C, Chassagne P, et al. Does age play a role in clinical presentation of hypothyroidism? J Am Geriatr Soc. 1994;42:984-986.
7 Dolan JD, Wittlin SD. Hyperthyroidism and hypothyroidism. In: Black ER, Bordley DR, Tape TG, Panzer RJ, editors. Diagnostic strategies for common medical problems. 2nd edn. Philadelphia: American College of Physicians; 1999:473-483.
8 Dayan CM. Interpretation of thyroid function tests. Lancet. 2001;357:619-624.
9 Roberts C, Ladenson P. Hypothyroidism. Lancet. 2004;363:793-803.
10 Surks M, Ortiz E, Daniels G, et al. Subclinical thyroid disease: scientific review and guidelines for diagnosis and management. JAMA. 2004;291:228-238.
11 Hollowell J, Staehling N, Flanders W, et al. Serum TSH, T4, and thyroid antibodies in the United States population (1988–1994): National Health and Nutrition Examination Survey (NHANES III). J Clin Endocrinol Metab. 2002;87:489-499.
12 Tunbridge W, Evered D, Hall R, et al. The spectrum of thyroid disease in a community: the Whickham survey. Clin Endocrinol. 1977;7:115-125.