Chapter 21 Magnetic Resonance Imaging
Magnetic resonance imaging (MRI) is a method of imaging that can allow examination of both osseous and soft tissues with detailed anatomical resolution and also provides some physiological information. Advances in technology during the past 10 years have made it possible for MRI to become a practical diagnostic tool in both anesthetized and standing horses (Figures 21-1 and 21-2).1 Use of MRI has revolutionized our understanding of foot pain in the horse and has considerably improved understanding of other types of lameness further proximally in the limb.2-5 As a result, MRI is increasingly being used for diagnosis of orthopedic disorders in equine practice and can add considerable information to a diagnostic investigation. However, as with any imaging technique, MRI is only useful in the context of the entire clinical picture and needs to be interpreted in light of other diagnostic findings. Terminology is sometimes confused: magnetic resonance (MR) refers to the absorption of energy exhibited by particles (as atomic nuclei or electrons) in a static magnetic field when the particles are exposed to electromagnetic radiation of certain frequencies. MRI refers to a noninvasive diagnostic technique that produces computerized images of internal body tissues and is based on nuclear magnetic resonance of atoms within the body induced by the application of radio waves.
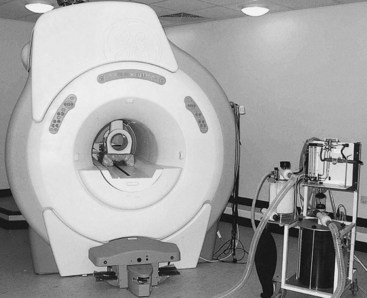
Fig. 21-1 The 1.5-T GE Echospeed (General Electric Medical Systems, Milwaukee, Wisconsin, United States) magnet at the Animal Health Trust (Newmarket, United Kingdom) is used for MRI of horses under general anesthesia. Located in the bore of the magnet is a radiofrequency coil suitable for use on the equine distal limb. Both limbs are placed into the magnet bore. A specially shaped pad allows the coil to be placed only over the limb being imaged and in the center of the magnet.
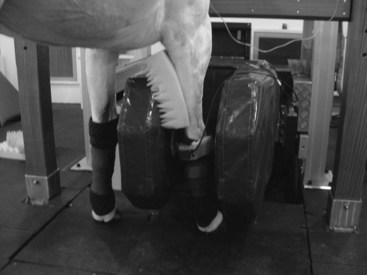
Fig. 21-2 The Hallmarq (Hallmarq Veterinary Imaging, Guildford, United Kingdom) 0.29-T MR system at the Animal Health Trust (Newmarket, United Kingdom) is used for MRI of horses under standing sedation. This horse is undergoing MRI of the carpus.
Production of Magnetic Resonance Images
MR images are produced through interactions between a strong magnet, a radiofrequency (RF) coil, magnetic field gradients, and powerful computing facilities. MR images are based on the spinning motion of MR active nuclei (nuclei with an odd number of protons). Hydrogen nuclei are used in clinical MRI because they are abundant in the body and are particularly mobile in fat and water. When a horse (or body part) is put into the magnet, the MR active nuclei align parallel or antiparallel to the static magnetic field. To produce an image, an RF wave at a specific frequency (dependent on the magnet field strength and the MR active nuclei selected) is applied at 90 degrees to the static magnetic field, B0. This gives energy to the hydrogen nuclei, which then spin faster and alter the net magnetization vector away from the static magnetic field. When the RF wave terminates, energy is lost from the excited hydrogen nuclei, either to the surrounding environment (spin-lattice or T1 relaxation) or to adjacent nuclei (spin-spin or T2 relaxation), and the net magnetization vector returns to zero. This energy loss is detected by the receiver as MR signal. The signal is then converted to a digital image using complex computer software. Each pixel within the matrix has a particular signal intensity, and the accumulated pixels make up the final image.
Magnets may be considered high-, mid-, and low-field strength, with field strength measured in Tesla. Magnetic field homogeneity is important in production of good quality images. RF coils are made to surround the region of interest with as little space between the coil and the area of interest as possible to maximize signal detection. They may be both a transmitter (transmits the RF waves) and receiver (detects the MR signal produced). The magnetic field gradients are used to place the MR signal in space. This is achieved by generating short-term spatial variation in magnetic field strength across the horse (or body part). There are three sets of gradient coils, each oriented in a different direction. Repeated application of large electrical current pulses results in the gradient coils making a loud noise during scan acquisition, especially at higher field strengths.
A pulse sequence includes a defined series of RF waves, gradient maneuvers, and signal detection. The repetition time (TR) defines the time between repetitions, and the echo time (TE) defines the time between the RF pulse and detection of the echo (MR signal). Selection of pulse sequence determines the image contrast and appearance of particular tissues.
Images are produced in a gray scale with the contrast defined by the particular pulse sequence used for image acquisition, the imaging parameters, and the properties of the tissue being imaged. Information is acquired as tomographic slices, so the orientation and thickness of slices (or three-dimensional [3D] volume datasets) can be varied and defined.
Generally a pilot scan with wide slice thickness is performed in three planes, and further image sequences are oriented and positioned relative to the pilot scan. It is normal practice to acquire images in three planes: sagittal, dorsal (coronal), and transverse (axial).
A complete MRI scan of a horse usually includes a series of different pulse sequences, the choice of which is determined by the operator. The tissues being examined, the suspected pathology, and the type of MRI system influence the selection of pulse sequences. For horses, the choice of sequence is also influenced greatly by time constraints to minimize risk of movement in a standing horse and limit time under general anesthesia.
Various manipulations during image acquisition can be used to look at particular features of tissues, such as fat suppression techniques to identify pathology in medullary bone. Intravenous administration of gadolinium contrast medium can be used to demonstrate blood flow, perfusion of a suspect area, or to investigate damage to the blood–brain barrier. Postprocessing manipulations can be used to reorient images acquired in an oblique orientation; to measure size, area, or volume; for motion correction; or to further understand signal intensity patterns.
Equipment for MRI in Horses
MRI can be performed in horses using various different types of systems. High-field closed systems are similar to those used in many human hospitals. These units have a superconducting, helium-cooled magnet in a cylindrical configuration into which the area of interest of the horse has to be squeezed; thus the horse needs to be under general anesthesia, and a team of operators is required to position the horse (see Figure 21-1). There are low-field open MRI systems that also require horses to be imaged under general anesthesia but have fewer restrictions on space; therefore it may be easier to position the horse into the imaging portion of the magnet. A low-field MR system for the standing horse has been developed specifically for the equine market, which has allowed images to be acquired with horses under sedation (see Figure 21-2). Use of motion-insensitive imaging sequences helps to account for slight sway that may occur during sedation. Time for image acquisition is generally longer in low-field units for the same or less resolution and image quality as a high-field system; thus horses may require sedation or general anesthesia for more prolonged periods to acquire images of the entire region required.
For the MRI systems available, in general the areas that can be imaged in the adult horse are limited to the head and cranial aspect of the neck, the forelimb up to and including the carpus, and the hindlimb up to and including the tarsus, although images of the stifle can also be obtained in a few systems in horses of suitable size and conformation.6 In a foal, it may be possible to place the entire body into the magnet in a high-field closed or low-field open system.
Advantages and Disadvantages Compared with other Imaging Techniques
Advantages
MRI is more versatile than most other imaging modalities because of its ability to provide images sliced in many planes and 3D images in a variety of orientations. Like ultrasonography and radiography, MRI has the ability to provide anatomical information, but MRI also has a physiological sensitivity like that of nuclear scintigraphy.
MRI is the only method presently available that can assess all tissues during a single examination. Ultrasonography is extremely useful for imaging soft tissues but is impractical in a number of areas and cannot be used to assess the internal structure in bones. MR technology allows imaging of those soft tissue structures that are inaccessible with ultrasonography. Radiography shows mineralized tissues but is less sensitive than MRI because each image is obtained through the full thickness of the area, and only the orientation selected can be assessed; therefore small abnormalities may be missed. In contrast, MR images can be obtained in multiple planes without loss of image quality, and data can be assessed in slices so that the image is not limited to a summation through the entire structure. MRI has been shown to be more sensitive to pathological conditions of bone and tendons than radiography and ultrasonography, respectively.
Like MRI, computed tomography (CT) can be used in horses for accurate assessment of the 3D distribution of pathological conditions of the bone, particularly in relation to fracture configurations. Some soft tissue detail is also demonstrated with CT but generally with inferior contrast. In contrast to CT, articular cartilage can generally be assessed using MRI without use of invasive arthrography, and bone pathology without fracture may also be better evaluated with MRI. Arthroscopy is the standard of reference for the evaluation of articular cartilage, but it cannot assess deep chondral lesions and lesions of the subchondral bone.
Disadvantages
Initially the greatest disadvantages of MRI were the expense of the equipment and the requirement for general anesthesia. However, as advances in technology have reduced the costs and made it possible to obtain images in a standing horse, these problems have increasingly been resolved. Unfortunately, MRI remains limited to areas that can be placed within the magnetic field; thus the caudal aspect of the neck, the trunk, and the proximal aspects of limbs of adult horses cannot yet be imaged, but it is possible that with advances in technology, these problems may also be overcome. Until recently, unlike CT, MRI could not be used for image-guided injections because ferrous metal cannot be used within the magnet; however, MR-compatible needles have now become available.
Interpretation of Magnetic Resonance Images
An understanding of MRI, a detailed knowledge of anatomy, and considerable experience are required to interpret MR images reliably. The wide range of normal anatomy within the horse population means that experience in reading equine images and use of concurrent clinical diagnostic evaluation are crucial for determining the clinical significance of a potential lesion. Lesions that may be detectable using MRI but are difficult to detect with other imaging modalities include ligament and tendon injuries (within the hoof capsule), occult fractures, articular cartilage damage, bone trauma and necrosis, osseous cystlike lesions, subchondral bone modeling, and space-occupying lesions.7 Interpretation is improved by assessing T2-weighted, T1-weighted and/or proton density, and fat-suppressed images at each site.
Image contrast is determined by tissue proton density, T1 and T2 relaxation, and by pulse sequence and imaging parameters, which also determine the T1 and T2 weighting of the image. Clinical MRI uses hydrogen nuclei as the MR active nuclei that create the signal; thus the appearance of a tissue on MRI is determined by the density and mobility of the hydrogen nuclei it contains and their relaxation properties after excitation (when the signal is created). Images of tissues can be weighted to show proton density and T1 and T2 relaxation properties of the tissues. Tissues where the hydrogen nuclei are tightly bound have low signal intensity (black) on proton density, T1-, and T2-weighted images; for example, cortical bone or tendon. In contrast, water and fat contain highly mobile hydrogen nuclei and can produce considerable signal. However, water has high signal intensity (white) on T2-weighted images but low signal intensity (black) on T1-weighted images. Therefore each tissue has a characteristic signal intensity pattern on MR images, so with experience, normal tissues can be clearly identified (Figures 21-3 and 21-4).
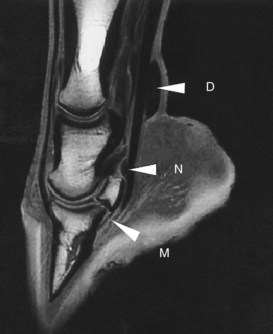
Fig. 21-3 Sagittal magnetic resonance image of the distal aspect of a limb using a T1-weighted spoiled gradient echo sequence. The high signal intensity in the medullary cavity of the phalanges and navicular bone is caused by fat. No signal appears in the deep digital flexor tendon, straight sesamoidean ligament, and cortical bone. Higher signal intensity in the most distal portion of the deep digital flexor tendon is probably a magic angle effect (M). Synovial fluid is dark (low signal intensity) in the navicular bursa (N), distended digital flexor tendon sheath (D), and proximal and distal interphalangeal joints, but cartilage has a relatively higher signal intensity.
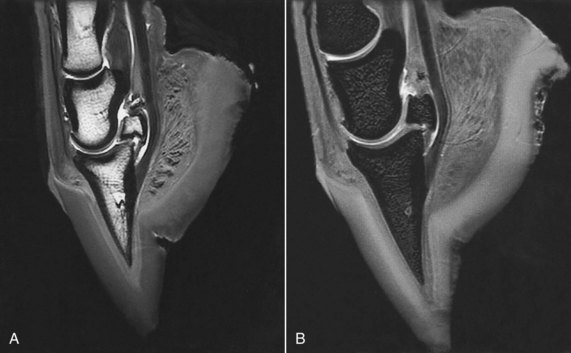
Fig. 21-4 Sagittal magnetic resonance images of the distal aspect of a limb using a T2* gradient echo sequence. A, 3D T2* gradient echo image shows a relatively high signal intensity associated with medullary fat of the phalanges and navicular bone, but on this sequence fluid has high signal intensity (compare with Figure 21-3). Synovial fluid in the navicular bursa and joints has high signal intensity, but cartilage has relatively low signal intensity. B, Fat-saturated, 3D T2* gradient echo shows the absence of fat signal in the medullary bone and improved contrast between articular cartilage and surrounding structures.
The MR properties of a tissue are altered by damage, and the stage of damage and healing may be determined by differences in signal intensity patterns and the shape and size of different structures. This makes it possible to use MR images to evaluate tissue normality and the type, severity, and stage of injury in tissue damage.
Pathological processes are frequently associated with increase in free water within and around the affected tissues, which can be easily detected with MRI. These changes generally lead to an increase in signal intensity on T2-weighted images and a decrease in signal intensity on T1-weighted images. These changes may be most easily seen on T2-weighted images. However, the combined information from T2-, T1-weighted, and fat-suppressed images is most useful for interpretation. T1-weighted images are often best for evaluation of tissue contours and anatomy, and fat-suppressed techniques are required for evaluation of bone medullary tissues.
In general, fluid (and edema) is hypointense on T1-weighted and hyperintense on T2-weighted images, but increased protein content in fluid also leads to increased signal intensity on T1-weighted images. On T2-weighted images, presence of blood results in a relative decrease in signal intensity compared with edema. Immature granulation tissue has high signal intensity on T2-weighted images, whereas mature fibrotic tissue has a low intensity on T2-weighted images.
Bone
Although cortical bone has low signal intensity, MRI is extremely useful for detecting bone pathology. Alterations in periosteal or endosteal surface contour may indicate bone disruption, osteophytes, or enthesophyte formation (Figure 21-5). Appearance of adjacent tissues should also be evaluated (Figure 21-6). Trabecular architecture can be seen using MRI, and alterations can be monitored. Bone pathology is frequently detected as an increase in signal intensity in T2-weighted and fat-suppressed images and a decrease in signal intensity in T1-weighted images and may represent bone necrosis, inflammation, trabecular microdamage, hemorrhage, fibrosis, and bone edema (Figure 21-7). Very small focal lesions in the cortical or subchondral bone may be associated with large areas of signal abnormality in the local cancellous bone. Residual changes on MR images may be present for months after clinical recovery. Bone abnormality may also be reflected by increased bone density (mineralization, sclerosis), seen as low signal intensity on both T1- and T2-weighted images.
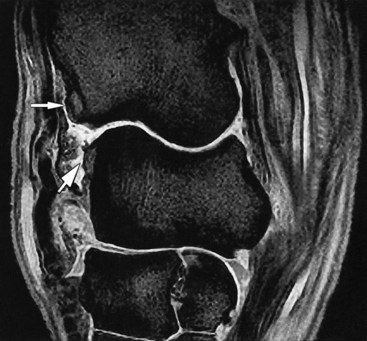
Fig. 21-5 A sagittal T2* gradient echo magnetic resonance image of a carpus demonstrating osteophyte formation on the distal aspect of the radius and the proximal aspect of the radial carpal bone in the antebrachiocarpal joint (arrows). There is synovial effusion of the antebrachiocarpal and middle carpal joints with synovial proliferation on the dorsal aspect of the antebrachiocarpal joint.
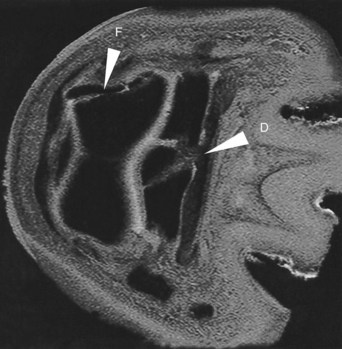
Fig. 21-6 A transverse 3D T2* gradient echo magnetic resonance image of the distal aspect of a limb showing a comminuted fracture of the navicular bone and fracture of the middle phalanx that had been detected radiologically (F) and laceration of the medial branch of the deep digital flexor tendon (D), which is interposed between the fracture fragments of the navicular bone.
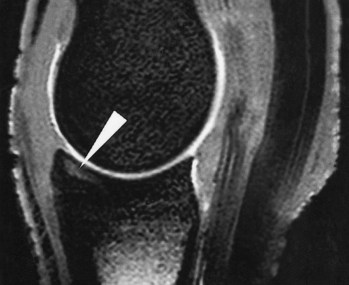
Fig. 21-7 Sagittal fat-saturated, T2* gradient echo magnetic resonance image of a metacarpophalangeal joint showing an area of high signal intensity in the subchondral bone of the proximal phalanx (arrow), representing a pathological condition of the bone. Histopathological examination revealed subchondral bone edema, inflammation, and trabecular microdamage.
Tendon
Like cortical bone, tendons and ligaments generally have low signal intensity on both T1- and T2-weighted images, thus appearing nearly black except where muscle tissue is present. Increased signal intensity indicates tendon or ligament damage. In acute stages, with inflammatory change, or tissue necrosis, damage is detected as swelling and increased signal intensity on T1- and T2-weighted images (Figure 21-8). At later stages of healing and fibrosis, the lower inflammatory fluid component results in lower signal intensity on T2-weighted images, but signal intensity on T1-weighted images remains higher than that of normal tendon. Changes to the peritendonous tissues should also be considered.
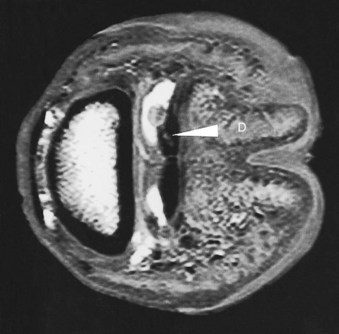
Fig. 21-8 A transverse 3D T2* gradient echo magnetic resonance image of the distal limb of a horse with lameness that was alleviated by intrathecal analgesia of the navicular bursa. There is an area of increased signal intensity within the medial branch of the deep digital flexor tendon (D), with adjacent granulation tissue protruding into the navicular bursa.
Ligament
Mild ligament damage can be detected by the presence of periligamentar signal alteration (increased on T2-weighted images), intraligamentar increase in signal intensity (either focal or diffuse), and ligament enlargement (Figure 21-9). Tears can be represented by thinning or discontinuity. There may be evidence of damage at the ligament origin or insertion. Damage to the bone at the origin or insertion of the ligament may be seen as increased signal intensity on fat-suppressed or T2-weighted images and with decreased signal intensity on T1-weighted images. Enthesophyte formation, endosteal reaction, or osseous cystlike lesions at the origin or insertion of a ligament may also reflect ligament abnormality.
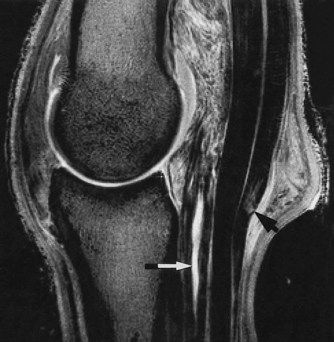
Fig. 21-9 A sagittal T2* gradient echo magnetic resonance image of the fetlock of a horse with lameness that was alleviated by intraarticular analgesia of the metacarpophalangeal joint. There is a linear area of high signal intensity in the straight sesamoidean ligament (white arrow). Increased signal intensity within the superficial digital flexor tendon (black arrow) corresponds to an area of cartilage metaplasia.
Articular Cartilage
Cartilage damage can be seen directly using MR images as changes in signal intensity and/or alterations in contour. Use of fat-suppressed images not only improves contrast in the cartilage itself but also highlights subtle areas of increased signal intensity in the subchondral bone, which may draw attention to a defect in the overlying articular surface. Likewise, focal alteration in the endosteal contour of the subchondral bone in T1- and T2-weighted images may also highlight a region of cartilage pathology.
Synovial Fluid, Synovium, and Joint Capsule
Displacement of the capsular margin represents synovial distention, and damage to the capsular tissues may be seen as thickening or discontinuity of the margin. Using MRI, it is possible to differentiate acute from chronic synovial hyperplasia and to determine the chronicity in hemarthrosis.
Muscles
Muscular inflammation appears as increased signal intensity on T2-weighted images, whereas lower signal intensity on T2-weighted images may represent fibrosis (Figure 21-10).
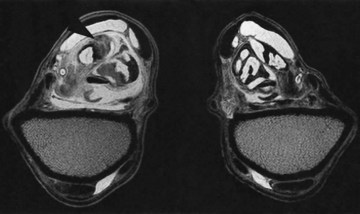
Fig. 21-10 Transverse T2* gradient echo magnetic resonance images at the level of the musculotendonous junction of the superficial digital flexor tendon of the left (shown on the left) and right forelimbs. There is enlargement of the left superficial digital flexor tendon and its accessory ligament. Normal muscle tissue (areas of high signal intensity) is replaced by an area of low signal intensity consistent with scar tissue (arrow).
Artifacts
As with any imaging technique, MRI is prone to artifacts that may confuse the interpreter. Ghosting (repeated picturing of a structure throughout the image) originates from movement during the acquisition of data. This can cause problems in anesthetized horses because respiratory chest movement causes large displacements of the upper forelimb during imaging. Ghosting can also occur if there is sway in a standing horse. Motion can be minimized in an anesthetized horse by weighting the limb with sand bags or reducing respiratory excursion by avoiding mechanical ventilation. In a standing horse, use of motion correction techniques has made it possible to obtain good quality images of the distal aspect of the limb even in the presence of some degree of sway. However, to minimize movement, the level and type of sedation are important, and padding or stabilizing the limb may be helpful, as well as supporting the horse’s head. Acquisition of high-quality images of the carpal and tarsal regions in a standing horse presents more of a challenge because sway is magnified compared with the relatively static foot.
Anything that disturbs the homogeneity of the magnetic field can severely distort the image, resulting in a magnetic susceptibility artifact. These artifacts are more prominent in gradient echo sequences and are particularly induced by the presence of metal. Therefore shoes and residual nails must be removed from feet, and dirt must be cleaned from the sulci of the frog. Chemical shift artifact occurs when fat and water that are adjacent in the horse are shown farther apart on the image. If part of the horse is just outside the field of view but produces a signal detectable by the receiver coil, this may be shown incorrectly within the field of view, known as aliasing. The Gibbs effect (truncation artifact) results from undersampling of data and occurs when bright or dark lines appear parallel and adjacent to borders of abrupt intensity change. For example, a line of low signal intensity is incorrectly shown running through a high signal intensity area.
Partial volume effects result when structures passing obliquely through the slice of tissue are imaged; these are important when either the shape or signal intensity of tissues is assessed. Reducing the slice thickness and improving resolution minimize this effect.
The magic angle effect appears when collagen fibers are located at an angle of approximately 55 degrees to the static magnetic field. This is most important in ligaments and tendons, although it has been reported to occur in cartilage and results in an artifactual increase in signal intensity, which may mimic injury. Structures that are most likely to be affected depend on the direction of the magnetic field. In high-field–strength magnets where the magnetic field is parallel to the long axis of the limb, the magic angle effect is most likely at the insertion of the deep digital flexor tendon. However, in low-field–strength magnets with the magnetic field perpendicular to the long axis of the limb, there is more likelihood of a magic angle effect in the collateral ligaments of the distal interphalangeal joint and the oblique distal sesamoidean ligaments.8,9 The magic angle effect is less evident on T2-weighted compared with T1-weighted images. Increasing the TE as in fast spin-echo sequences reduces the magic angle effect.
Indications for MRI in Equine Lameness
MRI is most useful when pain causing lameness has been localized to a region of the limb but where a definitive diagnosis has not been made with other diagnostic imaging techniques. If abnormalities have been identified, these may be insufficient to explain the degree of lameness or a more accurate prognosis may be required; thus MRI may be justified. In a horse with foot pain with a suspected penetrating injury MRI may be chosen instead of radiography.
MRI can be invaluable for diagnosis and monitoring of orthopedic conditions in the equine limb. However, it is important that an interpreter is aware of the limitations of MRI to avoid overinterpretation or misinterpretation of signal intensity changes observed on MR images. Therefore findings should be interpreted in light of clinical findings and other diagnostic information.