Color Plate

Plate 1.2.1 • The “Fascunculus”. This is a schematic diagram of the fascial layers of the human. The whole diagram is covered by a panniculus of fascia (pale gray layer). The axial fascia covers the torso of the body (blue layer) but does not extend to the head. Visceral fascia extends from the naso-oro-pharyngeal region to the aboral (anal) region (red layer). Meningeal fascia surrounds the brain and spinal cord (green layer). Finally, a thin black line in the center of the body represents the notochord separating the meningeal fascia from visceral fascia. In the adult the notochord would be replaced by portions of the vertebral column. From Willard/Carreiro Collection, with permission.
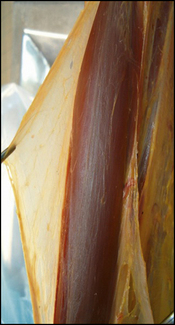
Plate 1.4.1 • Dissection of the anterior region of the arm. The brachial fascia has been detached from the biceps brachii muscle.
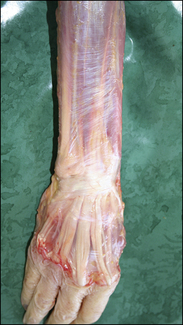
Plate 1.4.2 • Dissection of the posterior region of the forearm. The antebrachial fascia shows a strong reinforcement at the wrist, corresponding to the extensor retinaculum of the wrist.
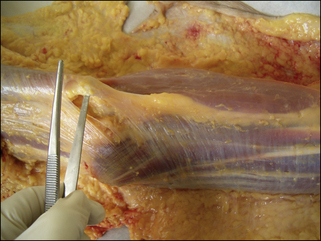
Plate 1.4.3 • Dissection of the anteromedial region of the elbow showing the lacertus fibrosus or the fibrous expansion of the biceps brachii muscle onto the antebrachial fascia.
Plate 1.5.1 • Dissection of the leg, posterior view. The crural fascia is detached from the underlying muscles, cutting the intermuscular septum. Loose connective tissue is present, the sliding between the crural fascia and the gastrocnemius muscle in life.
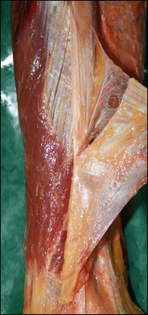
Plate 1.5.2 • Dissection of the thigh, lateral view. The fascia lata is easily detached from the quadriceps muscle thanks to the presence of loose connective tissue and the epimysium of the muscle. It is evident that the iliotibial tract is a reinforcement of the fascia lata, and so not separable from it without cutting the fascia.
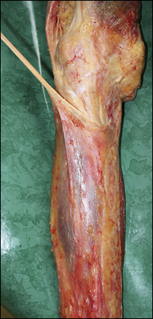
Plate 1.5.3 • Dissection of the inferior limb, anteromedial view of the knee region. The expansion of the semitendinosus muscle into the crural fascia is evident.
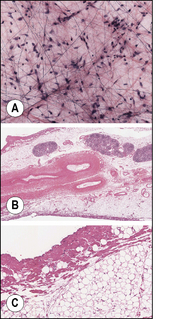
Plate 1.8.1A,B,C • Histological views of fascia. (A) This is a loose connective (areolar) tissue spread demonstrating a fairly random arrangement of collagenous and elastic fibers. (B) This is a cross-section taken through mesentery demonstrating a thin layer of dense, irregular collagenous fibers underlying the mesothelium with a central core of adipose tissue surrounding several vessels and lymph nodes. Note the thickened tunica adventitia of the vessels. (C) This is a magnified view of the mesentery border showing the thin layer of dense irregular collagenous fibers underlying the single cell layer of mesothelium. Courtesy of the Willard/Carreiro Collection.
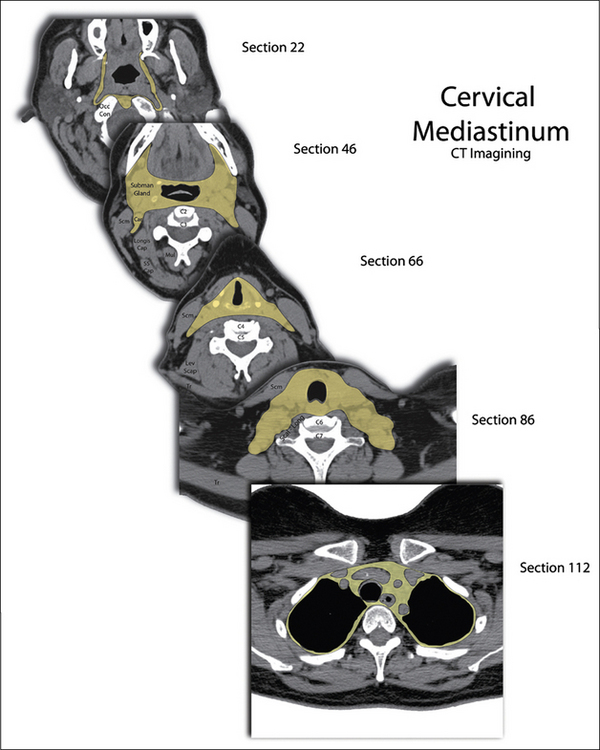
Plate 1.8.2 • A series of axial plane CT slices taken from the cranial base (section 22) through the cervical region to reach the cervicothoracic junction (section 86) of a 49-year-old female patient. Section 112 demonstrates the opening of the pleural sacs and the spreading of the endothoracic fascia around these sacs. Abbreviations are: Car, carotid sheath; Lev Scap, levator scapulae; Longus Cap, Longus capitis muscle; Mul, Multifidus muscle; Occ Con, occipital condyle; ScalLong, Scalene and Longus muscles; SCM, sternocleidomastoid muscle; SS Cap, Semispinalis capitis; Subman Gland, submandibular gland; Tr, trapezius muscle. Courtesy of the Willard/Carreiro Collection.
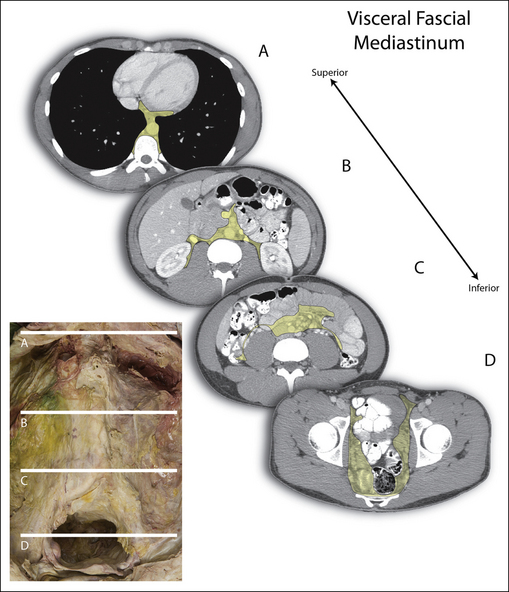
Plate 1.8.3 • A series of axial plane CT images involving the thorax, abdomen and pelvis. The mediastinal column of visceral fascia has been shaded yellow. The inset on the lower left is a posterior body wall with all peritoneal organs removed revealing the endoabdominal fascia. The white lines indicate the levels of the corresponding CT images. Courtesy of the Willard/Carreiro Collection.
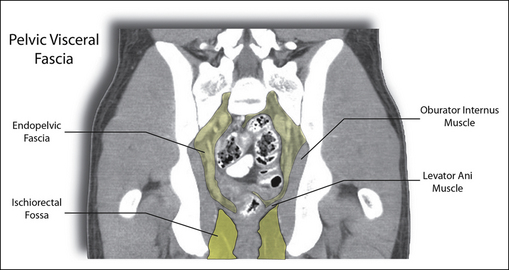
Plate 1.8.4 • A coronal plane reformatted CT image of the male pelvis. The endopelvic fascia is seen surrounding the visceral organs in the center of the pelvic basin. The levator ani separates the endopelvic fascia from the pannicular fascia located in the ischiorectal fossa. Courtesy of the Willard/Carreiro Collection.
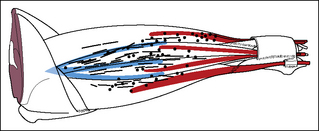
Plate 2.2.1 • The spatial distribution of muscle spindles in the superficial lateral forearm muscle in the rat. The distribution is clearly more related to the architecture of the proximal epicondylar connective tissue apparatus than to the topography of the muscles. The projections of the proximal intermuscular septa are indicated with blue, the projections of the distal tendons in red. The black lines indicate muscle spindles; the gray dots are Golgi tendon organs (GTO).
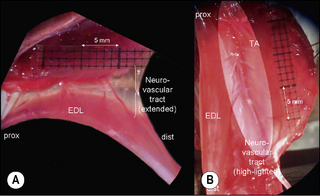
Plate 3.2.1 • The neurovascular tract. (A) Rat m. extensor digitorum longus (EDL) while loaded vertically with equal weights (not shown) at proximal (prox) and distal (dist) tendons exposing the neurovascular tract. (B) The neurovascular tract (highlighted area) in its original position. This tract is exposed by laterally cutting and medially deflecting m. tibialis anterior (TA).
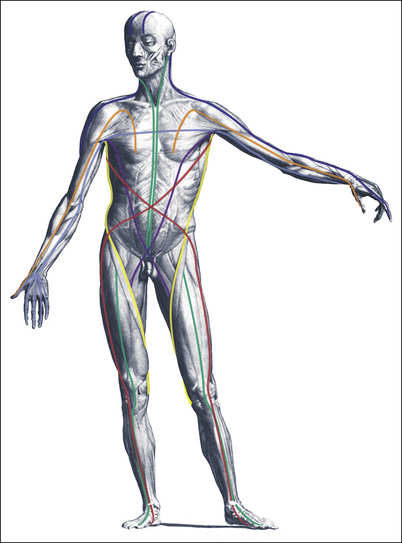
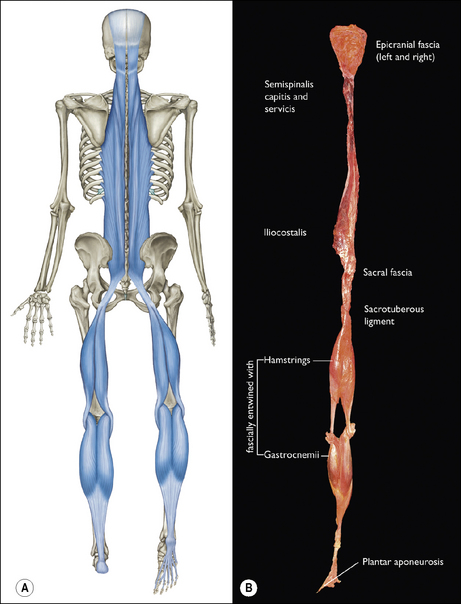
Plate 3.4.2 • The Superficial Back Line (A) and dissected as a single continuous band of myofasciae (B).
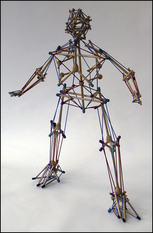
Plate 3.4.3 • If the body works in a manner similar to this intriguing tensegrity model, then the Anatomy Trains can be seen as the long “elastics” that create the sea of tension in which the isolated compression struts of the bones are balanced. © TE Flemons, www.intensiondesigns.com.
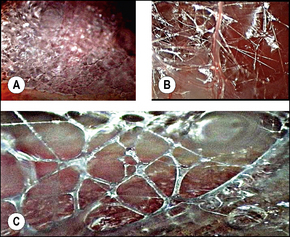
Plate 3.6.1 • (A) Traction on the paratendon during surgery; (B) Searching for an epitendinous plane; (C) Network between the tendon and the peripheral system: the MVCAS.
Plate 3.6.2 • MVCAS under the electron microscope. (A) Histological and collagenous continuity between the epitendon and MVCAS; (B) Sketch of this organization in vacuoles; (C) 3-D tissue supports; (D) 3-D vacuola.
Plate 3.6.5 • Summary of mechanical properties of collagenic gel allowing multiadaptative response to the stress, permitting, absorbing, external stress, restoring, original shape and autonomy of constituent organs.
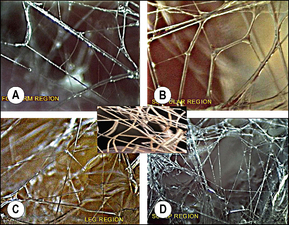
Plate 3.6.6 • Globality of the absorbing suspension system in different parts of the body. (A) Forearm subcutaneous area; (B) Scapular region; (C) Leg region; (D) Scalp area.
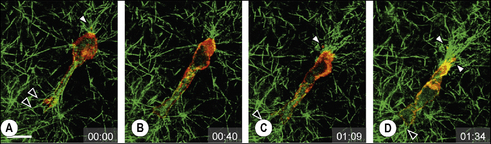
Plate 4.2.1 • Migrating cell remodels its collagenous matrix. These captions from a 90 min. long video of a live cell demonstrate how the cell – by its very act of migrating – remodels the 3D collagen matrix in which it is embedded. Notice the compacted area in the upper right corner, which it leaves behind as it moves to the lower. From Friedl 2004, with permission.
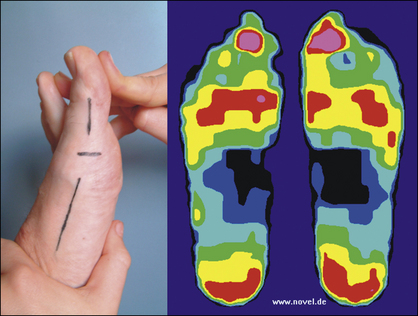
Plate 5.5.1 • The association between LJM in the first MTP joint and the elevated dynamic plantar foot pressures measured at the great toe in both feet shown as warm pink and red colors.
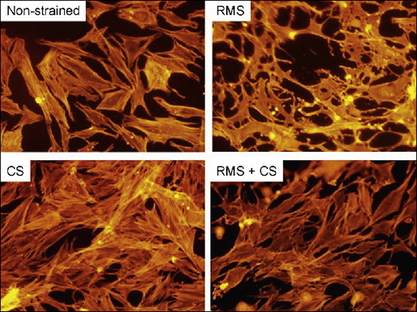
Plate 7.5.1 • Effects of RMS and CS on fibroblast morphology and actin stress fiber architecture. See detailed description of the four images in the text, in which RMS = 8 hours of repetitive motion strain; CS = 60 seconds of counterstrain; and RMS + CS = 8 hours of repetitive motion strain followed by 60 seconds of counterstrain, three hours later. From Standley PR, Meltzer KR 2008 In vitro modeling of repetitive motion strain and manual medicine treatments: potential roles for pro- and anti-inflammatory cytokines. Journal of Bodywork & Movement Therapies 12:201–203.
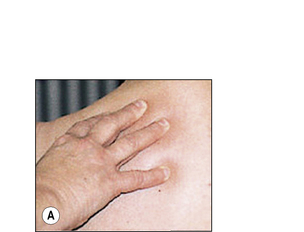
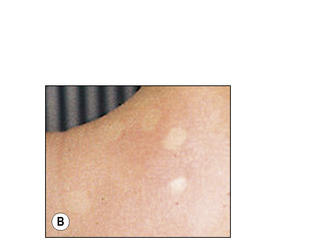
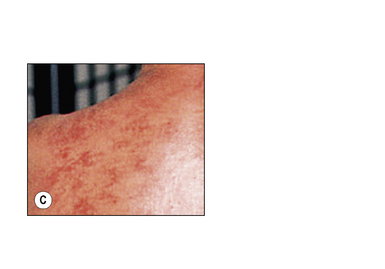
Plate 7.10.1 (A), (B), (C) • Palpation for ‘sha’stasis. Pressing at top results in blanching (B) that is slow to fade, which indicates sluggish surface perfusion, or sha ‘blood stasis’ in traditional East Asian medicine. Image (C) is the same patient after Gua sha.
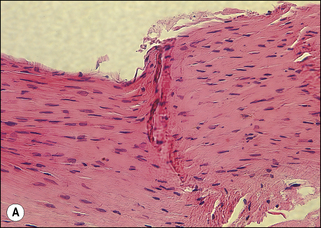
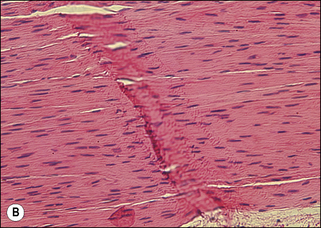
Plate 7.14.1 • (A) Non-treated ligaments 4 weeks postoperative. (B) GT treated ligaments 4 weeks postoperative.
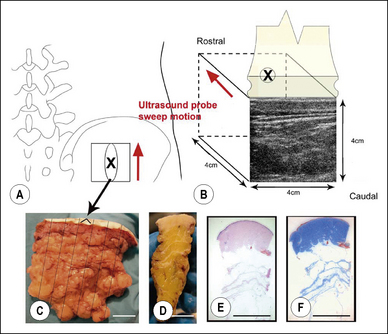
Plate 8.2.1 • Ultrasound evaluation of subcutaneous and perimuscular connective tissue stratification: correspondence between ultrasound and histology in a human subject. (A, B) Location and size of ultrasound scan area on the back (X indicates the center of the scanned area in both A and B); (C) excised tissue sample indicating location of seven serial tissue blocks; (D,E,F) fixed tissue block cut transversely with corresponding hematoxylin/eosin (E) and Masson trichrome (F) histological slides. Scale bars, 1 cm.
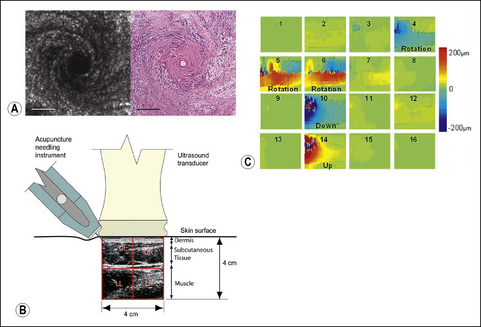
Plate 8.2.2 • Acupuncture needling as a tool to investigate connective tissue dynamic behavior using ultrasound. (A) C-scan ex-vivo ultrasound imaging of connective tissue winding during acupuncture needle rotation (left) and corresponding histology imaging (right) of the rat subcutaneous connective tissue sample after tissue fixation. (B) Ultrasound elastography technique used to measure tissue displacement during robotic acupuncture needling. (C) Spatial map of tissue displacement during acupuncture needle rotation, upward and downward linear needle motion. Color map indicates upward (red) and downward (blue) tissue motion induced by a 2 mm linear needle oscillation following needle rotation.
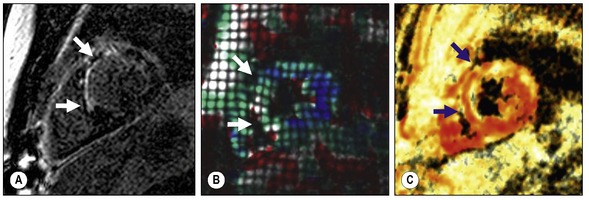
Plate 8.3.1 • Advanced motion imaging using SENC. Images of a subendocardial infarct in a short axis heart image as seen by: (A) delayed enhancement MRI (arrows pointing to contrast holding and more white-looking infarct extent); (B) tagged MR imaging showing decreased function at the infarct zone (circumferential strain is overlaid; blue color indicates normokinesia; green, hypokinesia; white akinesia); and (C) SENC image, color indicating through-plane contraction (red indicates normokinesia). Notice the subendocardial dysfunction (white color) matching that of the infarcted region but accompanying normal midendocardiac contraction (red color). SENC seems to show more regional functional differentiation. Courtesy of Nael F. Osman.
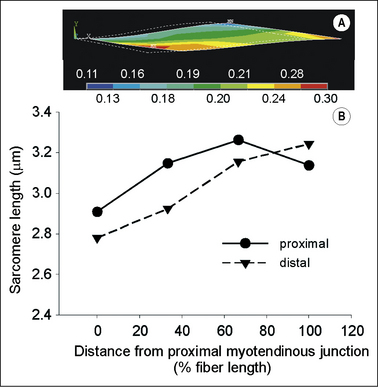
Plate 8.4.1 • Finite element model calculations of strain distributions in passive muscle with epimuscular connections. A 3D-finite element EDL muscle model (Yucesoy et al. 2002, 2003) is used to predict the strain distributions after exposing the muscle at a high global strain (12% over muscle slack length). (A) Strain distributions in the fibre direction within the muscle model represent both serial and parallel sarcomere length distributions. The colour bar below the contour plot indicates how the colours relate to the relative change in strain with respect to the optimum sarcomere length. (B) Comparison of the serial sarcomere lengths within most proximal and distal muscle elements. Given that sarcomere slack length is ~ 2.5 μm, local strains are shown to be substantially higher (ranging from 11% to 36% over passive sarcomere slack length).
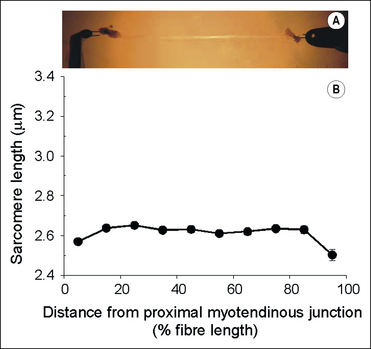
Plate 8.4.2 • Sarcomere strains along the length of a globally strained isolated fiber. Single myofibers of Xenopus laevis were isolated by dissection using forceps and scissors leaving at the myotendinous junctions (MTJ) attached to small pieces of tendon. (A) Image of an isolated myofiber which is dissected along the length of the isolated myofibers. (B) The mean sarcomere lengths are plotted as a function of the relative distance from the proximal MTJ. In the vicinity of the MTJs, sarcomeres were shorter (~ 9% over passive sarcomere slack length) than in the middle of the fibers (~ 15% over slack length).
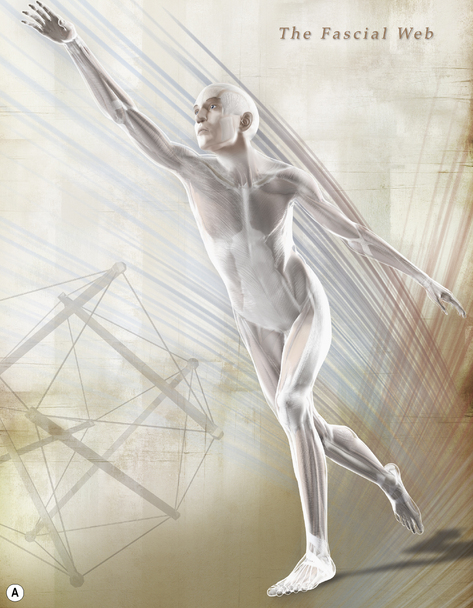
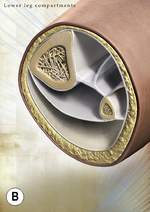
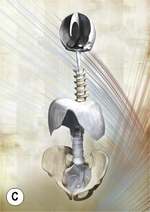
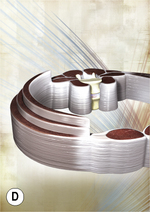
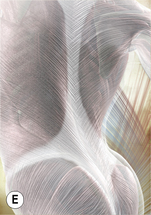
An artist's approach to illustrate the fascial network of the human body. (A) The body is covered by a continuous body suit of dense fibrous connective tissue, called Fascia profunda. (B) Cross section of fascial structures in the lower leg. The fascial membranes shown here divide the lower leg into four different muscular compartments. (C) Some diaphragmatic fascial structures in the human body: cranial vault, respiratory diaphragm, and pelvic floor. (D) Cross-section of fascial layers of the abdominal and paraspinal region. (E) Thoracolumbar fascia. The superficial layer of this broad fascial sheet serves as attachment for the latissimus dorsi as well as the gluteus maximus muscles. The above images are available as A1 size posters. Please contact www.fasciaposter.com for details.