Chapter Twelve Measurement
Introduction
The term measurement refers to the procedure of attributing qualities or quantities to specific characteristics of objects, persons or events. Meas-urement is a key process in quantitative research, evaluation and in clinical practice. If the measurement procedures in a study are inadequate its usefulness will be limited. Similarly, in clinical practice, the validity of diagnoses and treatment decisions can be compromised by inadequate measurement processes and tools.
Operational definitions and measurement
Sometimes researchers start off with rather vague views of how to measure the variables included in a study. For instance, if researchers are interested in measuring ‘levels of pain’ experienced by patients, then the researchers must convert their general ideas about measuring pain to a tightly defined statement of how this is to be measured. Depending on their theoretical interpretation of the concept of ‘pain’, and the practical requirements of the investigation, one of the many pos-sible approaches to measurement of pain will then be selected.
The process of converting theoretical ideas to a tightly defined statement of how variables are to be measured is called operationalization. It is important that researchers give exact details of how the measures were taken in order that others may judge their adequacy and appropriateness and be in a position to repeat the procedures in a new study. A study that is adequate in terms of design, sampling methods and sample size may nevertheless have poor validity due to the use of inadequate measurement techniques. Let us now discuss operationalization.
The operational definition of a variable is a statement of how the researcher in a particular study chooses to measure the variable in question. It should be unambiguous.
At the outset, let us note that in most circumstances there is no single best way of taking measurements. If a researcher claimed that her therapeutic techniques significantly increased ‘motor control’ in her sample of patients, the obvious question that arises is ‘What was meant by ‘motor control’ and how was it measured?’ If our researcher replied that she was interested in motor control as measured by the Plunkett Motor Dexterity Task scores, she has, in fact, supplied her operational definition. Another researcher may challenge the adequacy of this definition and substitute her own, stating that patients’ selfratings of control in various tracking tasks is a more appropriate definition.
A good operational definition will contain enough information to enable another researcher or clinician to replicate the measurement techniques used in the original study. Similarly, a good operational definition of a clinically relevant variable will enable a fellow professional to replicate the original diagnostic or assessment procedures. An operational definition can be an unambiguous description, a photograph or diagram, or the specification of a brand name of a standard tool. In describing a piece of research, one must include operational definitions of the measuring apparatus and all procedures, so that readers are quite clear as to what has been done and with whom and when.
Objective and subjective measures
A distinction is commonly drawn between object-ive and subjective measures, often with overtones of suspicion directed towards so-called ‘subjective’ measures. Let us make a much less value-laden distinction and define them as follows: objective measurements involve the measurement of physical quantities and qualities using measurement equipment; subjective measures involve ratings or judgments by humans of quantities and qualities.
One should not confuse the distinction between objective and subjective measures as corresponding to good or bad measurement techniques. Equipment might be improperly calibrated, complicated to use, or become damaged during an investigation. For instance, a researcher might have an absolutely terrible set of weight scales that give results far at variance with the correct measures. With the sophistication and complexity of much current measurement equipment, it is often difficult to calibrate equipment accurately without a complex calibration procedure. Just because a machine is involved in measurement does not mean that the results will be accurate. Furthermore, many quantities and qualities associated with persons and clinical phenomena are difficult to measure objectively, such as the personal attractiveness of individuals, or aspects of patient–therapist relationships, or the ‘quality’ of a patient’s gait.
Desirable properties of measurement tools and procedures
Measurement tools and procedures ought to yield measurements that are reproducible, accurate, applicable to the measurement task in hand and practical or easy to use. These properties are often given the technical terms of reliability, validity, applicability and practicability. These properties will be reviewed in detail in the following sections. Measurement theory and method are concerned with the development of measurement tools that maximize these properties.
Before these specific test properties are reviewed, it is useful to review some basic concepts in test theory. In any measurement, we have three related concepts: the observed value or test score, the true value or test score and measurement error. Thus if I could be weighed on a completely accurate set of weighing scales, my true score might be 110 kg. However, the scales that I use in my bathroom might give me a reading of 100 kg. The difference between the observed score and my true score is the measurement error. This relationship can be expressed in the form of an equation such that:

Thus, measurement tools are designed with a view to minimize measurement error so that the observed value we obtain from our assessment process is close to the true value.
Reliability
Reliability is the property of reproducibility of the results of a measurement procedure or tool. There are several different ways in which reliability can be assessed. These include test–retest reliability, inter-observer reliability and internal consistency. Let us examine each.
Test–retest reliability
A common way to assess test reliability is to administer the same test twice to the same participants. The results obtained from the first test are then correlated with the second test. Reliability is generally measured by a correlation coefficient that may vary from − 1 to + 1 in value. A test–retest reliability of + 0.8 or above is considered to be sound. When the measurement process involves clinical ratings, e.g. a clinician’s rating of the dependency level of a cerebrovascular accident (CVA) patient, test–retest reliability is sometimes termed intra-observer reliability, i.e. the same observer rates the same patients twice and the results are correlated.
Inter-observer (inter-rater) reliability
A common issue in clinical assessment is the extent to which clinicians agree with each other in their assessments of patients. The extent of agreement is generally determined by having two or more clinicians independently assess the same patients and then comparing the results using correlations. If the agreement (correlation) is high then we have high inter-observer or inter-rater reliability.
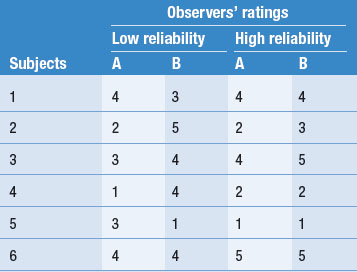
Table 12.1 illustrates examples of both high and low inter-observer reliability on ratings of patients on a 5-point scale. Let’s imagine that this scale measures the level of patient dependency and need for nursing support. As we mentioned earlier, the degree of reliability is quantitatively expressed by correlation coefficients. However, by inspection you can see that in Table 12.1 there is a high degree of disagreement in the two observers’ ratings in the ‘Low reliability’ column. In this instance the clinical ratings would be unreliable, and inappropriate to use in the research project. However, the outcome shown in the ‘High reliability’ column in Table 12.1 shows a high level of agreement.
An example of a classic study of inter-rater and intra-rater reliability is provided by Coppleson et al (1970). Over an 11-month period, 29 biopsy slides with suspected Hodgkin’s disease were presented to three pathologists. The pathologists were asked to make a number of judgments about features of the specimens. The specimens were unlabelled and over the year of the study were presented on two occasions to each of the three observers. This permitted an assessment of the test–retest or intra-rater reliability of each observer. The three observers disagreed with themselves on 7, 8 and 9 occasions, respectively, out of the total number of specimens. Overall, interrater agreement was calculated at 76% or 54%, depending on the diagnostic classification system used by the observers. Studies of clinical judgment often find low levels of agreement between raters (see, for example, Doyle & Thomas 2000, Thomas et al 1991).
Internal consistency
Measurement tools will often consist of multiple items. For example, a test of your knowledge of research methods might include 50 items or questions. Similarly, a checklist designed to measure activities of daily living might have 20 items. The internal consistency of a test is the extent to which the results on the different items correlate with each other. If they tend to be highly correlated with each other, then the test is said to be intern-ally consistent. Internal consistency is also measured by a form of correlation coefficient known as Cronbach alpha and an alpha of above 0.8 is considered to be a desirable property for a test.
Thus, the reliability or reproducibility of an assessment or test can be determined in several different ways including the test–retest, intra-rater, inter-rater and internal consistency methods.
Validity
Validity is concerned with accuracy of the test procedure. Just because one keeps getting the same result upon repeated administrations, or agreement among independent observers, doesn’t mean that the results are accurate. If I jump on the bathroom scales and get a result of 40 kg and then jump off the scales and then get back on and it is still reading 40 kg, this reading is certainly reliable, but obviously it is an error (for readers who do not know us, 40 kg as an observed score for our weight entails major measurement error!). Thus the adequate reproducibility or reliability of a test or assessment process is essential, but we also need the results to be accurate or valid.
A case study in clinical test validity
The early detection of breast cancer in women has been recognized as an important public health initiative in many countries. Common ways of detecting suspicious lumps include breast self-examination and mammography, an X-ray of the breasts. Mammography is a common screening procedure and some countries such as Australia have funded large-scale programmes to promote it.
However, commendable as these initiatives may be, there are some doubts about the validity of mammography as a diagnostic tool. Walker & Langlands (1986), in their classic research project, studied the mammography results of 218 women, who, through the use of a diagnostic biopsy, were known to have breast cancer. Of the 218 women with cancer, 95 (43.6%) had recorded a (false) negative mammography test result. Of these patients, 47 had delayed further investigation and treatment for almost a year, no doubt relieved and reassured by their ‘favourable’ test results. The delays in treatment, given what we know about the relationship between early intervention and improved prognosis, in all likelihood seriously compromised the health and ultimate survival of these women. In this instance, the accuracy (or lack of it) of the test results has very important consequences for the people concerned. Test quality is of profound importance in research and clinical practice, as is demonstrated by this example.
Types of test validity
As with reliability, test validity may be assessed in a number of different ways. These include content validity, sensitivity and specificity, and predictive validity.
Content or face validity
In many contexts it is difficult to find external measures to correlate with the measure to be validated. For example, an examination in a particular academic subject may be the sole measure of the student’s performance available to determine grades. How can it be determined whether the tests administered will be valid or not? One way is to write down all the material covered in the subject and then make sure that there is adequate sampling from the overall content of the material delivered in the subject. If this criterion is satisfied it can be said that the test has content or face validity. You may have had an experience where you felt that a subject assessment task had low content validity in that it did not reflect the material presented in the subject.
Sensitivity and specificity
The concepts of sensitivity and specificity are most commonly applied to diagnostic tests, where the purpose of the test is to determine whether the patient has a particular problem or illness. There are four possible outcomes for a test result, as shown in Table 12.2.
Table 12.2 Possible outcomes of test results
| Real situation | ||
|---|---|---|
| Test result | Disease present | Disease not present |
| Disease present | True positive | False positive |
| Disease not present | False negative | True negative |
Sensitivity refers to the proportion of people who test as positive who really have the disease (i.e. the proportion of true positives out of all positives). Specificity refers to the proportion of individuals who test as negative who really do not have the disease (i.e. the proportion of true negatives out of all negative test results). If a diagnostic test has a sensitivity of 1.0 and specificity of 1.0 it is a perfectly accurate or valid test. Most clinical tests are not perfect and some have unknown or quite low sensitivity and specificity.
Predictive validity
Predictive validity is concerned with the ability of a test to predict values of it or other tests in the future. Some tests are designed to assist with prognostic decisions, i.e. what is going to happen in the future; and for these tests high predictive validity is an important quality.
Let us examine an example of predictive validity. Say a researcher devised a screening rating scale, X, for selecting patients to participate in a rehabilitation programme. The effectiveness of the rehabilitation programme is assessed with rating scale Y. Say that each rating scale involves assigning scores of 1–10 to the patients’ performance. Table 12.3 illustrates two outcomes: low predictive validity and high predictive validity.
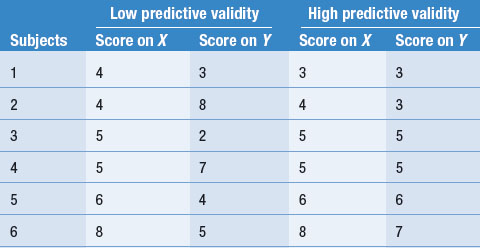
Although the calculation of correlation coefficients is needed to examine quantitatively the predictive validity of test X, it can be seen in Table 12.3 that in the ‘Low predictive validity’ column, the scores on X are not clearly related to the level of scores on Y. On the other hand, in the ‘High predictive validity’ column, scores on the two variables correspond quite closely. Within the limits of the fact that only six subjects were involved in this hypothetical study, it is clear that only the results in the ‘High predictive validity’ column are consistent with rating scale X being useful for predicting the outcome of the rehabilitation programme, as measured on scale Y.
At this point we should again refer to the concepts of internal and external validity. The concepts of predictive and content validity apply to the specific tests and measures a researcher or clinician uses. Internal and external validity refer to characteristics of the total research project or programme. Test validity should not be confused with other forms of research design validity such as external and internal validity.
External validity is concerned with the researcher’s ability to generalize her or his findings to other samples and settings, i.e. the generalizability of the study findings. The external validity or generalizability of a study is affected by the sample size, the method of sampling, and the design characteristics and measures used in the study. If we say a study has high external validity, we mean that its findings generalize to other settings and samples outside the study. It does not make sense to talk about the external validity of a particular test.
Similarly, internal validity is concerned with the design characteristics of experimental studies. If a study is internally valid, any effects/changes or lack thereof in the dependent (outcome) vari-able can be directly attributed to the manipulation of the independent variable. It is important not to confuse the meanings of these terms.
Standardized measures and tests
Because reliability and validity of measures are so important, many researchers have devoted considerable time and energy to the development of measuring instruments and procedures that have known levels of reliability and validity.
The development of measurement standards for physical dimensions such as weight, length and time has been fundamental for the growth of science. That is, we have standards for comparing our measurements of a variable and we can meaningfully communicate our findings to colleagues living anywhere in the world. There are a variety of clinical measures, for instance the Apgar tests for evaluating the viability of neonates, that represent internationally recognized standards for communicating information about attributes of persons or disease entities.
Furthermore, there are standards relevant to populations, in terms of which assessments of individuals become meaningful. For instance, there are standards for the stages of development of infants: levels of physical, emotional, intellectual and social development occurring as a function of age.
Some tests have been trialled on large samples, and reliability and validity levels recorded. Tests that have been trialled in this way are known as standardized measures or tests. A large variety is available, particularly in the clinical and social areas. Bowling’s Measuring Health (1997) is a very useful source of descriptions of such tests. Many US firms and cooperatives market standardized tests. However, many researchers use tests and measures that have not been standardized, and do not report levels of reliability in their literature. This is of particular concern in studies where subjective measures with incomplete operational definitions are employed.
Measurement scale types
Measurement can produce different types of numbers, in the sense that some numbers are assigned different meanings and implications from others. For instance, when we speak of Ward 1 and Ward 2, we are using numbers in a different sense from when we speak of infant A being 1 month old, and infant B being 2 months old. In the first instance, we used numbers for naming; in the second instance the numbers indicate quan-tities. There are four scale types, distinguished by the types of numbers produced by the measurement of a specific variable.
1. Nominal scales
The ‘lowest’ level of the measurement scale types is the nominal scale, where the measurement of a variable involves the naming or categorization of possible values of the variable. The measurements produced are ‘qualitative’ in the sense that the categories are merely different from each other. If numbers are assigned to the categories they are merely labels and do not represent real quan-tities; for example, Ward 1 and Ward 2 might be renamed St. Agatha’s Ward and St. Martha’s Ward without conveying any less information. Table 12.4 shows some other examples of nom-inal scaling.
Table 12.4 Some examples of nominal scaling
| Variable | Possible values |
|---|---|
| Patients’ admission numbers | 3085001, 3085002 |
| Sex | Male, female |
| Religion | Catholic, Protestant, Jewish, Muslim, Hindu |
| Psychiatric diagnosis | Manic-depressive, schizophrenic, neurotic |
| Blood type | A, B, AB, O |
| Cause of death | Cardiac failure, neoplasm, trauma |
The only mathematical relationship pertinent to nominal scales is equivalence or non-equivalence; that is, A = B or A ≠ B. A specific value of a variable either falls into a specific category, or it does not. Thus, there is no logical relationship between the numerical value assigned to its category and its size, quantity or frequency of occurrence. The arbitrary values of a nominal scale can be changed without any loss of information.
2. Ordinal scales
The next level of measurement involves rank ordering values of a variable. For example, 1st, 2nd or 3rd in a foot race are values on an ordinal scale. The numbers assigned on an ordinal scale signify order or rank.
With ordinal scales, statements about ranks can be made. Where A and B are values of the variable, we can say A > B or B > A. For instance, we can say Mrs Smith is more cooperative than Mr Jones (A > B), or Mr Jones is more cooperative than Ms Krax (B > C). We cannot, however, make any statements about the relative sizes of these differences. Examples of ordinal scales are shown in Table 12.5.
Table 12.5 Some examples of ordinal scales
| Variable | Possible values |
|---|---|
| Severity of condition | Mild=1, moderate=2, severe=3, critical=4 |
| Patients’ satisfaction with treatment | Satisfied=1, undecided=2, dissatisfied=3 |
| Age group | Baby, infant, child, adult, geriatric |
| Cooperativeness with nurse or patients in a ward | (In decreasing order) Mrs Smith, Mr Jones, Ms Krax |
3. Interval scales
Examples of interval scales are shown in Table 12.6. For these scales, there is no absolute zero point; rather, an arbitrary zero point is assigned. For instance, 0°C does not represent the point at which there is no heat, but the freezing point of water. An IQ of zero would not mean no intelligence at all, but a serious intellectual or perceptual problem in using the materials of the test.
Table 12.6 Some examples of interval scales
| Variable | Possible values |
|---|---|
| Heat (Celsius or Fahrenheit) | −10ºC, +20ºC, +5ºC, +10ºF |
| Intelligence (IQ) | 45, 100, 185 |
The use of an interval scale enables identificat-ion of equal intervals between any two values of measurements: we can say A − B = B − C. For example, if A, B and C are taken as IQ scores, and A = 150, B = 100, and C = 50, then it is true that A − B = B − C. However, we cannot say that A = 3C (that A is three times as intelligent as C).
4. Ratio scales
Ratio scales have what is called a meaningful or non-arbitrary zero point. For example, in the Kelvin temperature scale, 0°K (or absolute zero) represents an absence of heat, in that the mol-ecules have stopped vibrating completely; whereas 0°C is simply the freezing point of water. The Centigrade or Celsius zero is an arbitrary one tied to the freezing point of a particular compound. Thus °K is a ratio scale and °C is an interval scale. Examples of variables measured on ratio scales are shown in Table 12.7.
Table 12.7 Variables measured on ratio scales
| Variable | Possible values |
|---|---|
| Weight | 10 kg, 20 kg, 100 kg |
| Height | 50 cm, 150 cm, 200 cm |
| Blood pressure | 110 mmHg, 120 mmHg, 160 mmHg |
| Heart beats | 10 per minute, 30 per minute, 50 per minute |
| Rate of firing of a neurone | 10 per millisec, 20 per millisec, 30 per millisec |
| Protein per blood volume | 2 mg/cc, 5 mg/cc, 10 mg/cc |
| Vocabulary | 100 words, 1000 words, 30 000 words |
Table 12.8 compares the characteristics of different scales or levels of measurement.
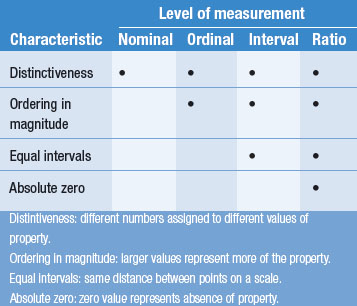
Interval and ratio scales represent quantitative measurements. A ratio scale is the ‘highest’ scale of measurement, in the sense that it involves all the characteristics of the other scales, as well as having an absolute zero. A measurement on a higher level can be transformed into one on a lower level in this framework, but not vice versa, because the higher scale measurement contains more information and the values can be put to more use by permitting more mathematical operations than those on a lower level.
Also, a given variable might be measured on one of several types of scales, depending on the needs of the investigator. Consider, for instance, the variable ‘height’. This variable could be measured on any of the four scales, as follows:
The different types of measurement scales are important when considering statistical analysis of data. Statistics are numbers with special properties from data. The type of measurement scale determines the type of statistic that is appropriate for its analysis. This issue is taken up later in this book.
Summary
This section defines good measurement practice and its importance in research and clinical practice.
In good measurement practice we need to define concepts operationally, so that other investigators can also carry out or assess the measurement procedure. We also need to establish the reliability and validity of our measurements. A high degree of reliability and validity is necessary for minimizing measurement error. We have noted that measures involving the exercise of human judgment (i.e. ‘subjective’ measures) are not necessarily unreliable or invalid.
Four different scale types were discussed: nominal, ordinal, interval, and ratio. These scales have different characteristics, particularly in relation to the permissible mathematical operations. In subsequent sections, we shall see that the scale type involved in our measurements determines the descriptive and inferential statistics appropriate for describing and analysing the data.
Self-assessment
Explain the meaning of the following terms:
True or false
Multiple choice
Therapists assess levels of clients’ ‘independence’ using the following scale: