Introduction to: Discussion, questions and answers
Descriptive statistics are an integral part of everyday life and an important aspect of clinical practice. They are used to describe the essential characteristics of measurements for a sample of cases. Some descriptive statistics are quite familiar to the lay person. The mean or average is frequently used in discussions of public policy. For example, the question ‘What has happened to the average household income in the UK over the last year?’ uses this concept, as does a question such as ‘What is the average length of stay in hospital for an orthopaedic patient with a fractured neck of femur in this ward?’ Descriptive statistics are shorthand ways of conveying information about a sample of cases.
In recent years in the UK, Australia, Canada and the US, there has been a growing preoccupation with the effectiveness and efficiency of health services in particular, and government services in general. Economic conditions have resulted in the reduced availability of tax revenues and this has led to increased scrutiny of spending. Hospital services are an expensive component of health services in these countries. Much statistical information is collected concerning stays in hospital. The use of statistical information concerning case costs is heavily used to determine funding of hospitals by agencies such as government and insurers.
A key component of hospital costs is the length of time spent by the patient in the hospital. Each ‘bed day’ is very costly and most hospital services are under pressure to reduce the length of stay for their patients. However, one cannot reduce the length of stay for each patient too far, as this might be dangerous. Patients can come back unexpectedly because they require further hospitalization following discharge. This is termed an ‘unplanned’ readmission. Thus, the goal is to reduce lengths of stay but not increase unplanned readmissions.
Obviously, the expected length of stay for a woman giving birth ought to be much shorter than a man recovering from serious internal injuries and multiple compound fractures following a motor vehicle accident. How can these cases be compared without some adjustment for their differences? There is a large literature concerning how different types of patients might be compared. Comparability of types of patients is often achieved by the use of diagnosis-related groups (DRG) where patients of the same type are categorized together. This grouping enables hospitals and their funding agencies to compare how efficient and effective different hospitals are in treating the same types of patient.
Table D16.1 shows some data for patients admitted to an orthopaedics ward in a hospital. All the cases with the same diagnostic category have been included.
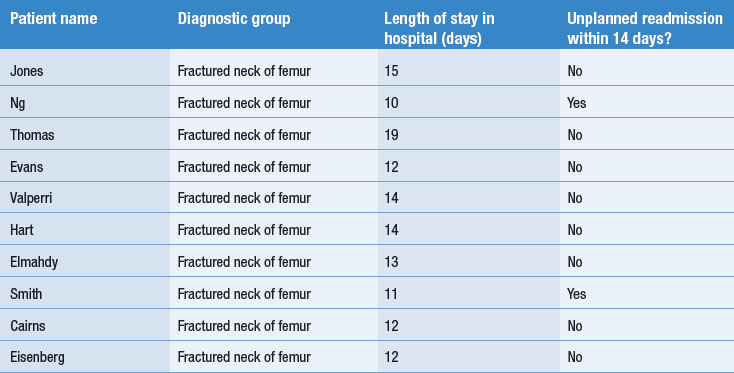
For this sample of cases, the average length of stay was 13.2 days (standard deviation 2.5). The minimum stay was 10 days and the maximum stay was 19 days. The rate of unplanned readmissions within 14 days was 2 in 10 or 20%.
If one was to take larger samples of cases from a variety of hospitals (say a consecutive series of 30 cases for each), then it would be possible to compare their lengths of stay and the rates of readmissions. This has been done in Table D16.2, with hypothetical data from five hospitals.
Table D16.2 Lengths of stay and readmission rates for 30 consecutive patients with a fractured neck of femur at five hospitals
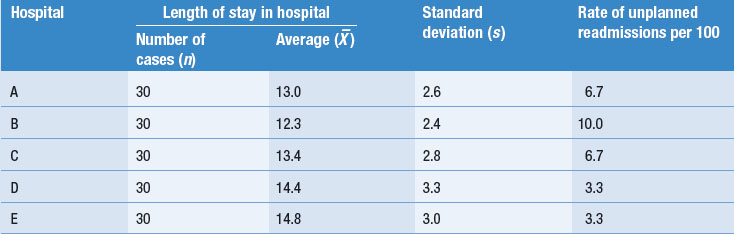
Although the differences in average numbers of days spent in hospital between the five hospitals may not appear to be great, a difference of 2.5 days, for example between hospitals B and E, may represent over £500 for each case. In a busy hospital department, this would soon run into large sums of money. However, it is worrying that the hospital with the shortest period of stay also seems to be the one with the highest rate of readmissions within 14 days. Perhaps they are discharging some of their patients too soon. With such a small sample of hospitals (i.e. only five) and such a small number of readmissions (only three out of the 30 in the worst case), it would be difficult to conclude whether there is such a relationship. However, if these data were collected from a large number of hospitals with a larger number of cases, it would be possible to correlate these two variables to study the size of the relationship between them.
Correlation coefficients measure the size and direction of the statistical relationship between two variables. Following on from the above discussion, we might hypothesize that there is a negative correlation between the average length of stay and rate of readmission to hospital. In other words, we might expect that a shorter average stay in a hospital could result in a greater rate of readmission. Figure D16.1 shows the association between length of stay and rate of readmission for 30 hospitals, based on their 1993–1994 discharges for all their patients with a fractured neck of femur.
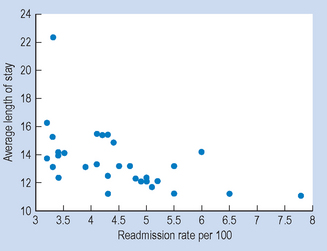
Figure D16.1 Relationship between average lengths of stay and readmission rates for patients with fractured neck of femur at 30 hospitals.
Each of the dots in the graph represents a different hospital. The graph shows that there is a tendency towards those hospitals with longer average lengths of stays having lower readmission rates for their patients.
The Pearson correlation between these variables is −0.52, which indicates a moderately sized negative correlation between average length of stay and readmission rate for the 30 hospitals.
Evidence such as discussed above is being continually collected by health administrators and the results of these analyses impact on the funding of your workplace and your opportunities for looking after your patients.
Questions
Answers

Substituting into the equation, we find that: