CALCIUM, MAGNESIUM, AND PHOSPHORUS

JESSE P. GOFF

Adequate blood calcium (Ca), magnesium (Mg), and phosphorus (P) concentrations are vital to normal function of animals. Mechanisms for maintaining blood Ca, Mg, and P concentrations within normal limits perform efficiently most of the time. Occasionally, these homeostatic mechanisms fail, and metabolic diseases, such as milk fever, occur. Inadequate blood Ca, P, Mg, or potassium (K) concentrations (discussed later in chapter) can cause a cow to lose the ability to rise to her feet, as these minerals are necessary for nerve and muscle function. Less severe disturbances in blood concentrations of these minerals can cause reduced feed intake, poor ruminal and intestine motility, poor productivity, and increased susceptibility to other metabolic and infectious disease.

CALCIUM

Ca is the major mineral of bone. The skeleton of a 600-kg cow contains approximately 8.5 kg of Ca. Extracellular Ca is also essential to ensure transmission of nervous tissue impulses, excitation of skeletal and cardiac muscle contraction, and blood clotting and as a component of milk. Intracellular Ca, although 1/10,000 the concentration of extracellular Ca, is involved in the activity of a wide array of enzymes and serves as an important second messenger conveying information from the surface of the cell to the interior of the cell. Low extracellular Ca concentration causes hyperexcitability of the nervous system, causing muscle fasciculations or even tetany. At the neuromuscular junction, the amount of acetylcholine released during an endplate action potential is directly related to the amount of Ca that enters the terminal end of the motor neuron, which is in turn dependent on extracellular Ca concentration. Thus, hypocalcemia reduces the strength of muscle contraction, resulting in paresis. In many species (dog, cat, human, horse) the prevailing effects of hypocalcemia result in tetany. In the cow and sheep, hypocalcemia manifests as paresis, though it is important to point out that both effects of hypocalcemia are occurring at the same time and careful evaluation of a hypocalcemic animal will reveal both signs.

  Page 1370 

Calcium Homeostasis

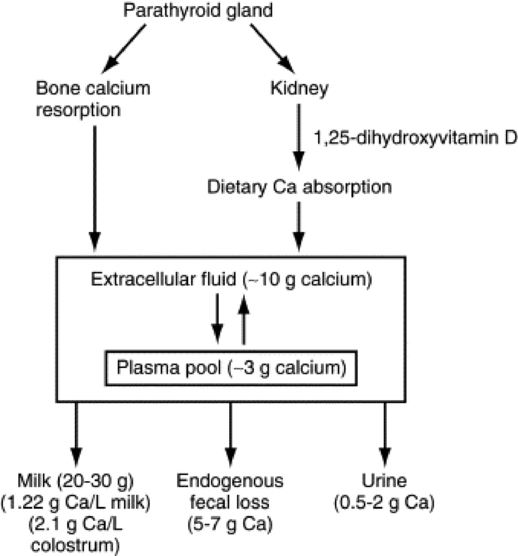
Blood Ca concentration in the adult cow or sheep is maintained at 8.5 to 10 mg/dL and is slightly higher in young animals (Fig. 41-18). There are approximately 3 g of Ca in the plasma pool of a 600-kg cow and 8 to 9 g in the extracellular pool. The Ca concentration in the blood is tightly regulated, primarily by the parathyroid gland, which responds to even a small decrease in Ca concentration by secreting PTH into the blood. PTH first will act on the kidney to increase renal tubular reabsorption of Ca from the glomerular filtrate. However, because only small amounts of Ca are lost in urine (<1 to 2 g/day in the cow), this action of PTH is sufficient to restore normal blood Ca concentration only if the total deficit is small. Larger Ca deficits cause prolonged secretion of PTH (hours to days), which stimulates osteoclastic resorption of bone Ca and stimulates renal production of 1,25-dihydroxyvitamin D. The 1,25-dihydroxyvitamin D stimulates the intestinal epithelial cells to produce Ca binding proteins and Ca pumps so that Ca within the lumen of the gut is efficiently transported across the intestinal epithelial cells into the blood. Should an animal be fed a Ca- or vitamin D—deficient diet, it will generally maintain normal blood Ca concentrations for weeks to months by resorbing bone Ca. However, this ultimately will cause bone disease such as osteoporosis and osteomalacia. An increase in blood Ca concentration above normal shuts off PTH and stimulates release of calcitonin from the thyroid gland C cells. This hormone increases renal clearance of Ca and decreases osteoclast activity so more Ca is retained in bone.

image

Fig. 41-18 Calcium (Ca) homeostatic response of the 600-kg cow in early lactation to a decline in blood calcium concentration at the onset of lactation.

ACUTE HYPOCALCEMIA (MILK FEVER) IN DAIRY COWS

Nearly half of all dairy cows will experience subclinical hypocalcemia (<7.5 mg/dL) within 24 hours of calving. Although this reduces ruminal and abomasal contractility and reduces feed intake, clinically these animals appear normal. Hypocalcemia also contributes to metritis, mastitis, and retained placenta by negatively affecting uterine and teat sphincter contractility and the immunity of the cow. With further reduction in blood Ca concentration the animals can appear ataxic, and some will be slightly bloated as eructation is reduced. Finally, in as many as 5% of U.S. cows, blood Ca will fall below 5 mg/dL, and in a few Ca will be as low as 2 mg/dL. These cows are recumbent and unable to rise and have a condition commonly referred to as milk fever or parturient paresis. They often lay with the neck out in an S-shaped curve, and close examination of muscles in the legs and neck will reveal fasciculation of some muscle groups. The heart muscle does not contract strongly, so on auscultation the heartbeat is muffled. The heart rate is generally increased to try to compensate for the low ventricular ejection volumes. The cow loses the ability to thermoregulate and takes on the ambient temperature of its surroundings. In most cases this causes the skin, especially skin of the ears, to be cold. However, in hot climates or when the cow is recumbent in the hot sun the body temperature may be elevated well above normal. Milk fever typically occurs within a day or two of calving—usually after but occasionally just before calving.

Acute hypocalcemia also occurs with many infectious conditions, such as mastitis or metritis, especially if endotoxins are elaborated. As a rule the blood Ca concentration is 6 to 8 mg/dL. This form of hypocalcemia is a result of redistribution of Ca within organs and will not be discussed further other than to note that not all hypocalcemic cows have the syndrome known as milk fever (Box 41-4).

Box 41-4 Primary Causes of Recumbency Initiating the?“Downer Cow Syndrome”

Mineral imbalances
image Hypocalcemia—plasma Ca <5 mg/dL
image Hypomagnesemia—plasma Mg <1.2 mg/dL
image Hypophosphatemia—plasma P <1.5 mg/dL
Severe toxemia—moderate reduction in plasma Ca, Mg, and P
Dystocia
Pregnancy toxemia syndrome—low plasma Ca, Mg, P, and glucose
Fractures
Coxofemoral luxation
Rupture of gastrocnemius muscle
Lymphosarcoma of spinal cord

Treatment of milk fever and hypocalcemia should be done as early as possible, especially if recumbency is present. The pressure exerted by the massive weight of the cow can cause a “crush syndrome” effect on the down side appendages in as little as 4 hours. This causes ischemia of the muscles and nerves and is followed by necrosis of these tissues, resulting in the “downer syndrome” cow.344 The fastest way to restore normal plasma Ca concentration is to administer an intravenous injection of Ca salts (commonly Ca borogluconate). In general, commercial preparations for intravenous use supply from 8.5 to 11.5 g of Ca per 500 mL. They may also contain sources of Mg, P (often as ineffective phosphite), and glucose. The most effective intravenous Ca dose is approximately 2 g of Ca per 100 kg of body weight. A good rule of thumb is to administer the Ca at a rate of 1 g/min. If Ca is administered too rapidly, fatal arrhythmia of the heart and cessation during systole can occur. Intravenous Ca treatments increase blood Ca above normal for approximately 4 hours. Ca salts can also be injected subcutaneously, but absorption is variable because blood flow to the periphery is often compromised. The amount of Ca that can be injected into a single subcutaneous site should be limited to 1 to 1.5 g of Ca (50 to 75 mL of most commercial preparations). Ca preparations designed for intramuscular administration are also available (Ca levulinate or Ca lactate). Most of these preparations must be limited to 0.5 to 1 g of Ca per injection site to avoid tissue necrosis. To get an effective dose of Ca into the clinically hypocalcemic animal might therefore require 6 to 10 injections into widely separated spots. Oral Ca treatments are not recommended as treatments for clinical milk fever cases, although they can be effective aids in prevention of milk fever.

  Page 1371 

HYPOCALCEMIA IN LATE-GESTATION BEEF COWS AND EWES

For beef cows and ewes, especially those carrying twins, meeting the sudden increase in fetal skeletal demand (8 to 10 g/fetal calf/day) for Ca often presents a greater challenge to Ca homeostasis than does lactation. Estrogen, which increases dramatically in late gestation, decreases osteoclast activity. This reduces the ability to use bone Ca reabsorption to meet fetal skeletal Ca demands. As a result, most primary hypocalcemic disorders of the beef cow and ewe occur in late gestation. They are usually prevented by increasing Ca and/or Mg in the gestation diet; provided the animal is eating. Often the syndrome in beef cows and ewes is complicated by inadequate energy intake and a state of inappetence associated with the pregnancy toxemia syndrome.

Etiology of Milk Fever

Dairy cows producing colostrum (containing 1.7 to 2.3 g of Ca per kilogram) or milk (containing 1.2 g of Ca per kilogram) typically secrete 20 to 30 g of Ca each day in early lactation. Put simply, hypocalcemia and milk fever occur when cattle do not obtain enough Ca from their bones and diet to replace Ca lost to milk. The long-accepted reason this occurs was that high dietary Ca fed to the cow before calving placed the cow in such a state of positive Ca balance that the parathyroid gland atrophied, rendering it too sluggish to adequately respond when onset of lactation placed the cow into negative Ca balance. However, in recent years it has been discovered that high dietary Ca does not have this effect, and in most cases PTH secretion is quite adequate in these animals.

Role of Metabolic Alkalosis

Metabolic alkalosis predisposes cows to milk fever and subclinical hypocalcemia by altering the conformation of the PTH receptor, rendering the tissues less sensitive to PTH (Fig. 41-19).345-347 Lack of PTH responsiveness by bone tissue prevents effective use of bone canaliculi fluid Ca (sometimes referred to as osteocytic osteolysis) and prevents activation of osteoclastic bone resorption. Failure of the kidneys to respond to PTH reduces renal reabsorption of Ca from the glomerular filtrate. More important, the kidneys fail to convert 25-hydroxyvitamin D to 1,25-dihydroxyvitamin D. Therefore enhanced intestinal absorption of dietary Ca, which normally would help restore blood Ca to normal, fails to be instituted.

image

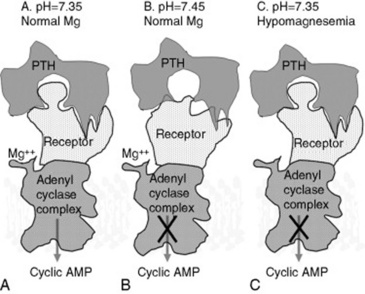
Fig. 41-19 Parathyroid hormone (PTH) effects at the surface of target bone and kidney cells. A, Under normal conditions, PTH released in response to hypocalcemia interacts with its receptor, located on the surface of bone and kidney cells, in a lock-and-key fashion. This stimulates G-proteins and adenylate cyclase (adenylate cyclase complex), resulting in production of cyclic adenosine monophosphate (AMP), which acts as a second messenger within the cytosol of target cells. This initiates mechanisms such as bone calcium (Ca) reabsorption and renal production of 1,25-dihydroxyvitamin D to restore blood Ca concentration to normal levels. B, Alkalotic conditions induced by high-potassium diets induce a change in the shape of the PTH receptor protein so that it is less able to recognize and bind PTH, resulting in failure to activate the cell by producing cyclic AMP. C, Magnesium is required for function of the adenylate cyclase complex. Hypomagnesemia reduces the ability of PTH-stimulated cells to produce cyclic AMP, resulting in failure to activate the cell.

Metabolic alkalosis of dairy cows is caused by high-potassium diets. This is best explained by Stewart’s348 strong ion difference theory of acid-base physiology, which states that the number of moles of positively charged particles (cations) in any given solution (including body fluids) must equal the number of moles of negatively charged particles (anions) in the solution. Put into extremely simplified terms, if positively charged particles are added to a solution, such as the plasma, the number of H+ cations will decrease and the number of OH anions will increase to maintain the electroneutrality of the solution (the solution becomes more alkaline). Conversely, adding anions to a solution causes an increase in H+ and a decline in OH to maintain electroneutrality, and the pH decreases (the solution becomes more acidic).

Cations and anions enter the blood from the digestive tract, making the cation-anion difference of the diet the ultimate determinant of blood pH. The major cations present in feeds and the charges they carry are sodium (+1), potassium (+1), Ca (+2), and Mg (+2). The major anions and their charges found in feeds are chloride (−1), sulfate (−2), and phosphate (assumed to be −3). Cations or anions present in the diet will alter the pH of the blood only if they are absorbed into the blood. The difference between the number of cation and anion particles absorbed from the diet determines the pH of the blood.

When formulating dairy cow late-gestation diets, the cation-anion difference of a diet is described in terms of mEq/kg or mEq/100 g of diet, using various equations involving Na, K, Ca, Mg, Cl, sulfur, and P, with and without adjustments for absorbability of each mineral in the diet:


image


The equations largely become an academic pursuit, as several of the variables in the formulas shown are somewhat fixed constants. A strategy I use is to set dietary Ca at 0.85% to 1% and dietary P and Mg at 0.4%. Dietary sulfur needs to be above 0.22% to ensure adequate substrate for ruminal microbial amino acid synthesis but below 0.4% to avoid possible neurologic problems associated with sulfur toxicity. The key to milk fever prevention is to keep sodium and potassium as close to the requirement of the cow as possible (0.1% for Na and 1% for potassium). The key to reduction of subclinical hypocalcemia is to then add chloride to the ration to counteract the effects of low levels of potassium on blood alkalinity. As a rule of thumb, the amount of dietary chloride needed to acidify the cow’s blood (and urine) is approximately 0.5% less than the concentration of K in the diet. For example, if dietary K can be reduced to only 2% of the diet, Cl would need to be roughly 1.5% to acidify the cow. This level of Cl in the diet is likely to cause a decrease in DMI. Chloride sources differ in their palatability, and because achieving low dietary K can be difficult, it is prudent to use a palatable source of Cl when formulating the diet. Ammonium chloride (or ammonium sulfate) can be particularly unpalatable when included in rations with a high pH. At the higher pH the ammonium cation is converted to ammonia, which is highly irritating when smelled by the cow. Prilling the Cl (and SO4) salts can reduce the unpleasant taste of the salts. In our experience, hydrochloric acid has proved the most palatable source of anions. Hydrochloric acid can be extremely dangerous to handle when it is procured as a liquid concentrate. Several companies now manufacture hydrochloric acid—based anion supplements that are safe to handle.

  Page 1372 

These are simply guidelines for anion supplementation that I use and are based on inclusion of Ca, Na, S, Mg, and P at the levels outlined previously. Urine pH of the cows provides a cheap and relatively accurate assessment of blood pH and can be a good gauge of the appropriate level of anion supplementation.349 Urine pH on high-cation diets is generally above 8.2. Limiting dietary cations will reduce urine pH only a small amount (pH 7.5 to 7.8). For optimal control of subclinical hypocalcemia the average pH of the urine of Holstein cows should be between 6.2 and 6.8, which essentially requires addition of anions to the ration. In Jersey cows the average urine pH of the close-up cows has to be reduced to between 5.8 and 6.3 for effective control of hypocalcemia. If the average urine pH is between 5.0 and 5.5, excessive anions have induced an uncompensated metabolic acidosis, and the cows will experience a decline in DMI. Urine pH can be checked 48 or more hours after a ration change. Urine samples should be free of feces and made on midstream collections to avoid alkalinity from vaginal secretions. Anion-supplemented diets are generally fed for the last 2 to 3 weeks before calving.

High Dietary Phosphorus

High blood P concentrations inhibit the activity of the renal 25-hydroxyvitamin D 1α-hydroxylase enzyme.350-351 As summarized by Jorgensen,352 the incidence of milk fever increases when dietary P exceeds 90 g/day and little negative effect of dietary P is seen when dietary P is less than 50 g/day. Cows need approximately 35 to 40 g of P each day.353

Use of Low-Calcium Prepartal Diets to Prevent Milk Fever

By feeding late-gestation cows a diet that supplies less Ca than they require, the cows can be placed into negative Ca balance. This causes a minor decline in blood Ca concentration, which stimulates PTH secretion, which in turn stimulates osteoclastic bone resorption and renal production of 1,25-dihydroxyvitamin D. This increases bone Ca release and prepares the intestine to absorb Ca efficiently, should it become available. At parturition, the lactational drain of Ca is more easily replaced because the cow’s bone osteoclasts are already active and in high numbers and the previous stimulation of enterocytes by 1,25-dihydroxyvitamin D allows efficient use of dietary Ca. Unfortunately, a truly low-Ca diet should supply considerably less than 20 g of absorbed Ca per day. This is difficult to actually achieve on most dairy farms, although increasing use of straw in prepartal diets and the use of Ca binders, such as zeolite or vegetable oils, may make this approach more practical.354

Physiologic Milk Fever Risk Factors

The incidence of milk fever rises as a cow ages, especially as she enters her third or greater lactation. As animals age the number of active bone cells is reduced. Heifers, which are still growing, rarely have problems with hypocalcemia. Lower numbers of active osteoblasts mean fewer cells to respond to PTH and mobilize bone Ca. In addition, as animals age the number of receptors for 1,25-dihydroxyvitamin D on target tissues declines.

The incidence of milk fever is higher in Jersey cows compared with Holstein cows. Although Jersey cow colostrum and milk Ca concentration tend to be higher than in Holsteins, this does not appear to be the only factor. Preliminary data from our laboratory suggest that the intestine of Jersey cows possesses approximately 15% fewer receptors for 1,25-dihydroxyvitamin D than does intestine of Holstein cows.

Preventing Milk Fever with Vitamin D

Earlier literature often recommended feeding or injecting massive doses (up to 10 million units) of vitamin D 10 to 14 days before calving to prevent milk fever. This will pharmacologically increase intestinal Ca absorption and can help prevent milk fever. Unfortunately, the dose of vitamin D that effectively prevents milk fever is very close to the level that causes irreversible metastatic calcification of soft tissues, and therefore this strategy cannot be recommended. Lower doses may actually induce milk fever because the high levels of 25(OH)D and 1,25-dihydroxyvitamin D induced by the treatment suppress PTH secretion and directly suppress renal synthesis of endogenous 1,25-dihydroxyvitamin D.355

Treatment with 1,25-dihydroxyvitamin D and its analogues can be much more effective, but problems with timing of administration, withdrawal from treatment, expense, and availability have made these treatments not practical.356,357

Hypomagnesemia as a Cause of Hypocalcemia

Hypomagnesemia affects Ca metabolism in two ways. Moderate hypomagnesemia (<1.6 mg/dL) interferes with PTH action on tissues. When PTH binds its receptor on bone or kidney tissues, it normally initiates activation of adenylate cyclase and phospholipase C, resulting in production of the second messengers, cyclic adenosine monophosphate (AMP) and inositol 1,4,5-triphosphate. Both adenylate cyclase and phospholipase C have an Mg++ binding site that must be occupied by an Mg ion for full activity.358 Hypomagnesemia, from inadequate absorption of dietary Mg, is the second most common cause of milk fever in cows around the time of calving and is the most common cause of midlactation milk fever in dairy cows. More severe hypomagnesemia (<1.2 mg/dL) can inhibit PTH secretion in response to hypocalcemia. This appears to be a factor in the development of some hypomagnesemic tetany syndromes of grazing beef and dairy cattle. In these syndromes blood Mg concentration falls slowly over time until such point that PTH function is impaired. It is at this point that blood Ca concentration declines precipitously and clinical symptoms, such as tetany, become apparent.359

  Page 1373 

Agronomic Considerations for Producing Low—Dietary Cation-Anion Difference Forages

Reducing K in the ration of the late-gestation cow can present a problem. By restricting K application to the soil, it is possible to avoid luxury consumption of K by legumes and cool season grasses. Producers should also be aware that forages take up Cl from the soil, and it is possible to find hays that are low in K and high (1% to 1.2%) in Cl. Producers should use the lowest DCAD forage possible, not simply the lowest K forage. Forages intended for the close-up dry cow should routinely be analyzed for both K and Cl by a wet chemistry method. Near infrared determinations of forage mineral content are not currently useful.

Oral Calcium Treatments at Calving

Ca is absorbed across the intestinal mucosa by two methods. The first method is by the active transport of Ca across intestinal cells—a process mediated by the hormone 1,25-dihydroxyvitamin D. The second method is by passive diffusion across the tight junctions that hold adjacent mucosal cells together. The concept behind oral Ca supplementation is that the cow’s ability to use active transport of Ca across intestinal cells is inadequate to help her maintain normal blood Ca concentrations. By giving the animal large amounts of very soluble Ca, it is possible to force Ca across the intestinal tract by means of passive diffusion between intestinal epithelial cells. Best results are obtained with doses of Ca between 50 and 125 g. For best control of hypocalcemia, a dose is given at calving and again 24 hours later. Administering 50 g of Ca from CaCl as a drench in 250 mL of water is roughly equivalent to administering 4 g of Ca intravenously.360 Unfortunately, hypocalcemic cows have poor swallowing and gag reflexes, making them vulnerable to aspiration pneumonia. Aspiration of Ca solutions leads to a severe pneumonia. Ca chloride has been used in oral Ca preparations but can be very caustic. Ca propionate is less injurious to tissues and has the added benefit of supplying propionate, a gluconeogenic precursor. Toxic doses of Ca can be delivered orally; approximately 250 g of Ca in a soluble form will kill some cows.

CHRONIC CALCIUM DEFICIENCIES

Nutritional Secondary Hyperparathyroidism

A deficiency of dietary Ca or vitamin D can reduce the amount of Ca that can be absorbed across the intestine into the extracellular fluids. Diets severely deficient in Ca will not supply adequate Ca to replenish Ca lost from extracellular pools. As a result, blood Ca concentration decreases and PTH secretion increases. PTH can act on the kidney to reduce urinary Ca loss and increase synthesis of 1,25-dihydroxyvitamin D to enhance intestinal Ca absorption efficiency. But if dietary Ca is very low, increasing the efficiency of intestinal Ca absorption cannot substantially increase the amount of Ca entering the extracellular pool of Ca. The only action of PTH that can improve blood Ca concentration in this situation is to enhance bone Ca resorption. The continued removal of bone without replacement results in fibrous osteodystrophy. The clinical signs of nutritional secondary hyperparathyroidism include hypertrophy of the parathyroid glands (although they rarely can be palpated) and cessation of growth in young animals. The lack of Ca available for mineralization of bone matrix causes the growth plates to be soft, weak, and swollen. The cortices of the long bones are thin, and minor or major fractures are common.

Vitamin D deficiency prevents the kidneys from being able to synthesize 1,25-dihydroxyvitamin D. Therefore unless dietary Ca is greatly elevated, the reduced efficiency of dietary Ca absorption will prevent adequate Ca from entering the extracellular fluids, and, again, PTH will activate bone resorption mechanisms to attempt to maintain normocalcemia.

Renal Secondary Hyperparathyroidism

Renal secondary hyperparathyroidism is a syndrome caused by renal failure and is occasionally observed in older animals. In cows, pyelonephritis can develop in late gestation through early lactation owing to poor urine flow and retrograde urine flow resulting in destruction of renal tissue. A major function of the kidneys in most species is to remove excess phosphate from the circulation. As renal function is lost, phosphate is retained and hyperphosphatemia develops. This occurs when the remaining amount of functional renal tissue is less than 25% of normal.

Hyperphosphatemia has two effects. The first effect is to reduce the ionized Ca content of the blood. This is because Ca and phosphate ions normally exist in blood at concentrations that are slightly below the levels that would cause saturation of the fluids resulting in precipitation of Ca phosphate salt from the solution. However the greatly elevated phosphate level in the blood of renal failure patients can exceed the equilibrium of Ca and phosphate in solution, causing precipitation of Ca from the blood. More important, as phosphate builds up in the blood it has a second effect on the remaining renal tissue. It blocks the activation of the 1α-hydroxylase that catalyzes conversion of 25-dyhydroxyvitamin D to 1,25-dyhydroxyvitamin D within the kidney. Therefore even though PTH should stimulate the remaining functional renal tissue to produce 1,25-dyhydroxyvitamin D, this action of PTH is blocked by hyperphosphatemia.

As renal function is lost, the amount of renal tissue available for production of 1,25-dyhydroxyvitamin D decreases, and blood concentrations of 1,25-dyhydroxyvitamin D decline. This reduces dietary Ca absorption and further depresses blood Ca concentration. This in turn stimulates increased PTH secretion, and reabsorbing bone Ca reserves again becomes a major means of maintaining normocalcemia. Fibrous osteodystrophy follows the prolonged secretion of PTH.

As bone Ca is reabsorbed, more P is also reabsorbed. However, the loss of renal function prevents PTH from having its usual phosphaturic effect, exacerbating the hyperphosphatemia. A vicious cycle of increasing blood P, increasing PTH, and increased bone resorption ensues. The loss of renal function can rarely be reversed.

Osteoporosis

Three forms of osteoporosis commonly occur. Of these, only lactational osteoporosis is a common syndrome of concern in animals. During lactation in virtually all species there is an obligatory loss of bone mass from the skeleton. In this case the osteoclasts within a bone resorption unit reabsorb bone to a 50-micron depth if dietary Ca is adequate, or to greater depths if the animal is in severe negative Ca balance. However, osteoblast movement into the resorption cavity is transiently inhibited, and no new bone is deposited. This occurs to some extent in all females shortly after parturition, even when they are in positive Ca balance. However, the degree and duration can be magnified greatly by negative Ca balance. Once the animal has undergone the obligatory period of lactational osteoporotic bone loss (4 to 5 weeks in the cow), if the animal is in positive Ca balance the osteoblasts migrate to the resorption cavity and replace the lost bone. Lactational osteoporosis can help the female meet the Ca demands of lactation by uncoupling bone formation from bone resorption. In high-producing dairy cows, dietary Ca intake is inadequate to meet lactational Ca demands for the first 4 to 6 weeks of lactation. These animals can lose as much as 13% of their skeletal mass during this period, which is replaced in later lactation when dietary Ca intake allows the cow to enter a period of positive Ca balance.

  Page 1374 

MAGNESIUM

Mg is a major intracellular cation serving as a cofactor for enzymatic reactions vital to every major metabolic pathway. Extracellular Mg is vital to normal nerve conduction, muscle function, and bone mineral formation. In a 600-kg cow there is approximately 0.84 g of Mg in the blood, 3 g of Mg in the extracellular fluids, 84 g of Mg inside cells, and 210 g of Mg within bone mineral. Bone is not a significant source of Mg that can be used in times of Mg deficit, as bone reabsorption occurs in response to Ca homeostasis, not Mg status. Maintenance of normal plasma Mg concentration is nearly totally dependent on continuous dietary Mg absorption.

Hypomagnesemia

Hypomagnesemia generally leads to hyperexcitability, tetany, convulsion, and, too often, sudden death. Hypomagnesemia is often accompanied by and complicated by hypocalcemia. Hypomagnesemia is a common problem in ruminants.

Normal plasma Mg concentration is 1.8 to 2.4 mg/dL in cows and 2.2 to 2.8 mg/dL in sheep. The kidneys play a key role in maintaining Mg homeostasis under conditions of hypermagnesemia when they fail to reabsorb Mg from glomerular filtrate, increasing renal Mg excretion to lower blood Mg concentration. The renal threshold for Mg (plasma concentration at which all Mg filtered across the glomerulus is reabsorbed) is 1.8 mg/dL in the cow and 2.2 mg/dL in sheep. Plasma Mg concentrations below these levels indicate that dietary Mg absorption is not sufficient and little or no Mg will be detected in urine.

Moderate hypomagnesemia (1.1 to 1.8 mg/dL) is associated with reduced feed intake, nervousness, and reduced milk fat and total milk production. This can be a chronic problem in some dairy herds that often goes unnoticed. It can also predispose these animals to milk fever as described earlier.

Role of the Rumen in Hypomagnesemia

Mg is well absorbed from the small intestine of young calves and lambs. As the rumen and reticulum develop, these sites become the main, and perhaps the only, sites for net Mg absorption.361 In adult ruminants the small intestine is a site of net secretion of Mg. Mg absorption from the rumen is dependent on the concentration of Mg in solution in the ruminal fluid and the integrity of the Mg transport mechanism, which is an Na-linked active transport process.362

The soluble concentration of Mg in ruminal fluid can be low for several reasons. Chief among these are low Mg content of forages and inadequate dietary supplementation. Mg solubility also declines sharply as ruminal pH rises above 6.5. Grazing animals tend to have higher ruminal pH because of the stimulation of salivary buffer secretion. When high-grain rations are fed, ruminal fluid pH is often below pH 6.5, increasing Mg solubility and thus availability. Forages can also contain organic compounds, such as unsaturated fatty acids, which are converted to tricarballylate, which can form insoluble Mg salts in the rumen.

High dietary K can reduce the rumen’s ability to absorb Mg. High K concentration in the ruminal fluid depolarizes the apical membrane of the ruminal epithelium, reducing the electromotive potential needed to drive Mg across the ruminal wall.362 Feeding ionophores (monensin, lasalocid) can improve activity of the Na-linked Mg transport system in the rumen, increasing Mg absorption efficiency approximately 10%.363 Lush high-moisture pastures increase the rate of passage of material, including Mg, from the rumen so that Mg may leave the rumen before it can be absorbed.

Occurrence of Hypomagnesemic Tetany

Hypomagnesemic tetany occurs most often in beef cows, dairy cows, and ewes in early lactation grazing lush pastures high in potassium and nitrogen and low in Mg and Na. This is often referred to as grass tetany, spring tetany, grass staggers, or lactation tetany. Mg deficiency occurs most often in spring or fall when pastures are growing at maximal rates and is most common in grazing lactating ruminants, as milk production removes 0.15 g of Mg from the blood for each liter of milk produced. Cool weather seems to play a factor as well, probably through its effects on plant Mg uptake, although there is some indication that the physiologic response of the cow to cool weather affects Mg status directly.

When plasma Mg levels fall below 1.1 mg/dL, twitching is sometimes seen in the muscles of the face, shoulder, and flank. As hypomagnesemia progresses, tetanic spasms of the muscles become more common, eventually causing the cow or ewe to stagger and fall. Clonic convulsions quickly follow, with chomping of the jaws and frothy salivation. Affected animals lay with the head arched back and the legs paddling. The heart rate can approach 150 beats/min, and the heartbeat is often audible without a stethoscope. Respiratory rate approaches 60 breaths/min, and rectal temperature can approach 40.5° C (105° F) as a result of the excessive muscular activity. The eyelids flutter, and there is usually marked nystagmus. Animals may get up after several minutes and repeat these convulsive episodes several times before they finally die. Hypomagnesemic tetany in calves is clinically similar to that in adults and is often accompanied by moderate hypocalcemia.

Ewes are generally hypocalcemic and hypomagnesemic. Affected ewes are usually in the second to fourth week of lactation and are usually suckling more than one lamb. Affected ewes are generally depressed, stand with their heads down, and are reluctant to move. As hypomagnesemia and hypocalcemia progress, the animals develop tetany and clonic convulsions just as in cattle. The clinical signs in goats are similar to those observed in cattle.

Cerebrospinal fluid (CSF) Mg concentrations below 1 mg/dL are responsible for the clonic convulsions seen in animals with hypomagnesemic tetany. Blood samples obtained during or shortly after an episode of tetany may have near-normal levels of Mg as a result of muscle damage and leakage of Mg from intracellular pools. CSF Mg concentration will remain low during tetany and also can be a reliable indicator of Mg status for up to 12 hours after death. Vitreous humor Mg concentrations below 1 mg/dL are also found in animals with tetany and can be a reliable indicator for 24 to 48 hours after death, provided that environmental temperatures have not exceeded 23° C.364 Aqueous humor has not proved a reliable sample.

  Page 1375 

Treatment of Hypomagnesemia

Animals exhibiting hypomagnesemic tetany need immediate treatment. This will require administering 1.5 to 2.25 g of Mg intravenously in the adult cow. Most of the commercially available intravenous solutions used to treat milk fever supply 1.5 to 4 g of Mg, usually as the chloride, borogluconate, or hypophosphite salts of Mg. Response to therapy can be disappointing, and success is related to the interval between onset of tetany and treatment. Cows should not be stimulated to rise for at least 30 minutes after treatment, to avoid initiating tetany and convulsions. Cattle that recover do so approximately an hour after treatment, which is the time it takes CSF Mg concentration to return to normal. Many of these cows will relapse and require further treatment within 12 hours.

The rate of relapse can be reduced using orally administered Mg salts once the animal has regained good swallowing reflexes (to avoid aspiration pneumonia). Administering a slurry of 100 g of Mg oxide in water intraruminally or by drenching can be effective. This provides approximately 50 g of Mg to the animal. Adding 50 g of Ca carbonate, 100 g of dicalcium phosphate, and 50 g of sodium chloride may enhance the effectiveness of the slurry, especially if hypocalcemia and hypophosphatemia accompany the hypomagnesemia. Alternatively, 200 to 400 mL of a 50% Mg sulfate solution can be administered by drench. Mg sulfate is more available for absorption than Mg oxide. If hypomagnesemic tetany has occurred in one cow or ewe in a herd or flock, steps should be taken immediately to increase Mg intake in other members of the herd to prevent further losses. Administering an additional 10 to 15 g of Mg per pregnant cow, 20 g of Mg per lactating beef cow, and 30 g of Mg per lactating dairy cow daily, usually in a grain mix, will often prevent further hypomagnesemic tetany cases. Ewes and does can be treated with ⅛ of these formulas. The problem with prevention is ensuring the extra Mg gets into the animal, especially when working with animals at pasture.

Prevention

USING OTHER TRANSPORT MECHANISMS TO ABSORB DIETARY MAGNESIUM

The active transport mechanism for Mg absorption across the ruminal wall is critical to the survival of the animal when dietary Mg concentration is less than 0.25%. Unfortunately there are several known factors, such as dietary K, and several unknown factors that prevent this pathway from functioning well. A second pathway for absorption of Mg exists and operates only at high ruminal fluid Mg concentrations. At high ruminal Mg concentration the Mg will flow down its concentration gradient into the extracellular fluids of the cow. This passive transport mechanism is not subject to inhibition by K and is subject only to the concentration of Mg in solution in the rumen.362

The concentration of Mg in ruminal fluid required to use concentration gradient—driven absorption of Mg is at least 4 mMol/L. The minimum level of Mg required in the diet to use this pathway in order to prevent negative Mg balance in the face of high K levels in ruminants is approximately 0.35%.365 Mg content of the close-up dry cow ration and the early lactation ration should be between 0.35% and 0.4% as insurance against the possibility that the active transport processes for Mg absorption are impaired.

ASSESSING MAGNESIUM STATUS AT PARTURITION

PTH causes increased renal tubular reabsorption of Mg. The kidneys excrete less Mg, increasing blood Mg in the typical milk fever cow. However, if dietary Mg is insufficient or ruminal absorption of Mg is impaired, the blood Mg concentration will be below the normal renal threshold for Mg (1.85 mg/dL in cattle) and almost no Mg will appear in the urine. The animal should be considered abnormal for Mg. Sampling the blood of several cows within 12 hours of calving is a simple, effective index of Mg status of the periparturient cows. If serum Mg concentration is not at least 2 mg/dL in 9 of 10 cows sampled, it suggests inadequate dietary Mg absorption from either lack of dietary Mg or interferences with absorption. This same test can be used in the first weeks of lactation to see if the lactating cow diet is providing adequate Mg to the animal. This can be important, as hypomagnesemia may limit productivity of lactating cows as well as contributing to hypocalcemia in the herd.

PHOSPHORUS

Traditionally, phosphorus in clinical medicine is abbreviated as P, although it should be understood by the reader that the biologically relevant form of phosphorus is actually inorganic phosphate, not elemental phosphorus. P is a component of phospholipids, phosphoproteins, nucleic acids, and energy-transferring molecules such as ATP. P is an essential component of the acid-base buffer system. It is second only to Ca as a major component of bone mineral, with the skeleton of a 600-kg cow containing approximately 3.9 kg of P.

Phosphorus Homeostasis

Plasma P concentration is normally 4 to 8 mg/dL. Approximately 1 to 2 g of P are present in the plasma inorganic P pool, and 4 to 7 g of P in the extracellular P pool, of a 500-kg cow. Intracellular P concentration is approximately 78 mg/dL, and total body intracellular P content is approximately 155 g, with 5 to 6 g located within erythrocytes. Maintaining the extracellular P pool involves replacing P removed for bone and muscle growth, endogenous fecal loss, urinary P loss, and milk production with P absorbed from the diet or reabsorbed from bone. During late gestation, fetal skeletal development can withdraw up to 10 g of P per day from the maternal P pools. Approximately 0.3 g of P is incorporated into each kilogram of body tissue (muscle) gained during growth of the animal. Production of milk removes from the extracellular pool approximately 0.9 g of P per kilogram of milk produced. Salivary secretions remove between 30 and 90 g of P from the extracellular P pool each day.353 Factors affecting salivary phosphate secretion include the time spent ruminating (chewing activity) and the PTH status of the animal. PTH stimulates parotid salivary P secretion and can increase salivary phosphate concentrations twofold to threefold.366 Salivary phosphate secretions help buffer the rumen and supply ruminal microbes with a readily available source of P necessary for cellulose digestion. Most of the salivary phosphate secreted is recovered by intestinal absorption. However, even on low-P diets, a minimum of 5 g of secreted P per day is not recovered and is lost to feces. Urinary P loss is usually between 2 and 12 g/day. Bones of a 600-kg cow contain approximately 4 kg of P, some of which can be withdrawn and returned to the blood during osteoclastic resorption of bone.

  Page 1376 

Ruminal microbes are able to digest phytic acid, so most of the phytate-bound P, the form of up to 70% of P in plants, is available for absorption in ruminants. P is primarily absorbed in the small intestine via an active transport process that is responsive to 1,25-dihydroxyvitamin D. Intestinal P absorption efficiency can, in theory, be upregulated during periods of P deficiency, as renal production of 1,25-dihydroxyvitamin D can be directly stimulated by very low plasma P. However, the plasma P level must reach very low levels (<1 to 2 mg/dL) to stimulate increased renal production of 1,25-dihydroxyvitamin D. Plasma P concentrations are generally well correlated with dietary P absorption. P absorbed in excess of needs is excreted in urine and saliva.

PTH, secreted during periods of Ca stress, increases renal and salivary excretion of P, which can be detrimental to maintenance of normal blood P concentrations. This is one reason that hypocalcemic animals tend to become hypophosphatemic. PTH could conceivably increase blood P concentration because it stimulates bone mineral resorption. Also, because PTH stimulates the kidney to produce 1,25-dihydroxyvitamin D, it can increase the efficiency of intestinal phosphate absorption. However, it must be remembered that PTH is secreted primarily in response to hypocalcemia, not hypophosphatemia.

Hypophosphatemia, Pregnancy Toxemia, and Downer Cows

Beef cows and ewes fed a diet marginal in P will have a chronic hypophosphatemia of 2 to 3.5 mg/dL. In late gestation, plasma P can decline precipitously as the growth of the fetus accelerates and removes substantial amounts of P from the maternal circulation. These animals often become recumbent and are unable to rise, though they appear fairly alert and will often eat feed placed in front of them. Cows and ewes carrying twins are most often affected. Plasma P concentration in these recumbent animals is often less than 1 mg/dL. The disease is often referred to as pregnancy toxemia and is usually complicated by concurrent hypocalcemia, hypomagnesemia, and in some cases hypoglycemia. Diets that are marginal in P are generally indicative of diets that are marginal in energy, because grains are usually very good sources of P.

At the onset of lactation in the dairy cow, the production of colostrum and milk draws large amounts of P out of the extracellular P pools. This alone often causes an acute decline in plasma P levels. In addition, if the animal is also developing hypocalcemia, PTH will be secreted in large amounts, increasing urinary and salivary loss of P. In dairy cows, plasma P concentrations routinely fall below the normal range at parturition, and in cows with milk fever plasma P concentrations are often 1 to 2 mg/dL. Plasma P concentrations usually increase rapidly after treatment of the hypocalcemic cow with intravenous Ca solutions. This rapid recovery is caused by reduction in PTH secretion, which reduces urinary and salivary loss of P. Administration of Ca generally causes resumption of gastrointestinal motility, which allows absorption of dietary P and reabsorption of salivary P secretions that were sequestered within the rumen.

Some dairy cows that develop acute hypophosphatemia do not spontaneously recover normal plasma P concentration. This is sometimes the case in cows that are classified as downer cows. This syndrome often begins as milk fever, but unlike the typical milk fever cow, in these cows the plasma P remains low (<1 mg/dL) despite successful treatment of the hypocalcemia. Protracted hypophosphatemia in these cows appears to be an important factor in the inability of these animals to rise to their feet, but why plasma P remains low is unclear. In some cases the inability to absorb the salivary phosphate is secondary to poor ruminal motility, but not in all cases. Excessive cortisol secretion could also drive blood P concentration down, probably by forcing extracellular P inside cells. Treatment of cows with phosphate-containing solutions can effect a recovery in some animals. For oral treatment, the dose is 50 g of P supplied in a 200-g monosodium phosphate drench. Intravenous treatment consists of 6 g of P supplied by 23 g of monosodium phosphate dissolved in 1 L of saline. Oral treatment restores normal blood Pa a little more slowly than intravenous treatment, but the effect lasts much longer.367 If depletion of intracellular P stores is also involved in the downer syndrome, it seems likely that intravenous treatment alone simply does not supply enough P to replenish intracellular stores of P.

The hypophosphatemic downer cow syndrome does not appear to be caused by low P diets, as affected cows are often receiving diets containing 0.4% dietary P. The best preventative measure seems to be to avoid development of hypocalcemia.

Chronic Phosphorus Deficiency

P deficiency is fairly common in grazing ruminants. Plant growth in arid climates or on tropical soils is often limited by poor soil P content or availability. Although P content of the immature plant may be suitable (0.3% P on a DM basis) the mature dry plants often contain less than 0.15% P, which can lead to P deficiency in ruminants forced to subsist on these forages. With the exception of rickets and postparturient hemoglobinuria, the clinical problems associated with P deficiency are general and nonspecific. They can include an unthrifty appearance, reduced feed intake, pica, reduced rate of gain, and reduced milk production.

OCCURRENCE

The most common of the P deficiency syndromes is the unthrifty cow that grows slowly, milks poorly, and is infertile. In arid areas of the world with inferior soil quality, infertility and poor growth resulting from inadequate P intake affects nearly all animals. Beef animals grown in these areas may routinely require 3 or more years to reach market weight. Brood cows often calve only every other year. In more temperate areas, P deficiency can develop in animals grazing overly mature forages or crop residues, such as corn stalks. Cows subsisting on forages that are low in digestibility are at risk for developing P deficiency unless supplemented. Increasing awareness of the environmental problems associated with P content of animal wastes and increasing expense of P supplements may encourage producers to feed diets marginally sufficient in P.

Sheep can, in some instances, be successfully raised on pasture that has been associated with P deficiency in cattle, suggesting that sheep are slightly more resistant to P deficiency syndromes than are cattle. This may simply reflect the higher intake per kilogram of body weight of sheep and their habit of selecting the less mature plants, which are generally higher in P.

Rickets and Osteomalacia

Rickets is a disease of young, growing animals in which the cartilaginous matrix at the growth plate and the osteoid matrix formed during bone remodeling fail to mineralize. In adults (no active growth plates), the term osteomalacia is used to describe the failure of osteoid matrix to mineralize. Ca and phosphate ions come together in a ratio of 10 Ca ions to 6 phosphate ions at the point of mineralization of the bone cartilage or osteoid matrix. Bone ash content varies somewhat with the bone examined but is generally 57% to 62% of bone dry weight, with 36% Ca and 17% P in adult animals. Failure to supply P in the diet will result in low plasma P concentrations that will not support the mineralization process, and the bone matrices will fail to mineralize. Bone ash, as well as total P and Ca content, will be below normal.

  Page 1377 

Low plasma Ca concentrations (arising from vitamin D deficiency or severe Ca deficiency) can also result in failure to mineralize bone matrices. Bone ash is reduced, and the bones of young animals become “rubbery,” bending without breaking. Joint surfaces are often eroded, contributing to lameness in affected animals.

In principle, Ca deficiency differs from P deficiency in that normal osteoid is formed but fails to mineralize in P deficiency, whereas in Ca deficiency the normal osteoid is either not formed at all (osteoporosis) or replaced by fibrous tissue. In vitamin D deficiency it is common to see mixed lesions (osteomalacia, osteoporosis, and fibrous osteodystrophy) all in the same bone. Vitamin D deficiency also seems to reduce secretion of type X collagen by the chondrocytes within the growth plate and somehow prevents the programmed cell death of chondrocytes within the zone of provisional calcification, a requirement for bone formation.

Chronic Moderate Hypophosphatemia

Animals fed diets containing less P than necessary to meet physiologic needs will develop hypophosphatemia and all the physiologic consequences of failure to grow, inappetence, and unthriftiness. Milk production, but not P content, will decline. Impaired reproduction has often been attributed to “P deficiency.” However, in most cases in which cows develop P deficiency the situation is complicated by concurrent energy deficiency, likely the direct cause of the reproductive failure.

Unfortunately the belief that “marginal” dietary P contributes to reproductive inefficiency has been used as justification for feeding diets that are much higher in P than is required. Wu and Satter368 present convincing evidence that high-producing cows perform well in terms of milk production and fertility when fed diets containing 0.37% to 0.40% P.

Postparturient Hemoglobinuria

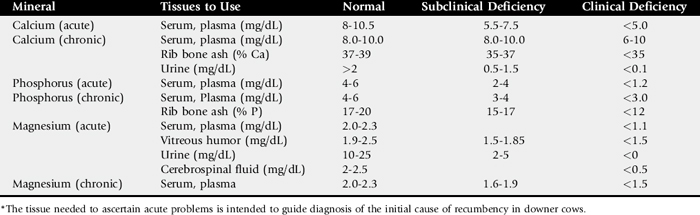
Intravascular hemolysis, anemia, and hemoglobinuria are occasionally reported during the first 6 weeks of lactation. Cows that have been treated for ketosis seem at greater risk for developing postparturient hemoglobinuria. Many, but not all, cows that develop this syndrome are hypophosphatemic. Severe hypophosphatemia is postulated to depress the ability of erythrocytes to produce ATP> Glyceraldehyde-3-phosphate dehydrogenase, a key enzyme in glycolysis, requires inorganic phosphate as a cofactor. Without sufficient ATP to power sodium pumps, the intracellular sodium concentration rises, the cells become more rigid, and as a result they rupture as they pass through the capillary beds. However, hypophosphatemia alone is rarely sufficient for increased red blood cell fragility. Often these cows are on diets that are also deficient in selenium, copper, and energy. In light of these observations, it is likely naive to suggest that the cause of postparturient hemolysis is hypophosphatemia alone (Table 41-9).

Table 41-9 Diagnosing Acute and Chronic Macromineral Insufficiency or Imbalance in Ruminants*

image

HYPOKALEMIA SYNDROME IN CATTLE

NICOLAS SATTLER

Based on reports available in the literature, hypokalemia syndrome in cattle can be defined as presence of flaccid paralysis, recumbency, abnormal neck position, and serum potassium concentration below 2.5 mmol/L.

Occurrence

Hypokalemia is a frequent biochemical finding in cows presented with anorexia and gastrointestinal stasis.369 It is often mild (>3 mmol/L) and not associated with obvious clinical signs in ruminants. Hypokalemia syndrome is a rare clinical condition reported in a total of 25 animals in three studies.370-372 Lactating dairy cows appear to be at a higher risk, but the syndrome has also been described in calves and heifers.

History

Lactating dairy cows less than 60 days in milk (DIM) constitute the majority of cases in the literature. Any disease causing significant anorexia for 1 week or more, particularly infectious disease, is a risk factor.371 Repeated administration of isoflupredone acetate is reported in most cases, for treatment of either acetonemia in lactating cows370 or infectious respiratory disease in calves and heifers.371 In one case, repeated off-label intramammary administration of isoflupredone acetate preceded hypokalemia syndrome. Multiple doses of dextrose and insulin are also reported to be risk factors.370 Intravenous fluid administration for 2 days or longer without serum biochemistry followup has been documented in two cases of calves with severe neonatal diarrhea.

  Page 1378 

In most cases recumbency caused by hypokalemia syndrome was not the initial event but rather occurred during the evolution of another disease such as acetonemia or infectious disease. Moreover, recumbency was not always the presenting complaint.371 Some animals first manifested anorexia, reduced fecal output, kyphosis, and reluctance to move. However, evolution to severe paresis and decubitus occurred rapidly in all these cases.

Clinical Signs

In the early stages of the syndrome, absence of feces, paretic gait, kyphosis, inability to stand for a long time, and tachycardia are observed. Sometimes an abnormal neck posture is evident before recumbency. The typical case presentation of hypokalemia syndrome includes decubitus, S-shaped neck, abnormal feces and ruminal motility, abnormal appetite, and tachycardia with or without arrhythmia. Decubitus is a result of flaccid paralysis: the tail has little to no tonus and is held in an abnormal position, resistance to all manipulations is weak, and the cow is unable to raise her head. It is not rare to observe that the animal eats and drinks willingly if food and water are provided near the mouth. Abnormal appetite therefore may be partly caused by an inability to move the head to reach food and water. The neck is carried in an S-shaped and twisted fashion that differs from that of the hypocalcemic cow. The neck is never fixed in this abnormal position. When moved there is no resistance, and if the head is placed in an anatomically correct position there is an odd feeling of luxation. As soon as the head is not held, the neck resumes the abnormal S-shaped position, deviating to either direction. This neck posture may precede decubitus and persist after decubitus has resolved. Cardiac arrhythmias (Fig. 41-20) also accompany hypokalemia syndrome and may be ventricular (ventricular tachycardia, accelerated escape ventricular rhythm) or supraventricular (atrial fibrillation) in origin.

image

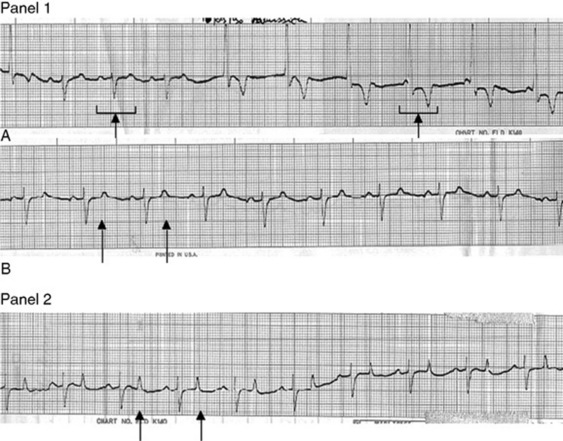
Fig. 41-20 Electrocardiograms. Panel 1, Electrocardiograms of a cow with hypokalemia syndrome before treatment (base-apex, 25 mm/sec, 1 cm = 1 mV). Potassium serum concentration was 2 mmol/L. A, Note the ventricular escape rhythm: normal heartbeat and more than five ventricular QRS complexes. B, Note the flattened T waves and increased intervals. Panel 2, Electrocardiogram of a cow with hypokalemia syndrome after treatment (base-apex, 25 mm/sec, 1 cm = 1 mV). Potassium serum concentration was 4 mmol/L. Note the normal T waves and intervals.

Hypokalemia syndrome is most often the consequence of a concomitant disease or treatments administered. Fever and acetonemia are the most frequently associated problems. The identification of the concomitant disease(s) is essential for accurate prognosis and treatment.

Etiology

Hypokalemia may result from an imbalance of the internal or external potassium balance or both (Fig. 41-21).369,370,373-376 Internal potassium balance is determined by exchanges between extracellular and intracellular compartments, whereas external balance is a result of systemic intake and losses. Currently, except for cases with documented repeated isoflupredone acetate administrations, the exact determinants causing hypokalemia syndrome in cows are not known.

image

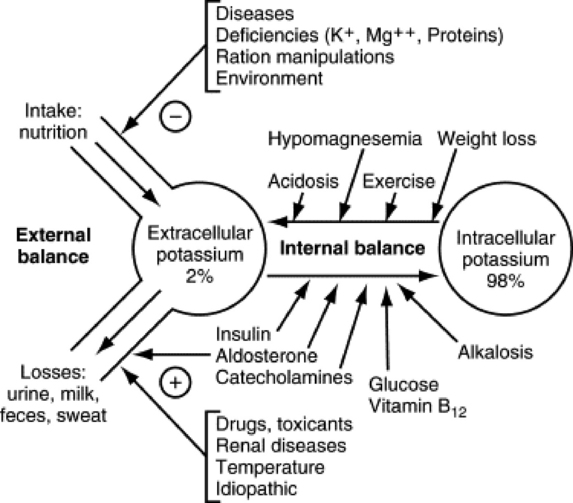
Fig. 41-21 Potassium balances and major determinants in cattle.

Adapted from Brobst D: J Am Vet Med Assoc 188:1019, 1986.

  Page 1379 

At present, because of the limited data available, it is not possible to determine if hypokalemia syndrome cases are mainly a result of potassium depletion, internal imbalance, or both. The prolonged inappetence observed before hypokalemia, along with the amount and duration of potassium needed for treatment, suggests potassium depletion is significant. Serum potassium concentration is a poor indicator of the potassium status of the organism because 98% of whole body potassium is located in the intracellular compartment.374,377 Determination of intracellular potassium concentration in erythrocytes or muscle cells could be a more accurate way to assess potassium depletion.377,378 At present these data are not available for hypokalemia syndrome cases.

As a result of the potent mineralocorticoid activity of isoflupredone acetate, cases associated with its administration show both internal and external potassium balance abnormalities (see Fig. 41-21).376 Repeated doses can reduce blood potassium concentration by 70%.379 In a small experimental study (N = 9), we were able to reproduce the syndrome by combining food restriction and multiple doses of isoflupredone acetate in lactating dairy cows.380 The use of this steroid could also complicate the treatment of the hypokalemia syndrome by increasing the renal losses of potassium. Based on current knowledge, use of isoflupredone acetate in the anorectic, acetonemic cow that has received dextrose, with or without insulin, should be restricted to one administration at the labeled dosage. Hypokalemia syndrome has also been reported with dexamethasone administration, although it is a less potent mineralocorticoid.372

In noniatrogenic cases the relationship between protracted disease and severe hypokalemia may be explained by a decrease in potassium intake (anorexia) with increased release of catecholamines caused by stress (see Fig. 41-21). Alternatively, renal potassium adaptation381 may be responsible for the potassium loss. Animals chronically fed a high-potassium diet are able to survive the high potassium load due to increased renal losses. These increased losses persist when potassium intake is suddenly reduced. Renal adaptation (reduction of urinary potassium excretion) takes 24 to 48 hours to occur, thus creating a potassium depletion.381 Because of a forage-based diet, lactating dairy cows may eat more than 10 times their daily potassium requirement, causing high urinary potassium excretion.371 Therefore these cows appear to be at risk for potassium depletion because of delayed renal adaptation when potassium intake is abruptly reduced. This model cannot explain why some cows develop the syndrome when exposed to these conditions but others do not.

Other factors known to promote significant hypokalemia have not been documented in cows with hypokalemia syndrome, such as anomaly of the aldosterone system, diuretic (particularly furosemide) abuse, nephropathy (proximal or distal tubular renal acidosis), or severe diarrhea. Diarrhea with protracted reduced potassium intake, increased losses, and internal potassium imbalance resulting from acidosis has been associated with hypokalemia syndrome in calves.371 Error in fluid administration causing increased urinary losses of potassium along with return to a normal internal potassium balance can further exacerbate hypokalemia in diarrheic calves.

Pathophysiology

Potassium is the most important intracellular cation.382 The gradient between the potassium concentrations of the intracellular and extracellular compartments is the determinant of the resting cellular membrane potential and plays a role in the formation and transmission of action potentials.383 Therefore, clinical signs reported in cattle and other species with severe hypokalemia are multisystemic. Moreover, structural consequences in the myocardium373 and the muscle cells have been reported in cattle.370,371

Dysrhythmia and electrocardiographic changes were present in 50% of cases in one study.371 The arrhythmogenic electrical activity changes implicated in hypokalemia include the following: hyperpolarization of the cardiac cell resulting in spontaneous automatic activity, slow conduction caused by increased difference between resting membrane potential and threshold potential, increased action potential duration as a result of slow repolarization, depressed fast responses because of higher membrane potential when a slow repolarizing cell is stimulated, slow responses in fibers normally exhibiting fast responses, and conduction block.384 These electrical events alone or in combination with structural changes such as necrosis can induce the atrial and ventricular arrhythmia observed.

Pathophysiology of cardiac and muscle necrosis caused by potassium depletion includes (1) ischemia caused by lack of vasodilatation during muscle cell contraction, resulting from absence of potassium release into the extracellular space, and (2) glycogen deficiency resulting from impaired glycogen synthesis.376,385 Muscle lesions compatible with hypokalemic myopathy have not been consistently documented.370-372 It is presently not known if the presence of hypokalemic myopathy is necessary to the occurrence of the clinical signs observed in the bovine syndrome or if it is a prognostic determinant.370,371

Diagnosis and Ancillary Test Results

Initial presentation of hypokalemia syndrome (intestinal ileus, abnormal gait) could mimic an intestinal syndrome. History may allow distinction between these conditions. Hypokalemic syndrome often follows or is concomitant with a long disease, in contrast with the usual acute evolution of an intestinal syndrome. According to the results of a small experimental study,380 potassium fractional urinary excretion (FEK) could be a useful tool in the medical management of a cow suspected to be developing bovine hypokalemia syndrome. In this study, FEK was abnormally high in the presence of severe hypokalemia 12 to 24 hours before manifestation of clinical signs.

According to our experience the clinical signs of a twisted, S-shaped neck associated with flaccid paralysis as described earlier are almost pathognomonic. Other conditions that could be included in the differential diagnosis are hypocalcemia, botulism, tick paralysis, and myelopathy (cervical spinal trauma, cervical osteomyelitis). Conditions like listeriosis, vertebral malformations, luxations, fractures, and torticollis can be associated with abnormal neck position but not flaccid paralysis and absence of pain during manipulations. Hypokalemia syndrome, even if rare, should be included in the differential diagnosis of hypocalcemia, particularly when response to calcium administration is not normal.

Confirmation of the clinical diagnosis requires serum biochemical analysis. To date, all published cases of bovine hypokalemia syndrome have been associated with serum K+ concentrations less than 2.5 mmol/L. Aside from hypokalemia, moderately elevated AST and creatine kinase (CK) activity (median value of 171 and 1564 IU/L respectively371), severe metabolic hypochloremic alkalosis (median value [TCO2] = 41.5 mmol/L, [Cl] = 86.9 mmol/L371), and mild hyperglycemia (median [glucose] = 6.05 mmol/L371) are observed in the majority of published cases.

  Page 1380 

Lumbar muscle biopsy (between L2 and L5) is a way to differentiate primary hypokalemic myopathy from secondary myopathy caused by decubitus. Determination of the serum creatine kinase MB isoenzyme (CK-MB) activity could help to detect myocardium damages. Detection of myopathy in epaxial muscles and/or myocardium at necropsy is not diagnostic if potassium depletion or hypokalemia is not documented.

Some authors have suggested that electrocardiographic changes could be used to detect a potassium-depleted status, irrespective of the serum potassium concentration.386 A method of determining both the internal and external potassium balances simultaneously in dairy cows has been presented.378 In this study, ingested potassium, milk potassium concentration (LK), and FEK defined the potassium external balance. Serum potassium concentration (SK) and red blood cell potassium concentration (CIEK) defined the potassium internal balance. Significant variations were detected throughout the day for CIEK, LK, and FEK.378 Therefore, in order to monitor potassium balances over time, samples should be collected at the same time each day.

Treatment

Nursing care is of primary importance to prevent complications such as mastitis or myopathy caused by prolonged decubitus; to maintain alimentation by providing food and water near the mouth; and to provide favorable conditions for the cow to get up. The animal should be kept on clean and atraumatic bedding such as pasture, sand, or accumulated litter. It must be regularly milked and turned from one side to the other at least every 8 hours. Use of a flotation tank (Aquacow Rise System) is of great value once the serum potassium concentration has returned to normal range.

All other identified problems must be addressed, including dehydration, acetonemia, and infectious disease. Treatments for arrhythmias, other than potassium, were not given in the reported cases.

Specific treatment is mainly per os potassium chloride supplementation. Based on the published data and our experience, we recommend a total (per os and intravenous) KCl dose per day of 50 g/100 kg of body weight of cow. Intravenous administration should be reserved for dehydrated cows, as overhydration may worsen hypokalemia by increasing potassium renal losses. When potassium chloride is given IV, the rate should not exceed 0.5 mEq of K+/kg/hour, to avoid high risk of cardiac toxicity. Serum potassium should be monitored twice daily to allow adjustment of the treatment regimen. Potassium supplementation is needed for an average of 5 days.371

The abnormal neck position can be the first and last clinical sign in the evolution of the hypokalemia syndrome. Other clinical signs usually disappear on average in 3 days, the same day potassium concentration typically returns to normal. Some degree of paresis may persist for 2 to 3 days after return to normokalemia. We recommend continued potassium supplementation for 1 or 2 days after the return to normal clinical state and appetite. Increased renal potassium losses are promoted by the high quantity of potassium given during the treatment. In our experience it is important to decrease potassium supplementation slowly to avoid potassium depletion caused by delayed renal adaptation to the lower potassium diet. For example, 25 g of KCl per 100 kg of cow may be given the day after return to normokalemia, then 12.5 g of KCl per 100 kg of cow for 2 more days.

Because potassium depletion is a primary cause of myopathy, it is important not to try to raise the cow before hypokalemia has resolved. This emphasizes the importance of good nursing care and regular decubitus side changes. Once serum potassium concentration reaches the normal range, a water flotation tank is the best system to manage the recumbency.

Prognosis

The survival rate was very different in the two series of cases reported: 2 of 8370 versus 11 of 14.371 The prognosis may be affected by the age, concomitant disease, initial potassium depletion degree, presence and severity of hypokalemic myopathy, or treatments received.369 The quality of the supportive care is probably a major determinant of the outcome, as for any downer cow. In the field, because of time and energy needed from the owner, our experience warrants a guarded prognosis. The availability of a flotation tank appears a significant positive prognostic factor.371,372

BOVINE SOMATOTROPIN

V. MICHAEL LANE

AURORA VILLARROEL

Somatotropin, also known as growth hormone (GH), is a peptide hormone produced in the anterior pituitary gland of all animals and is an important endocrine factor for normal growth of all tissues387 and lactation in mammals. It is released under the influence of GH-releasing factor and inhibited by somatostatin. High-producing dairy cattle have naturally elevated circulating levels of endogenous somatotropin.388,389 The lactogenic effect of somatotropin was first discovered in 1928 after rabbits were injected with crude extracts of anterior pituitary glands,390 and its effect in lactating dairy cows was first reported in 1937.391 Since the 1980s, recombinant DNA manipulations allowed large-scale production of purified somatotropin.392,393 Because the use of several synonyms of somatotropin throughout the literature can be confusing, this chapter will use GH to refer to natural somatotropin and rBST to refer to recombinant BST. It has been shown that rBST has biologic activity similar to that of bovine GH.394 Four variants of bovine GH have been reported, according to whether it has 190 or 191 amino acids (additional phenylalanine in N-terminal) and either valine or leucine in position 127.395,396 The genetic determination of the amino acid present in position 127 seems to be breed-specific. Homozygosity for leucine is more frequent in larger breeds such as Holstein and Brown Swiss (85% and 100%, respectively) compared with smaller breeds such as Jersey and Ayrshire (31% and 59%, respectively).396 This variation may account for differences in milk production.

Four recombinant analogues have been developed397,398 and differ in 0 to 9 amino acids from GH. Methionyl-rBST (leucine variant with 190 amino acids)399 was approved for use in lactating dairy cows in the United States in November 1993400 and is available for commercial use in more than 20 countries, including Mexico, Brazil, South Africa, South Korea, and Russia. The release of rBST for commercial use provides new opportunities and challenges for the dairy herd manager, veterinarian, and nutritionist.

PHYSIOLOGY OF GROWTH HORMONE

Physiologic concentrations of GH in blood are secreted in a pulsatile pattern and vary throughout the day, being lowest after midnight and highest during the day (diurnal variation) both in humans and in dairy cattle.387,401 Baseline levels and frequency and intensity of the secretory pulses of GH are highest during the first week of age and then decrease with age.389,402,403 Apparently, GH levels in neonates are not influenced by colostrum intake, as evidenced by a study in which calves that received their first colostrum 24 hours after birth did not differ in serum GH levels from calves that received their first colostrum feeding at 2 hours, 6 hours, or 12 hours after birth.404 Physiologic GH levels are heavily influenced by gonadotropin hormones; intact bulls had higher baseline levels and higher frequency and intensity of pulses of GH as compared with steers, which in turn had higher levels and pulses than heifers (intact or ovariectomized).405 In lactating cows, GH levels are highest during the postpartum period and gradually decrease as the lactation advances and milk production decreases.388,406-408 Blood concentrations of GH are naturally higher in high-production cows as compared with low-production cows,389,408,409 even during the dry period.388,406

  Page 1381 

GH must bind to GH receptors located in specific tissues to exert its direct effects, one of which is the local secretion of somatomedins throughout many organs.387,402,410 Of the four somatomedins identified to date, the type I insulin-like growth factor (IGF-I) is the most important.387 IGF-I is found in serum attached to IGF binding proteins. It exerts its action when bound to IGF receptors on target tissues. The complete somatotropic axis consists of GH, GH receptors, IGF-I, IGF-I receptors, and IGF-I binding proteins. Fig. 41-22 depicts the target organs for GH action via direct effects of GH and indirect effects of IGF-I.

image

Fig. 41-22 Summary of direct and indirect effects of somatotropin in cattle.

IGF-I is produced in the liver and locally in many tissues throughout the body.

Overall, GH promotes increased cell size and mitosis in almost all tissues of the body that are capable of growing (directly or indirectly through the action IGF-I) and a shift in metabolism to use fat for energy in preference to carbohydrate and proteins, which are spared.387,402 The immediate result of the increased use of fat as energy source for the body is a measurable rise in NEFA concentrations in blood.387,402,410 Another direct effect of GH on the liver is to increase glucose synthesis.387,402 GH stimulates the pancreas to secrete increased amounts of insulin, although a simultaneous IR is induced that results in a diabetogenic effect.387 It has been shown in humans and rats that an increase in serum FFAs impairs the action of insulin on tissue glucose use.411,412 The effects of GH on liver, pancreas, and adipose tissue are direct because of the presence of multiple GH receptors in these tissues.

Muscle is affected directly by GH and indirectly by IGF-I. Both GH and IGF-I act on muscle cells to increase protein synthesis and decrease protein catabolism.387,402 The net effects of the changes in muscle and fat metabolism are to increase lean body mass.387,402 When rBST is administered to growing cattle, it has an anabolic effect 402,413-415 similar to that of steroid hormones415 that seems to be a result of increased feed intake rather than an increased efficiency of feed conversion.403 GH also has an effect on bone growth through the action of IGF-I, which increases osteoblast proliferation and function.387,402 IGF-I also mediates an enhanced response to induced infection and endotoxemia through lymphocyte blastogenesis,416 neutrophil proliferation,417,418 and decreased levels of TNF.419,420

  Page 1382 

The most obvious outward manifestation of rBST administration in the lactating cow is an increase in milk production.391,421,423 Other manifestations include changes in body composition, both positive and negative effects on reproduction, and proliferation of immune cells. These changes are achieved through an “orchestrated control” of the metabolic functions (homeorrhesis) to support the new physiologic state of higher milk production. Table 41-10 shows the short-term and long-term effects (after homeorrhesis) of rBST administration in lactating dairy cows. The use of rBST in lactating cows increases milk production through its effect on nutrient partitioning,410 increased rate of cell renewal in the mammary gland,424 and support of mammary cell function.425 Although receptors for GH in the mammary gland were recently discovered,426,427 bovine GH does not appear to have a direct galactopoietic effect on mammary tissue.428,429 The galactopoietic effect of rBST has been reported to be indirect, through the action of IGF-I.430,431 IGF-I is associated with increased mammary blood flow and enhanced mammary extraction of substrates.430,432 The heart plays a major role in nutrient partitioning by increasing contractility and output, which increases blood flow to the mammary gland.430,433,434 These actions are responsible for a higher persistency of milk production in rBST-treated cows (Fig. 41-23). The ultimate effect is the increased use of fat as an energy source to spare glucose and acetate for mammary gland lactogenesis.430 This avoids excessive weight gain during late lactation as measured by BCS422,435 but can also can result in weight loss when dietary energy is restricted.436-438 The use of rBST does not cause significant changes in blood mineral levels.431,439

Table 41-10 Short-Term and Long-Term Effects of the Use of Subcutaneous Injections of 500 mg of rBST Every 14 Days in Lactating Dairy Cows

Target Short-Term Effects Long-Term Effects
Milk production Increased, with peak on day 7–11 with a gradual decrease to baseline levels around day 14 Increased, following a typical downward trend in production as DIM increase, although with higher persistency than in untreated cows; no effect on production during the next lactation
Feed intake No change Increased, starting 4–10 weeks after the initial treatment to provide energy for the increased milk production
Energy balance Decreased because of increased milk production and unchanged feed intake Normal, as feed intake accommodates to higher milk production
Milk composition Initial increase in fat % and decrease in protein, reflecting initial negative energy balance Normal or slightly increased protein percentage
Reproduction Positive influence because of increase in IGF-I levels in blood. Negative influence of higher milk production and higher clearance rate of steroid hormones because of higher liver blood flow
Metabolism Changes that reflect the state of initial negative energy balance: increased plasma levels of NEFA, insulin and glucose After feed intake increases to adapt to the increased milk production, metabolic indices return to normal; lower NEFA and BHB plasma levels in the next lactation
Body condition Decrease in fat content and therefore in body weight, especially if the negative energy balance is severe Maintenance of healthier body condition (leaner body) during late lactation than in untreated cows
Health    
Mastitis Improved response to infection due to a proliferation of immune cells Tendency to increase the crude incidence of lameness, although it can be attributed to the higher risk normal for higher production; incidence by pounds of milk produced is decreased
Lameness No change Tendency to increase the crude incidence of mastitis, although it can be attributed to the higher risk normal for higher production
Ketosis No change Decreased incidence of ketosis in the postpartum period that follows the lactation in which cows were treated; attributed to a leaner body composition

BHB, β-hydroxybutyric acid; DIM,days in milk; IGF-I, insulin-like growth factor; NEFA, nonesterified fatty acid.

image

Fig. 41-23 Comparison of lactation curves of two first-lactation cows, one treated with rBST and one untreated, showing the cyclic response to rBST injection every 14 days and the improved persistency of milk production. The dips in the treated cow correspond to the administration of a new injection of rBST (every 14 days). Dashed lines represent average daily milk production. Note the variable response to different injections.

From Lane VM, Villarroel A, unpublished data.

Other effects of rBST in cows include direct and indirect effects on reproductive organs. GH receptors (direct effect) are found mostly in the ovary, primarily on the corpus luteum (CL), with nearly undetectable levels on follicles.440,441 Cows treated with rBST had heavier CLs 442 but no difference in blood progesterone levels.442-444 Other tissues with high expression of GH receptors, although not as abundant as in the CL, included (in decreasing order) myometrium, endometrium, and oviduct.440 In vitro exposure of endometrial cells to rBST attenuated the production of phorbol ester—induced prostaglandin (PG) F; on the other hand, IGF-I increased its production.445 Receptors for IGF-I in the reproductive organs were expressed primarily in the myometrium and less in the endometrium, ovary, and oviduct.440 Although follicles did not show high expression of GH or IGF-I receptors, treatment with rBST increased follicle proliferation and recruitment.443,444 The dominant follicles were larger but contained lower levels of estrogen.443,446 Pregnant cows had higher expression of IGF-I receptors throughout the reproductive tract compared with nonpregnant cows, especially in the myometrium.440 The embryo has receptors for both GH and IGF-I, and both peptides increase the rate of embryo maturation.447-449 GH is additive to IFN-tau (produced by the embryo) in its effect of attenuating uterine production of PGF.445 Therefore somatotropin may be an important factor for maternal recognition of pregnancy.

  Page 1383 

Half-life for important lactopoietic hormones is as follows387:

image Somatostatin: 3 minutes
image Insulin: 6 minutes
image GH: 20 minutes
image IGF-I: 20 hours

IMPACT OF SOMATOTROPIN ON MILK PRODUCTION

Many studies have reported a consistent effect of increased milk production after short- and long-term administration of rBST. Most trials are not directly comparable to one another because of the use of different somatotropin analogues, dosages, lengths of study, and intervals between doses used in the studies. These experimental trials have been conducted under differing feed conditions and show similar responses in milk production to treatment with rBST in pasture-based dairy cows,450,451 stalled cows,452,453 and cows fed a total mixed ration (TMR).392,454 Studies show a wide range of increase in milk production (8% to 61%) over the baseline production before rBST administration. This range reflects individual cow variation in the response to rBST, and it has been recognized since the first trial in 1937 (pituitary extract) that some cows do not respond at all.391,455 In general, larger responses were observed at higher doses of rBST,436,437,456 although the dose response could be characterized as a negative exponential relationship: milk response per milligram of rBST is diminished at higher doses. Larger responses have been observed when rBST was administered daily (up to 61%)453,457-459 as compared with administration at 14-day intervals (up to 31%)422,453,460,461 or 28-day intervals (up to 18%).392,454 Most of these studies with large responses reported the short-term effects of rBST supplementation, whereas long-term trials reported milk increases ranging from 11% to 29%.422,435,451,462 Consistently higher responses (both in kilograms and percentages) occur in adult cows as compared with first-lactation heifers.421,422,463 Furthermore, the effect of rBST use on milk production varies according to production level before rBST administration and stage of lactation, in that lower-producing cows seem to respond better than higher-producing cows,463-465 and late-lactation cows respond better than early-lactation cows,422,463 both in kilograms and percentages. Although Holstein cows have a higher response to rBST treatment than Jersey cows437,465 the effective response (return on rBST investment) may be higher in Jerseys because of their higher milk solids.

In February 1994 the rBST named sometribove (zinc-methionyl BST, Monsanto) was first commercialized in the United States for use at a dose of 500 mg to be given every 14 days beginning at 57 to 70 days in milk (DIM) and continuing until the end of lactation.400 Since then, multiple studies have been reported that are now comparable because of the uniformity of product and application. Production responses were reported in 176 control herds and 164 herds using sometribove in the Northeast United States for a period of 4 years before approval and 4 years after approval.423 In this study, cows from herds using rBST produced an average of 894 kg more milk, 27 kg more fat, and 31 kg more protein during a 305-day lactation compared with control herds. A metaanalysis of data from 28 studies using various analogs of rBST reported a production improvement of 11.3% in primiparous cows and 15.6% in multiparous cows, equivalent to 3.03 and 4.36 kg/day, respectively, over control cows.421 In another study422 the reported average response to sometribove in 15 U.S. herds was 4.9 kg/cow/day with a wide range among herds (2.9 to 7.6 kg/cow/day), corresponding to production increases that ranged from 11% to 31%.423,450,453,460,461 Some trials conducted over multiple lactations have reported a lower response of cows treated in a second lactation436,466-469; however, all these trials used daily administration of rBST. Studies conducted using the approved 14-day interval application showed that previous treatment with rBST did not diminish milk production in subsequent lactations,423,470 even in a study conducted over four lactations.471

  Page 1384 

Lactation graphs of cows responding to rBST administered at 14-day intervals show a cyclic response to treatment,422,460,472 in which milk production started increasing on day 1 after injection, peaked on day 7 to 11, and then decreased until the next dose (see Fig. 41-23). The use of rBST does not practically alter milk components,460,470,472 although minor changes in milk fat and protein have been observed in association with shifts in energy balance.422,471,472 Cows with higher somatic cell counts (SCCs) before treatment can be expected to have a diminished response to rBST compared with cows with lower SCCs.422

Factors Limiting Response to Recombinant Bovine Somatotropin

Nutrition is the most important factor that can limit milk production response to rBST. Although short-term treatment with rBST increases milk production without increasing dry matter intake (DMI),457,462 long-term treatment (4 to 10 weeks) results in increased DMI to compensate for the increased production.437,458,462 Current nutritional standards for high-producing cows473 meet requirements for rBST-treated cows, assuming emphasis is given to consistency of the ration and feed-bunk management. If ration inconsistency leads to indigestion and “off-feed” conditions, or if feed is periodically unavailable to the cow, DMI and therefore milk production will be reduced. These off-feed conditions may affect the response to rBST. McGuire and colleagues474 found that after restriction of feed intake to lactating cows, plasma concentrations of IGF-I were markedly decreased, indicating that the stimulatory effects of rBST on lactation would not be observed in underfed cows. In this study, underfeeding of cows resulted in a marked decrease in milk production despite rBST treatment. Radcliff and co-workers475 have shown that DMI partially controls expression of GH receptor mRNA and that cows on feed restriction had lower receptor activity for at least 1 week after ad libitum feed was restored.

Heat stress is another important factor affecting the response of milk production to rBST. Trials conducted under hot humid conditions450,476,477 suggest that milk production response to rBST may be more variable than that obtained under temperate conditions and that responses to higher doses may be reduced. In one trial the use of rBST was associated with reduced DMI in cows exposed to heat stress478; this effect was not observed in other trials.458,479 Collier and co-workers480 reported that acclimation to heat stress is a two-step homeorrhetic process that occurs in an acute stage of changes in secretion rate of hormones and a chronic stage of receptor population adjustments in target tissues. The time frame of acclimation is weeks rather than days. Cows treated with rBST adapt to heat stress by increasing water intake, respired vapor, and skin vapor.476-478 These adaptations require energy and divert cardiac output away from the udder. Several studies have shown that the milk response to rBST administration is lower (up to 55%) in cows exposed to high temperatures provided with shade as opposed to shade and an evaporative cooling system.450,479 Several studies have shown that higher rectal temperatures may be experienced in rBST-treated cows under heat stress conditions.450,458,465,477 Although milk production was increased, the response may likely have been depressed because of energy expense toward homeostatic thermoregulation. The lower responses to rBST observed in herds in hot climate conditions may be explained in part by the effect of decreased DMI on IGF-I in plasma.474 Dietary rations for heat stressed cows may need reformulation for higher nutrient density to offset the reduced DMI. No negative effects have been observed during rBST use under cold conditions.481,482

IMPACT OF SOMATOTROPIN ON REPRODUCTION

The aspect of rBST use most likely to result in involvement of the veterinarian is its effects on fertility. The positive effects of rBST on milk production can be accompanied by both positive and negative effects on reproduction. Although a study by De la Sota and colleagues443 found that lactational status (lactating vs. nonlactating) had a greater effect on reproduction than the use of rBST, the following discussion is limited to the reproduction of lactating cows.

In general the negative effects of rBST on reproduction in lactating cows have been reported to be an increase in twinning rate and days open.472,483,484 The increased twinning rate is likely due to better embryo survival, because ovulation rate does not appear to be increased in rBST-treated cows.448,485 There is, however, reason to suspect an increased ovulation rate based on recent studies that reported that increased feed intake results in higher rates of steroid metabolism in the liver.486,487 More rapid metabolism of estradiol can result in decreased negative feedback on follicle-stimulating hormone (FSH), allowing additional follicles to undergo changes necessary to proceed to ovulation.487 The increase in days open could be attributable to a prolonged negative energy balance associated with the increased milk production. The magnitude of the increase in days open was estimated to be 5 days in a metaanalysis performed on data from 18 studies.484 The relative risk of nonpregnancy in rBST-treated cows during the same period as control cows was 1.38 in a metaanalysis of nine studies.484 One explanation for nonpregnancy can be that cows treated with rBST do not show outward signs of estrus with the same intensity as untreated cows,444,488 and therefore accurate heat detection is hindered. Estrous detection rate decreased linearly with increasing dose of rBST488 despite the finding that rBST treatment had no effect on incidence of cystic ovaries.452,484,485,489

A confounding factor in any evaluation of the effect of rBST on reproduction is the fact that rBST-treated cows maintain profitable milk production longer and therefore these cows can be rebred, if open, at longer DIM than untreated cows. The resultant pregnancies from these breedings late in lactation will increase the average days open for the herd. On the other hand, any additional pregnancies under rBST use as a result of longer breeding windows could be considered a positive effect of the use of rBST, because they would not be obtainable under the same management in untreated cows. The evidence that these two effects offset each other comes from a study that evaluated the effect of rBST use on culling in 32 herds, which showed no difference between culling rates (overall and culling because of reproductive factors) in herds that used rBST and control herds.490 The potential negative effects of rBST on estrous behavior may favor the decision to use timed artificial insemination (TAI) programs, because TAI does not rely on estrous detection to breed the cow.

  Page 1385 

Positive effects of rBST on reproduction have been elucidated in recent studies that showed first-service pregnancy rate is increased in rBST-treated cows.491-493 This effect is not independent of the timing of the last rBST injection.444,491 The first-service pregnancy rate was increased in cows receiving rBST between 1 and 3 days before the first gonadotropin-releasing hormone (GnRH) injection of the Ovsynch program. In another study, pregnancy rates were increased in lactating, multiparous cows when a single dose of rBST was administered at time of insemination.493 Some studies have found increased conception rates in cows treated with lower doses of rBST as compared with cows treated with higher doses.488,494 Furthermore, rBST has shown a positive effect on embryo transfer (ET) programs, both in the donor and the recipient animals.448,495 When rBST was given at the initiation of the superovulation regimen in donor animals, two more transferable embryos were obtained—a net increase of 28% to 37%. The increased recovery of transferable embryos can be attributed to a direct effect of rBST on the superovulated ovary and an indirect effect of IGF-I. The effect on recipient animals when the donor cow was not treated was to increase pregnancy rates by 68%,448 explained by better embryo survival, because GH and IFN-tau have added effects in inhibiting uterine PGF production.445 The effect of rBST on the fetus has shown some inconsistencies. In one study, calves born to rBST-treated cows had a gestation length 2 days shorter and weighed 2 kg less compared with contemporary controls,454 whereas in another study they weighted 3 kg more than controls.472 The effect could be dependent on energy balance (similar to the effects on milk production). In summary, rBST initially has positive effects on reproduction, but within weeks the metabolic consequence of increased milk production has a negative impact on reproduction. In herds not using rBST for increased milk production, the use of low doses of rBST could be beneficial for individual cow conception rates.

IMPACT OF SOMATOTROPIN ON HEALTH

Mastitis

Several studies have reported that rBST use was associated with an increase in clinical cases of mastitis.422,484,489,496,497 In these studies no attempt was made to differentiate between contagious and environmental mastitis cases or the effect that increased milk production has on mastitis incidence. Studies on well managed farms where contagious mastitis was being controlled reported no effect of rBST on clinical mastitis.498,499 SCC levels in milk from rBST-treated cows are not significantly different from those in untreated cows.422,423,460,484 If rBST supplementation is used in cows with high SCC levels, the response in milk production is lower than if rBST is used in cows with lower SCC levels.422 The incidence of clinical mastitis in rBST-treated cows has been reported to be similar to the mastitis incidence consistent with the genetic improvement of milk yield per cow.497,500 White and colleagues497 suggested that mastitis should be evaluated as incidence per unit of milk produced. Cows of a given production stratum reportedly had similar mastitis incidence whether they were treated with rBST or not.497 A metaanalysis of 11 studies found an increase in clinical mastitis cases of approximately 19.4% in the rBST-treated cows, without controlling for the increase in milk production (11% to 15.6%).484 To further complicate interpretation of the effect of rBST, the incidence of mastitis in mid and late lactation (31 to 150 DIM and 151 to 365 DIM) depends on the incidence early in lactation (0 to 30 DIM).501 Therefore if mastitis incidence is not measured before treatment with rBST (according to label after 57 to 70 DIM), mastitis incidence during the treatment period should be interpreted with caution. No differences in culling rates as a result of mastitis were observed in a comparison of herds that used rBST and control herds (total of 64 herds in three studies).489-490498 Several trials were designed to assess the effect of rBST on experimentally induced mastitis with environmental bacteria (Streptococcus uberis418,502 and Escherichia coli503). Clinical signs of mastitis, milk composition changes, and bacteria counts in milk were all reduced in rBST-treated cows. Therefore overall production losses during induced mastitis episodes were lower in rBST-treated cows than in control cows, indicating a positive effect of rBST on the immune response.416-418

Lameness

Preapproval trials for rBST were designed as either dose titration studies or clinical trials of the effect on milk production; the trials did not capture in-depth health information. A metaanalysis484 of 18 preapproval studies that collected data on disease incidence reported negative effects of rBST on lameness and culling of adult cows (second or greater lactation). This study reported a risk ratio (RR) of 1.55 for clinical lameness and 1.36 for culling of older cows treated with rBST compared with control cows. Ruegg and colleagues,490 however, showed no differences in culling rates (overall or because of lameness) between herds that used rBST and control herds. Another study showed that the higher risk of lameness occurred in the lactation after treatment with rBST but not during treatment.452 In this study, however, the higher risk of lameness was attributed to management (tie-stall housing), because no changes could be found on histopathology preparations.

Metabolic Diseases

The effect of rBST on fat mobilization is a decrease in body condition score,436,437,469 which in turn results in lower NEFA and BHB plasma levels and a lower incidence of postparturient metabolic diseases such as ketosis and milk fever (hypocalcemia) in the subsequent lactation.452,469 One study within the previously reported metaanalysis484 showed a fourfold reduction in the incidence of metabolic diseases (RR = 0.25) owing to the carryover effect in the lactation after rBST treatment. Data on the incidence of other diseases commonly reported in dairy cattle were either insufficient or not collected in a consistent manner to allow objective evaluation.

Toxicity

Studies on the potential toxicity of high doses of rBST in dairy cattle,457,470,504 even when administered for long periods (six times the approved dose over two consecutive lactations),470 have shown no negative effects. The highest tested dose was 60 times the approved dose of rBST administered weekly for 4 weeks.504 Apparent negative health effects were also not observed in the many experimental studies of rBST use.* Although cows treated with rBST tend to have lower hematocrit (packed cell volume) and hemoglobin values,457,504,506 both remain within the normal range for dairy cattle.

  Page 1386 

HUMAN AND FOOD SAFETY

The safety of milk and meat products from rBST-treated cows is based on three tiers of biologic protection:

1 Bovine GH has no activity in humans, even if injected.
2 GH and IGF-I have no oral activity and are inactivated in the gastrointestinal tract.
3 GH and IGF-I concentration in milk and meat are essentially unchanged with rBST use.

Bovine GH has been studied in depth as a potential source for therapeutic GH for hypophysectomized human patients.507 Bovine and human GH differ in 69 of 191 amino acids in their sequences (approximately 36%).395 The difference in their structure and the much lower binding affinity of bovine GH for human GH receptors (up to 3000 times)508-510 renders bovine GH inactive in humans. Therefore contact with rBST should have no effect on people, even if injected.

The safety of consuming animal products (meat and milk) from cows treated with rBST has been extensively studied. Milk naturally contains GH and IGF-I; concentrations of both are highest during the first days of lactation407,511-513 when milk cannot be marketed for human consumption (colostrum),514 and decrease as lactation progresses. GH levels in milk were similar in cows treated with rBST and untreated cows and decreased by 85% to 90% when milk was heat-treated.515 IGF-I concentration in cow milk has been reported in colostrum to be 233.8 ± 26.9 ng/mL, decreasing to 8.8 ± 1.5 ng/mL at 2 weeks postpartum.516 Physiologic concentrations of IGF-I in cow milk vary widely according to parity and stage of lactation, ranging between 1.27 and 8.10 ng/mL in bulk tank samples.398,511 Although treatment with rBST slightly elevates IGF-I concentration in milk,398,519 levels remain within physiologic range. Therefore, it is not possible to determine whether cows have been treated with rBST based on measurement of IGF-I and GH in milk.519,520 The only reliable method to determine whether cows have been treated with rBST is the measurement of GH levels in blood several times over the 14-day injection interval.519,520

Levels of IGF-I in milk tended to be higher after pasteurization than in raw milk (8.2 ± 0.35 ng/mL vs. 5.6 ± 0.56 ng/mL),511 presumably because IGF-I is released from its binding proteins. Infant formulas, which require higher pasteurization temperatures, had almost undetectable levels of IGF-I (0.7 ng/mL).511 Muscle of cows treated with rBST had levels of GH and IGF-I similar to those of untreated cows.521 Like most ingested proteins, rBST and IGF-I are degraded by the digestive enzymes of the gastrointestinal tract, rendering them biologically inactive.398,515,521,522 Therefore rBST has been shown to be safe and has been approved to be used with zero days withholding of meat and milk for human consumption.400

RECOMMENDATIONS FOR USE OF RECOMBINANT BOVINE SOMATOTROPIN

As described previously, there is overwhelming evidence that rBST has a strong galactopoietic effect and will increase average herd production when used according to label directions. When compared with other technologies developed over time to increase milk production in the dairy industry, the use of rBST and 3× milking are the two methods that can make an immediate and significant impact on herd milk production (Table 41-11). Genetic methods523-525 of improving milk production do not affect the cow on which they are applied. They will improve milk production in the female offspring, once they are mature (less than 50% of all offspring). In contrast, methods such as cooling cows during hot weather,526 milking cows 3 times per day (3×) as opposed to twice per day (2×),526,527 and using rBST improve milk production directly in the cows and their mature offspring. In fact, use of rBST can further increase milk production in herds that are already benefiting from higher production resulting from 3× milking.526,527

Table 41-11 Relative Magnitude of Increased Milk Production Obtained by the Use of Different Technologies in Dairy Cows*

image

Responses to rBST are highly variable among herds; therefore individual dairymen need to determine whether the rBST response justifies the cost. Basic costs that need to be taken into account include the cost of the product plus additional labor and feed costs. Another expense to consider is the cost of implementing a TAI program (labor and drugs) to offset the negative effect of rBST on estrous expression and pregnancy rate, although TAI may have benefits independent of rBST use. Not all studies have found rBST to be significantly profitable.528,529 The use of rBST has minimum facilities and management requirements such as a reliable restraint method (automatic headlocks, stanchions, or tie-stalls), visual identification of all cows (eartags or freeze brands), herd management computer software, and the ability to deliver a consistent, high-quality ration, preferably a TMR.

  Page 1387 

The labeled use of rBST in the United States is 500 mg administered SC every 14 days starting at 57 to 70 DIM. Individual cow identification, restraint, and computerized records are important to ensure that cows are treated with rBST every 14 days. Because all cows will not show a significant improvement in milk production, individual responses may be monitored so that treatment can be limited to responsive cows. Herds that intend to profit from rBST must provide the husbandry needed to maximize DMI in the cows. Feed quality, palatability, and availability are major determinants of DMI, along with water availability, cow comfort, and heat abatement, and thus will influence success of rBST usage. Feed consistency can best be guaranteed by a large high-quality forage base so that minimal ration adjustments are necessary. When cows treated with rBST become sick, they should remain on rBST because of the enhanced response to infection and endotoxemia.416-420 The sick cow diet should not significantly drop in energy, or the effect of rBST (through IGF-I) on milk production and immune function will likely be reduced. Because the response to rBST in cows is greater in late lactation than in early lactation, both in kilograms and in percentage improvement, delaying the start of rBST use until later in lactation could further benefit the cows, allowing additional pregnancies to occur without a large reduction in overall response in milk production.

Potential uses of rBST, other than blanket herd use for improved milk production, include treating repeat breeder cows for improved fertility, improving fertility in embryo transfer programs (in both donor and recipient cows),448,495 helping fat cows achieve target BCS,422,435 preventing ketosis in the subsequent postpartum period,452,469 and reducing or delaying culling in cows that abort and in “do not breed” cows. Potential uses of rBST in the future (if approved) may include production enhancement of cows after lactation induction,530 integration into programs with no dry periods,407,531,532 and use on young stock to induce more rapid growth of lean body mass475,533 and in nutrient management programs to reduce manure, urine, and methane production per pound of milk produced.534

REFERENCES

1 Saland LC. The mammalian pituitary intermediate lobe: an update on innervation and regulation. Brain Res Bull. 2001;54:587.

2 Malven PV. Pituitary gland neuroendocrinology. Proceedings of the 15th Annual Forum of the American College of Veterinary Internal Medicine. 1997:462.

3 McFarlane D, Beech J, Cribb A. Alpha-melanocyte stimulating hormone release in response to thyrotropin releasing hormone in healthy horses, horses with pituitary pars intermedia dysfunction and equine pars intermedia explants. Domest Anim Endocrinol. 2006;30:276.

4 Millington WR, Dybdal NO, Dawson RJr, et al. Equine Cushing’s disease: differential regulation of β-endorphin processing in tumors of the intermediate pituitary. Endocrinology. 1988;123:1598.

5 Marklund L, Moller MJ, Sandberg K, et al. A missense mutation in the gene for melanocyte-stimulating hormone receptor (MC1R) is associated with the chestnut coat color in horses. Mamm Genome. 1996;7:895.

6 Altmeyer P, Holzmann H, Stohr L, et al. The relationship between alpha-MSH level and coat color in white Camarque horses. J Invest Dermatol. 1984;82:199.

7 Nahon JL. The melanocortins and melanin-concentrating hormone in the central regulation of feeding behavior and energy homeostasis. C R Biol. 2006;329:623.

8 Clement K. Genetics of human obesity. C R Biol. 2006;329:608.

9 Katsuki A, Sumida Y, Murashima S, et al. Elevated plasma levels of alpha-melanocyte stimulating hormone (alpha-MSH) are correlated with insulin resistance in obese men. Int J Obes Relat Metab Disord. 2000;24:1260.

10 Donaldson MT, McFarlane D, Jorgensen AJ, et al. Correlation between plasma alpha-melanocyte-stimulating hormone concentration and body mass index in healthy horses. Am J Vet Res. 2004;65:1469.

11 Catania A, Lipton JM. alpha-Melanocyte stimulating hormone in the modulation of host reactions. Endocrinol Rev. 1993;14:564.

12 Taylor AW. The immunomodulating neuropeptide alpha-melanocyte-stimulating hormone (alpha-MSH) suppresses LPS-stimulated TLR4 with IRAK-M in macrophages. J Neuroimmunol. 2005;162:43.

13 Sacerdote P, Gaspani L, Panerai AE. Role of beta-endorphin in the modulation of immune responses: perspectives in autoimmune diseases. Adv Exp Med Biol. 2001;493:137.

14 Dunbar JC, Lu H. Proopiomelanocortin (POMC) products in the central regulation of sympathetic and cardiovascular dynamics: studies on melanocortin and opioid interactions. Peptides. 2000;21:211.

15 Beevor S, Beloff-Chain A, Donaldson A, et al. Pituitary intermediate lobe function in genetically obese (ob/ob) and lean mice [proceedings]. J Physiol. 1978;275:55P.

16 Bailey CJ, Flatt PR. Insulin releasing effects of adrenocorticotropin (ACTH 1–39) and ACTH fragments (1–24 and 18–39) in lean and genetically obese hyperglycaemic (ob/ob) mice. Int J Obes. 1987;11:175.

17 McFarlane D, Donaldson MT, McDonnell SM, et al. Effects of season and sample handling on measurement of plasma alpha-melanocyte—stimulating hormone concentrations in horses and ponies. Am J Vet Res. 2004;65:1463.

18 Altmeyer R, Stohr L, Holzmann H. Seasonal rhythm of the plasma level of alpha-melanocyte stimulating hormone. J Invest Dermatol. 1986;86:454.

19 Lincoln GA, Rhind SM, Pompolo S, Clarke IJ. Hypothalamic control of photoperiod-induced cycles in food intake, body weight, and metabolic hormones in rams. Am J Physiol Regul Integr Comp Physiol. 2001;281:R76.

20 Logan A, Weatherhead B. Photoperiodic dependence of seasonal variations in melanocyte-stimulating hormone content of the pituitary gland in the Siberian hamster (Phodopus sungorus). J Endocrinol. 1979;83:41P. (abstract)

21 Brosnahan MM, Paradis MR. Assessment of clinical characteristics, management practices, and activities of geriatric horses. J Am Vet Med Assoc. 2003;223:99.

22 Dybdal NO, Hargreaves KM, Madigan JE, et al. Diagnostic testing for pituitary pars intermedia dysfunction in horses. J Am Vet Med Assoc. 1994;204:627.

23 Orth DN, Holscher MA, Wilson MG, et al. Equine Cushing’s disease: plasma immunoreactive proopiolipomelanocortin peptide and cortisol levels basally and in response to diagnostic tests. Endocrinology. 1982;110:1430.

24 Donaldson MT, LaMonte BH, Morresey P, et al. Treatment with pergolide or cyproheptadine of pituitary pars intermedia dysfunction (equine Cushing’s disease). J Vet Intern Med. 2002;16:742.

25 Perkins GA, Lamb S, Erb HN, et al. Plasma adrenocorticotropin (ACTH) concentrations and clinical response in horses treated for equine Cushing’s disease with cyproheptadine or pergolide. Equine Vet J. 2002;34:679.

26 Schott HC, Coursen CL, Eberhart SW, et al. The Michigan Cushing’s Project. Proceedings of the 19th Annual Forum of the American College of Veterinary Internal Medicine. 2001:22.

27 McFarlane D, Dybdal N, Donaldson MT, et al. Nitration and increased alpha-synuclein expression associated with dopaminergic neurodegeneration in equine pituitary pars intermedia dysfunction. J Neuroendocrinol. 2005;17:73.

28 Goudreau JL, Falls WM, Lookingland KJ, et al. Periventricular-hypophysial dopaminergic neurons innervate the intermediate but not the neural lobe of the rat pituitary gland. Neuroendocrinology. 1995;62:147.

29 Saiardi A, Borrelli E. Absence of dopaminergic control on melanotrophs leads to Cushing’s-like syndrome in mice. Mol Endocrinol. 1998;12:1133.

30 Keen JA, McLaren M, Chandler KJ, et al. Biochemical indices of vascular function, glucose metabolism and oxidative stress in horses with equine Cushing’s disease. Equine Vet J. 2004;36:226.

31 McFarlane D, Cribb AE. Systemic and pituitary pars intermedia antioxidant capacity associated with pars intermedia oxidative stress and dysfunction in horses. Am J Vet Res. 2005;66:2065.

32 Schott HC. Pituitary pars intermedia dysfunction: equine Cushing’s disease. Vet Clin North Am Equine Pract. 2002;18:237.

33 Hillyer MH, Taylor FRG, Mair TS, et al. Diagnosis of hyperadrenocorticism in the horse. Equine Vet Educ. 1992;4:131.

34 Couetil L, Paradis MR, Knoll J. Plasma adrenocorticotropin concentration in healthy horses and in horses with clinical signs of hyperadrenocorticism. J Vet Intern Med. 1996;10:1.

35 van der Kolk JH, Kalsbveek HC, van Garderen E, et al. Equine pituitary neoplasia: a clinical report of 21 cases (1990–1992). Vet Rec. 1993;133:594.

36 Donaldson MT, Jorgensen AJ, Beech J. Evaluation of suspected pituitary pars intermedia dysfunction in horses with laminitis. J Am Vet Med Assoc. 2004;224:1123.

37 Pass MA, Pollitt S, Pollitt CC. Decreased glucose metabolism causes separation of hoof lamellae in vitro: a trigger for laminitis? Equine Vet J Suppl. 1998;26:133.

38 Rodgerson DH, Belknap JK, Moore JN, et al. Investigation of mRNA expression of tumor necrosis factor-alpha, interleukin-1beta, and cyclooxygenase-2 in cultured equine digital artery smooth muscle cells after exposure to endotoxin. Am J Vet Res. 2001;62:1957.

39 French KR, Pollitt CC. Equine laminitis: glucose deprivation and MMP activation induce dermo-epidermal separation in vitro. Equine Vet J. 2004;36:261.

40 Aleman M, Watson JL, Williams DC, et al. Myopathy in horses with pituitary pars intermedia dysfunction. Neuromuscul Disord. 2006;16:737.

41 Boujon CE, Bestetti GE, Meier HP, et al. Equine pituitary adenoma: a functional and morphological study. J Comp Pathol. 1993;109:163.

42 Heinrichs M, Baumgartner W, Capen CC. Immunocytochemical demonstration of proopiomelanocortin-derived peptides in pituitary adenomas of the pars intermedia in horses. Vet Pathol. 1990;27:419.

43 Biewenga WJ, Rijnberk A, Mol JA. Osmoregulation of systemic vasopressin release during long-term glucocorticoid excess: a study in dogs with hyperadrenocorticism. Acta Endocrinol (Copenh). 1991;124:583.

44 Miesner TJ, Beard LA, Schmall SM, et al. Results of overnight dexamethasone suppression test repeated over time in horses suspected of having equine Cushing’s disease. J Vet Intern Med. 2003;17:420. (abstract)

45 Donaldson MT, McDonnell SM, Schanbacher BJ, et al. Variation in plasma ACTH concentration and dexamethasone suppression test results with season, age and sex in healthy ponies and horses. J Vet Intern Med. 2004;19:217.

46 Beech J, Garcia M. Hormonal response to thyrotropin-releasing hormone in healthy horses and in horses with pituitary adenoma. Am J Vet Res. 1985;46:1941.

47 Frank N, Andrews FM, Sommardahl CS, et al. Evaluation of the combined dexamethasone suppression/thyrotropin-releasing hormone stimulation test for detection of pars intermedia pituitary adenomas in horses. J Vet Intern Med. 2006;20:987.

48 Horowitz ML, Neal L, Watson JL. Characteristics of plasma adrenocorticotropin, β-endorphin and α-melanocyte stimulating hormone as diagnostic tests for pituitary pars intermedia dysfunction in the horse. J Vet Intern Med. 2003;17:386. (abstract)

49 Allen JR, Barbee DD, Crisman MV. Diagnosis of equine pituitary tumors by computed tomography—Part 1. Compend Cont Educ (Pract Vet). 1988;10:1103.

50 Watson JL, Dybdal NO, Herrgesell EJ, et al. Equine Cushing’s disease and the long-term treatment with oral pergolide mesylate. J Vet Intern Med. 1998;12:220., (abstract)

51 McKlveen TL, Jones JC, Sponenberg DP, et al. Assessment of the accuracy of computed tomography for measurement of normal equine pituitary glands. Am J Vet Res. 2003;64:1387.

52 van der Kolk JH, Heinrichs M, van Amerongen JD, et al. Evaluation of pituitary gland anatomy and histopathologic findings in clinically normal horses and horses and ponies with pituitary pars intermedia adenoma. Am J Vet Res. 2004;65:1701.

53 McFarlane D, Miller LM, Craig LE, et al. Agreement in histologic assessments of the pituitary pars intermedia in aged horses. Am J Vet Res. 2005;66:2055.

54 McGowan CM, Neiger R. Efficacy of trilostane for the treatment of equine Cushing’s syndrome. Equine Vet J. 2003;35:414.

55 Breukink H, Van Wegen P, Schotman A. Idiopathic diabetes insipidus in a Welsh pony. Equine Vet J. 1983;15:284.

56 Slone DE, Vaughan JT, Garrett PD, et al. Vascular anatomy and surgical technique for bilateral adrenalectomy in the equid. Am J Vet Res. 1980;41:829.

57 Hardee GE, Wang Lai J, Semrad SD, et al. Catecholamines in equine and bovine plasmas. J Vet Pharmacol Ther. 1982;5:279.

58 Baker HW, Baker ID, Epstein JM, et al. Effect of stress on steroid hormone levels in racehorses. Aust Vet J. 1982;58:70.

59 Snow DH, MacKenzie G. Metabolic effects of maximal exercise in the horse and adaptations with training. Equine Vet J. 1977;9:134.

60 Dybdal NO, Gribble D, Madigan JE, et al. Alterations in plasma corticosteroids, insulin, and selected metabolites in horses used in endurance rides. Equine Vet J. 1980;12:137.

61 Yovich J, Ducharme N. Rupture pheochromocytoma in a mare with colic. J Am Vet Med Assoc. 1983;183:462.

62 Johnson PJ, Goetz TE, Foreman JH, et al. Pheochromocytoma in two horses. J Am Vet Med Assoc. 1995;206:837.

63 Warner AE, Mayhew IG. Equine anhidrosis: a survey of affected horses in Florida. J Am Vet Med Assoc. 1982;180:627.

64 Mayhew IG, Ferguson HO. Clinical, clinicopathologic, and epidemiologic features of anhidrosis in central Florida thoroughbred horses. J Vet Med. 1987;1:136.

65 Robertshaw D, Taylor CR. Sweat gland function of the donkey (Equus asinus). J Physiol. 1969;205:79.

66 Snow DH. Identification of the receptor involved in adrenaline mediated sweating in the horse. Res Vet Sci. 1977;23:246.

67 Hodgson DR, McCutcheon LJ, Byrd SK, et al. Dissipation of metabolic heat in the horse during exercise. J Appl Physiol. 1993;74:1161.

68 Evans CL, Smith DFG, Ross KA, et al. Physiological factors in the condition of “dry coat” in horses. Vet Rec. 1957;69:1.

69 Jenkinson DM, Montgomery I, Elder HY, et al. Ultrastructural variations in the sweat glands of anhidrotic horses. Equine Vet J. 1985;17:287.

70 Beadle RE, Norwood GL, Brenwick VA. Summertime plasma catecholamine concentrations in healthy and anhidrotic horses in Louisiana. Am J Vet Res. 1982;43:1446.

71 Maqsood M. Iodinated casein therapy for the non-sweating syndrome in horses. Vet Rec. 1957;101:475.

72 Breuhaus BA. Thyroid function in anhidrotic horses. J Vet Intern Med. 2003;17:450.

73 Murakami K, Sobue G, Terao S, et al. Acquired idiopathic generalized anhidrosis: a distinctive clinical syndrome. J Neurol. 1988;235:428.

74 Yoritaka A, Hishima T, Akagi K, et al. Successful steroid treatment of acquired idiopathic partial hypohidrosis. J Dermatol. 2006;33:265.

75 Bovell DL, Lindsay SL, Corbett AD, et al. Immunolocalization of aquaporin-5 expression in sweat gland cells from normal and anhidrotic horses. Vet Dermatol. 2006;17:17.

76 Guthrie AJ. Use of semi-quantitative sweat test in thoroughbred horses. J S Afr Vet Assoc. 1992;63:162.

77 Hubert JD, Beadle RE. Equine anhidrosis. Compend Cont Educ (Pract Vet). 1998;20:846.

78 Hubert JD, Beadle RE, Norwood G. Equine anhidrosis. Vet Clin North Am Equine Pract. 2002;18:355.

79 Evans CL. Physiological mechanisms that underlie sweating in the horse. Br Vet J. 1966;122:117.

80 Sin DD, Man SF. Corticosteroids and adrenoceptor agonists: the compliments for combination therapy in chronic airways diseases. Eur J Pharmacol. 2006;533:28.

81 Johnson M. Molecular mechanisms of beta(2)-adrenergic receptor function, response, and regulation. J Allergy Clin Immunol. 2006;117:18.

82 Frank N, Sojka J, Messer NT. Equine thyroid dysfunction. Vet Clin North Am Equine Pract. 2002;18:305.

83 Breuhaus BA. Review of thyroid function and dysfunction in adult horses. Proceedings of the 50th Annual Forum of the American Association of Equine Practitioners. 2004:334.

84 Schlotthauer CF. The incidence and types of disease of the thyroid gland of adult horses. J Am Vet Med Assoc. 1931;78:211.

85 Dalefield RR, Palmer DN. The frequent occurrence of thyroid tumours in aged horses. J Comp Pathol. 1994;110:57.

86 Ramirez S, McClure JJ, Moore RM, et al. Hyperthyroidism associated with a thyroid adenocarcinoma in a 21-year-old gelding. J Vet Intern Med. 1998;12:475.

87 Alberts MK, McCann JP, Woods PR. Hemithyroidectomy in a horse with confirmed hyperthyroidism. J Am Vet Med Assoc. 2000;217:1051.

88 Sawin CT. Thyroid disease in older persons. In: Braverman LE, editor. Diseases of the thyroid. ed 2. Totowa, NJ: Humana Press; 2003:85.

89 Stanley O, Hillidge CJ. Alopecia associated with hypothyroidism in a horse. Equine Vet J. 1982;14:165.

90 Held JP, Patton CS, Toal RL, et al. Work intolerance in a horse with thyroid carcinoma. J Am Vet Med Assoc. 1985;187:1044.

91 Hillyer MN, Taylor FGR. Cutaneous manifestations of suspected hypothroidism in a horse. Equine Vet Educ. 1992;4:116.

92 Lowe JE, Baldwin BH, Foote RH. Equine hypothyroidism: the long term effects of thyroidectomy on metabolism and growth in mares and stallions. Cornell Vet. 1974;64:276.

93 Vischer CM, Foreman JH, Constable PD. Hemodynamic effects of thyroidectomy in sedentary horses. Am J Vet Res. 1999;60:14.

94 Frank N, Sojka JE, Latour MA, et al. Effect of hypothyroidism on blood lipid concentrations in horses. Am J Vet Res. 1999;60:730.

95 Breuhaus BA. Thyroid stimulating hormone in euthyroid and hypothyroid horses. J Vet Int Med. 2002;16:109.

96 Johnson PJ, Messer NT, Ganjam VK, et al. Effects of propylthiouracil and bromocryptine on serum concentrations of thyrotrophin and thyroid hormones in normal female horses. Equine Vet J. 2003;35:296.

97 Messer NT, Johnson PJ, Refsal KR, et al. Effect of food deprivation on baseline iodothyronine and cortisol concentrations in healthy, adult horses. Am J Vet Res. 1995;56:116.

98 Morris DD, Garcia M. Thyroid-stimulating hormone: response test in healthy horses, and effect of phenylbutazone on equine thyroid hormones. Am J Vet Res. 1983;44:503.

99 Morris DD, Garcia M. Effects of phenylbutazone and anabolic steroids on adrenal and thyroid gland function tests in healthy horses. Am J Vet Res. 1985;46:359.

100 Sojka JE, Johnson MA, Bottoms GD. Serum triiodothyronine, total thyroxine, and free thyroxine concentrations in horses. Am J Vet Res. 1993;54:52.

101 Ramirez S, Wolfsheimer KJ, Moore RM, et al. Duration of effects of phenylbutazone on serum total thyroxine and free thyroxine concentrations in horses. J Vet Intern Med. 1997;11:371.

102 Messer NT, Ganjam VK, Nachreiner RF, et al. Effects of dexamethasone administration on serum thyroid hormone concentrations in clinically normal horses. J Am Vet Med Assoc. 1995;206:63.

103 Schott HC, Marteniuk J, Refsal KR, et al. Thyroid hormone responses to endurance exercise. J Vet Int Med. 1997;11:104.

104 Glade MJ, Reimers TJ. Effects of dietary energy supply on serum thyroxine, triiodothyronine and insulin concentrations in young horses. J Endocrinol. 1985;104:93.

105 Swinker AM, McCurley JR, Jordan ER, et al. Effects of dietary excesses on equine serum thyroid hormone levels. J Anim Sci. 1989;65(Suppl 1):255.

106 Breuhaus BA, Refsal KR, Beyerlein SL. Measurement of free thyroxine concentration in horses by equilibrium dialysis. J Vet Intern Med. 2006;20:371.

107 Slag MF, Morley JE, Elson MK, et al. Hypothyroxinemia in critically ill patients as a predictor of high mortality. JAMA. 1981;245:43.

108 Kaptein EM, Weiner JM, Robinson WJ, et al. Relationship of altered thyroid hormone indices to survival in nonthyroidal illnesses. Clin Endocrinol (Oxf). 1982;16:565.

109 Degroot LJ. Dangerous dogmas in medicine: the nonthyroidal illness syndrome. J Clin Endocrinol Metab. 1999;84:151.

110 Chopra IJ. Euthyroid sick syndrome: is it a misnomer? J Clin Endocrinol Metab. 1997;82:329.

111 Kaptein EM, Grieb DA, Spencer CA, et al. Thyroxine metabolism in the low thyroxine state of critical nonthyroidal illnesses. J Clin Endocrinol Metab. 1981;53:764.

112 Woeber KA, Maddux BA. Thyroid hormone binding in nonthyroid illness. Metabolism. 1981;30:412.

113 Oppenheimer JH, Schwartz HL, Mariash CN, et al. Evidence for a factor in the sera of patients with nonthyroidal diseases which inhibits iodothyronine binding by solid matrices, serum proteins, and rat hepatocytes. J Clin Endocrinol Metab. 1982;54:619.

114 Evans TJ. Endocrine alterations associated with ergopeptine alkaloid exposure during equine pregnancy. Vet Clin North Am Equine Pract. 2002;18:371.

115 Scanlon MF. Control of TRH and TSH secretion. In: Weetman AP, Grossman A, editors. Pharmacokinetics of the thyroid gland. New York: Springer-Verlag, 1997.

116 Messer NT, Riddle T, Traub-Dargatz JL, et al. Thyroid hormone levels in thoroughbred mares and their foals at parturition. Proceedings of the 44th Annual Forum of the American Association of Equine Practitioners. 1998:248.

117 Breuhaus BA. Thyroid function in adult horses consuming endophyte-infected fescue seed. J Am Vet Med Assoc. 2003;223:340.

118 Frank N, Sommardahl CS, Eiler H, et al. Effects of oral administration of levothyroxine sodium on concentrations of plasma lipids, concentration and composition of very—low-density lipoproteins, and glucose dynamics in healthy adult mares. Am J Vet Res. 2005;66:1032.

119 Bilezikian JP, Loeb JN, Gammon DE. The influence of hyperthyroidism and hypothyroidism on the β-adrenergic responsiveness of the turkey erythrocyte. J Clin Invest. 1979;63:184.

120 Stiles GL, Stadel JM, De Lean A, et al. Hypothyroidism modulates beta adrenergic receptor—adenylase cyclase interactions in rat reticulocytes. J Clin Invest. 1981;68:1450.

121 Lefkowitz RJ, Caron MG, Stiles GL. Mechanisms of membrane receptor regulation. Biochemical, physiological, and clinical insights derived from studies of the adrenergic receptors. N Engl J Med. 1984;310:1570.

122 Maqsood M. Iodinated casein therapy for the non-sweating syndrome in horses. Vet Rec. 1957;101:475.

123 Breuhaus BA. Thyroid function in anhidrotic horses. J Vet Intern Med. 2003;17:450.

124 Waldron-Mease E. Hypothyroidism and myopathy in racing thoroughbreds and standardbreds. J Equine Med Surg. 1979;3:124.

125 Harris P, Marlin D, Gray J. Equine thyroid function tests: a preliminary investigation. Br Vet J. 1992;148:71.

126 Valberg SJ, Mickelson JR, Gallant EM, et al. Exertional rhabdomyolysis in quarter horses and thoroughbreds: one syndrome, multiple aetiologies. Equine Vet J Suppl. 1999;30:533.

127 Gutierrez CV, Riddle WT, Bramlage LR. Serum thyroxine concentrations and pregnancy rates 15 to 16 days after ovulation in broodmares. J Am Vet Med Assoc. 2002;220:64.

128 Meredith TB, Dobrinski I. Thyroid function and pregnancy status in broodmares. J Am Vet Med Assoc. 2004;224:892.

129 Beech J, Garcia M. Hormonal response to thyrotropin-releasing hormone in healthy horses and in horses with pituitary adenoma. Am J Vet Res. 1985;46:1941.

130 Chen CL, Li WI. Effect of thyrotropin releasing hormone (TRH) on serum levels of thyroid hormones in thoroughbred mares. J Equine Vet Sci. 1986;6:58.

131 Held JP, Oliver JW. A sampling protocol for the thyrotropin-stimulating test in the horse. J Am Vet Med Assoc. 1984;184:326.

132 Lothrup CD, Nolan HL. Equine thyroid function assessment with the thyrotropin-releasing hormone response test. Am J Vet Res. 1986;47:942.

133 Sommardahl CS, Frank N, Elliott SB, et al. Effects of oral administration of levothyroxine sodium on serum concentrations of thyroid gland hormones and responses to injections of thyrotropin-releasing hormone in healthy adult mares. Am J Vet Res. 2005;66:1025.

134 Kaptein EM, MacIntyre SS, Weiner JM, et al. Free thyroxine estimate in nonthyroidal illness: comparison of eight methods. J Clin Endocrinol Metab. 1981;52:1073.

135 Ekins RP. Principles of measuring free thyroid hormone concentrations in serum. NucCompact. 1985;16:305.

136 Alexander NM. Free thyroxin in serum: labeled thyroxin-analog methods fall short of their mark. Clin Chem. 1986;32:417.

137 Nelson JC, Tomei RT. Direct determination of free thyroxin in undiluted serum by equilibrium dialysis/radioimmunoassay. Clin Chem. 1988;34:1737.

138 Herbomez M, Forzy G, Gasser F, et al. Clinical evaluation of nine free thyroxine assays: Persistent problems in particular populations. Clin Chem Lab Med. 2003;41:942.

139 Schachter S, Nelson RW, Scott-Moncrieff C, et al. Comparison of serum-free thyroxine concentrations determined by standard equilibrium dialysis, modified equilibrium dialysis, and 5 radioimmunoassays in dogs. J Vet Int Med. 2004;18:259.

140 Chen CL, McNulty ME, McNulty BA, et al. Serum levels of thyroxine and triiodothyronine in mature horses following oral administration of synthetic thyroxine (Synthroid R). J Equine Vet Sci. 1984;4:5.

141 Silver M, Fowden AL, Knox J, et al. Relationship between circulating tri-iodothyronine and cortisol in the perinatal period in the foal. J Reprod Fertil Suppl. 1991;44:619.

142 Irvine CHG, Evans MJ. Post-natal changes in total and free thyroxine and triiodothyronine in foal serum. J Reprod Fertil Suppl. 1975;23:709.

143 Chen CL, Riley AM. Serum thyroxine and triiodothyronine concentrations in neonatal foals and mature horses. Am J Vet Res. 1981;42:1415.

144 Breuhaus BA, LaFevers DH. Thyroid function in normal, sick and premature foals. J Vet Intern Med. 2005;19:445. (abstract)

145 Kaciuba-Uscilko H. The effect of previous thyroxine administration on the metabolic response to adrenaline in new-born pigs. Biol Neonate. 1971;19:220.

146 Hitchcock KR. Hormones and the lung. I. Thyroid hormones and glucocorticoids in lung development. Anat Rec. 1979;194:15.

147 Irvine CHG. Hypothyroidism in the foal. Equine Vet J. 1984;16:302.

148 Van Wassenaer AG, Kok JH, Briet JM, et al. Thyroid function in preterm newborns; is T4 treatment required in infants <27 weeks’ gestational age? Exp Clin Endocrinol Diabetes. 1997;105(Suppl 4):12.

149 Fisher DA. Hypothyroxinemia in premature infants: is thyroxine treatment necessary? Thyroid. 1999;9:715.

150 LaFranchi S. Thyroid function in the preterm infant. Thyroid. 1999;9:71.

151 Yeung MY, Smyth JP. Hormonal factors in the morbidities associated with extreme prematurity and the potential benefits of hormonal supplement. Biol Neonate. 2002;81:1.

152 Schoenberger W, Grimm W, Emmrich P, et al. Thyroid administration lowers mortality in premature infants. Lancet. 1979;2:1181.

153 Baker HJ, Lindsay JR. Equine goiter due to excess iodide. J Am Vet Med Assoc. 1968;153:1618.

154 Drew B, Barber WP, Williams DG. The effect of excess dietary iodine on pregnant mares and foals. Vet Rec. 1975;97:93.

155 Osame S, Shigeru I. Clinicopathological observations on thoroughbred foals with enlarged thyroid gland. J Vet Med Sci. 1994;56:771.

156 McLaughlin BG, Doige CE. A study of ossification of carpal and tarsal bones in normal and hypothyroid foals. Can Vet J. 1982;23:164.

157 McLaughlin BG, Doige CE, McLaughlan PS. Thyroid hormone levels in foals with congenital musculoskeletal lesions. Can Vet J. 1986;27:264.

158 Allen AL, CE Doige, PB Fretz, et al. Hyperplasia of the thyroid gland and concurrent musculoskeletal deformities in western Canadian foals: reexamination of a previously described syndrome. Can Vet J. 1994;35:31.

159 Allen AL, Townsend HGG, Doige CE, et al. A case-control study of the congenital hypothyroidism and dysmaturity syndrome of foals. Can Vet J. 1996;37:349.

160 Allen AL, Fretz PB, Card CE, et al. The effects of partial thyroidectomy on the development of the equine fetus. Equine Vet J. 1998;30:53.

161 Hines MT, Gay C, Talcott T. Congenital hypothyroidism and dysmaturity syndrome of foals: diagnosis and possible risk factor. Proceedings of the 15th Annual Forum of the American College of Veterinary Internal Medicine. 1997:363.

162 Johnson PJ. The equine metabolic syndrome peripheral Cushing’s syndrome. Vet Clin North Am Equine Pract. 2002;18:271.

163 Marchesini G, Forlani G, Cerrelli F, et al. WHO and ATPIII proposals for the definition of the metabolic syndrome in patients with type 2 diabetes. Diabet Med. 2004;21:383.

164 Treiber KH, Kronfeld DS, Hess TM, et al. Evaluation of genetic and metabolic predispositions and nutritional risk factors for pasture-associated laminitis in ponies. J Am Vet Med Assoc. 2006;228:1538.

165 Henneke DR, Potter GD, Kreider JL, et al. Relationship between condition score, physical measurements and body fat percentage in mares. Equine Vet J. 1983;15:371.

166 Frank N, Elliott SB, Brandt LE, et al. Physical characteristics, blood hormone concentrations, and plasma lipid concentrations in obese horses with insulin resistance. J Am Vet Med Assoc. 2006;228:1383.

167 Jeffcott LB, Field JR, McLean JG, et al. Glucose tolerance and insulin sensitivity in ponies and standardbred horses. Equine Vet J. 1986;18:97.

168 Johnson PJ, Scotty NC, Wiedmeyer C, et al. Diabetes mellitus in a domesticated Spanish mustang. J Am Vet Med Assoc. 2005;226:584., 542

169 Vervuert I, Coenen M, Dahlhoff S, et al. Fructan concentrations in grass, silages and hay. Proceedings of the 19th Equine Science Society Symposium. 2005:309.

170 Freestone JF, Beadle R, Shoemaker K, et al. Improved insulin sensitivity in hyperinsulinaemic ponies through physical conditioning and controlled feed intake. Equine Vet J. 1992;24:187.

171 Hawley JA. Exercise as a therapeutic intervention for the prevention and treatment of insulin resistance. Diabetes Metab Res Rev. 2004;20:383.

172 Reeves HJ, Lees R, McGowan CM. Measurement of basal serum insulin concentration in the diagnosis of Cushing’s disease in ponies. Vet Rec. 2001;149:449.

173 Breuhaus BA, Refsal KR, Beyerlein SL. Measurement of free thyroxine concentration in horses by equilibrium dialysis. J Vet Intern Med. 2006;20:371.

174 Ramirez S, Wolfsheimer KJ, Moore RM, et al. Duration of effects of phenylbutazone on serum total thyroxine and free thyroxine concentrations in horses. J Vet Intern Med. 1997;11:371.

175 Treiber KH, Kronfeld DS, Hess TM, et al. Use of proxies and reference quintiles obtained from minimal model analysis for determination of insulin sensitivity and pancreatic beta-cell responsiveness in horses. Am J Vet Res. 2005;66:2114.

176 Eiler H, Frank N, Andrews FM, et al. Physiologic assessment of blood glucose homeostasis via combined intravenous glucose and insulin testing in horses. Am J Vet Res. 2005;66:1598.

177 Kearns CF, McKeever KH, Kumagai K, et al. Fat-free mass is related to one-mile race performance in elite standardbred horses. Vet J. 2002;163:260.

178 Pass MA, Pollitt S, Pollitt CC. Decreased glucose metabolism causes separation of hoof lamellae in vitro: a trigger for laminitis? Equine Vet J Suppl. 1998;1998:133.

179 Slawik M, Vidal-Puig AJ. Lipotoxicity, overnutrition and energy metabolism in aging. Ageing Res Rev. 2006;5:144.

180 French KR, Pollitt CC. Equine laminitis: glucose deprivation and MMP activation induce dermo-epidermal separation in vitro. Equine Vet J. 2004;36:261.

181 Kim JA, Montagnani M, Koh KK, et al. Reciprocal relationships between insulin resistance and endothelial dysfunction: molecular and pathophysiological mechanisms. Circulation. 2006;113:1888.

182 Hoffman RM, Wilson JA, Kronfeld DS, et al. Hydrolyzable carbohydrates in pasture, hay, and horse feeds: direct assay and seasonal variation. J Anim Sci. 2001;79:500.

183 Cottrell E, Watts K, Ralston S. Soluble sugar content and glucose/insulin responses can be reduced by soaking chopped hay in water. Proceedings of the 19th Equine Science Society Symposium. 2005:293-298.

184 Hoffman RM, Boston RC, Stefanovski D, et al. Obesity and diet affect glucose dynamics and insulin sensitivity in thoroughbred geldings. J Anim Sci. 2003;81:2333.

185 Allen EM, Meyer W, Ralston SL, et al. Variation in soluble sugar content of pasture and turf grasses. Proceedings of the 19th Equine Science Society Symposium. 2005:321.

186 Frank N, Sommardahl CS, Eiler H, et al. Effects of oral administration of levothyroxine sodium on concentrations of plasma lipids, concentration and composition of very—low-density lipoproteins, and glucose dynamics in healthy adult mares. Am J Vet Res. 2005;66:1032.

187 Ott EA, Kivipelto J. Influence of chromium tripicolinate on growth and glucose metabolism in yearling horses. J Anim Sci. 1999;77:3022.

188 Kearns CF, McKeever KH, Malinowski K. Changes in adiponectin, leptin, and fat mass after clenbuterol treatment in horses. Med Sci Sports Exerc. 2006;38:262.

189 Rosol TJ, Capen CC. Calcium-regulating hormones and diseases of abnormal mineral (calcium, phosphorus, magnesium) metabolism. In: Kaneko JJ, Harvey JW, Bruss ML, editors. Clinical biochemistry of domestic animals. ed 5. San Diego: Academic Press; 1997:619.

190 Toribio RE. Disorders of the endocrine system. In: Reed SM, Bayly WM, Sellon DC, editors. Equine internal medicine. St Louis: Saunders; 2004:1295.

191 Lopez I, Estepa JC, Mendoza FJ, et al. Fractionation of calcium and magnesium in equine serum. Am J Vet Res. 2006;67:463.

192 Kohn CW, Brooks CL. Failure of pH to predict ionized calcium percentage in healthy horses. Am J Vet Res. 1990;51:1206.

193 Toribio RE, Kohn CW, Chew DJ, et al. Comparison of serum parathyroid hormone and ionized calcium and magnesium concentrations and fractional urinary clearance of calcium and phosphorus in healthy horses and horses with enterocolitis. Am J Vet Res. 2001;62:938.

194 Jordan RM, Meyers VS, Yoho B, et al. Effect of calcium and phosphorus levels on growth, reproduction, and bone development of ponies. J Anim Sci. 1975;40:78.

195 Schryver HF, Hintz HF, Lowe JE. Calcium and phosphorus in the nutrition of the horse. Cornell Vet. 1974;64:493.

196 Breidenbach A, Schlumbohm C, Harmeyer J. Peculiarities of vitamin D and of the calcium and phosphate homeostatic system in horses. Vet Res. 1998;29:173.

197 Toribio RE, Kohn CW, Capen CC, et al. Parathyroid hormone (PTH) secretion, PTH mRNA and calcium-sensing receptor mRNA expression in equine parathyroid cells, and effects of interleukin (IL)-1, IL-6, and tumor necrosis factor-alpha on equine parathyroid cell function. J Mol Endocrinol. 2003;31:609.

198 Toribio RE, Kohn CW, Sams RA, et al. Hysteresis and calcium set-point for the calcium parathyroid hormone relationship in healthy horses. Gen Comp Endocrinol. 2003;130:279.

199 Schryver HF, Craig PH, Hintz HF, et al. The site of calcium absorption in the horse. J Nutr. 1970;100:1127.

200 McKenzie EC, Valberg SJ, Godden SM, et al. Plasma and urine electrolyte and mineral concentrations in thoroughbred horses with recurrent exertional rhabdomyolysis after consumption of diets varying in cation-anion balance. Am J Vet Res. 2002;63:1053.

201 Endres DB, Rude RK. Mineral and bone metabolism. In: Burtis CA, Ashwood ER, Bruns DE, editors. Tietz textbook of clinical chemistry and molecular diagnostics. ed 4. St Louis: Elsevier; 2006:1891.

202 Schryver HF, Hintz HF, Craig PH, et al. Site of phosphorus absorption from the intestine of the horse. J Nutr. 1972;102:143.

203 Mundy GR, Guise TA. Hormonal control of calcium homeostasis. Clin Chem. 1999;45:1347.

204 Wysolmerski JJ, Stewart AF. The physiology of parathyroid hormone-related protein: an emerging role as a developmental factor. Annu Rev Physiol. 1998;60:431.

205 Berndt TJ, Schiavi S, Kumar R. “Phosphatonins” and the regulation of phosphorus homeostasis. Am J Physiol Renal Physiol. 2005;289:F1170.

206 Brown EM, MacLeod RJ. Extracellular calcium sensing and extracellular calcium signaling. Physiol Rev. 2001;81:239.

207 Ritchie G, Kerstan D, Dai LJ, et al. 1,25(OH)(2)D(3) stimulates Mg2+ uptake into MDCT cells: modulation by extracellular Ca2+ and Mg2+. Am J Physiol Renal Physiol. 2001;280:F868.

208 Szabo A, Merke J, Beier E, et al. 1,25(OH)2 vitamin D3 inhibits parathyroid cell proliferation in experimental uremia. Kidney Int. 1989;35:1049.

209 Toribio RE, Kohn CW, Leone GW, et al. Molecular cloning and expression of equine calcitonin, calcitonin gene-related peptide-I, and calcitonin gene-related peptide-II. Mol Cell Endocrinol. 2003;199:119.

210 Karcher LF, Le Net JL, Turner BF, et al. Pseudohyperparathyroidism in a mare associated with squamous cell carcinoma of the vulva. Cornell Vet. 1990;80:153.

211 Marr CM, Love S, Pirie HM. Clinical, ultrasonographic and pathological findings in a horse with splenic lymphosarcoma and pseudohyperparathyroidism. Equine Vet J. 1989;21:221.

212 Meuten DJ, Price SM, Seiler RM, et al. Gastric carcinoma with pseudohyperparathyroidism in a horse. Cornell Vet. 1978;68:179.

213 Refsal KR, Provencher-Bolliger AL, Graham PA, et al. Update on the diagnosis and treatment of disorders of calcium regulation. Vet Clin North Am Small Anim Pract. 2001;31:1043.

214 Rosol TJ, Nagode LA, Robertson JT, et al. Humoral hypercalcemia of malignancy associated with ameloblastoma in a horse. J Am Vet Med Assoc. 1994;204:1930.

215 Barton MH, Sharma P, LeRoy BE, et al. Hypercalcemia and high serum parathyroid hormone-related protein concentration in a horse with multiple myeloma. J Am Vet Med Assoc. 2004;225:409.

216 Aguilera-Tejero E, Estepa JC, Lopez I, et al. Polycystic kidneys as a cause of chronic renal failure and secondary hypoparathyroidism in a horse. Equine Vet J. 2000;32:167.

217 Couetil LL, Sojka JE, Nachreiner RF. Primary hypoparathyroidism in a horse. J Vet Intern Med. 1998;12:45.

218 Frank N, Hawkins JF, Couetil LL, et al. Primary hyperparathyroidism with osteodystrophia fibrosa of the facial bones in a pony. J Am Vet Med Assoc. 1998;212:84.

219 Ronen N, Van Heerden J, van Amstel SR. Clinical and biochemistry findings, and parathyroid hormone concentrations in three horses with secondary hyperparathyroidism. J S Afr Vet Assoc. 1992;63:134.

220 Elfers RS, Bayly WM, Brobst DF, et al. Alterations in calcium, phosphorus and C-terminal parathyroid hormone levels in equine acute renal disease. Cornell Vet. 1986;76:317.

221 Harrington DD, Page EH. Acute vitamin D3 toxicosis in horses: case reports and experimental studies of the comparative toxicity of vitamins D2 and D3. J Am Vet Med Assoc. 1983;182:1358.

222 Aguilera-Tejero E, Estepa JC, Lopez I, et al. Plasma ionized calcium and parathyroid hormone concentrations in horses after endurance rides. J Am Vet Med Assoc. 2001;219:488.

223 Beyer MJ, Freestone JF, Reimer JM, et al. Idiopathic hypocalcemia in foals. J Vet Intern Med. 1997;11:356.

224 Helman RG, Edwards WC. Clinical features of blister beetle poisoning in equids: 70 cases (1983–1996). J Am Vet Med Assoc. 1997;211:1018.

225 Dart AJ, Snyder JR, Spier SJ, et al. Ionized calcium concentration in horses with surgically managed gastrointestinal disease: 147 cases (1988–1990). J Am Vet Med Assoc. 1992;201:1244.

226 Garcia-Lopez JM, Provost PJ, Rush JE, et al. Prevalence and prognostic importance of hypomagnesemia and hypocalcemia in horses that have colic surgery. Am J Vet Res. 2001;62:7.

227 Carlson GP, Mansmann RA. Serum electrolyte and plasma protein alterations in horses used in endurance rides. J Am Vet Med Assoc. 1974;165:262.

228 Hudson NP, Church DB, Trevena J, et al. Primary hypoparathyroidism in two horses. Aust Vet J. 1999;77:504.

229 Baird JD. Lactation tetany (eclampsia) in a Shetland pony mare. Aust Vet J. 1971;47:402.

230 Schoeb TR, Panciera RJ. Blister beetle poisoning in horses. J Am Vet Med Assoc. 1978;173:75.

231 Vandeplassche M, Spincemaille J, Bouters R. Aetiology, pathogenesis and treatment of retained placenta in the mare. Equine Vet J. 1971;3:144.

232 Swartzman JA, Hintz HF, Schryver HF. Inhibition of calcium absorption in ponies fed diets containing oxalic acid. Am J Vet Res. 1978;39:1621.

233 Bienfet V, Dewaele A, Van Essch R. A primary parathyroid disorder. Osteofibrosis caused by a parathyroid adenoma in a Shetland pony. Ann Med Vet. 1964;108:252.

234 Krook L, Lowe JE. Nutritional secondary hyperparathyroidism in the horse. Pathol Vet. 1964;65:26.

235 Peauroi JR, Fisher DJ, Mohr FC, et al. Primary hyperparathyroidism caused by a functional parathyroid adenoma in a horse. J Am Vet Med Assoc. 1998;212:1915.

236 Roussel AJ, Thatcher CD. Primary hyperparathyroidism in a pony mare. Compend Cont Educ (Equine Pract). 1987;9:781.

237 Brobst DF, Bayly WM, Reed SM. Parathyroid hormone evaluation in normal horses and horses with renal failure. Equine Vet Sci. 1982;2:150.

238 Argenzio RA, Lowe JE, Hintz HF, et al. Calcium and phosphorus homeostasis in horses. J Nutr. 1974;104:18.

239 Clarke CJ, Roeder PL, Dixon PM. Nasal obstruction caused by nutritional osteodystrophia fibrosa in a group of Ethiopian horses. Vet Rec. 1996;138:568.

240 Freestone JF, Seahorn TL. Miscellaneous conditions of the equine head. Vet Clin North Am Equine Pract. 1993;9:235.

241 Bertone JJ. Nutritional secondary hyperparathyroidism. In: Robinson NE, editor. Current therapy in equine medicine. ed 3. Philadelphia: Saunders; 1992:119.

242 Estepa JC, Aguilera-Tejero E, Zafra R, et al. An unusual case of generalized soft-tissue mineralization in a suckling foal. Vet Pathol. 2006;43:64.

243 Boland RL. Solanum malacoxylon: a toxic plant which affects animal calcium metabolism. Biomed Environ Sci. 1988;1:414.

244 Krook L, Wasserman RH, Shively JN, et al. Hypercalcemia and calcinosis in Florida horses: implication of the shrub, Cestrum diurnum, as the causative agent. Cornell Vet. 1975;65:26.

245 Muylle E, Oyaert W, de Roose P, et al. Hypercalcaemia and mineralisation of non-osseous tissues in horses due to vitamin-D toxicity. Zentralbl Veterinarmed A. 1974;21:638.

246 Worker NA, Carrillo BJ. “Enteque seco,” calcification and wasting in grazing animals in the Argentine. Nature. 1967;215:72.

247 Harrington DD. Acute vitamin D2 (ergocalciferol) toxicosis in horses: case report and experimental studies. J Am Vet Med Assoc. 1982;180:867.

248 Kasali OB, Krook L, Pond WG, et al. Cestrum diurnum intoxication in normal and hyperparathyroid pigs. Cornell Vet. 1977;67:190.

249 Suva LJ, Winslow GA, Wettenhall RE, et al. A parathyroid hormone-related protein implicated in malignant hypercalcemia: cloning and expression. Science. 1987;237:893.

250 Schryver HF, Hintz HF. Minerals. In: Robinson NE, editor. Current therapy in equine medicine. ed 2. Philadelphia: Saunders; 1987:393.

251 National Research Council. Nutrient requirements of horses, ed 5. Washington, DC: National Academies Press, 1989.

252 Maenpaa PH, Lappetelainen R, Virkkunen J. Serum retinol, 25-hydroxyvitamin D and alpha-tocopherol of racing trotters in Finland. Equine Vet J. 1987;19:237.

253 Maenpaa PH, Koskinen T, Koskinen E. Serum profiles of vitamins A, E and D in mares and foals during different seasons. J Anim Sci. 1988;66:1418.

254 Taylor EJ. Dorland’s illustrated medical dictionary, ed 26, Philadelphia: Saunders; 2003:977.

255 Holtenius P, Holtenius K. New aspects of ketone bodies in energy metabolism of dairy cows: a review. Zentralbl Veterinarmed A. 1996;43:579.

256 Bergman EN. Glucose metabolism in ruminants as related to hypoglycemia and ketosis. Cornell Vet. 1973;63:341.

257 Baird GD, Heitzman RJ, Hibbitt KG, et al. Bovine ketosis: a review with recommendations for control and treatment, Part I. Br Vet J. 1974;130:214.

258 Moe PW, Tyrrell HF, Flatt WP. Energetics of body tissue mobilization. J Dairy Sci. 1971;54:548.

259 Andersson L, Lundstrom K. Effect of feeding silage with high butyric acid content on ketone body formation and milk yield in postparturient dairy cows. Zentralbl Veterinarmed. 1985;32:15.

260 Lane MA, Baldwin RL, Jesse BW. Developmental changes in ketogenic enzyme during sheep rumen development. J Anim Sci. 2002;80:11538.

261 Bergman EN. Hyperketonemia-ketogenesis and ketone body metabolism. J Dairy Sci. 1971;54:936.

262 Hibbitt KG. Bovine ketosis and its prevention. Vet Rec. 1979;105:13.

263 Mills SE, Beitz DC, Young JW. Characterization of metabolic changes during a protocol for inducing lactation ketosis in dairy cows. J Dairy Sci. 1986;69:352.

264 National Research Council. Nutrient requirements of dairy cattle, ed 7. Washington, DC: National Academies Press, 2001.

265 Tveit B, Lingaas F, Svendsen M, et al. Etiology of acetonemia in Norwegian cattle. 1. Effect of ketogenic silage, season, energy level and genetic factors. J Dairy Sci. 1992;75:2421.

266 Lingaas F, Tveit B. Etiology of acetonemia in Norwegian cattle. 2. Effect of butyric acid, valeric acid, and putrescine. J Dairy Sci. 1992;75:2433.

267 Marston HR, Allen SH, Smith RM. Primary metabolic defect supervening on vitamin B12 deficiency in the sheep. Nature. 1961;190:1085.

268 Blood DC, Radostits OM. Veterinary medicine, ed 7, London: Baillière Tindall; 1989:1131.

269 Rice DA, McMurray CH, Davidson JF. Ketosis in dairy cows caused by low levels of lincomycin in concentrate feed. Vet Rec. 1983;113:495.

270 Lean IJ, Baldwin RL, Troutt HF, et al. Impact of bovine somatotropin administration beginning at day 70 of lactation on serum metabolites, milk constituents, and production in cows previously exposed to exogenous somatotropin. Am J Vet Res. 1992;53:731.

271 Cole WJ, Eppard PJ, Boysen BG, et al. Response of dairy cows to high doses of a sustained-release bovine somatotropin administered during two lactations. 2. Health and reproduction. J Dairy Sci. 1992;75:111.

272 LeBlanc SJ, Leslie KE, Duffield TF. Metabolic predictors of displaced abomasum in dairy cattle. J Dairy Sci. 2005;88:159.

273 Shultz LH. Management and nutritional aspects of ketosis. J Dairy Sci. 1971;54:962.

274 Lacetera N, Franci O, Scalia D, et al. Effects of nonesterified fatty acids and beta-hydroxybutyrate on functions of mononuclear cells obtained from ewes. Am J Vet Res. 2002;63:414.

275 Robertson A, Thin C. A study of starvation ketosis in the ruminant. Br J Nutr. 1953;7:181.

276 Kauppinen K. Correlation of whole blood concentrations of acetoacetate, beta-hydroxybutyrate, glucose and milk yield in dairy cows as studied under field conditions. Acta Vet Scand. 1983;24:337.

277 Baird GD. Primary ketosis in the high-producing dairy cow: clinical and subclinical disorders, treatment, prevention, and outlook. J Dairy Sci. 1982;65:1.

278 Whitaker DA, Kelly JM, Smith EJ. Subclinical ketosis and serum beta-hydroxybutyrate levels in dairy cattle. Br Vet J. 1983;139:462.

279 Thin C, Robertson A. Biochemical aspects of ruminant ketosis. J Comp Pathol. 1953;63:184.

280 Emery RS, Burg N, Brown LD, et al. Detection, occurrence and prophylactic treatment of borderline ketosis with propylene glycol feeding. J Dairy Sci. 1964;47:1074.

281 Andersson L. Concentrations of blood and milk ketone bodies, blood isopropanol and plasma glucose in dairy cows in relation to the degree of hyperketonaemia and clinical signs. Zentralbl Veterinarmed A. 1984;31:683.

282 Duffield TF, Sandals D, Leslie KE, et al. Efficacy of monensin for the prevention of subclinical ketosis in lactating dairy cows. J Dairy Sci. 1998;81:2866.

283 Carrier J, Stewart S, Godden S, et al. Evaluation and use of three cowside tests for detection of subclinical ketosis in early postpartum cows. J Dairy Sci. 2004;87:3725.

284 Geishauser T, Leslie K, Tenhag J, et al. Evaluation of eight cow-side ketone tests in milk for detection of subclinical ketosis in dairy cows. J Dairy Sci. 2000;83:296.

285 Perkins N, Gooijer L, Leslie K, et al. Evaluation of an on-site test for NEFA in bovine serum. Abstract available at http://www.vetdx.biz

286 Oetzel GR. Herd-based biological testing for metabolic disorders. Preconvention Seminar 7, American Association of Bovine Practitioners 36th Annual Conference, Columbus, Ohio. 2003. September

287 Manston R, Rowlands GJ, Little W, et al. Variability of the blood composition of dairy cows in relation to time of day. J Agric Sci (Camb). 1981;96:593.

288 Andersson L, Lundstrom K. : Milk and ketone bodies, blood isopropanol and plasma glucose in dairy cows: methodological studies and diurnal variations. Zentralbl Veterinarmed A. 1984;31:340.

289 Garry FB, Fettman MJ, Curtis CR, et al. Serum bile acid concentrations in dairy cows with hepatic lipidosis. J Vet Intern Med. 1994;8:432.

290 West HJ. Effect on liver function of acetonaemia and the fat cow syndrome cattle. Res Vet Sci. 1990;48:221.

291 Bobe G, Young JW, Beitz DC. Invited review: pathology, etiology, prevention, and treatment of fatty liver in dairy cows. J Dairy Sci. 2004;87:3105.

292 Herdt TH. Ruminant adaptation to negative energy balance: influences on the etiology of ketosis and fatty liver. Vet Clin North Am Food Anim Pract. 2000;16:215.

293 Kaske M, Kraeft S, Herzog K, et al. Pancreatic insulin response and tissue responsiveness to insulin in dry cows, lactating cows and cows suffering from fatty liver and ketosis. Proceedings of the 22nd Annual Forum of the American College of Veterinary Internal Medicine. 2004:239. June

294 Chilliard Y, Delavaud C, Bonnet M. Leptin expression in ruminants: nutritional and physiological regulations in relation with energy metabolism. Domest Anim Endocrinol. 2005;29:3.

295 Vernon RG. Lipid metabolism during lactation: a review of adipose tissue-liver interactions and the development of fatty liver. J Dairy Res. 2005;72:460.

296 Herdt TH. Fuel homeostasis in the ruminant. Vet Clin North Am Food Anim Pract. 1988;4:216.

297 Baxter CF, Kleiber M, Black AL. Glucose metabolism in the lactating dairy cow. Biochim Biophys Acta. 1955;17:354.

298 Dohoo IR, Martin SW. Subclinical ketosis: prevalence and associations with production and disease. Can J Comp Med. 1984;48:1.

299 Kauppinen K. Prevalence of bovine ketosis in relation to number and stage of lactation. Acta Vet Scand. 1983;24:349.

300 Grohn Y, Thompson JR, Bruss ML. Epidemiology and genetic basis of ketosis in Finnish Ayrshire cattle. Prev Vet Med. 1984;3:65.

301 Henricson B, Jonsson G, Pehrson B. “Lipid pattern,” glucose concentration and ketone body level in the blood of cattle. Zentralbl Veterinarmed A. 1977;24:89.

302 Bendixen PH, Vilson B, Ekesbo I, et al. Disease frequencies in dairy cows in Sweden. IV. Ketosis. Prev Vet Med. 1987;5:99.

303 Duffield T. Impact of subclinical ketosis on health and production of lactating dairy cattle. Proceedings of the 23rd Annual Forum of the American College of Veterinary Internal Medicine, Baltimore, June. 2005:243.

304 Dohoo IR, Martin SW. Disease, production and culling in Holstein-Friesian cows. III. Disease and production as determinants of disease. Prev Vet Med. 1984;2:671.

305 Andersson L, Emanuelson U. An epidemiological study of hyperketonaemia in Swedish dairy cows: determinants and the relation to fertility. Prev Vet Med. 1985;3:449.

306 Markusfeld O, Nahari N, Adler H. Evaluation of a routine testing for ketonuria and aciduria in the detection of sub and clinical ketosis associated with overfeeding in dairy cattle. Bovine Pract. 1984;19:219.

307 Bines JA, Morant SV. The effect of body condition on metabolic changes associated with intake of food by the cow. Br J Nutr. 1983;50:81.

308 Riemann HP, Larssen RB, Simensen E. Ketosis in Norwegian dairy herds; some epidemiological associations. Acta Vet Scand. 1985;26:482.

309 Kung LJr, Huber JT. Performance of high-producing cows in early lactation fed protein of varying amounts, sources and degradability. J Dairy Sci. 1983;66:227.

310 Andersson L, Lundstrom K. Effect of energy balance on plasma glucose and ketone bodies in blood and milk and influence of hyperketonaemia on milk production of postparturient dairy cows. Zentralbl Veterinarmed A. 1984;31:539.

311 Cote JF, Curtis RA, McSherry BJ, et al. Bovine ketosis: frequency of clinical signs, complications and alterations in blood ketones, glucose and free fatty acids. Can Vet J. 1969;10:179.

312 Kauppinen K. Annual milk yield and reproductive performance of ketotic and nonketotic dairy cows. Zentralbl Veterinarmed A. 1984;31:694.

313 Dohoo IR, Martin SW. Disease, production and culling in Holstein-Friesian cows. IV. Effects of disease on production. Prev Vet Med. 1984;2:755.

314 Simianer H, Solbu H, Schaeffer LR. Estimated genetic correlations between disease and yield traits in dairy cattle. J Dairy Sci. 1991;74:4358.

315 Dohoo IR, Martin SW. Disease, production and culling in Holstein-Friesian cows. V. Survivorship. Prev Vet Med. 1984;2:771.

316 Herdt TH, Emery RS. Therapy of diseases of ruminant intermediary metabolism. Vet Clin North Am Food Anim Pract. 1992;8:91.

317 Kaske M, Rehage J. Medical management of ketosis and fatty liver. Proceedings of the 22nd Annual Forum of the American College of Veterinary Internal Medicine, Minneapolis. 2004:241.

318 Kronfeld DS. Metabolic disorders. Amstutz HE, editor. Bovine medicine and surgery, ed 2, vol I. Santa Barbara, Calif: American Veterinary Publications, 1980;537.

319 Nielsen NI, Ingvartsen KL. Propylene glycol for dairy cows. A review of the metabolism of propylene glycol and its effects on physiological parameters, feed intake, milk production and risk of ketosis. Anim Feed Sci Technol. 2004;5:191.

320 Hoedemaker M, Prange D, Zerbe H, et al. Peripartal propylene glycol supplementation and metabolism, animal health, fertility and production in dairy cows. J Dairy Sci. 2004;87:2136.

321 Goff JP, Horst RL. Oral glycerol as an aid in the treatment of ketosis/fatty liver complex. J Dairy Sci. 2001;84(Suppl 1):153. (abstract)

322 DeFrain JM, Hippen AR, Kalscheur KF, et al. Feeding glycerol to transition dairy cows: effects on blood metabolites and lactation performance. J Dairy Sci. 2004;87:4195.

323 Andersson L, Olsson T. The effect of two glucocorticoids on plasma glucose and milk production in healthy cows and the therapeutic effect in ketosis. Nord Vet Med. 1984;36:13.

324 Foster LA. Clinical ketosis. Vet Clin North Am Food Anim Pract. 1988;4:253.

325 Heitzman RJ, Walker MS. The antiketogenic action of an anabolic steroid administered to ketotic cows. Res Vet Sci. 1973;15:70.

326 Hayirli A, Bertics SJ, Grummer RR. Effects of slow-release insulin on production, liver triglyceride, and metabolic profiles of Holsteins in early lactation. J Dairy Sci. 2002;85:2180.

327 Hove K. Insulin secretion in lactating cows: responses to glucose infused intravenously in normal, ketonemic, and starved animals. J Dairy Sci. 1978;61:1407.

328 Andersen JB, Mashek DG, Larsen T, et al. Effects of hyperinsulinaemia under euglycaemic condition on liver fat metabolism in dairy cows in early and mid-lactation. J Vet Med A. 2002;49:65.

329 Bobe G, Ametaj BN, Young JW, et al. Effects of exogenous glucagons on lipids in lipoproteins and liver of lactating dairy cows. J Dairy Sci. 2003;86:2895.

330 Bach SJ, Hibbitt KG. The therapeutic use of cysteamine in bovine ketosis. Vet Rec. 1960;72:797.

331 Lewis EF, Price EK. The use of choline chloride as a lipotrophic agent in the treatment of bovine liver dysfunction. Br Vet J. 1957;113:242.

332 D-L-Methionine powder (package insert), Columbus, Ohio: Butler

333 Croom WJ, Rakes AH, Linnerud AC, et al. Vitamin B12 administration for milk fat synthesis in lactating dairy cows fed a low-fiber diet. J Dairy Sci. 1981;64:1555.

334 Bryan MA, Socha MT, Tomlinson DJ. Supplementing intensively grazed late-gestation dairy cattle with chromium. J Dairy Sci. 2004;87:4269.

335 Kronfeld DS, Raggi F. Nicotinamide coenzyme concentrations in mammary biopsy samples from ketotic cows. Biochem J. 1964;90:219.

336 Dufva GS, Bartley EE, Dayton AD, et al. Effect of niacin supplementation on milk production and ketosis of dairy cattle. J Dairy Sci. 1983;66:2329.

337 Gorganov KH, Gabrovski P, Zhelyazkov S, et al. Therapeutic and prophylactic effect of monensin and nicotinic acid in cows with subclinical ketosis. Vet Nauki. 1984;21:43. (abstract)

338 Ruegsegger GJ, Shultz LH. Use of a combination of propylene glycol and niacin for subclinical ketosis. J Dairy Sci. 1986;69:1411.

339 Rosendo O, Staples CR, McDowell LR, et al. Effects of biotin supplementation on peripartum performance and metabolites of Holstein cows. J Dairy Sci. 2004;87:2535.

340 Grummer RR, Carroll DJ. Effects of dietary fat on metabolic disorders and reproductive performance of dairy cattle. J Anim Sci. 1991;69:3838.

341 Pickett MM, Piepenbrink MS, Overton TR. Effects of propylene glycol or fat drench on plasma metabolites, liver composition, and production of dairy cows during the periparturient period. J Dairy Sci. 2003;86:2113.

342 Wood GM, Boettcher PJ, Kelton DF, et al. Phenotypic and genetic influences on test-day measures of acetone concentration in milk. J Dairy Sci. 2004;87:1108.

343 Larsen T, Nielsen NI. Fluorometric determination of beta-hydroxybutyrate in milk and blood plasma. J Dairy Sci. 2005;88:2004.

344 Nielsen NI, Friggens NC, Chagunda MGG, et al. Predicting risk of ketosis in dairy cows using in-line measurements of beta-hydroxybutyrate: a biological model. J Dairy Sci. 2005;88:2441.

345 Cox VS. Nonsystemic causes of the downer cow syndrome. Vet Clin North Am Food Anim Pract. 1988;4:413.

346 Gaynor PJ, Mueller FJ, Miller JK, et al. Parturient hypocalcemia in Jersey cows fed alfalfa haylage—based diets with different cation to anion ratios. J Dairy Sci. 1989;72:2525.

347 Phillippo M, Reid GW, Nevison IM. Parturient hypocalcaemia in dairy cows: effects of dietary acidity on plasma minerals and calciotrophic hormones. Res Vet Sci. 1994;56:303.

348 Goff JP, Horst RL, Mueller FJ, et al. Addition of chloride to a prepartal diet high in cations increases 1,25-dihydroxyvitamin D response to hypocalcemia preventing milk fever. J Dairy Sci. 1991;74:3863.

349 Stewart PA. Modern quantitative acid-base chemistry. Can J Physiol Pharmacol. 1983;61:1444.

350 Jardon P. Using urine pH to monitor anionic salt programs. Compend Cont Educ (Pract Vet). 1995;17:860.

351 Barton BA, Jorgensen NA, DeLuca HF. Impact of prepartum dietary phosphorus intake on calcium homeostasis at parturition. J Dairy Sci. 1987;70:1186.

352 Kichura TS, Horst RL, Beitz DC, et al. Relationships between prepartal dietary calcium and phosphorus, vitamin D metabolism, and parturient paresis in dairy cows. J Nutr. 1982;112:480.

353 Jorgensen NA. Combating milk fever. J Dairy Sci. 1974;57:933.

354 National Research Council. Nutrient requirements of dairy cattle. Washington DC: National Academies Press, 2000.

355 Thilsing-Hansen T, Jorgensen RJ, Enemark JM, et al. The effect of zeolite A supplementation in the dry period on blood mineral status around calving. Acta Vet Scand Suppl. 2003;97:87.

356 Littledike ET, Horst RL. Vitamin D3 toxicity in dairy cows. J Dairy Sci. 1982;65:749.

357 Sachs M, Bar A, Cohen R, et al. Use of 1 α-hydroxycholecalciferol in the prevention of bovine parturient paresis. Am J Vet Res. 1977;38:2039.

358 Goff JP, Horst RL. Effect of subcutaneously released 24F-1,25-dihydroxyvitamin D3 on incidence of parturient paresis in dairy cows. J Dairy Sci. 1990;73:406.

359 Rude RK. Magnesium deficiency: a cause of heterogeneous disease in humans. J Bone Miner Res. 1998;13:749.

360 Littledike ET, Stuedemann JA, Wilkinson SR, et al. Grass tetany syndrome. In: Fontenot J, editor. Role of magnesium in animal nutrition. Blacksburg: Virginia Polytechnic Institute and State University, 1983.

361 Goff JP, Horst RL. Oral administration of calcium salts for treatment of hypocalcemia in cattle. J Dairy Sci. 1993;76:101.

362 Greene LW, Fontenot JP, Webb KEJr. Site of magnesium and other macromineral absorption in steers fed high levels of potassium. J Anim Sci. 1983;57:503.

363 Martens H, Schweigel M. Pathophysiology of grass tetany and other hypomagnesemias. Implications for clinical management. Vet Clin North Am Food Anim Pract. 2000;16:339.

364 Greene LW, Schelling GT, Byers FM. Effects of dietary monensin and potassium on apparent absorption of magnesium and other macroelements in sheep. J Anim Sci. 1986;63:1960.

365 Puls R. Mineral levels in animal health: diagnostic data, ed 2. Clearbrook: International Press, 1994.

366 Ram L, Schonewille JT, Martens H, et al. Magnesium absorption by wethers fed potassium bicarbonate in combination with different dietary magnesium concentrations. J Dairy Sci. 1998;81:2485.

367 Wright RD, Blair-West JR, Nelson JF, et al. Evaluation of the biological properties of parathyroid hormone and analogues in a vascularly isolated parotid gland-based assay. J Endocrinol. 1984;102:375.

368 Cheng Y, Goff JP, Horst RL. Restoring normal blood phosphorus concentrations in hypophosphatemic cattle with sodium phosphate. Vet Med. 1998;4:383.

369 Wu Z, Satter LD. Milk production and reproductive performance of dairy cows fed different amounts of phosphorus. J Dairy Sci. 1999;82(Suppl):68.

370 Sweeney RW. Treatment of potassium balance disorders. Vet Clin North Am Food Anim Pract. 1999;15:609.

371 Sielman ES, Sweeney RW, Whitlock RH, et al. Hypokalemia syndrome in dairy cows: 10 cases (1992–1996). J Am Vet Med Assoc. 1997;210:240.

372 Sattler N, Fecteau G, Girard C, et al. Description of 14 cases of bovine hypokalaemia syndrome. Vet Rec. 1998;143:503.

373 Johns IC, Whitlock RH, Sweeney RW. Hypokalaemia as a cause of recumbency in an adult dairy cow. Aust Vet J. 2004;82:413.

374 Lindeman RD. Hypokalemia: causes, consequences and correction. Am J Med Sci. 1976;272:5.

375 Brobst D. Review of the pathophysiology of alterations in potassium homeostasis. J Am Vet Med Assoc. 1986;188:1019.

376 Dow SW, LeCouteur RA, Fettman MJ, et al. Potassium depletion in cats: hypokalemic polymyopathy. J Am Vet Med Assoc. 1987;191:1563.

377 Vita G, Bartolone S, Santoro M, et al. Hypokalemic myopathy in pseudohyperaldosteronism induced by fluoroprednisolone-containing spray. Clin Neuropathol. 1987;6:80.

378 Johnson PJ, Goetz TE, Foreman JH, et al. Effect of whole-body potassium depletion on plasma, erythrocyte, and middle gluteal muscle potassium concentration of healthy, adult horses. Am J Vet Res. 1991;52:1676.

379 Sattler N, Fecteau G, Couture Y, et al. [Determination of the potassium balances in dairy cows and the examination of daily and lactation period-associated variations]. Can Vet J. 2001;42:107.

380 Neff AW, Connor AD, Bryan HS. Studies on 9α-fluoroprednisolone acetate, a new synthetic corticosteroid for the treatment of bovine ketosis. J Dairy Sci. 1960;43:553.

381 Sattler N, Fecteau G, Pare J. Experimental reproduction of the bovine hypokalemia syndrome. J Vet Intern Med. 2002;16:337.

382 Spital A, Sterns RH. Extrarenal potassium adaptation: review of a concept. Am J Nephrol. 1995;15:367.

383 Guyton AC, Hall JE. Transport of ions and molecules through the cell membrane. In: Guyton AC, Hall JE, editors. Textbook of medical physiology. Philadelphia: Saunders; 1996:43.

384 Guyton AC, Hall JE. Membrane potentials and action potentials. In: Guyton AC, Hall JE, editors. Textbook of medical physiology. Philadelphia: Saunders; 1996:57.

385 Commerford PJ, Lloyd EA. Arrhythmias in patients with drug toxicity, electrolyte and endocrine disturbances. Med Clin North Am. 1984;68:1051.

386 Knochel JP. Mechanisms of rhabdomyolysis. Curr Opin Rheumatol. 1993;5:725.

387 Tadei A, Delhumeau A, Geslin Ph, et al. [Diagnostic des déplétions potassiques en milieu cardiologique. Intérêt de la mesure du potassium échangeable et du potassium érythrocytaire]. Sem Hop Paris. 1974;50:2867.

388 Guyton AC, Hall JE. Pituitary hormones and their control by the hypothalamus. In Guyton AC, Hall JE, editors: Textbook of medical physiology, ed 11, Philadelphia: Saunders, 2006.

389 Hart IC, Bines JA, Morant SV. The secretion and metabolic clearance rates of growth hormone, insulin and prolactin in high- and low-yielding cattle at four stages of lactation. Life Sci. 1980;27:1839.

390 Barnes MA, Kazmer GW, Akers RM, et al. Influence of selection for milk yield on endogenous hormones and metabolites in Holstein heifers and cows. J Anim Sci. 1985;60:271.

391 Stricker P, Grueter F. [Action du lobe anterieur de l’hypophyse sur la montee laiteuse]. C R Seances Soc Biol Fil. 1928;99:1978.

392 Asimov GJ, Krouze NK. The lactogenic preparations from the anterior pituitary and the increase of milk yield in cows. J Dairy Sci. 1937;20:289.

393 McGuffey RK, Basson RP, Spike TE. Lactation response and body composition of cows receiving somatotropin and three ratios of forage to concentrate. J Dairy Sci. 1991;74:3095.

394 Baile CA, Krestel-Rickert DH. Somatotropin. Feed Manage. 1985;36:26.

395 Wood DC, Salsgiver WJ, Kasser TR, et al. Purification and characterization of pituitary bovine somatotropin. J Biol Chem. 1989;264:14741.

396 Wallis M. The molecular evolution of pituitary hormones. Biol Rev Camb Philos Soc. 1975;50:35.

397 Lucy MC, Hauser SD, Eppard PJ, et al. Variants of somatotropin in cattle: gene frequencies in major dairy breeds and associated milk production. Domest Anim Endocrinol. 1993;10:325.

398 Miller MA. Bovine somatotropins. The 40th Meeting of the Joint FAO/WHO Expert Committee on Food Additives. Toxicological evaluation of certain veterinary drug residues in food. Rockville: Centre for Veterinary Medicine; 1993;31:149. WHO Food Additives Series,

399 Juskevich JC, Guyer CG. Bovine growth hormone: human food safety evaluation. Science. 1990;249:875.

400 Etherton TD, Bauman DE. Biology of somatotropin in growth and lactation of domestic animals. Physiol Rev. 1998;78:745.

401 Food and Drug Administration DoHaHS. Code of Federal Regulations. Title 21, Volume 6. 1993. 58 CFR 59947. Amended at 67 FR 18085, Apr 15, 2002; 68 FR 62006. 2003. Oct 31

402 Hove K, Blom AK. Plasma insulin and growth hormone in dairy cows; diurnal variation and relation to food intake and plasma sugar and acetoacetate levels. Acta Endocrinol (Copenh). 1973;73:289.

403 Breier BH, Oliver MH, Gallaher BW. Regulation of growth and metabolism during postnatal development. In: Cronje PB, editor. Ruminant physiology: digestion, metabolism, growth, and reproduction. New York: CAB International, 2000.

404 Rerat M, Zbinden Y, Saner R, et al. In vitro embryo production: growth performance, feed efficiency, and hematological, metabolic, and endocrine status in calves. J Dairy Sci. 2005;88:2579.

405 Hammon HM, Zanker IA, Blum JW. Delayed colostrum feeding affects IGF-I and insulin plasma concentrations in neonatal calves. J Dairy Sci. 2000;83:85.

406 Plouzek CA, Trenkle A. Growth hormone parameters at four ages in intact and castrated male and female cattle. Domest Anim Endocrinol. 1991;8:63.

407 Hart IC, Bines JA, Morant SV, et al. Endocrine control of energy metabolism in the cow: comparison of the levels of hormones (prolactin, growth hormone, insulin and thyroxine) and metabolites in the plasma of high- and low-yielding cattle at various stages of lactation. J Endocrinol. 1978;77:333.

408 Andersen JB, Madsen TG, Larsen T, et al. The effects of dry period versus continuous lactation on metabolic status and performance in periparturient cows. J Dairy Sci. 2005;88:3530.

409 Shingu H, Hodate K, Kushibiki S, et al. Breed differences in growth hormone and insulin secretion between lactating Japanese Black cows (beef type) and Holstein cows (dairy type). Comp Biochem Physiol C Toxicol Pharmacol. 2002;132:493.

410 Kazmer GW, Barnes MA, Akers RM, et al. Effect of genetic selection for milk yield and increased milking frequency on plasma growth hormone and prolactin concentration in Holstein cows. J Anim Sci. 1986;63:1220.

411 Bauman DE, Currie WB. Partitioning of nutrients during pregnancy and lactation: a review of mechanisms involving homeostasis and homeorhesis. J Dairy Sci. 1980;63:1514.

412 Boden G, Chen X, Ruiz J, et al. Mechanisms of fatty acid-induced inhibition of glucose uptake. J Clin Invest. 1994;93:2438.

413 Mason TM, Goh T, Tchipashvili V, et al. Prolonged elevation of plasma free fatty acids desensitizes the insulin secretory response to glucose in vivo in rats. Diabetes. 1999;48:524.

414 McShane TM, Schillo KK, Boling JA, et al. Effects of recombinant DNA-derived somatotropin and dietary energy intake on development of beef heifers: I. Growth and puberty. J Anim Sci. 1989;67:2230.

415 Hall JB, Schillo KK, Fitzgerald BP, et al. Effects of recombinant bovine somatotropin and dietary energy intake on growth, secretion of luteinizing hormone, follicular development, and onset of puberty in beef heifers. J Anim Sci. 1994;72:709.

416 Preston RL, Bartle SJ, Kasser TR, et al. Comparative effectiveness of somatotropin and anabolic steroids in feedlot steers. J Anim Sci. 1995;73:1038.

417 Elvinger F, Hansen PJ, Head HH, et al. Actions of bovine somatotropin on polymorphonuclear leukocytes and lymphocytes in cattle. J Dairy Sci. 1991;74:2145.

418 Burvenich C, Paape MJ, Hoeben D, et al. Modulation of the inflammatory reaction and neutrophil defense of the bovine lactating mammary gland by growth hormone. Domest Anim Endocrinol. 1999;17:149.

419 Hoeben D, Burvenich C, Eppard PJ, et al. Effect of bovine somatotropin on neutrophil functions and clinical symptoms during Streptococcus uberis mastitis. J Dairy Sci. 1999;82:1465.

420 Elsasser TH, Fayer R, Rumsey TS, et al. Recombinant bovine somatotropin blunts plasma tumor necrosis factor—alpha, cortisol, and thromboxane-B2 responses to endotoxin in vivo. Endocrinol. 1994;134:1082.

421 Elsasser TH, Richards M, Collier R, et al. Physiological responses to repeated endotoxin challenge are selectively affected by recombinant bovine somatotropin administration to calves. Domest Anim Endocrinol. 1996;13:91.

422 Dohoo IR, Leslie K, DesCoteaux L, et al. A meta-analysis review of the effects of recombinant bovine somatotropin. 1. Methodology and effects on production. Can J Vet Res. 2003;67:241.

423 Thomas JW, Erdman RA, Galton DM, et al. Responses by lactating cows in commercial dairy herds to recombinant bovine somatotropin. J Dairy Sci. 1991;74:945.

424 Bauman DE, Everett RW, Weiland WH, et al. Production responses to bovine somatotropin in northeast dairy herds. J Dairy Sci. 1999;82:2564.

425 Capuco AV, Wood DL, Baldwin R, et al. Mammary cell number, proliferation, and apoptosis during a bovine lactation: relation to milk production and effect of bST. J Dairy Sci. 2001;84:2177.

426 Yang J, Zhao B, Baracos VE, et al. Effects of bovine somatotropin on beta-casein mRNA levels in mammary tissue of lactating cows. J Dairy Sci. 2005;88:2806.

427 Sinowatz F, Schams D, Kolle S, et al. Cellular localisation of GH receptor in the bovine mammary gland during mammogenesis, lactation and involution. J Endocrinol. 2000;166:503.

428 Plath-Gabler A, Gabler C, Sinowatz F, et al. The expression of the IGF family and GH receptor in the bovine mammary gland. J Endocrinol. 2001;168:39.

429 McDowell GH, Hart IC, Kirby AC. Local intra-arterial infusion of growth hormone into the mammary glands of sheep and goats: effects on milk yield and composition, plasma hormones and metabolites. Aust J Biol Sci. 1987;40:181.

430 Gertler A, Cohen N, Maoz A. Human growth hormone but not ovine or bovine growth hormones exhibits galactopoietic prolactin-like activity in organ culture from bovine lactating mammary gland. Mol Cell Endocrinol. 1983;33:169.

431 Prosser CG, Mepham TB. Mechanism of action of bovine somatotropin in increasing milk secretion in dairy ruminants. In: Sejrsen K, Vestergaard M, Neimann-Sorensen A, editors. Use of somatotropin in livestock production. Essex, England: Elsevier, 1988.

432 Bauman DE. Bovine somatotropin and lactation: from basic science to commercial application. Domest Anim Endocrinol. 1999;17:101.

433 McDowell GH, Gooden JM, Leenanuruksa D, et al. Effects of exogenous growth hormone on milk production and nutrient uptake by muscle and mammary tissues of dairy cows in mid-lactation. Aust J Biol Sci. 1987;40:295.

434 Cittadini A, Ishiguro Y, Stromer H, et al. Insulin-like growth factor-1 but not growth hormone augments mammalian myocardial contractility by sensitizing the myofilament to Ca2+ through a wortmannin-sensitive pathway: studies in rat and ferret isolated muscles. Circ Res. 1998;83:50.

435 Davis SR, Collier RJ, McNamara JP, et al. Effects of thyroxine and growth hormone treatment of dairy cows on milk yield, cardiac output and mammary blood flow. J Anim Sci. 1988;66:70.

436 Soderholm CG, Otterby DE, Linn JG, et al. Effects of recombinant bovine somatotropin on milk production, body composition, and physiological parameters. J Dairy Sci. 1988;71:355.

437 Annexstad RJ, Otterby DE, Linn JG, et al. Somatotropin treatment for a second consecutive lactation. J Dairy Sci. 1990;73:2423.

438 West JW, Bondari K, Johnson JC. Effects of bovine somatotropin on milk yield and composition, body weight, and condition score of Holstein and Jersey cows. J Dairy Sci. 1990;73:1062.

439 Tarazon-Herrera MA, Huber JT, Santos JE, et al. Effects of bovine somatotropin on milk yield and composition in Holstein cows in advanced lactation fed low- or high-energy diets. J Dairy Sci. 2000;83:430.

440 Eppard PJ, Bauman DE, Curtis CR, et al. Effect of 188-day treatment with somatotropin on health and reproductive performance of lactating dairy cows. J Dairy Sci. 1987;70:582.

441 Kirby CJ, Thatcher WW, Collier RJ, et al. Effects of growth hormone and pregnancy on expression of growth hormone receptor, insulin-like growth factor-I, and insulin-like growth factor binding protein-2 and-3 genes in bovine uterus, ovary, and oviduct. Biol Reprod. 1996;55:996.

442 Lucy MC, Collier RJ, Kitchell ML, et al. Immunohistochemical and nucleic acid analysis of somatotropin receptor populations in the bovine ovary. Biol Reprod. 1993;48:1219.

443 Lucy MC, Thatcher WW, Collier RJ, et al. Effects of somatotropin on the conceptus, uterus, and ovary during maternal recognition of pregnancy in cattle. Domest Anim Endocrinol. 1995;12:73.

444 De la Sota RL, Lucy MC, Staples CR, et al. Effects of recombinant bovine somatotropin (sometribove) on ovarian function in lactating and nonlactating dairy cows. J Dairy Sci. 1993;76:1002.

445 Kirby CJ, Smith MF, Keisler DH, et al. Follicular function in lactating dairy cows treated with sustained-release bovine somatotropin. J Dairy Sci. 1997;80:273.

446 Badinga L, Guzeloglu A, Thatcher WW. Bovine somatotropin attenuates phorbol ester-induced prostaglandin F2alpha production in bovine endometrial cells. J Dairy Sci. 2002;85:537.

447 Lucy MC, Byatt JC, Curran TL, et al. Placental lactogen and somatotropin: hormone binding to the corpus luteum and effects on the growth and functions of the ovary in heifers. Biol Reprod. 1994;50:1136.

448 Watson AJ, Hogan A, Hahnel A, et al. Expression of growth factor ligand and receptor genes in the preimplantation bovine embryo. Mol Reprod Dev. 1992;31:87.

449 Moreira F, Badinga L, Burnley C, et al. Bovine somatotropin increases embryonic development in superovulated cows and improves post-transfer pregnancy rates when given to lactating recipient cows. Theriogenology. 2002;57:1371.

450 Izadyar F, Van Tol HT, Hage WG, et al. Preimplantation bovine embryos express mRNA of growth hormone receptor and respond to growth hormone addition during in vitro development. Mol Reprod Dev. 2000;57:247.

451 Fike JH, Staples CR, Sollenberger LE, et al. Southeastern pasture-based dairy systems: housing, Posilac, and supplemental silage effects on cow performance. J Dairy Sci. 2002;85:866.

452 Peel CJ, Sandles LD, Quelch KJ, et al. The effects of long-term administration of bovine growth hormone on the lactational performance of identical-twin dairy cows. Anim Prod. 1985;41:135.

453 Cole WJ, Eppard PJ, Boysen BG, et al. Response of dairy cows to high doses of a sustained-release bovine somatotropin administered during two lactations. 2. Health and reproduction. J Dairy Sci. 1992;75:111.

454 Jenny BF, Grimes LW, Pardue FE, et al. Lactational response of Jersey cows to bovine somatotropin administered daily or in a sustained-release formulation. J Dairy Sci. 1992;75:3402.

455 Oldenbroek JK, Garssen GJ, Jonker LJ, et al. Effects of treatment of dairy cows with recombinant bovine somatotropin over three or four lactations. J Dairy Sci. 1993;76:453.

456 Rose MT, Weekes TE, Rowlinson P. Individual variation in the milk yield response to bovine somatotropin in dairy cows. J Dairy Sci. 2004;87:2024.

457 Eppard PJ, Bauman DE, McCutcheon SN. Effect of dose of bovine growth hormone on lactation of dairy cows. J Dairy Sci. 1985;68:1109.

458 Marcek JM, Seaman WJ, Nappier JL. Effects of repeated high dose administration of recombinant bovine somatotropin in lactating dairy cows. Vet Hum Toxicol. 1989;31:455.

459 Johnson HD, Li R, Manalu W, et al. Effects of somatotropin on milk yield and physiological responses during summer farm and hot laboratory conditions. J Dairy Sci. 1991;74:1250.

460 Cohick WS, Plaut K, Sechen SJ, et al. Temporal pattern of insulin-like growth factor-I response to exogenous bovine somatotropin in lactating cows. Domest Anim Endocrinol. 1989;6:263.

461 Remond B, Cisse M, Ollier A, et al. Slow release somatotropin in dairy heifers and cows fed two levels of energy concentrate. 1. Performance and body condition. J Dairy Sci. 1991;74:1370.

462 Tyrrell HF, Brown AC, Reynolds PJ, et al. Effect of bovine somatotropin on metabolism of lactating dairy cows: energy and nitrogen utilization as determined by respiration calorimetry. J Nutr. 1988;118:1024.

463 McBride BW, Burton JL, Gibson JP, et al. Use of recombinant bovine somatotropin for up to two consecutive lactations on dairy production traits. J Dairy Sci. 1990;73:3248.

464 Sullivan JL, Huber JT, DeNise SK, et al. Factors affecting response of cows to biweekly injections of sometribove. J Dairy Sci. 1992;75:756.

465 Michel A, McCutcheon SN, Mackenzie DD, et al. Metabolic responses to exogenous bovine somatotropin in Friesian cows of low or high genetic merit. Domest Anim Endocrinol. 1991;8:293.

466 West JW, Mullinix BG, Johnson JCJr, et al. Effects of bovine somatotropin on dry matter intake, milk yield and body temperature in Holstein and Jersey cows during heat stress. J Dairy Sci. 1990;73:2896.

467 Lean IJ, Baldwin RL, Troutt HF, et al. Impact of bovine somatotropin administration beginning at day 70 of lactation on serum metabolites, milk constituents, and production in cows previously exposed to exogenous somatotropin. Am J Vet Res. 1992;53:731.

468 Gibson JP, McBride BW, Burton JH, et al. Effect on production traits of bovine somatotropin for up to three consecutive lactations. J Dairy Sci. 1992;75:837.

469 Hansen WP, Otterby DE, Linn JG, et al. Multi-farm use of bovine somatotropin for two consecutive lactations and its effects on lactational performance, health, and reproduction. J Dairy Sci. 1994;77:94.

470 Lean IJ, Troutt HF, Bruss ML, et al. Postparturient metabolic and production responses in cows previously exposed to long-term treatment with somatotropin. J Dairy Sci. 1991;74:3429.

471 Eppard PJ, Hudson S, Cole WJ, et al. Response of dairy cows to high doses of a sustained-release bovine somatotropin administered during two lactations. 1. Production response. J Dairy Sci. 1991;74:3807.

472 Huber JT, Wu Z, Fontes CJr, et al. Administration of recombinant bovine somatotropin to dairy cows for four consecutive lactations. J Dairy Sci. 1997;80:2355.

473 Phipps RK. The use of prolonged release bovine somatotropin in milk production. Bull Int Dairy Fed. 1988;228:2.

474 National Research Council. Nutrient requirements of dairy cattle, 7th rev ed. Washington: National Academies Press, 2001.

475 McGuire MA, Dwyer DA, Bauman DE, et al. Insulin-like growth factors in plasma and afferent mammary lymph of lactating cows deprived of feed or treated with bovine somatotropin. J Dairy Sci. 1998;81:950.

476 Radcliff RP, McCormack BL, Keisler DH, et al. Partial feed restriction decreases growth hormone receptor 1A mRNA expression in postpartum dairy cows. J Dairy Sci. 2006;89:611.

477 West JW. Interactions of energy and bovine somatotropin with heat stress. J Dairy Sci. 1994;77:2091.

478 Elvinger F, Natzke RP, Hansen PJ. Interactions of heat stress and bovine somatotropin affecting physiology and immunology of lactating cows. J Dairy Sci. 1992;75:449.

479 Yousef MK, Johnson HD. Calorigenesis of dairy cattle as influenced by thyroxine and environmental temperature. J Anim Sci. 1966;25:150.

480 Tarazon-Herrera M, Huber JT, Santos J, et al. Effects of bovine somatotropin and evaporative cooling plus shade on lactation performance of cows during summer heat stress. J Dairy Sci. 1999;82:2352.

481 Collier RJ, Dahl GE, VanBaale MJ. Major advances associated with environmental effects on dairy cattle. J Dairy Sci. 2006;89:1244.

482 Becker BA, Johnson HD, Li R, et al. Effect of farm and simulated laboratory cold environmental conditions on the performance and physiological responses of lactating dairy cows supplemented with bovine somatotropin (BST). Int J Biometeorol. 1990;34:151.

483 Manalu W, Johnson HD, Li RZ, et al. Assessment of thermal status of somatotropin-injected lactating Holstein cows maintained under controlled-laboratory thermoneutral, hot and cold environments. J Nutr. 1991;121:2006.

484 Judge LJ, Bartlett PC, Lloyd JW, et al. Recombinant bovine somatotropin: association with reproductive performance in dairy cows. Theriogenology. 1999;52:481.

485 Dohoo IR, DesCoteaux L, Leslie K, et al. A meta-analysis review of the effects of recombinant bovine somatotropin. 2. Effects on animal health, reproductive performance, and culling. Can J Vet Res. 2003;67:252.

486 Santos JE, Huber JT, Theurer CB, et al. Effects of grain processing and bovine somatotropin on metabolism and ovarian activity of dairy cows during early lactation. J Dairy Sci. 2000;83:1004.

487 Sangsritavong S, Combs DK, Sartori R, et al. High feed intake increases liver blood flow and metabolism of progesterone and estradiol-17 beta in dairy cattle. J Dairy Sci. 2002;85:2831.

488 Wiltbank MC, Fricke PM, Sangsritavong S, et al. Mechanisms that prevent and produce double ovulations in dairy cattle. J Dairy Sci. 2000;83:2998.

489 Morbeck DE, Britt JH, McDaniel BT. Relationships among milk yield, metabolism, and reproductive performance of primiparous Holstein cows treated with somatotropin. J Dairy Sci. 1991;74:2153.

490 Collier RJ, Byatt JC, Denham SC, et al. Effects of sustained release bovine somatotropin (sometribove) on animal health in commercial dairy herds. J Dairy Sci. 84(1098), 2001.

491 Ruegg PL, Fabellar A, Hintz RL. Effect of the use of bovine somatotropin on culling practices in thirty-two dairy herds in Indiana, Michigan, and Ohio. J Dairy Sci. 1998;81:1262.

492 Bartolome J, Hernandez J, Landaeta A, et al. The effect of interval from day of administration of bovine somatotropin (bST) to synchronization of ovulation and timed-insemination on conception rate of dairy cows with and without ovarian cysts. Theriogenology. 2002;57:1293.

493 Santos JE, Juchem SO, Cerri RL, et al. Effect of bST and reproductive management on reproductive performance of Holstein dairy cows. J Dairy Sci. 2004;87:868.

494 Moreira F, Orlandi C, Risco CA, et al. Effects of presynchronization and bovine somatotropin on pregnancy rates to a timed artificial insemination protocol in lactating dairy cows. J Dairy Sci. 2001;84:1646.

495 Stanisiewski EP, Krabill LF, Lauderdale JW. Milk yield, health, and reproduction of dairy cows given somatotropin (Somavubove) beginning early postpartum. J Dairy Sci. 1992;75:2149.

496 Gonzalez-Fernandez R, Velarde JC, Perea-Ganchou F, et al. Production of transferable embryos in Brahman cows treated with bovine somatotropin. Reprod Fertil Dev. 2004;16:210.

497 Willeberg P. Bovine somatotropin and clinical mastitis: epidemiological assessment on the welfare risk. Livest Prod Sci. 1993;36:55.

498 White TC, Madsen KS, Hintz RL, et al. Clinical mastitis in cows treated with sometribove (recombinant bovine somatotropin) and its relationship to milk yield. J Dairy Sci. 1994;77:2249.

499 Judge LJ, Erskine RJ, Bartlett PC. Recombinant bovine somatotropin and clinical mastitis: incidence, discarded milk following therapy, and culling. J Dairy Sci. 1997;80:3212.

500 McClary DG, Green HB, Basson RP, et al. The effects of a sustained-release recombinant bovine somatotropin (somidobove) on udder health for a full lactation. J Dairy Sci. 1994;77:2261.

501 Dunklee JS, Freeman AE, Kelley DH. Comparison of Holsteins selected for high and average milk production. 2. Health and reproductive response to selection for milk. J Dairy Sci. 1994;77:3683.

502 van Dorp RT, Martin SW, Shoukri MM, et al. An epidemiologic study of disease in 32 registered Holstein dairy herds in British Columbia. Can J Vet Res. 1999;63:185.

503 Hoeben D, Burvenich C, Eppard PJ, et al. Effect of recombinant bovine somatotropin on milk production and composition of cows with Streptococcus uberis mastitis. J Dairy Sci. 1999;82:1671.

504 Burvenich C, Vandeputte-vanMessom G, Roets E, et al. Bovine growth hormone ion acute mastitis due to Escherichia coli. Ann Med Vet. 1988;132:601.

505 Vicini JL, Hudson S, Cole WJ, et al. Effect of acute challenge with an extreme dose of somatotropin in a prolonged-release formulation on milk production and health of dairy cattle. J Dairy Sci. 1990;73:2093.

506 Bauman DE, Eppard PJ, DeGeeter MJ, et al. Responses of high-producing dairy cows to long-term treatment with pituitary somatotropin and recombinant somatotropin. J Dairy Sci. 1985;68:1352.

507 Burton JH, MacLeod GK, McBride BW, et al. Overall efficacy of chronically administered recombinant bovine somatotropin to lactating dairy cows. J Dairy Sci. 1990;73:2157.

508 Sonenberg M, Free CA, Dellacha JM, et al. The metabolic effects in man of bovine growth hormone digested with trypsin. Metabolism. 1965;14:1189.

509 Souza SC, Frick GP, Wang X, et al. A single arginine residue determines species specificity of the human growth hormone receptor. Proc Natl Acad Sci USA. 1995;92:959.

510 Moore WV, Draper S, Hung CH. Species variation in the binding of hGH to hepatic membranes. Horm Res. 1985;21:33.

511 Lesniak MA, Gorden P, Roth J. Reactivity of non-primate growth hormones and prolactins with human growth hormone receptors on cultured human lymphocytes. J Clin Endocrinol Metab. 1977;44:838.

512 Collier RJ, Miller MA, Hildebrandt JR, et al. Factors affecting insulin-like growth factor-I concentration in bovine milk. J Dairy Sci. 1991;74:2905.

513 Sejrsen K, Pedersen LO, Vestergaard M, et al. Biological activity of bovine milk. Contribution of IGF-I and IGF binding proteins. Livest Prod Sci. 2001;70:79.

514 Accorsi PA, Govoni N, Gaiani R, et al. Leptin, GH, PRL, insulin and metabolic parameters throughout the dry period and lactation in dairy cows. Reprod Domest Anim. 2005;40:217.

515 Public Health Service and Food and Drug Administration. Grade “A” Pasteurized Milk Ordinance—2001 Revision. 2001. Publication No. 229, 2001. Available at http://www.cfsan.fda.gov/˜ear/pmo01toc.html

516 Groenewegen PP, McBride BW, Burton JH, et al. Bioactivity of milk from bST-treated cows. J Nutr. 1990;120:514.

517 Vega JR, Gibson CA, Skaar TC, et al. Insulin-like growth factor (IGF)-I and -II and IGF binding proteins in serum and mammary secretions during the dry period and early lactation in dairy cows. J Anim Sci. 1991;69:2538.

518 Eriksson U, Duc G, Froesch ER, et al. Insulin-like growth factors (IGF) I and II and IGF binding proteins (IGFBPs) in human colostrum/transitory milk during the first week postpartum: comparison with neonatal and maternal serum. Biochem Biophys Res Commun. 1993;196:267.

519 Suikkari AM. Insulin-like growth factor (IGF-I) and its low molecular weight binding protein in human milk. Eur J Obstet Gynecol Reprod Biol. 1989;30:19.

520 Mielke H, Lochmann G, Simon I, et al. bSTH and IGF-I levels in blood and milk of black and white dairy cows before and after application of recombinantly derived bovine somatotropin. Zentralbl Veterinarmed A. 1990;37:554.

521 Schams D, Matzke P, Hollwich W, et al. [Control of the use of bovine somatotropin (bST) by the determination of bST and insulin-like growth factor I (IGF-I) in blood and milk of cows]. Z Ernahrungswiss. 1990;29:154.

522 Hammond BG, Collier RJ, Miller MA, et al. Food safety and pharmacokinetic studies which support a zero (0) meat and milk withdrawal time for use of sometribove in dairy cows. Ann Rech Vet. 1990;21(Suppl 1):107S.

523 Seaman WJ, Nappier JL, Olsen RF, et al. The lack of a growth-promoting effect of orally administered bovine somatotropin in the rat body-weight-gain bioassay. Fundam Appl Toxicol. 1988;10:287.

524 Norman HD, Powell RL, Wright JR, et al. Timeliness and effectiveness of progeny testing through artificial insemination. J Dairy Sci. 2003;86:1513.

525 Cassell BG, Jobst SM, McGilliard ML, et al. Evaluating sire selection practices using lifetime net income functions. J Dairy Sci. 2002;85:3492.

526 Vanderboom RJ, McCauley TC, Tappan R, et al. Bovine reproductive biotechnology. In: Youngquist RS, editor. Current therapy in large animal theriogenology. Philadelphia: Saunders, 1997.

527 Bewley J, Palmer RW, Jackson-Smith DB. Modeling milk production and labor efficiency in modernized Wisconsin dairy herds. J Dairy Sci. 2001;84:705.

528 Speicher JA, Tucker HA, Ashley RW, et al. Production responses of cows to recombinantly derived bovine somatotropin and to frequency of milking. J Dairy Sci. 1994;77:2509.

529 Tauer LW, Knoblauch WA. The empirical impact of bovine somatotropin on New York dairy farms. J Dairy Sci. 1997;80:1092.

530 Marion BW, Wills RL. A prospective assessment of the impacts of bovine somatotropin: a case study of Wisconsin. Am J Agric Econ. 1990;72:326.

531 Magliaro AL, Kensinger RS, Ford SA, et al. Induced lactation in nonpregnant cows: profitability and response to bovine somatotropin. J Dairy Sci. 2004;87:3290.

532 Annen EL, Collier RJ, McGuire MA, et al. Effect of modified dry period lengths and bovine somatotropin on yield and composition of milk from dairy cows. J Dairy Sci. 2004;87:3746.

533 Collier RJ, Annen EL, Fitzgerald AC. Prospects for zero days dry. Vet Clin North Am Food Anim Pract. 2004;20:687.

534 Moallem U, Dahl GE, Duffey EK, et al. Bovine somatotropin and rumen-undegradable protein effects in prepubertal dairy heifers: effects on body composition and organ and tissue weights. J Dairy Sci. 2004;87:3869.

535 Bauman DE. Bovine somatotropin: review of an emerging animal technology. J Dairy Sci. 1992;75:3432.

* References 422, 436, 460, 472, 489, 504, 505.