Chapter 14 Basic biomechanics of gait
INTRODUCTION
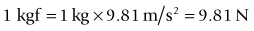
There are two basic forms of movement, linear and angular. Linear motion, also referred to as translation, occurs when all parts of an object move the same distance in the same direction in the same time. When the movement is in a straight line the motion is called rectilinear translation. When the movement follows a curved path the motion is called curvilinear translation (Fig. 14.1). Angular motion, also referred to as rotation, occurs when an object or part of an object, such as an arm or leg, moves in a circular path about a line in space, referred to as the axis of rotation, such that all parts of the object move through the same angle in the same direction in the same time (Fig. 14.1). Most whole-body human movements involve a combination of linear and angular motion. For example, while walking the head and trunk experience more or less continuous linear motion as the segments of the arms and legs experience angular motion (Fig. 14.2). Movement of a multisegmented system involving linear and angular motion of one or more segments, such as the human body when walking, is usually referred to as general motion (Watkins 2007).
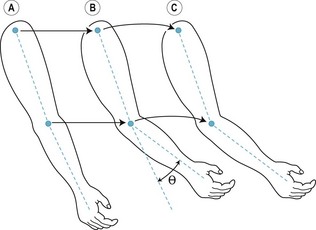
Figure 14.1 Forms of motion. Between positions A and B the upper arm experiences rectilinear translation and the lower arm and hand experience angular rotation (angle θ) about the elbow joint. Between positions B and C the whole arm experiences curvilinear translation.
All movements and changes in movement are brought about by the action of forces. A force may be defined as that which alters or tends to alter an object’s state of rest or type (form, speed, direction) of movement. Human movement is brought about by the musculoskeletal system (skeleton, joints, skeletal muscles) under the control of the nervous system. The bones of the skeleton are joined together in a way that allows them to move relative to each other. The skeletal muscles pull on the bones in order to control the movement of the joints and, thereby, the movement of the body as a whole. By coordinated activity between the various muscle groups, forces generated by the muscles are transmitted by the bones and joints to enable the individual to maintain an upright or partially upright posture and bring about voluntary controlled movements (Watkins 1999).
Mechanics is the study of the forces that act on objects and the effects of the forces on the size, shape, structure and movement of the objects. Biomechanics is the study of the forces that act on and within living organisms and the effects of the forces on the size, shape, structure and movement of the organisms. Biomechanics of human movement is the study of the relationship between the external forces (due to body weight and physical contact with the external environment) and internal forces (active forces generated by muscles and passive forces exerted on other structures such as bones and joints) that act on the body, and the effect of these forces on the movement of the body (Watkins 2007).
CONTACT FORCES AND ATTRACTION FORCES
There are two types of force, contact forces and attraction forces (Watkins 2007). Contact forces result from contact of one object with another. For example, when standing upright the articular surfaces of the hip, knee and ankle joints exert compression (pressing, pushing) forces on each other. Similarly, skeletal muscles exert tension (pulling) forces on bones in order to control joint movements. Attraction forces, such as magnetic force, tend to move objects towards each other (positive attraction) or away from each other (negative attraction).
Mass and weight
The mass of an object is the amount of matter (physical substance) that comprises the object. In the metric system of measurement the units of mass are the gram (g) and kilogram (kg), and in the Imperial system of measurement the most common unit of mass is the pound (lb) (Watkins 2007). The mass of an object is the product of the volume and density (concentration of matter, or mass per unit volume) of the object. For example, a golf ball and a table tennis ball have a similar volume (occupy the same amount of space) but the density and, consequently, the mass of a golf ball is much greater than that of a table tennis ball. Every object in the universe attracts every other object with a force that is directly proportional to the product of the masses of the two objects and inversely proportional to the square of the distance between them. This relationship is encapsulated in Newton’s law of gravitation, which may be expressed algebraically as:
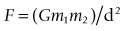
where F is the force of attraction, G is the constant of gravitation, m1 and m2 are the masses of objects 1 and 2, and d is the distance between the two masses. It is difficult to imagine that a force of attraction exists between any two objects, but the magnitude of the force is usually extremely small and of no practical significance. However, there is one object, the Earth, that exerts a significant force of attraction on every other object. The force of attraction that the Earth exerts on an object is referred to as the ‘weight’ of the object. Weight forces always act vertically downwards. From Newton’s law of gravitation, the weight W of an object of mass m is given by:
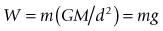
where M is the mass of the Earth and d is distance between the centre of the Earth and the object on its surface. The term GM/d2 is usually referred to as gravity (g), which is the acceleration due to the Earth’s gravitational field. As the Earth is not a perfect sphere d varies slightly at different points on the Earth’s surface. Consequently, g also varies slightly, with an average value of 9.81 m/s2.
Units of force
In the metric system the unit of force is the newton (N). A newton is defined as the force acting on a mass of 1 kg which accelerates it at 1 m/s2, i.e. 1 N = 1 kg × 1 m/s2. As the acceleration due to gravity is 9.81 m/s2, it follows that the weight of a mass of 1 kg, referred to as 1 kgf (kilogram force), is given by:
A mass of 1 kg is equal to 2.2046 lb, i.e. 1 kgf = 2.2046 lbf (pound force). The kgf and lbf are gravitational units of force. Body weight is often recorded in kg or lb, which are units of mass. While this makes no practical difference, the correct units for weight are kgf and lbf (Watkins 2007).
Scalars and vectors
All quantities within the physical and life sciences are either scalar or vector quantities. Scalar quantities, such as area, volume and temperature, can be completely specified by magnitude, but vector quantities, such as displacement, velocity and force, require a specification in both magnitude and direction. A vector quantity can be represented diagrammatically by a straight line with an arrowhead. The length of the line, with respect to an appropriate scale, corresponds to the magnitude of the quantity, and the orientation of the line and arrow head, with respect to an appropriate reference axis (usually horizontal or vertical), indicates the direction. Figure 14.3a shows the force vectors of the weights of the individual body segments and Figure 14.3b shows the force vector indicating the weight of the whole body.
CENTRE OF GRAVITY
The human body consists of a number of segments linked by joints. Each segment contributes to the total weight of the body (Fig. 14.3a). Movement of the body segments relative to each other alters the weight distribution of the body. However, in any particular body posture the body behaves (in terms of the effect of body weight on the movement of the body) as if the total weight of the body is concentrated at a single point, called the centre of gravity (Fig. 14.3b). The concept of centre of gravity applies to all objects, animate and inanimate.
The position of an object’s centre of gravity depends on the distribution of the weight of the object. For a regular-shaped object with uniform density the centre of gravity is located at the object’s geometric centre. However, if the object has an irregular shape or non-uniform density, like the human body, the position of the centre of gravity will reflect the mass distribution and it may be inside or outside the body (Fig. 14.4). Movements that involve continuous change in the orientation of the body segments relative to each other result in continuous change in the position of the centre of gravity.
MUSCULOSKELETAL SYSTEM FUNCTION
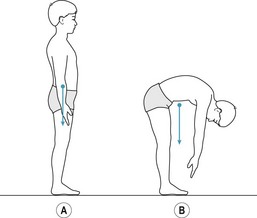
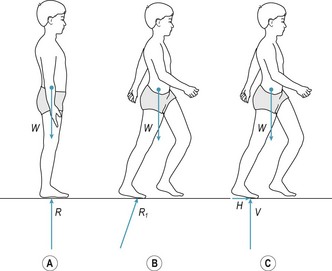
‘Posture’ refers to the orientation of the body segments relative to each other and is usually applied to static or quasi-static positions such as sitting and standing. When standing upright there are two forces acting on the body, body weight and the ground reaction force (Fig. 14.5a). The ground reaction force is the force exerted by the ground on the body; when standing upright the ground reaction force is equal in magnitude but opposite in direction to the body weight. The combined effect of body weight and the ground reaction force is a compression load that tends to collapse the body in a heap on the ground. This compression load increases with any additional weight carried by the body (Fig. 14.5b). To prevent the body from collapsing while simultaneously bringing about desired movements, the movements of the various joints need to be carefully controlled by coordinated activity between the various muscle groups. For example, when standing upright the joints of the neck, trunk and legs must be stabilised by the muscles that control them, otherwise the body would collapse. Consequently, the weight of the whole body is transmitted to the floor by the feet, but the weight of individual body segments above the feet (head, arms, trunk and legs) is transmitted indirectly to the floor by the skeletal chain formed by the bones and joints of the neck, trunk and legs.
Figure 14.5 Compression load on the body in upright postures. R1 and R2, ground reaction forces; W1, body weight; W2, weight of box. R1 = W1. R2 = W1 + W2.
Transmitting body weight to the ground while maintaining an upright body posture illustrates the essential feature of musculoskeletal function, i.e. the generation (by the muscles) and transmission (by the bones and joints) of forces. In biomechanical analysis of human movement, the forces generated and transmitted by the musculoskeletal system are referred to as internal forces, and forces that act on the body from external sources, such as body weight, ground reaction force, water resistance and air resistance, are referred to as external forces. The musculoskeletal system generates and transmits internal forces to counteract (in static and quasi-static postures) or overcome (during purposeful movements) the external forces acting on the body in order to maintain upright posture, transport the body and manipulate objects, often simultaneously (Watkins 1999).
STABILITY
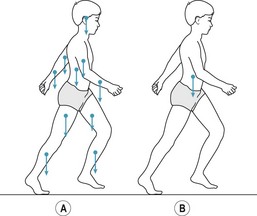
In mechanics, an object is said to be stable with respect to a particular base of support when the line of action of its weight intersects the plane of the base of support, and it is said to be unstable when this line does not intersect (Watkins 2007). With regard to human movement, the terms ‘stability’ and ‘balance’ are often used synonymously. Maintaining stability of the human body is a fairly complex, albeit largely unconscious, process (Roberts 1995). When standing upright, the line of action of body weight intersects the base of support formed by the area beneath and between the feet (Fig. 14.6A,B). The size of the base of support can be increased by moving the feet further apart. For example, moving one foot to the side increases side-to-side stability (Fig. 14.6C) and moving one foot in front of the other increases anteroposterior stability (Fig. 14.6D).
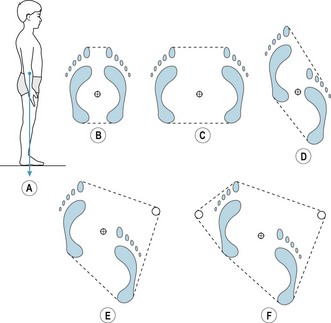
Figure 14.6 Line of action of body weight in relation to the base of support. (A, B) Standing upright. (C) Standing upright with feet wide apart. (D) Standing upright with the left foot in front of the right foot. (E) Use of a walking stick in the right hand. (F) Use of crutches or two walking sticks.
In general, the lower the centre of gravity and the larger the area of the base of support, the greater the stability. The recumbent position is the most stable position of the human body, as it is the position in which the area of the base of support is greatest and the height of the centre of gravity is lowest. The recumbent position is also the position that requires least muscular effort (energy expenditure), as all the body segments are directly supported by the support surface (i.e. no muscular effort is necessary to maintain the position of the body segments). In general, the smaller the base of support, the greater the number of joints that need to be controlled and, therefore, the greater the muscular effort. For example, it is usually easier, in terms of muscular effort, to maintain stability when standing on both feet than when standing on one foot. Similarly, it is usually less tiring to sit than to stand, and less tiring to lie down than to sit.
A person recovering from a leg injury may use crutches or a walking stick in order to relieve the load on the injured limb. The use of crutches or a walking stick also increases the area of the base of support and makes it easier for the user to maintain stability (Fig. 14.6E,F).
CENTRE OF PRESSURE
The ground reaction force is distributed across the whole of the area of contact between the feet and the floor. Figure 14.7A shows the contact area when standing barefoot on both feet; the contact area is much smaller than the area of the base of support. Figure 14.7B shows the contact area when standing on the left foot, and Figure 14.7C shows the contact area when standing on the left foot with the heel raised off the ground. In Figures 14.7B and C, the contact area is very similar to the base of support. Whereas the ground reaction force is distributed across the whole of the contact area, the effect of the ground reaction force on the movement of the body is as if the ground reaction force acts at a single point, which is referred to as the ‘centre of pressure’ (just as the whole weight of the body appears to act at the whole-body centre of gravity in terms of the effect of body weight on the movement of the body).
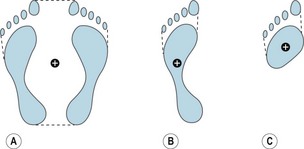
Figure 14.7 The location of the centre of pressure in relation to the base of support when (A) standing upright on both feet, (B) standing on the left foot, (C) standing on the left foot with the heel off the floor.
If it was possible to stand upright and perfectly still (i.e. with the centre of gravity stationary), the centre of pressure would be stationary and the line of action of body weight would pass through the centre of pressure. However, during normal upright standing, the line of action of body weight and the centre of pressure rarely coincide. During normal upright standing, the centre of gravity sways continuously (along an irregular path in the horizontal plane) about a mean position (Winter 1995). The position and speed of movement of the centre of gravity is continuously monitored by visual (eyes), vestibular (ears) and somatosensory (skin and musculoskeletal system) receptors (Peterka 2002). The central nervous system integrates the sensory input and produces appropriate motor output (to change the activation of the muscles that control the joints, especially the hips, knees and ankles) to change the location of the centre of pressure and the magnitude of the ground reaction force which, in turn, counteracts the sway of the centre of gravity and maintains balance (Horak 2006). Winter et al (1998) reported that for a group of ten young adults (mean age 26 years) the mean amplitude of oscillation (sway) of the centre of gravity about the mean position in quiet standing (2 minutes duration) was 0.41 ± 0.30 cm in the anteroposterior direction and 0.17 ± 0.09 cm in the mediolateral direction. The corresponding mean amplitude of oscillation of the centre of pressure was 0.43 ± 0.11 cm in the anteroposterior direction and 0.18 ± 0.08 cm in the mediolateral direction. The mean difference between the line of action of body weight and the centre of pressure was 0.07 ± 0.02 cm in the anteroposterior direction and 0.05 ± 0.01 cm in the mediolateral direction.
LOAD, STRAIN, AND STRESS
A load is any force or combination of forces applied to an object (Watkins 2007). There are three types of load: tension, compression and shear (Fig. 14.8). Loads tend to deform the objects on which they act. Tension is a pulling (stretching) load that tends to make an object longer and thinner along the line of the force (Fig. 14.8A,B). Compression is a pushing or pressing load that tends to make an object shorter and thicker along the line of the force (Fig. 14.8A,C). A shear load is comprised of two equal (in magnitude), opposite (in direction), parallel forces that tend to displace one part of an object with respect to an adjacent part along a plane parallel to and between the lines of force (Fig. 14.8A,D). The cutting load produced by scissors and garden shears is a shear load, while the cutting load produced by a knife is a compression load. It is also a shear load that forces one object to slide on another (Fig. 14.8E). The sliding or tendency to slide is resisted by a force called ‘friction’, which is exerted between and parallel to the two contacting surfaces. The three types of load frequently occur in combination, especially in bending and torsion (Fig. 14.8A,F,G). An object subjected to bending experiences tension on one side and compression on the other. An object subjected to torsion simultaneously experiences tension, compression, and shear.
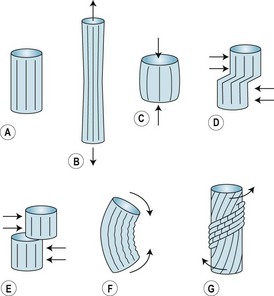
Figure 14.8 Types of load. (A) Unloaded. (B) Tension load. (C) Compression load. (D) Shear load. (E) Shear load producing friction. (F) Bending. (G) Torsion.
In mechanical terms, the deformation of an object that occurs in response to a load is referred to as ‘strain’. For example, when a muscle contracts it exerts a tension load on the tendons at each end of the muscle, and consequently the tendons experience tension strain (i.e. they are very slightly stretched). Similarly, an object subjected to a compression load experiences compression strain, and an object subjected to a shear load experiences shear strain. Strain denotes deformation of the intermolecular bonds that comprise the structure of an object. When an object experiences strain, the intermolecular bonds exert forces that tend to restore the original (unloaded) size and shape of the object. The forces exerted by the intermolecular bonds of an object under strain are referred to as ‘stress’. Stress is the resistance of the intermolecular bonds to the strain caused by the load.
The stress on an object resulting from a particular load is distributed throughout the whole of the material sustaining the load. However, the level of stress in different regions of the material varies depending on the amount of material sustaining the load in those regions; the more material sustaining the load, the lower the stress. Consequently, stress is measured in terms of the average load on the plane of material sustaining the load at the point of interest.
Tension stress
Figure 14.9A shows a person standing upright with the line of action of body weight slightly in front of the ankle joints. In this posture, stability is maintained by isometric contraction of the ankle plantar flexors, as shown in the simple two-segment model in Figure 14.9B. If the force exerted by the ankle plantar flexors is 350 N (in each leg) and the cross-sectional area of the Achilles tendon at P in Figure14.9B is 1.8 cm2 (square centimetres) then the tension stress on the tendon at P is given by:
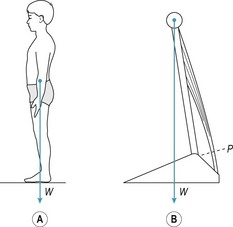
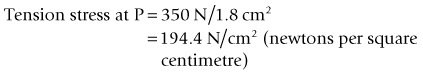
In the metric system the unit of stress is the pascal (Pa), which is defined as the stress produced by a force of one newton uniformly distributed over an area of one square metre (1 Pa = 1 N/m2). Since 1 N/cm2 = 10 000 Pa, the tension stress on the Achilles tendon is equivalent to 1 944 000 Pa or 1.944 MPa (megapascal = 106 Pa).
Compression stress
When standing barefoot, as in Figure 14.7A, the ground reaction force exerts a compression load on the contact area of the feet. In an adult the contact area is approximately 260 cm2 (both feet) (Hennig et al 1994). For a person weighing 686 N (70 kgf), the compression stress on the contact area of the feet (on a level floor, contact area perpendicular to the compression load) is given by:
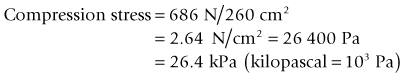
Compression stress is usually referred to as ‘pressure’. By raising the heels off the ground the contact area is approximately halved. Since the compression load (body weight) is the same as before, it follows that the pressure on the reduced contact area is approximately doubled.
Shear stress
Many of the joints, especially those in the lower back and pelvis, are subjected to shear load during normal everyday activities such as standing and walking. For example, in walking there is a phase when one leg supports the body while the other leg swings forward (Fig. 14.10). In this situation the unsupported side of the body tends to move downward relative to the supported side subjecting the pubic symphysis to shear load. The area of the pubic symphysis in the plane of the shear load is approximately 2 cm2. If the shear load at the instant shown in Figure 14.10 is, for example, 20 N, then the shear stress on the joint is given by:
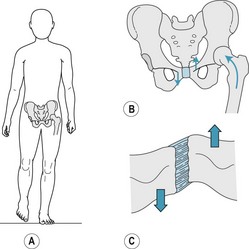
Figure 14.10 (A) Standing on the left leg. (B) Load distribution on the pelvis. (C) Shear load on the pubic symphysis.
GAIT CYCLE
In walking and running, a step is defined as the movement of the body from contact of one foot with the ground to contact of the other foot with the ground. A stride is defined as the movement of the body during two successive steps. The gait cycle refers to the movement of the body during a single stride. The gait cycle of the right leg begins with right heel strike (contact of the ground with the right heel), which initiates the stance phase of the right leg (i.e. the period of the gait cycle when the right leg is in contact with the ground). The first part of the stance phase is a period of double support (i.e. when both feet are in contact with the ground) (Fig. 14.11). This period of double support lasts for approximately 10% of the cycle, and after this point the left foot leaves the ground (referred to as toe-off) and the left leg swings forward. During the swing phase of the left leg the right leg supports the body on its own; this period lasts for approximately 40% of the cycle, and is referred to as the ‘single-support phase’ of the right leg. At the end of the swing phase of the left leg the left foot contacts the ground and another period of double support ensues. At approximately 60% of the cycle the right foot leaves the ground to begin its swing phase, while the left leg experiences a period of single support. The cycle is completed by heel strike of the right foot.
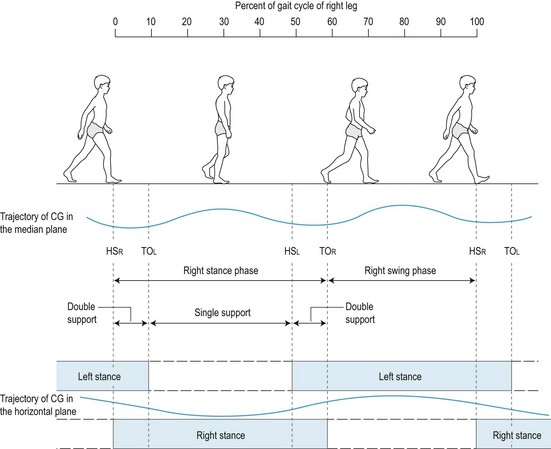
Trajectory of the centre of gravity
During walking, the movement of the body as a whole is reflected in the movement of the whole-body centre of gravity, which tends to follow a fairly smooth up-and-down side-to-side trajectory. When viewed from the side, as shown in the upper part of Figure 14.11, the centre of gravity moves up and down twice during each gait cycle, with the low points of the trajectory occurring close to the midpoints of the double-support phases and the high points of the trajectory occurring close to the midpoints of the single-support phases. When viewed from overhead, as shown in the lower part of Figure 14.11, the trajectory of the centre of gravity follows the support phases, moving right during the period from the midpoint of single-support of the left leg to the midpoint of single-support of the right leg, and moving left during the period from the midpoint of single-support of the right leg to the midpoint of single-support of the left leg. Orendurff et al (2004) investigated the effect of walking speed on centre of gravity displacement in ten adults (7 men and 3 women, age range 21–45 years, mean age 26.9 ± 5.7 years). The results showed that the vertical excursion (up-and-down range of motion) of the centre of gravity increased with increasing speed from approximately 2.7 cm at 0.7 m/s (slow walk: 1.6 mph) to approximately 4.8 cm at 1.6 m/s (moderate walking speed: 3.6 mph). In contrast, the mediolateral excursion (side-to-side range of motion) of the centre of gravity decreased with increasing speed from approximately 7.0 cm at 0.7 m/s to approximately 3.8 cm at 1.6 m/s.
Ground reaction force
The trajectory of the centre of gravity reflects the magnitude and direction of the ground reaction force. When standing upright the ground reaction force is equal in magnitude but opposite in direction to body weight (i.e. the resultant force acting on the body is zero) (Fig. 14.12A). To start walking or running (or to move horizontally by any other type of movement such as jumping or hopping) the body must push or pull against something to provide the necessary resultant force to move it in the required direction. In walking and running, forward movement is achieved by pushing obliquely downward and backward against the ground. Provided that the foot does not slip, the leg thrust results in a ground reaction force directed obliquely upward and forward, which moves the body forward while maintaining an upright posture (Fig. 14.12B). To understand the effect of the ground reaction force it is useful to resolve it into its vertical and horizontal components (Fig. 14.12C). The vertical component counteracts body weight, (i.e. the resultant vertical force acting on the body remains close to zero) and the horizontal component (resultant horizontal force) results in forward movement.
Components of the ground reaction force
Figure 14.12C shows the vertical and anteroposterior (forward–backward) components of the ground reaction force, but there is also a third component, the mediolateral (side-to-side) component (Fig. 14.13). When walking straight forward, the mediolateral component is normally very small, resulting in little side-to-side movement of the body. Figure 14.14 shows the vertical, anteroposterior and mediolateral components of the ground reaction force (force–time curves) exerted on each leg during the gait cycle. The movement of the centre of gravity during the gait cycle (as in any movement) is determined by the resultant force acting on it. During a period of single-support, the resultant force acting on the centre of gravity is determined by body weight and the ground reaction force exerted on the grounded foot. During a period of double-support, the resultant force acting on the centre of gravity is determined by body weight and the ground reaction forces exerted on both feet.
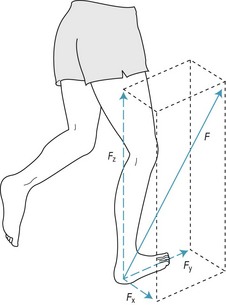
Figure 14.13 Mediolateral (FX), anteroposterior (FY) and vertical (FZ) components of the ground reaction force (F).
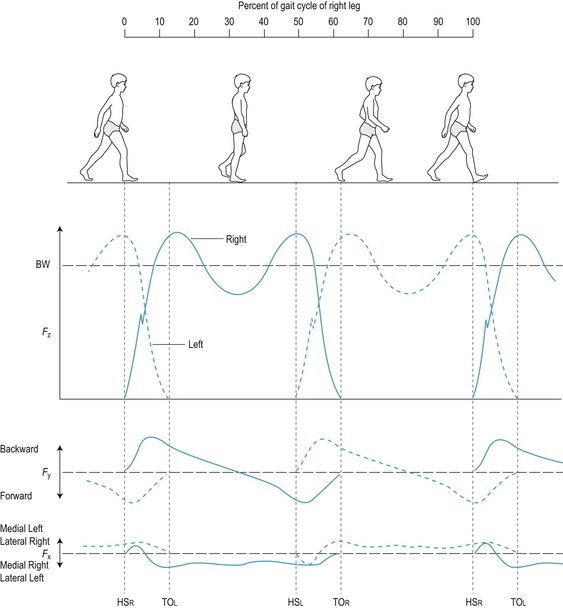
Figure 14.14 Mediolateral (FX), anteroposterior (FY) and vertical (FZ) components of the ground reaction force (F) during the gait cycle. BW, body weight; HO, heel-off; HS, heel-strike; TO, toe-off.
Figure 14.15 shows the force–time curve of the resultant vertical component of force acting on the centre of gravity during the gait cycle, together with the corresponding vertical velocity–time and vertical displacement–time curves. At heel strike (HS) the centre of gravity is decelerating downwards (downward velocity decreasing: phase D in Fig. 14.15) due to plantar flexion of the ankle, which starts about half-way through the heel-off (HO) to toe-off (TO) period. At the end of phase D, the vertical velocity of the centre of gravity is zero and it is at the lowest point in its trajectory; this corresponds to the midpoint of the double-support period. This is followed by a phase of upward acceleration of the centre of gravity (upward velocity increasing: phase A in Fig. 14.15). Maximum upward velocity of the centre of gravity occurs at the end of phase A, which is followed by a phase of deceleration upward (upward velocity decreasing: phase B in Fig. 14.15). At the end of phase B the vertical velocity of the centre of gravity is zero and it is at the highest point in its trajectory; this corresponds to the midpoint of the single-support period. This is followed by a phase of downward acceleration of the centre of gravity (downward velocity increasing: phase C in Fig. 14.15). Maximum downward velocity of the centre of gravity occurs at the end of phase C, which is followed by a phase of deceleration downward (downward velocity decreasing: phase D in Fig. 14.15). Heel strike of the other foot occurs during phase D, which terminates at the midpoint of double-support; the sequence of phases A, B, C and D then repeats.
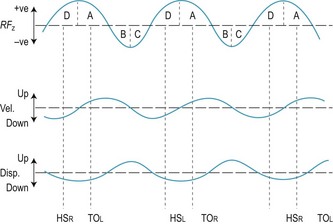
Figure 14.15 Resultant vertical component of force (RFZ) acting on the whole-body centre of gravity during the gait cycle, and the corresponding velocity and displacement curves.
The vertical component of the ground reaction force exerted on each leg is characteristically dominated by two smooth peaks, with the rise and fall of each peak taking up about half of the stance phase (Fig. 14.14). The rise and fall of the first peak roughly corresponds to the period from HS to HO, and the rise and fall of the second peak roughly corresponds to the period from HO to TO.
Like the vertical component, the anteroposterior component is normally characteristically dominated by two smooth peaks, the rise and fall of which correspond to the rise and fall of the two peaks of the vertical component. The resultant anteroposterior component of force acting on the centre of gravity during the gait cycle (following an analysis similar to that described above for the resultant vertical component) acts backward from the midpoint of double-support to HO (a braking force), indicating deceleration of the centre of gravity (i.e. the forward speed of the body is decreased). In the HO–TO period the resultant anteroposterior component acts forward, indicating forward acceleration of the centre of gravity (i.e. the forward speed of the body is increased).
The resultant mediolateral component of force acting on the centre of gravity during the gait cycle acts medially during single-support stance and changes direction during double-support (i.e. from medial on the right foot to medial on the left foot during the left HS–right TO period) (Fig. 14.14).
In addition to the characteristic smooth phases of the vertical, anteroposterior and mediolateral components of the ground reaction force, all three components are often characterised by single or multiple transient spikes soon after heel strike, which reflect the impact of the heel with the ground (see FZ in Fig. 14.14). Shock-absorbing footwear will reduce or eliminate these transient spikes (Czerniecki 1988).
Path of the centre of pressure
As indicated in Figure 14.14, the magnitude and direction of the ground reaction force change continuously during the gait cycle. Figure 14.16A shows the change in the resultant (FYZ) of the anteroposterior (FY) and vertical (FZ) components. Due to the dominance of FZ, the change in FYZ from HS to TO reflects the double-peaked FZ–time component in Fig. 14.14. FZ always acts upward, so that the progressive change in direction of FYZ from upward and backward at HS to more or less vertical at HO to upward and forward at TO is largely due to the change in the direction of FY from backward (HS to HO) to forward (HO to TO) (Fig. 14.14).
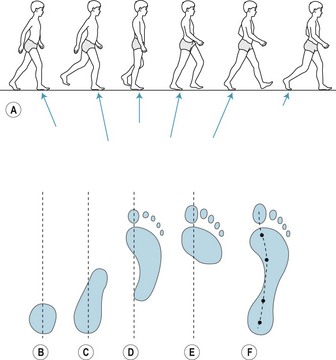
Figure 14.16 Movement of the centre of pressure along the plantar surface of the right foot during the stance phase of the right leg. (A) Change in the magnitude and direction of FYZ (resultant of FY and FZ). (B, C, D, E) Plantar contact area at heel-strike right, middle of double-support, heel-off right, and heel-strike left. (F) Path of the centre of pressure and location of the centre of pressure at the points corresponding to B, C, D and E, respectively.
During stance, the foot essentially rolls forward from heel to toe such that the contact area between foot and ground, and consequently the centre of pressure of the ground reaction force on each foot, change continuously, as shown in Fig. 14.16B–F (Hansen et al 2004).
GAIT ANALYSIS
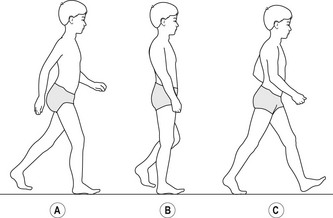
Walking is a fundamental form of human movement that normally provides the foundation for the development of other movements, including running, hopping, jumping and throwing (Malina & Bouchard 1991, Winter 1990). The importance of walking is reflected in the vast amount of research on the subject over many decades (Sutherland 2001, 2002). Children normally walk for the first time (i.e. take their first few steps without support) when they are 12–14 months old (Malina & Bouchard 1991). At this stage of development the child has the strength to maintain an upright posture and move the body forwards, albeit briefly, but the dynamic balance that is characteristic of mature gait takes much longer to develop (Clark & Phillips 1993). Consequently, a child’s initial efforts at walking are characterised by short, stiff-legged, jerky steps, with a relatively wide base of support and arms held outstretched at the sides for balance. As balance improves, the width of the base of support gradually decreases, steps gradually lengthen and the arms gradually become coordinated with the legs in the mature alternate swinging action. Most children establish a mature gait (i.e. mature walking action) by 4 years of age (Adolph et al 2003, Malina & Bouchard 1991).
Diagnosis of gait disorders
The initial examination of a patient presenting with a gait disorder tends to be concerned with a review of patient records, confirmation of the current general health status of the patient and identifying the symptoms of the patient’s current problem. Identification of symptoms normally involves a verbal description of the symptoms by the patient and a visual/physical examination by the clinician. In many cases, the main symptoms, subsequent diagnosis and proposed treatment are fairly clear. For example, a diabetic patient with peripheral neuropathy may present with an ulcer over the head of the first metatarsophalangeal joint (Caselli et al 2002). The diagnosis would probably be prolonged excessive pressure due to neuropathy resulting from diabetes. The immediate treatment would probably be to relieve the pressure on the ulcerated area in order to promote healing. Further treatment would probably involve modification of the patient’s footwear to reduce the pressure on the affected area and thus reduce the risk of further damage following recovery (Praet & Louwerens 2003, Zimny et al 2003). Diagnosis of many other gait problems, especially those without obvious lesions, is not likely to be so straightforward.
Walking is a whole-body activity and the ability to walk normally depends on adequate joint flexibility, adequate strength and appropriate neuromuscular coordination, especially in the trunk and legs. Consequently, deficits in joint flexibility, muscle strength or neuromuscular coordination are likely to affect gait. Deficits may be temporary, such as following an injury, or permanent, such as the result of a neurological disorder. Minor deficits can usually be compensated for, largely unconsciously, by slight changes in gait that have no significant adverse effect on the individual. However, when deficits result in significant adverse effects on gait, then some form of treatment is indicated (Perry 1990). In these cases, diagnosis normally involves some form of gait analysis.
Qualitative gait analysis
In the first instance, gait analysis normally involves a qualitative analysis, i.e. an analysis based on visual observation from the side, front and rear of the patient walking at their preferred speed (Perry 1990). During the observation, the clinician attempts to identify gait abnormalities on the basis of comparison of the patient’s movement with a mental image of what he or she would expect to see in a normal gait. Qualitative analysis is subjective in the sense that no direct objective measures of gait are made. However, the degree of subjectivity depends to a considerable extent on the knowledge and experience of the observer. Figure 14.17 shows a 63-year-old female at different points in the gait cycle. She has a stooped posture with the trunk bent forward. She shuffles her feet with short rapid steps as if she is going to fall forward. Her hands tremor constantly and her trunk and head lurch from side to side with each step. She clearly has an abnormal gait, which would be noticeable to a trained observer. However, the diagnosis might be more difficult. In this case the main cause is Parkinsonism. Figure 14.18 shows the front, overhead and rear views of a 17-year-old female during the gait cycle. She looks down to see where she is going to place her feet. She has a wide base of support, but the step angle is closed. Her trunk is oriented to the left and oscillates from side to side with each step. The gait is clearly abnormal, and in this case the main cause is Friedrich’s ataxia.
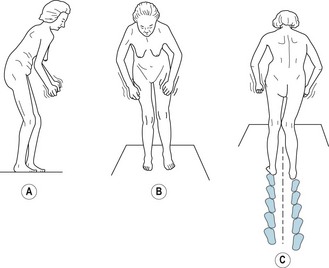
Figure 14.17 Side (A), front (B) and rear (C) views of a 63-year-old female with Parkinsonism during gait.
(Adapted from Ducroquet et al 1968.)
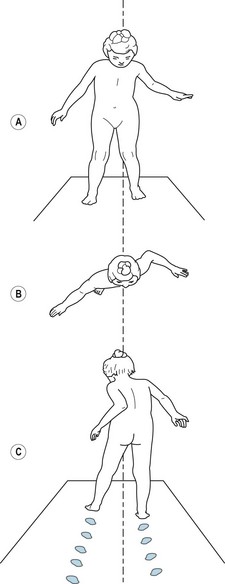
Figure 14.18 Front (A), overhead (B) and rear (C) views of a 17-year-old female with Friedriech’s ataxia during gait.
(Adapted from Ducroquet et al 1968.)
In many other cases, gait abnormalities are more difficult to detect, especially when changes occur gradually over time. Figure 14.19 shows side and front picture sequences of the right gait cycle of the same child suffering from Duchenne’s muscular dystrophy at early (5 years), transitional (7 years 6 months) and late (8 years 2 months) stages in the development of the disease (Sutherland 1984). Note the progressive development of lordosis, a wide base of support, equinus foot strike of the right foot and irregular arm action.
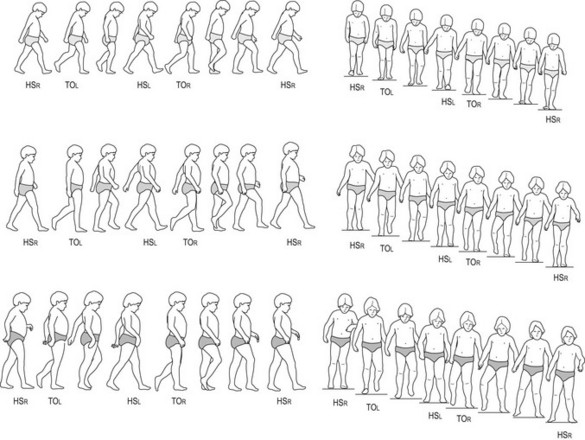
Figure 14.19 Side and front picture sequences of the right gait cycle of the same child at different stages of Duchenne’s muscular dystrophy. (Top) Early stage, 5 years of age. (Middle) Transitional stage, 7 years 6 months. (Bottom) Late stage, 8 years 2 months.
(Adapted from Sutherland 1984.)
Appropriate treatment clearly depends upon accurate diagnosis, which in turn depends on the quality of information available concerning the patient’s condition. In general, the more objective the gait analysis and the more objective the assessment of functional deficits (joint flexibility, muscle strength, coordination), the more accurate the diagnosis is likely to be. Objective gait analysis is usually referred to as quantitative gait analysis.
Quantitative gait analysis
The movement of the body during the gait cycle, as in every other movement, is the direct result of the internal and external forces acting on the body. The movement of the body as a whole (i.e. the movement of the whole-body centre of gravity) is determined by the resultant external force (i.e. the net effect of all the external forces acting on the body). During gait, the external forces acting on the body are body weight (a constant force acting vertically downwards) and the ground reaction forces. During double support, there will be a ground reaction force acting on the left foot and another ground reaction force acting on the right foot. During single support, there will be only one ground reaction force (i.e. the force acting on the supporting foot). Figure 14.20A shows the external forces acting on a 10-year-old boy at a point during terminal stance while walking at his preferred speed. There are two external forces, body weight acting at the centre of gravity and the ground reaction force acting at the centre of pressure on the right foot. The resultant external force, which determines the acceleration of the whole-body centre of gravity, is shown in Figure 14.20B,C; it is clearly much smaller in magnitude (reflected in the length of the line representing the force vector) than body weight or the ground reaction force and acts in a forward–upward direction.
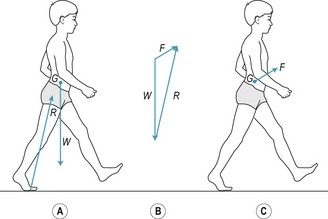
Figure 14.20 Resultant external force acting on a 10-year-old boy at a point during push-off of the right foot while walking at preferred speed. (A) External forces acting on the boy. (B) Vector chain method of determining the resultant external force. (C) Resultant external force acting on the boy. G, centre of gravity; W, body weight; R, ground reaction force acting on the right foot; F, resultant of W and R.
In clinical practice, the three components of the ground reaction force(s) can be measured by having the patient walk across a force plate or, preferably, two adjacent force plates so that the ground reaction forces on each foot can be measured separately (see Fig. 14.14). The force–time curves can be numerically integrated to determine the change in velocity (velocity–time) and displacement (displacement–time) of the centre of gravity. Kinematics is the branch of mechanics that describes the motion of objects in terms of displacement, velocity and acceleration. Kinetics is the branch of mechanics that describes the forces acting on objects. A kinetic analysis describes the cause of the observed kinematics (Watkins 2007). Figure 14.15 shows the kinetics (RFZ–time curve) and corresponding kinematics (velocity–time and displacement–time curves) of the vertical movement of the centre of gravity during the gait cycle.
During the gait cycle, body weight is constant in magnitude and direction, but the ground reaction forces (in double support) or ground reaction force (in single support) are continuously variable in magnitude and direction. This is due to the continuously variable muscle forces (sequencing and intensity of muscular activity). The magnitude and direction of the ground reaction forces directly reflect the response of the neuromusculoskeletal system to the need to maintain upright posture, balance and forward locomotion. Consequently, normal patterns of muscular activity during gait are directly reflected in normal ground reaction force–time patterns and vice versa. Figure 14.21A shows the line of action of the ground reaction force R acting on the right foot of a 10-year-old boy just after right heel-strike while walking with a normal gait at his preferred speed. At this point in the gait cycle, the line of action of R normally passes (in the YZ plane) in front of the transverse axis through the hip joint, very close to or just behind the transverse axis through the knee joint and behind the transverse axis through the ankle joint. Consequently, R tends to flex the hip joint due to the turning effect of R about the transverse axis through the hip joint. The turning effect of a force about a particular axis is referred to as the ‘moment’ of the force. The size of the moment is the product of the magnitude of the force and the moment arm of the force (i.e. the perpendicular distance between the line of action of the force and the axis of rotation). In Figure 14.21A, d is the moment arm of R about the transverse axis through the hip joint. The hip flexor turning moment exerted by R (i.e. R × d) is normally resisted by the hip extensors so that the normal action of slight hip extension between heel-strike and foot-flat occurs under control. However, weak hip extensors would tend to result in hip flexion instead of hip extension. In this case, the weak hip extensors may be compensated for by a shortened step involving reduced knee extension and a flat foot contact, which would tend to direct R closer to the transverse axis through the hip joint (i.e. reduce the moment arm of R) and, therefore, reduce the size of the hip flexor moment exerted by R to a level that the hip extensor muscles could cope with (Fig. 14.21B). Figure 14.21A,C illustrates a similar compensation at the ankle joint. Just after heel-strike, R normally exerts a plantar flexor moment on the ankle joint, as in Figure 14.21A. This plantar flexor moment is normally resisted by the dorsiflexors of the ankle joint and results in the normal action of controlled plantar flexion from heel-strike to foot-flat. However, weak dorsiflexors would tend to result in rapid uncontrolled plantar flexion. In this case, the weak dorsiflexors may be compensated for by a shortened step involving a flat foot contact, which would tend to direct R neutral to the ankle, thereby preventing the development of a plantar flexor moment (Fig. 14.21C).
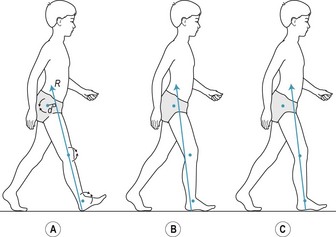
Figure 14.21 Effect of muscular activity on the line of action of the ground reaction force during gait. (A) Line of action of the ground reaction force (R) in relation to the transverse (mediolateral) axes through the hip, knee and ankle joints; d, moment arm of R about the transverse axis through the hip joint. (B) Possible compensation for weak hip extensors. (C) Possible compensation for weak ankle dorsiflexors.
Force–time analysis, as described in relation to Figure 14.21, is extremely helpful in identifying abnormal patterns of muscle activity in the diagnosis and treatment of gait abnormalities (Cerny 1984). The method is dependent on being able to accurately locate the centre of pressure, i.e. the point at which the whole of the ground reaction force acting on the foot can be considered to act. However, the ground reaction force does not act at a single point; it is distributed across the whole of that part of the plantar surface of the foot that is in contact with the support surface. Since the plantar contact area and the magnitude of the ground reaction force both vary continuously during the gait cycle, it follows that the average pressure on the plantar contact area also varies. Furthermore, the pressure across the plantar contact area also varies quite considerably, as all parts of the plantar contact area do not transmit the same amount of load. The variation in load across the plantar contact area is due to the shape and structure of the foot. The feet of normal children are not as stiff as those of adults due to the relatively greater proportion of cartilage to bone; this tends to distribute the ground reaction force more evenly across the plantar contact area (Hennig & Rosenbaum 1991). In contrast, neurological disorders such as muscular dystrophy and hemiplegia tend to alter the shape and flexibility of the foot arches, which tends to accentuate local differences in plantar pressure, especially in the forefoot (Femery et al 2002, Meyring et al 1997). Consequently, in clinical practice, local pressure measurements (the variation in pressure over the contact area) are more useful than average pressure measurements.
Hennig et al (1994) measured the peak plantar pressure at seven plantar locations in 125 children aged between 6 and 10 years walking slowly while barefoot. Compared to adults (Hennig & Rosenbaum 1991) the children showed considerably lower peak pressures at all plantar locations. The mean body weight to plantar contact area ratios (standing upright on both feet) for the children and adults were 1.66 N/cm2 and 2.63 N/cm2, respectively, and the lower peak pressures for the children when walking were mainly attributed to their relatively larger feet. Dynamic activities tend to result in greater plantar pressures than static or quasi-static activities. Rozema et al (1996) measured peak pressure on the plantar surface of the foot as a whole and at seven plantar locations (heel, midfoot, heads of the first, second, and fifth metatarsals, hallux, other toes) in 12 healthy adults (mean age 26 years, range 20–33 years) wearing the same type of shoe while performing six activities of daily living (standing, slow and fast walking, slow running, walking up and down stairs, rising from sitting in a chair, walking in a circle). All except the sitting tasks showed significantly higher pressures in all regions of the foot compared to standing, with the exception of pressures in the heel region while walking up and down stairs.
Excessive plantar pressure on any part of the foot will reduce, and may occlude, blood flow to the affected area, resulting in ischaemia. If prolonged, this condition can have serious consequences, such as ulceration or gangrene. Patients with peripheral neuropathy (lack of sensation to pressure and pain), which is often the result of diabetes mellitus, are particularly at risk. In such cases, assessment of local peak pressure is essential for diagnosis and treatment (Mueller et al 2003).
Assessment of local peak pressure is a widely used tool for assessing normal and abnormal foot conditions (Orlin & McPoil 2000). There are basically two types of measurement system: platform systems and insole systems. Platform systems consist of instrumented surfaces (e.g. Emed sensor platform, Musgrave footprint system) or mats (e.g. F-Scan) located in or on a level walkway. The main disadvantage of platform systems is that the patient has to target the instrumented area of the platform, which may be fairly small (e.g. 20 cm × 30 cm). Consequently, many trials may be required in order to record natural movement. Insole systems are based on sensors that are worn inside the shoe in the form of discrete sensors (taped to target sites on the skin) or multiple sensors built into an insole (e.g. Emed Pedar System, RScan, F-Scan). Insole systems are usually linked to a data logger worn on a belt at the patient’s waist. The main disadvantage of insole systems is the extent to which the discrete sensors or insoles and linked data logger impair natural movement.
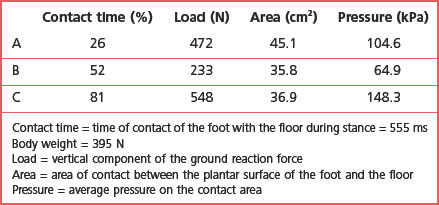
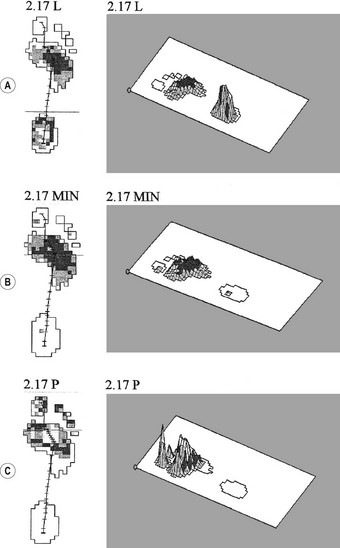
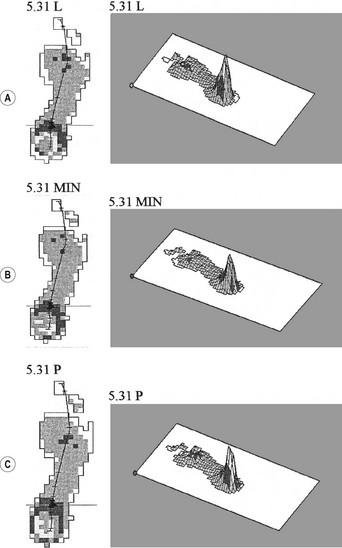
Most platform systems and insole systems are based on a matrix of multiple adjacent sensors (usually 2–5 sensors/cm2). Each sensor measures the force acting on it at the sampling frequency set by the operator (usually 50–100 Hz for walking). The instrumentation computes the pressure on each sensor (force/area of the sensor) and outputs the plantar pressure pattern in two or three dimensions, graphic such as those in Figures 14.22 and 14.23. Figure 14.22 shows the two- and three-dimensional plantar pressure patterns on the right foot of a healthy 15-year-old female at three points during the right stance phase while walking barefoot at her preferred speed on a Musgrave platform. Figure 14.22A corresponds to the instant of peak vertical ground reaction force between foot-flat and midstance (26% of contact time). Figure 14.22B corresponds to the instant of minimum vertical ground reaction force between foot-flat and heel-off (52% of contact time). Figure 14.22C corresponds to the instant of peak vertical ground reaction force between midstance and toe-off (81% of contact time). The load, contact area and average pressure acting on the foot at each instant are shown in the table accompanying Figure 14.22. Figure 14.22A–C shows the normal progression of the centre of pressure from heel to toe and the accompanying changes in contact area and pressure. Figure 14.23 shows the two- and three-dimensional plantar pressure patterns on the right foot of a 13-year-old male with juvenile idiopathic arthritis, including right-foot involvement, at three points during the right stance phase while walking barefoot at his preferred speed on a Musgrave platform. Figure 14.23A–C corresponds to 23%, 47% and 74% of contact time, respectively, i.e. roughly equivalent to the same points in time (proportion of contact time) as in Figure 14.22. The load, contact area and average pressure acting on the foot at each instant are shown in the table accompanying Figure 14.23. It is clear that the plantar pressure patterns of the subject with juvenile idiopathic arthritis (Fig. 14.23) are markedly different from those of the normal subject (Fig. 14.22). The most noticeable differences are in the lack of progression of the centre of pressure in the subject with juvenile idiopathic arthritis (most of the weight is taken on the heel throughout the stance phase) and in the increased size of the contact area in the juvenile idiopathic arthritis subject (most of the plantar surface is in contact with the floor throughout the stance phase). The plantar pressure patterns of the juvenile idiopathic arthritis subject presumably reflect neuromusculoskeletal adaptations to minimise pain.
Adolph KE, Vereijken B, Shrout PE. What changes in infant walking and why? Child Development. 2003;74:475-497.
Caselli A, Pham H, Giurini JM, et al. The forefoot-to-rearfoot plantar pressure ratio is increased in severe diabetic neuropathy and can predict foot ulceration. Diabetic Care. 2002;25(6):1066-1071.
Cerny K. Pathomechanics of stance: clinical concepts for analysis. Physical Therapy. 1984;63(12):1851-1859.
Clark JE, Phillips SJ. A longitudinal study of intralimb coordination in the first year of independent walking: a dynamical systems analysis. Child Development. 1993;64:1143-1157.
Czerniecki JM. Foot and ankle biomechanics in walking and running: a review. American Journal of Physical Medicine and Rehabilitation. 1988;67:246-252.
Ducroquet R, Ducroquet J, Ducroquet P. Walking and limping. A study of normal and pathological walking (trans. from French edition (Paris 1965) by Hunter WS, Hunter J). Philadelphia, PA: Lippincott; 1968.
Femery V, Moreto P, Renaut H, et al. Measurement of plantar pressure distribution in hemiplegic children: changes to adaptive gait patterns in accordance with deficiency. Clinical Biomechanics. 2002;17:406-413.
Hansen AD, Childress DS, Knox EH. Roll-over shapes of human locomotor systems: effects of walking speed. Clinical Biomechanics. 2004;19:407-414.
Hennig EM, Rosenbaum D. Pressure distribution patterns under the feet of children in comparison to adults. Foot and Ankle. 1991;11(5):306-311.
Hennig EM, Staats A, Rosenbaum D. Plantar pressure distribution patterns of young children in comparison to adults. Foot and Ankle. 1994;15(10):35-40.
Horak FB. Postural orientation and equilibrium: what do we need to know about neural control of balance to prevent falls? Age and Ageing. 2006;35(Suppl 2):ii7-ii11.
Malina RM, Bouchard C. Growth, maturation, and physical activity. Champaign, IL: Human Kinetics Corp; 1991.
Mueller MJ, Hastings M, Comean PK, et al. Forefoot structural predictors of plantar pressures during walking in people with diabetes and peripheral neuropathy. Journal of Biomechanics. 2003;36:1009-1017.
Meyring S, Diehl RR, Milani TL, et al. Dynamic plantar pressure distribution measurements in hemiparteic patients. Clinical Biomechanics. 1997;12:60-65.
Orendurff MS, Segal AD, Klute GK, et al. The effect of walking speed on center of mass displacement. Journal of Rehabilitation Research & Development. 2004;41(6A):829-834.
Orlin MN, McPoil TG. Plantar pressure measurement. Physical Therapy. 2000;80(4):399-409.
Peterka RJ. Sensorimotor integration in human postural control. Journal of Neurophysiology. 2002;88:1097-1118.
Perry J. Pathologic gait. In: Greene WD, editor. Instructional course lectures, Vol. 29. Rosemont, IL: America Academy of Orthopaedic Surgeons; 1990:325-331.
Praet SFE, Louwerens J-WK. The influence of shoe design on plantar pressures in neuropathic feet. Diabetic Care. 2003;26(2):441-445.
Roberts TDM. Understanding balance: the mechanics of posture and locomotion. London: Chapman and Hall; 1995.
Rozema BA, Ulbrecht JS, Pammer SE, Cavanagh PR. In-shoe plantar pressures during activities of daily living: implications for therapeutic footwear design. Foot and Ankle International. 1996;17(6):352-359.
Sutherland DH. Gait disorders in childhood and adolescence. Baltimore, OH: Williams & Wilkins; 1984.
Sutherland DH. The evolution of clinical gait analysis. Part 1: kinesiological EMG. Gait and Posture. 2001;14:61-70.
Sutherland DH. The evolution of clinical gait analysis. Part 2: kinematics. Gait and Posture. 2002;16:159-179.
Watkins J. Structure and function of the musculoskeletal system. Champaign, IL: Human Kinetics; 1999.
Watkins J. An introduction to biomechanics of sport and exercise. Edinburgh: Churchill Livingstone; 2007.
Winter DA. Biomechanics and motor control of human movement. New York: Wiley; 1990.
Winter DA. Human balance and posture control during standing and walking. Gait & Posture. 1995;3(4):193-214.
Winter DA, Patla AE, Prince F, et al. Stiffness control of balance in quiet standing. Journal of Neurophysiology. 1998;80:1211-1221.
Zimny S, Schatz H, Pfohl U. The effects of applied felted foam on wound healing times in the therapy of neuropathic diabetic foot ulcers. Diabetic Medicine. 2003;20(8):622-625.