Chapter 22 Diagnostic imaging
Computerised tomography (CT scans)
Magnetic resonance imaging (MRI)
Osteochondritis or osteonecrosis
INTRODUCTION
Röntgen’s (usually written as Roentgen) accidental production of x-rays in 1895 and the first ever x-ray image (radiograph) of living human tissue, his wife’s hand, served to advance the course of medical investigation and diagnosis, with ensuing benefits for patients. Diagnostic imaging continues to be one of the most dynamically evolving fields of medicine (Yester & White 2006). Advances in imaging have gathered pace with, for example, the use of multiplanar image reconstruction, ever increasing resolution in tomography and the developments in fifth-generation magnetic resonance imaging (MRI) scanners.
The production of three-dimensional imaging data improves visualisation. The development of new radioisotopes may enable the visualisation of inflamed and damaged synovia (Fleming et al 2005). Advances in arthroscopic examination and surgery allow for the evaluation of conditions such as synovitis, impingements and obscure fractures (Katz & Gomoll 2007). While the traditional plain radiograph may still have precedence for most initial imaging, its production and storage is now likely to be digital rather than analogue. The latter format may be converted to a digital format using laser scanners, and then stored electronically, and sent almost anywhere in an instant using the Picture Archiving & Communication System (PACS). Thus ‘teleradiology’ is an increasing phenomenon (Körner et al 2007). The nature of investigation has also developed, so that there is often a physiological component to imaging as well as the usual anatomical context, and the next move will be at the molecular level.
The first hundred years of imaging have looked at structure, while the next hundred will concentrate on function.
Podiatrists’ access to radiography and other modalities varies greatly. For some, particularly those involved in surgery, it will be routine to request, and be involved in the interpretation of, radiographs and other imaging modalities, while for others there may be little opportunity for direct contact with these specialities. However, changes in legislation in the UK have facilitated the possibility of more practitioners, including extended-scope podiatrists, referring directly to radiology departments. Even practitioners not directly involved with imaging require a basic knowledge of the key features of these modalities to enable effective understanding within their practice. To that end, the main aim of this chapter is to provide an introduction that will enable podiatry students and practitioners to appreciate each of the imaging modalities, their advantages and disadvantages, and their specific uses in the foot and ankle. More detailed information should be sought in specialist texts.
IMAGING MODALITIES
Radiographs provide a considerable amount of information for the assessment of osseous, and in some cases, soft tissues. The plain radiograph remains the most widely used of the imaging modalities. However, other technologies are also available to aid diagnosis. These are usually ‘second-line’ investigations, partly because some are very expensive, and partly because they require highly specialised application and interpretation. The radiologist will choose the most appropriate modality for assessing the pathology under investigation. The patient’s and the operator’s safety is of paramount importance when utilising imaging modalities, which are based on ionising radiation, and there needs to be a justification for each exposure. Non-ionising imaging modalities do not constitute the same known risks. However, because no long-term damage has been noted, does not mean that it does not exist.
MAGNETIC RESONANCE IMAGING
MRI has minimal complications or contraindications, does not rely on ionising radiation and can provide highly detailed, multiplanar images. Despite the relative expense of the equipment, there is an increasing availability of MRI scanners, including open machines, which ameliorate the ‘fear factor’, and those developed specifically for limb investigations. Together with reducing capital costs, there has also been a significant drop in the per capita costs to NHS Trusts, and increasing options for relatively low-cost private investigations. However, in the majority of cases MRI would be regarded as a second-line option (McGonagle et al 2002). MRI is considered a safe modality, and only a small number of patients are at risk from the powerful magnetic force of the machine. However, considering the relative newness of this modality, long-term bioeffects and operator and patient safety cannot be completely discounted (Bassen et al 2005). It is only those patients with cardiac pacemakers, cerebral aneurysm clips, or implanted electromagnetic devices who are absolutely contraindicated. Pregnant patients, and those with prosthetic heart valves, or orthopaedic metalwork, may undergo an MRI scan if there is a defined clinical need.
When a patient, or part of a patient’s anatomy, is placed in a strong magnetic field of approximately 1 tesla (T) and subjected to electromagnetic pulses, magnetic resonance images will be generated. A tesla is defined as the field intensity generating one newton of force per ampere of current per metre of conductor (Rowlett 2004). One tesla is an extremely powerful magnetic force and many times that exerted by the Earth’s own magnetic flux at its surface (50 µT). The hydrogen atoms within the patient’s body align themselves in the direction of the magnetic field. This is because hydrogen atoms have their own magnetic property, known as the ‘nuclear magnetic moment’. Normally, protons have their own random orientation, but in a strong magnetic field they will align in parallel. In order to excite the hydrogen atoms, radiofrequency electromagnetic pulses are directed at the patient, usually at 43 megahertz (MHz). The pulses have the same frequency as the protons, enabling them to acquire energy from the pulse, and this is known as ‘resonance’. The protons will alternately relax and realign, and they will emit radio waves that can be detected and, via a complex processing of signal transmission, reception and reconstruction, magnetic resonance images will be built by the computer (Yester et al 2006).
Choosing different radiofrequency pulse sequences can alter tissue contrast. The most commonly used MRI sequences are T1 weighted (T1W) and T2 weighted (T2W), and short T1 inverse recovery (STIR).The ‘T’ refers to a time factor where the alignment of the atoms follows a logarithmic curve, and T1 indicates the point at which 63% of the maximum possible alignment has been reached.T2 indicates the time it takes the signal to die down to 37% of its original intensity. T1-weighted images give good definition of the anatomy because fat-containing structures have a high signal, seen as white on the scan, while water-bearing tissues will appear much darker. T2-weighted images are better for showing pathologies, because of the presence of water/swelling.
The scan can be done in 3–5 mm sections, and in any plane – the thinner the section, the greater the subtle detail (Heron 1993).
The best resolution is found in the soft-tissue contrast; for example, tendons, muscles, blood vessels, and hyaline cartilage. T1-weighted images will show healthy bone marrow as white, because of its hydrogen content, but if the fat is selectively suppressed (STIR) a much darker, almost black image of the healthy marrow is formed.
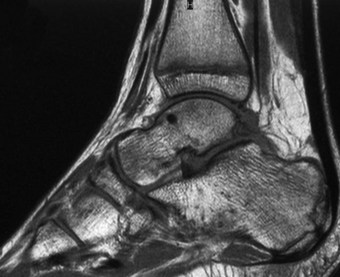
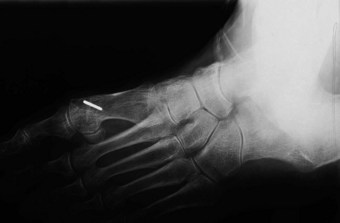
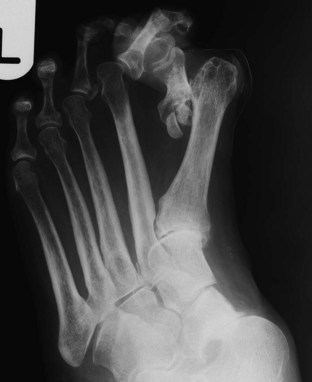
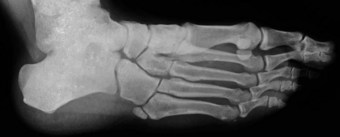
In podiatry, MRI is useful for normal anatomy and for pathologies involving tendons, ligaments and infections, including osteomyelitis. It can also be used to image compartment syndromes and tumours. In addition, it has a high sensitivity and specificity for Morton’s neuroma (George et al 2005). MRI is superior to computerised tomography (CT) scans and ultrasound imaging for all soft-tissue and marrow investigations, but the CT scan will be required when examining the bony cortex and for any bone erosion (Traughber 1999) (Fig 22.1). Intravenous gadolinium is used a contrast medium when a definitive diagnosis of osteomyelitis is needed.
ULTRASOUND
Ultrasound is based on the use of inaudible high-frequency sound waves to produce images. Similar to radar, these sound waves are sent as pulses. The sound waves enter the body, where some are absorbed and others are reflected back. The pulses are transmitted via a scan head, which has a number of transducers (i.e. piezoelectric crystals), which convert electrical pulses to sound waves. Typical frequencies are 3–10 MHz, but 6–10 MHz are the most often used frequencies used in pedal examinations (Mendicino & Rockett 1997). The ultrasound pulses are attenuated by tissues, and they are almost totally reflected by bone. Fluids do not reflect signals and are termed ‘anechoic’, but firmer tissues, for example tendon and muscles, will produce reflections and are called ‘echogenic’.
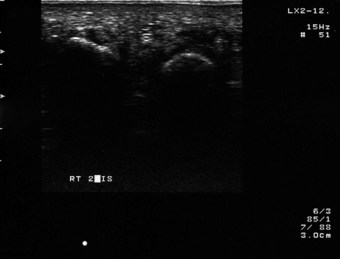
Sonography may be used to image any of the soft tissues in the foot. It can be used to identify soft-tissue tumours and trauma (e.g. a torn tendon). One of its major uses for podiatrists is, for example, in identifying a Morton’s neuroma (Fig. 22.2) and perhaps establishing a differential diagnosis from a bursa. However, obtaining a completely accurate diagnosis is based on the skill of the operator and adherence to a defined technique (e.g. scanning the foot both dorsally and plantarly). The actual neuroma may lie in an adjacent intermetatarsal space to the one identified on the scan, necessitating the surgical investigation of the adjoining interspace (Betts 2003). The use of this modality in musculoskeletal investigation, by a variety of health professions, including podiatry, is likely to continue to expand as the costs become more affordable. However, it does require an extremely well-trained operator to translate the images, particularly as it is a ‘real-time’ modality and, although ‘capturable’, the images are transient. Quantitative ultrasound has been used as a diagnostic examination of the calcaneal bone for osteoporosis (Cryer et al 2007). This technology is also employed in basic and advanced Doppler examinations (Chambers 1995). To date, no known safety problems or bioeffects have been recorded, but this does not ensure that none will emerge (Hachiya 2006).
IMAGING MODALITIES UTILISING IONISING RADIATION: SAFETY AND LEGISLATION
Everyone is exposed to background radiation to a greater or lesser extent. This may be from natural sources or man made, with the majority of the latter received from medical exposures. The use of ‘high-load’ (in dosage terms) procedures is increasing (Picno 2004). However, it must be appreciated that radiation does have a damaging effect on tissues, including genetic damage and the development of cancers, and therefore the uncontrolled use of ionising radiation would not be acceptable (Berrington De Gonzalez & Darby 2004). The public are protected by legislation that requires justification for exposure to these modalities. The ALARA principle (i.e. As Low as Reasonably Achievable) is still regarded by national and international bodies, such as the International Commission on Radiological Protection (ICRP), as the optimum approach. Specific information about dose levels and the effects on biological tissue are beyond the scope of this text; suffice it to say that all exposures will need justification that the benefits outweigh the costs (Martins 2003).
The current UK and European Union regulations, Ionising Radiation (Medical Exposure) Regulations 2000, is the statutory instrument and came into force on 13 May 2000 (Journal of the European Communities 1997). The central tenet of the new regulations is that all medical exposures are fully justified.
In practice, precise definitions are used to identify those referring, taking, or making a clinical decision on whether and what imaging is required, and that there is a net benefit to the patient. Podiatrists could be categorised in one or all of these designations, depending on their working environment. The definitions are:
In practical terms, there will obviously be a great variation in the number of patients that podiatrists will refer for radiographs. The patient’s general practitioner will probably remain the first referral point for most podiatrists. However, those in private practice may purchase radiographic services for their patients, and those in hospital situations may have direct access to the radiology department via local rules and protocols. There may be a small number of podiatrists who may have their own radiography unit. In this scenario, and if self-employed, they may fulfil the role of employer, practitioner, referrer and operator. The use of a radiography unit outwith a medically controlled hospital setting will necessitate the podiatrist notifying the Health & Safety Executive and establishing a link with a radiation-protection advisor, usually a physicist, who will advise on all aspects of the radiography setup.
COMPUTERISED TOMOGRAPHY
The CT scan offers major advantages over the standard radiograph. In particular, the limiting quality of the two-dimensional radiographic image is replaced by a technique that can, ultimately, with the use of computer technology, produce three-dimensional images of body tissues through all planes. The scan may be done in a plain format or by using a contrast medium, which can be introduced into the patient’s body orally or via a vein.
A CT scanner will usually consist of a gantry that holds the x-ray tube and a series of up to 1200 detectors, and this will be connected to an x-ray generator. There will be connection to a computer for the analysis of the data and production of the images. The patient will be placed in the desired position and moved slowly through the apparatus. The x-ray tube can rotate continuously around them by up to 360°, emitting a narrow beam of x-rays in a fan-shaped configuration. This beam is picked up by the detectors and fed back into the computer. As the data are acquired in a spiral manner, the term ‘spiral CT’ is used (Sutton 1997).
A CT scan is an individual slice or section of data ranging from 1.5 mm to 10 mm. A larger number of thin sections will produce better data for diagnosis. The 2-mm sections are probably the most useful for the foot and ankle (Oloff-Solomon & Solomon 1988). The digitised images are displayed on a monitor. Advances in software permit three-dimensional surface reconstructions.
Fundamentally, as the x-rays pass through the body tissues they are attenuated, and this enables absorption coefficient values to be calculated. These values are expressed in Hounsfield units (HU) and are normalised to water: water is scored as 0 HU, air at –1000 HU and bone at 1000 HU. Compact bone will appear white, while air will appear black on the subsequent image (Fig. 22.3). Manipulation by the operator will produce the desired image quality of the part under investigation.
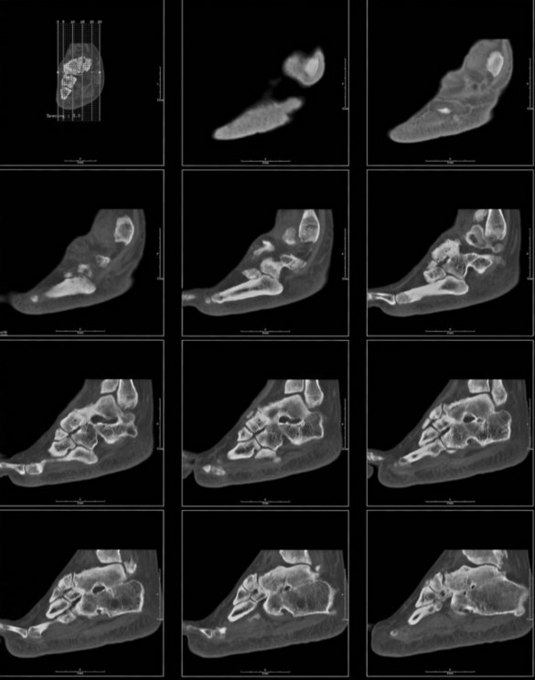
Figure 22.3 CT scan illustrating multiple sections through the foot in the sagittal plane, demonstrating osteoarthritis.
The main advantages of the CT scan are its spatial precision, excellent contrast and three-dimensional image. The main disadvantages are that the patient is exposed to relatively large doses of ionising radiation and that soft-tissue differentiation is far inferior to that obtained with MRI. CT scans are particularly valuable for examining cortical bone (but not the bone matrix), periosteal reactions, calcification of tissues, osteomyelitis (particularly valuable in the diabetic foot) and tarsal coalitions (Loredo & Metter 1997). CT scans have been described as the gold standard for cross-sectional imaging of the leg and ankle (Oloff-Solomon & Solomon 1988).
FLUOROSCOPY
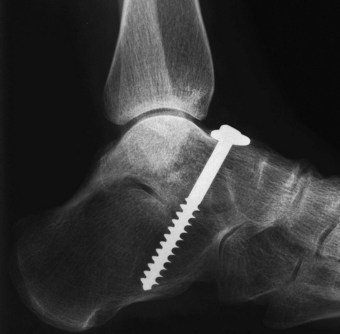
Fluoroscopy, first used in 1896, is an x-ray technique with the same safety considerations as all techniques utilising ionising radiation. In modern units the x-rays strike a fluorescent plate that is linked to a computer, which sends the data to a monitor where real-time images are displayed. In some podiatric surgery facilities a C-arm fluoroscopy unit is used to ascertain the position of pins, screws and, possibly, joint implants. The exposure rate must be kept as low as possible, and this can be achieved by means of taking time-delayed images and safe practice.
The freedom to position the fluoroscopy unit and the fact that ‘real-time’ images are available makes fluoroscopy a valuable, although expensive, tool. Modern machines use lower exposure than standard images using radiographic film, but the resolution of the image is inferior (Sanders et al 1993). Fluoroscopy is used in a variety of situations, including endoscopy, imaging the gastrointestinal tract and in a process called digital subtraction angiography (DSA).
Dual energy x-ray absorptiometry (DEXA) is another use of ionising radiation, where evaluation of the bone mass is usually made at the femoral neck and spine, but the whole body can be imaged. It provides a more accurate assessment of whether the bone is osteoporotic than do plain radiographs, where operator variability may compromise their validity (Walker 2008). Another technique, x-ray radiogrammetry (DXR), is also used and this may be valuable in quantifying bone loss, particularly in rheumatoid disease. The use of an ultrasound scan for an assessment of calcaneal bone has not proved to be as accurate in identifying osteoporosis (Böttcher et al 2006).
NUCLEAR MEDICINE IMAGING
Nuclear medicine (NM) imaging is a long-established imaging modality, originating in the 1940s (Sutton 1997), that continues to evolve in sophistication with the development of new radioisotopes and increasingly powerful computers. While not a first-line modality, radioactive isotopes are used in a variety of clinical situations where plain radiographs may have failed to identify pathology. Their original use in identifying tumours, particularly metastases (Loredo & Metter 1997), has expanded and radioisotopes are now very valuable for the identification of osteomyelitis, soft-tissue infections, trauma and degenerative changes found in neuroarthropathy, particularly in the diabetic foot.
NM imaging differs from the other techniques in that it may be considered a physiological, as well as an anatomical, modality. NM techniques are much more sensitive to changes in the bone tissue; for example, osteomyelitis can be detected much earlier, at some 2–3 days, unlike the several weeks associated with a standard radiograph (Schauwecker 1992). Stress fractures can also be identified very early, within 24–48 hours, which may be critical for an elite athlete in training or competition.
The three mostly widely used and tested agents are technetium-99m (Tc99m) phosphate, gallium-67 (Ga67) citrate and indium-111 (In111). Technetium-99m and gallium-67 are introduced via intravenous injection, while indium-111 requires a more time-consuming technique, involving extraction of blood from the patient and preparation by fractionating and labelling the leucocytes, which are then reinjected into the patient (hence the name, ‘labelled leucocyte scan’). However, while this latter method has greater sensitivity and specificity, the technetiumc-99m remains the most frequently used agent (Brown & Holder 1996).
The triple-phase bone scan (TPBS) utilises radioactive technetium-99m, which following intravenous injection is first taken up by the blood (flow phase), and may be imaged serially in 60 or more sections at 1- to 10-second intervals. It is then taken up by the soft tissues (blood pool phase) and may be imaged at 3–6 minutes. Finally, it is taken up by bone, and may be scanned 4–6 hours later (delayed phase or metabolic phase). The technetium-99m has a short half-life (6 hours), and within 3 hours approximately 35% of the injected dose will have been excreted via the kidneys. Bone will take up 30–40% of the technetium-99m. It is regarded as a safe procedure for the patient in terms of exposure to radiation, comparing favourably with a standard radiographic exposure.
Imaging is undertaken using either a gamma scintillation camera or by means of a specialised CT scan. The camera uses a sodium iodide scintillation crystal that is able to detect the gamma photons given off by the radioisotope. The apparatus electronically converts the energy into a light scintillation, and ultimately an electric signal that produces the anatomical image, or scintigram. However, technetium-99m will only give off one gamma ray or photon at a time, and these can be recorded in a CT scan by a process known as ‘single photon emission tomography’ (SPECT). Another radionuclide is fluorine-18; this will emit positrons when in contact with electrons. The two photons produced by the positron emitters travel in opposite directions. Detectors in a ring formation are able to detect and scan the positrons. This process is known as ‘positron emission tomography’ (PET) (Collier et al 1996).
Gallium-67 citrate is particularly good for identifying osteomyelitis, malignant melanoma, metastases and inflammation, but it is used far less than technetium-99m. It has a half-life of 3 days and will be excreted by the kidneys initially, but then via the intestinal mucosa.
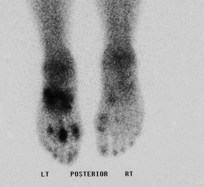
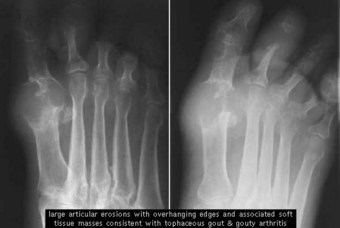
Indium-111 scans are the least used because of their higher cost, greater complexity and the fact that they may give false-positive results (Alazraki 1995). However, it is particularly sensitive for identifying acute osteomyelitis and soft-tissue infections of the foot. Scintiscans can also demonstrate a ‘hot spot’ in an arthritic condition (Fig. 22.4).
PLAIN RADIOGRAPHY
The plain radiograph is still an indispensable tool and should form the cornerstone of imaging protocols. It is quite cheap, enjoys the highest spatial resolution, and is easily reproducible.
(Cassar-Pullicino 2002, p. 58)
Accelerating electrons across a high-voltage vacuum tube from the cathode to the anode produces x-rays, albeit that only approximately 1% of the energy will be converted to x-rays, with the remaining energy being converted to heat. These rays strike the patient, with some being absorbed and others scattered. Some rays will pass through the foot and strike a cassette, which in addition to holding the photographic film may also contain rare-earth intensifying screens, which in practice reduces the dose of x-rays required to produce an image. When developed, the film provides a negative image of the tissues (Dattner 1999). Although not as frequently used, Polaroid radiography is available. However, the image obtained with this process is reversed, with a black image against a white background (Fig. 22.5). Plain radiography is widely used in the diagnosis of a number of conditions affecting the feet. These pathologies may be of a local origin, as a result of trauma, or as a consequence of some systemic disease. Radiographs may be utilised in the pre- and postsurgical assessment of patients and for biomechanical charting. This latter use may be difficult to justify in terms of best practice, as the benefits would need to outweigh the costs of exposing individuals to ionising radiation.
COMMON RADIOGRAPHIC PROJECTIONS
A radiographic projection refers to the direction in which the x-ray beam travels through the body. This term describes a positioning technique, and not the radiological image that is created. Position refers to that part of the body that is closest to the radiographic film. It includes such factors as whether the radiograph is taken when weight bearing or non-weight bearing, or by defining the angle (e.g. ‘non-weight-bearing, lateral oblique’ would serve to refine the basic anatomical position). A radiographic view refers to the image and is not a directional factor. There is sometimes confusion regarding these terms, with ‘projection’ and ‘view’ often interchanged when they should not be (Christman 2003).
There are over 20 possible projections of the foot and ankle (Table 22.1), but in daily practice only a small number of these projections are used. It is the individual practitioner who determines how many views are required. Some will take views of both feet, so enabling a comparison to be made. Others may choose to image just one foot. In many cases the two-dimensional image provided by the radiograph will yield inadequate information, thus necessitating two different projections to be made. For example, a fracture may not be evident on one view, but may show up on a view recorded from a different angle. When looking at the first metatarsophalangeal joint prior to surgery, a dorsoplantar and a lateral or lateral-oblique projection may be the best options.
Table 22.1 Projection techniques
| Projection/technique | Weight bearing/non-weight bearing | Technique |
|---|---|---|
| Dorsoplantar projections | Weight on or off | Vertical or 15° cephalic |
| Oblique positions | Weight on | Medial |
| Lateral | ||
| Weight on | Lateromedial oblique projection | |
| Mediolateral oblique projection | ||
| Lateral positions | Weight on or off | Lateromedial projection |
| Mediolateral projection | ||
| Individual toe positions | Weight on or off | Lateromedial projection |
| Mediolateral projection | ||
| Dorsoplantar projection | ||
| Oblique positions | ||
| Sesamoid positioning techniques | Weight on or off | Posteroanterior axial projection |
| Anteroposterior axial projection | ||
| Lateromedial tangential projection | ||
| Tarsal positioning techniques | Weight off | Dorsoplantar calcaneal axial projection |
| Weight off | Plantodorsal calcaneal axial projection | |
| Weight on | Harris–Beath (calcaneal axial view) | |
| Weight off | Broden | |
| Weight off | Isherwood | |
| Ankle positioning techniques | Weight on or off | Anteroposterior projection |
| Mortise position | ||
| Oblique positions (internal/external) | ||
| Lateral positions (lateral/medial projections) |
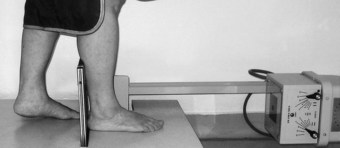
The dorsoplantar projection (also known as the anteroposterior view)
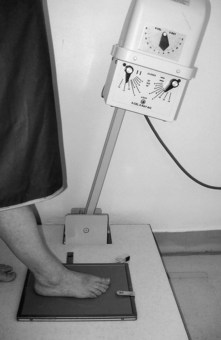
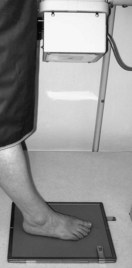
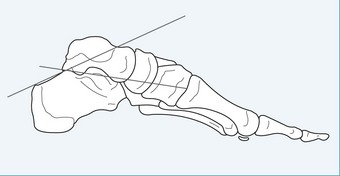
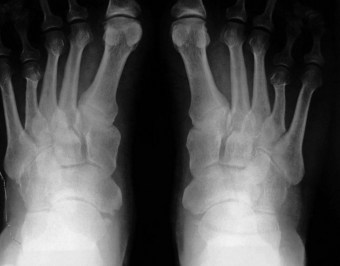
This is the most frequently used projection for the foot, and one that is best done on weight bearing. The beam is directed 15° cephalically, thus eliminating any distortion caused by the natural declination of the metatarsals. This projection is particularly valuable for demonstrating the phalanges, metatarsals and midfoot. However, the ‘useful beam’ may be collimated (limited) to a more particular area under investigation. This centring and collimation of the beam will highlight the area for greatest detail on the exposure (Figs. 22.6 and 22.7).
Lateromedial oblique projection
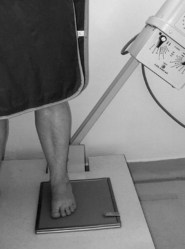
This projection is used frequently for podiatric presurgical evaluation. If weight bearing, the tube head is angled at 45°, and if non-weight bearing the foot is angled to 45° while the tube head remains vertical. This projection gives good visualisation of the phalanges, metatarsals and sesamoids (Figs. 22.8 and 22.9).
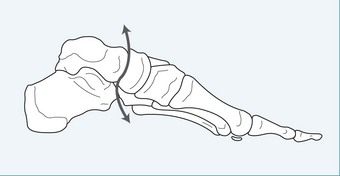
Mediolateral oblique projection
There is some variation of the angle, with some texts quoting 45° (Christman 2003), while others may reduce it to between 25° and 30° (Fig. 22.10). This projection is valuable for evaluating the first ray and associated structures prior to bunion surgery.
Note: oblique projections will give a much distorted impression of the foot, as they elongate the image, even more so if weight bearing.
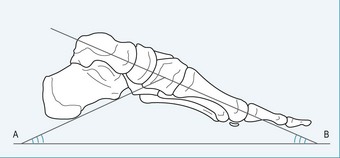
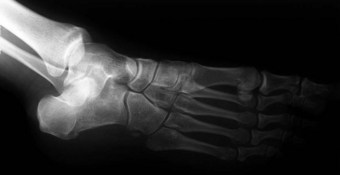
Lateral projections
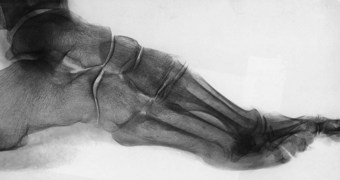
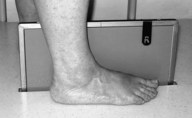
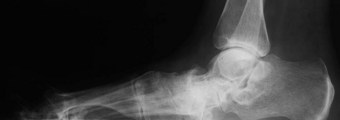
These projections may be weight bearing or non-weight bearing, but in both cases the tube head is angled at 90° to the foot. This projection is valuable for showing the whole foot in profile, but some superimposition will obscure certain features, such as the midtarsal joint (Figs 22.11 and 22.12).
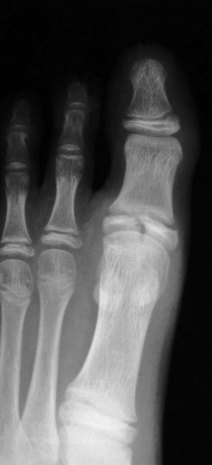
Digital projections
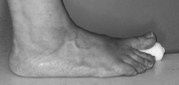
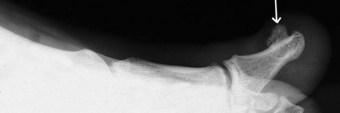
The lateromedial projection is particularly good for identifying subungual exostoses. The hallux, or any lesser toe, can be raised above its neighbours. This may be achieved either by placing a pad of material under the toe, or by placing tube gauze or bandage around the toe and then distracting it dorsally. Less often, lateromedial and mediolateral projections may be utilised (Figs 22.13 and 22.14).
Sesamoid positioning
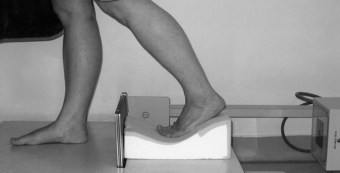
The axial projection is most commonly used for isolating and defining the sesamoids. It is possible to take this view either weight bearing or non-weight bearing, and the foot can be positioned on a felt of foam pad to enhance the image (Figs 22.15 and 22.16).
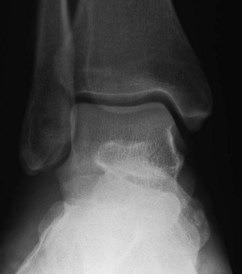
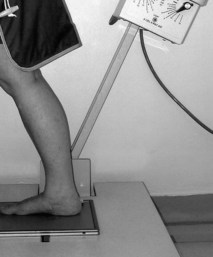
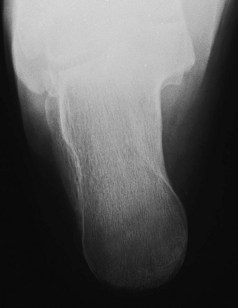
Tarsal and ankle projections
There are a large number of possible techniques for visualising the rearfoot and ankle. The most commonly used projections for the ankle would be the anteroposterior lateral and mortise techniques (Figs 22.17 and 22.18). The mortise technique is favoured to the straight anteroposterior projection as it allows better visualisation of the articular surfaces. The various tarsal projections can be used to highlight the relationships between the joints of the rearfoot (e.g. the talocalcaneal joint and the subtalar joint) or to view the sustentaculum tali or the calcaneus. The axial calcaneal projection involves directing the beam at the posterior aspect of the calcaneus at 45° (Figs 22.19 and 22.20). This view is primarily used for assessing the calcaneus for trauma. The Harris-Beath projection is very similar to the axial calcaneal one, but the patient is asked to bend at the knees as if preparing to jump. The central ray is aimed at the posterior of the ankle joint and the operator may make the exposure at between 35°and 45°. To a large extent, CT scanning has taken over from this technique (Weissman 1988).
RADIOGRAPHIC CHARTING
It is probably true to say that the majority of radiographs requested or taken by podiatrists are weight-bearing views, and usually in the angle and base of gait, as the foot is then in a functional position (Shereff et al 1990). However, if the patient is referred to a radiography department, it will usually be necessary to ask specifically for weight-bearing views.
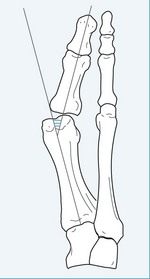
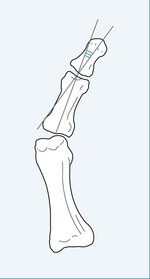
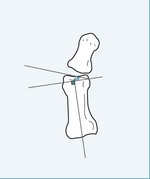
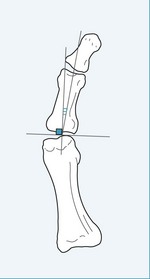
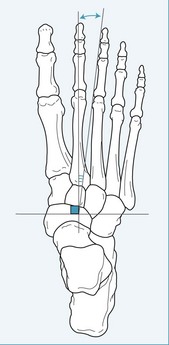
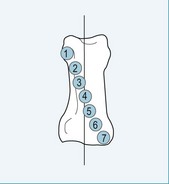
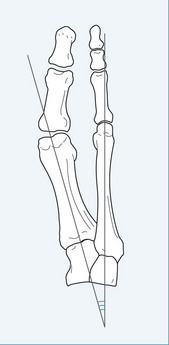
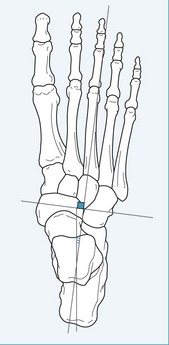
Radiographic charting is the process of employing standardised marking and measurement techniques on the radiographic film to enable comparisons and conclusions to be drawn on a number of features. These features will involve the relationships of the osseous structures, and may be used for presurgical evaluation or for biomechanical factors, such as the classification of foot type (Street et al 1980). However, the use of charting for biomechanical examination is rather difficult to justify in most situations, as best practice would be to not expose the patient to unnecessary amounts of ionising radiation. Whether the benefit outweighs the cost in such situations is open to debate. However, some basic measurement and charting may be used in certain areas of orthopaedics and trauma surgery. The use of presurgical radiographs allows the surgeon to assess the position of the bones and their relationship with their neighbours. It also gives an indication of the quality of the bone tissue (e.g. whether there is any localised osteopenia) and the state of the joints involved. The use of preoperative charting for hallux valgus surgery has been widely used by the podiatric fraternity, particularly in the USA (Kaschak & Laine 1988). The main reference lines and angles used are the intermetatarsal angle and the hallux valgus angle (Figs 22.21 and 22.22). Calculating the proximal and distal articular set angles assesses the congruency of the first metatarsophalangeal joint (Figs 22.23 and 22.24).
There is some debate as to the reliability of the measurements. A number of factors may operate to confound the reliability of radiographic charting. Variations in technique, error of measurement, poor landmark selection and patient movement are some of the factors that may give rise to inaccurate results. Furthermore, intra- and interobserver reliability will need to be confirmed (Astor et al 2004, Saltman et al 1994, Traughber 1999).
In terms of the biomechanical evaluation of radiographs, most charting can be done utilising dorsoplantar (Figs 22.21 to 22.28) and lateral views (Figs 22.29 to 22.31). The dorsoplantar view will provide for analysis in the transverse plain, and the lateral views will enable comparison in the sagittal plane. The angles demonstrated in the diagrams represent some, but certainly not all, of the measurable angles.
RADIOGRAPHIC ASSESSMENT AND INTERPRETATION
Any radiograph must be read and assessed accurately. There is a logical and sequential method to this process. If the overall quality of the radiograph is poor, it may require the patient having further exposures, and this does not fit with best practice.
First the technical quality of the radiograph is assessed for detail (Gambol & Yale 1975). Are the structural components (i.e. the bones) clearly discernible? Is there a defined contrast (i.e. is there a clear profile of the part being examined)? Is there sufficient density, or is the radiograph clearly grey or black enough for the image to stand out? And, finally, is the film of sufficient overall quality and not marred by handling or processing faults?
The next stage involves the medical interpretation of the image. Christman (2003) uses the following terminology, but others have their own preferences. Position encompasses specific features (e.g. the alignment, apposition and angulation of the bone(s)); it can also refer to the joint, where there may be subluxation or dislocation. Form refers to the basic shape of each osseous component; it is useful for looking at the length, girth and general contour of the bone.
Whether one examines the foot from proximal to distal or from distal to proximal is not that important. What is important is that a consistent method is used for the analysis of each radiograph. Each of the major osseous components can be examined in turn, but care will be needed not to confuse normal structures. It is only through regular examination of radiographs that interpretation becomes an accurate and reliable process.
If the examination begins at the rearfoot, start by looking at the talus and calcaneus. In a dorsoplantar projection one would find the superimposition of the talus on the calcaneus. Indeed, superimposition will occlude much rearfoot detail. It is only possible to see the talus fully on a lateral view; the calcaneus may be seen in its entirety on lateral or medial oblique views. It should be noted that the relationship of the bones of the rear foot will vary depending on the foot type (i.e. whether it is pronated or supinated) and this would be most evident from a dorsoplantar projection. Lateral views give good information on joint relationships and the angulation of the components. The cuboid can be fully appreciated on a medial oblique view, while the navicular is visible on most views. Obviously, it is possible to vary the projection to enable a more ‘refined’ view of a particular aspect of these bones. The cuneiforms are best visualised on a dorsoplantar view, as they tend to be superimposed on other views.
Moving distally, the lesser metatarsals are best seen from a medial oblique view. This also serves to most clearly demonstrate the fifth metatarsal, which can also be seen on a dorsoplantar view. The first metatarsal is usually best seen on lateral and dorsoplantar views, but sometimes a medial oblique view is also taken (e.g. before a surgical procedure).
Dorsoplantar views are usually chosen for the phalanges and hallux, but occasionally an oblique view will be required. The sesamoids are best visualised on an axial view.
Architecture is described by Christman (2003) in two ways: the internal architecture, encompassing the structure of the cortices and the trabeculae; and the external architecture, which encompasses the margin of each bone, the subperiosteal surface and subchondral bone plate. Continuity of the cortex can be visualised along the shafts of the long bones, where it may be 1–2 mm thick. The cortices are far less well defined in the tarsal bones. The trabecular patterns are evident at the base and head of the long bones and are well demonstrated in the calcaneus. These trabeculae are ‘stress-line indicators’, and relate to the maximising of the bone’s internal architecture to cope with stress and loading.
Density, or bony mineralisation, is a very good indicator of certain pathologies. The density relates to how black the film is and how white the bone appears (this is reversed with Polaroid radiographs). The bone may show increased or decreased density. Increased density (i.e. increased whiteness of all or part of the bone on the radiograph) may be referred to as increased radio-opacity, sclerosis or eburnation. Increased density may be associated with increased osteoblastic activity, and this is a feature of certain pathological conditions such as a fracture site or neoplastic activity. Paget’s disease exhibits marked sclerosis, together with cortical thickening, osteolysis and decrystallised, coarsened trabeculae. It may also be associated with the development of a very painful osteogenic sarcoma. The rapid increase in the bone production and resorption has a disruptive effect on the normal structure of the bone, and may result in deformity and fractures. Radioisotope scans will demonstrate the extent of the disease, but plain radiographs are also very informative (Resnick 1996). Osteopetrosis (Albers–Schönberg disease) is a rare, inherited condition wherein there is a defect in resorption of bone by the osteoclasts, and all bones show increased density. Band-like areas of denser bone appear below the epiphyseal lines and in the vertebrae. The bones are more prone to fracture. Melorheostosis is another rare dysplasia, in which small areas of the bone are affected, often following the course of the sclerotome. There is a proliferation of new bone at the cortices (Berquist 2000). Increased density may also be seen in hypoparathyroidism and a number of fairly rare pathologies; for example, osteopoikilosis, an inherited skeletal dysplasia, is characterised by many small foci of bone sclerosis, which mimic solitary bone islands. They may be found in the tarsal bones.
Decreased bone mineral density is also known as increased radiolucency, osteopenia or rarefaction. The term osteoporosis, once used in a general qualitative sense with regard to decreased density, is now used only as a pathologic descriptor (Raisz 2005). Decreased density may be associated with generalised or localised osteopenia. Osteoporosis is a common bone pathology characterised by a low bone mass, and in the UK it affects about 1.2 million people. Both sexes lose bone mass as they age, but this is more dramatic in women after menopause (Scottish Intercollegiate Guidelines Network 2003). Plain radiographs will not detect osteoporosis until approximately 30% of the bone mass has been lost. However, a dual energy x-ray absorptiometry (DEXA) scan provides information, usually from the hip and spine, on the bone density (Compston et al 1995). Radiographically, the appearance is characterised by thinning cortices, prominent primary trabeculae, subperiosteal bone resorption and sometimes a ‘spotty’ moth-eaten appearance in the cancellous bone (Fig. 22.32) (Ralston 1997). If it is in an individual bone, the osteopenia may be associated with a neoplasm or an osteomyelitis. As the disease advances, small stress fractures of the vertebrae may be visible on the radiograph.
Regional pain syndrome, often called reflex sympathetic dystrophy (RSD) or Sudek’s atrophy, is also associated with loss of bone mass (Knobler 2000). This condition may arise for no apparent reason, or may be seen following a surgical procedure or trauma to the foot. The underlying pathology is not fully understood. The radiological evidence is patchy juxta-articular osteopenia giving a mottled effect, deossification in the metaphyseal ends of the toes, and subchondral deossification, eventually leading to a widespread osteoporosis. The use of advanced imaging modalities offers no great advantage over plain radiographs (Mayer & Kabbani 2003). Decreased density of bone may also be seen in deficiency disorders; for example, the lack of vitamin D in osteomalacia and rickets. In addition to the loss of bone mass, there is retardation of bone growth, causing a softening of the bones due to the inadequate mineralisation of the osteoid framework. In children, there may be widening and cupping of the metaphyses, while in adults there is osteopenia and possibly, in later stages, pseudofractures, often called Looser’s zones.
Lack of vitamin C, or scurvy, hyperthyroidism, hyperparathyroidism, thalassaemia and hypopituitarism will all demonstrate osteopenia.
The structure of the joints may also be examined, and one would seek a clear, dark, demarcation line in a healthy joint with good spacing between the opposing bones. Any closure of this space, loss of parallelism, or erosion and discontinuity of the joint surfaces or periarticular bone could indicate pathology (see the discussion of arthritides later in this chapter).
Finally, the soft tissues are appraised. This is not the main point of recording a radiograph, but a trained eye will often spot atypical features; for example, there may be calcification or ossification within the tissues. Calcification can occur in muscles, veins, arteries and even in bursae. For example, in long-standing diabetes there may be calcification of the smaller arteries (Loredo & Metter 1997). Calcification differs from ossification in that it has no cortex or trabeculae, and is often more irregular in outline (Fig. 22.33). Ossification is more defined with the development of trabeculae and a cortex. Ossification within the tissues may be seen following trauma, or it may be associated with neoplasia or venous insufficiency. It can often be seen associated with the Achilles tendon.
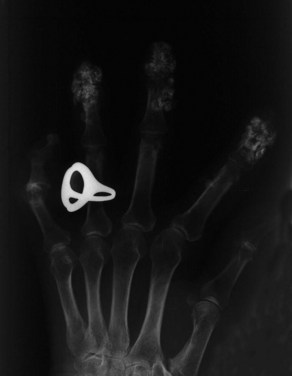
Figure 22.33 Radiograph showing calcification of soft tissues in a patient with progressive sclerosis.
In gout, tophaceous material may show as a whitened mass around the joint margins. It is sometimes possible to see a shadow of some soft-tissue lesion or swelling, and it would be important to be able to delineate this from the surrounding normal tissue (Fig. 22.34). Oedema will also give an increased density.
Infection may be evident as a diffuse or localised swelling, which may also involve the production of gas within the tissues (Newman 1995). Foot infections may involve aerobic or anaerobic organisms, which may lead to a non-suppurative type infection with local abscess formation. Unresolved infections may go on to involve bone, resulting in an osteomyelitis. Initially, this may involve just the periosteum, but later may affect the cortical and medullary bone. In children, the epiphyseal growth plate may temporarily halt the spread of the infection.
The classification of osteomyelitis may be based on the route of entry of the organism. Haematogenous infection is via blood-borne bacteria. These have a predilection for the highly vascular metaphyseal bone and are more common in children. A second course of entry could be following puncture wounds to soft tissues, or the implantation of screws, wires and plates following foot surgery. The final pathway may be from an extension of soft-tissue infection and ulceration. Once established, the infection will traverse acute, subacute and chronic phases. In the acute stages plain radiographs would be of little value, as for the first 10–14 days they would show little evidence, other than some soft-tissue swelling, blurring of the fascial planes and, possibly, a periostitis (Williams 2003). The patient would also show clinical signs such as pain, raised temperature and malaise. Later, demineralisation of the bone will occur, but this will usually need to be of the order of approximately 50% before a diagnosis can be made. In the subacute through to the chronic stage, the ‘classical’ signs may be evident. These would include bone lysis (destruction), with possible malformation, sclerosis, and the development of a sequestrum (a portion of dead and relatively sclerosed bone). An involucrum would also be evident. This is an envelope of new bone formation surrounding the sequestrum. A ‘Brodie’s abscess’ may also be evident as a walled-off lytic inclusion, which resembles a bone cyst. Finally, a channel develops for the transport of pus from the site through the cortex. This is known as a cloaca. This should be differentiated from a sinus, which will develop within the soft tissues. Obviously, clinical examination and laboratory tests will also be necessary, and the use of other modalities, such as MRI, may be considered as part of the diagnostic process (Christman 1990). Infection is always a possibility in the compromised foot.
Patients with diabetes may develop atherosclerosis or possibly Möenckeberg’s sclerosis. The former, affecting the tunica intima of the artery, is seen on radiograph as a solid column of calcification. The latter, affecting the tunica media of the artery, is seen as a less solid and often broken line of calcification. Occasionally, it is possible to see calcification of the arteries in the intermetatarsal spaces (Fig. 22.35). This may be discovered by accident when taking presurgical radiographs. These vessels rarely calcify in non-diabetic patients (Cheung et al 2002).
Osteomyelitis (Fig. 22.36) is sometimes confused with neuropathic osteoarthropathy (Fig. 22.35) because of the similar appearance on the radiograph. Neuropathic osteoarthropathy may be associated with a number of pathologies, such as syringomyelia, Hansen’s disease, tabes dorsalis and, of course, diabetes. In diabetes it is often referred to as ‘diabetic neuroarthropathy’ or ‘Charcot joint’ (Christman 2003). The condition may affect any joint in the foot, but the general predilection is for it to manifest in the forefoot and midfoot, in particular in the metatarsophalangeal and the tarsometatarsal joints. The fundamental pathology is not fully understood, but it has been subdivided into two forms: atrophic and hypertrophic. The atrophic form is associated with loss of vascular sympathetic tone, which in turn results in a hyperaemia and an increased osteoclastic activity. This will result in a weakening of the bone by osteolysis, and possible fragmentation and fracturing. The metatarsal heads may collapse and have a ‘pencilled’ appearance. There may also be a periostitis. The hypertrophic form is not generally associated with loss of sympathetic innervation of the blood vessels. There is no associated hyperaemia, but there is a potential for massive bone disruption. Subluxation and dislocation may occur, as can bone fragmentation. The radiographic appearance is one of severe degenerative joint disease, with the appearance of an arthritis mutilans, similar to, but more severe than, that seen in psoriatic arthritis. A classical ‘rocker-bottom’ foot may be the final outcome (Loredo & Metter 1997).
DEVELOPMENTAL VARIANTS: NORMAL AND ABNORMAL
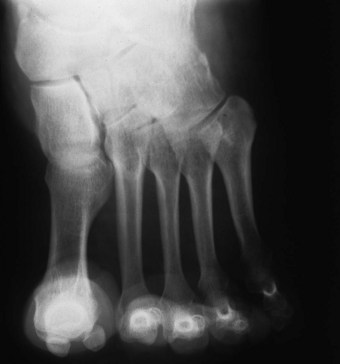
While the adult radiograph demands specialised skills for analysis, the paediatric foot presents an even greater challenge. The clinician will require knowledge of the norms for development of the ossification centres, and the timing of their appearance and their closures. However, the appearance of the primary and secondary ossification centres varies within an accepted age range. Children rarely develop at the same pace, and bone development and maturity in girls is normally 2 years ahead of that in boys. Cartilaginous models of the tarsus are identified from approximately the seventh to ninth week of intrauterine life, and at the same time ossification is well under way in the metatarsals and phalanges. Between 24 and 28 weeks intrauterine, the tarsal bones will begin ossifying, with the talus and calcaneus being ossified at birth. By 2 years of age the lateral and medial cuneiforms are discernible, with the intermediate visible by 3 years of age, together with the navicular. The process of ossification in the foot is completed with the calcaneal apophysis and the fifth metatarsal head epiphysis; this will occur at the age of approximately 13–15 years in girls and 14–17 in boys. It is important that the developing ossification centres follow a recognised pattern in terms of their appearance, their size and shape, and their relation to their neighbouring centres (Oloff & Moore 1992). The growth plates at the epiphyses provide for increase in the length of the bone, whilst the apophyses add bulk and form to the bone. The appearance of the primary and secondary ossification centres, and the completion of ossification in the foot, is better referenced from detailed anatomical texts, for example Saraffian (1983), as there are variations of timing within the literature (Oloff 1987).
Not only will the radiograph appear different from the mature foot, but also the actual method of capturing the image presents certain difficulties. For example, very young children will probably need restraining/sedating whilst the exposure is made. Finer details are obtained while non-weight bearing, and the resulting images will be of more use in cases of trauma, infections, neoplasms and bone diseases (Oestreich 1992).
Variation may present in a number of ways. For example, there may be variation in the size, shape or position of a bone (Fig. 22.37). There may be changes in density and architecture. There may be extra bones present. It is not unusual to find ossicles at various sites, and supernumerary sesamoids are sometimes observed under the lesser metatarsal heads. Occasionally, a part of or a whole bone may be absent. The radiologist’s skill is in determining which of these features is a developmental anomaly and which is pathological (Fig. 22.38).
Bridges or coalitions may develop between two or more bones in the foot. These begin life as fibrous syndesmoses. They gradually become cartilaginous as synchondroses, finally becoming ossified as synostoses. They often remain undetected and symptom free until they ossify, when they become painful and restrict motion. They are usually congenital, but may arise as a result of trauma, infection, joint disease, or iatrogenically as a result of surgery. The most familiar are the tarsal coalitions, and of these the calcaneonavicular and talocalcaneal (Fig. 22.39) are the ones most frequently referred to in the literature (Blakemore et al 2000). Although rare, it is possible to see talonavicular, calcaneocuboid, cubonavicular and even multiple coalitions. Diagnosis is based on detailed radiographs employing two or more projections. However, while it may be possible to identify some bone coalitions on the radiograph, others will require MRI or a CT scan to enable complete and accurate visualisation (Keats 1988).
It is possible to identify up to 21 accessory bones (ossicles) within the foot (Romanowski & Barrington 1991). These are found to varying degrees, may be unilateral or bilateral, and are considered as normal variants. It is estimated that 20–30% of adults have one or more accessory bones. Generally, they appear as distinct, well-defined structures, but some (e.g. the os trigonum) may be attached to adjacent bones. They are generally asymptomatic, but occasionally they will need to be differentially diagnosed from a possible fracture.
The os trigonum is found at the posterior aspect of the talus and occurs in 2.5–14% of the population (Sopov et al 2000). It may be round or oval, but is most commonly triangular. Its position at the posterior surface of the talus means that plantar flexion of the foot will cause it to impinge on the posterior surface of the tibia. Painful cases have been particularly associated with those sports and professions, such as football and ballet dancing, in which the feet are subjected to this extreme plantar flexion (Davies 2004).
The os tibiale externum, often referred to as the accessory navicular, is found adjacent to the proximal part of the tuberosity of the navicular and in association with the tendon of tibialis posterior. It is more common in women than men, and is frequently bilateral. Estimates of its incidence range from 2% to 12%. It was classically described by Lawson (1985) as having three basic forms: - accessory navicular type 1, 2 and 3. In type 1 there is a sesamoid bone in the tendon of tibialis posterior, which has no attachment to the navicular (os tibiale externum). Type 2 has an articulating accessory ossification centre with the navicular, while type 3 may be regarded as an end-stage fused accessory ossification centre. Some controversy exists as to whether types 2 and 3 need to be classified separately (Mosel et al 2004).
Os peroneum is another fairly common accessory bone, and it is found in the tendon of peroneus longus (Fig. 22.40). It lies adjacent to the lower border of the cuboid or calcaneocuboid joint. Its incidence is estimated at 9%. It may give rise to pain, and occasionally may be confused with a fracture (Sobel et al 1994). It is most clearly seen on a medial oblique view.
Other accessory bones are: os vesalianum, which is situated at the base of the fifth metatarsal and is of importance as it may be confused with an avulsion fracture of the metatarsal base; os intermetatarseum, which is usually found as either a separate ossicle, or a spur between the first and second metatarsals; and os interphalangeus, which is sometimes found lying on the inferior surface of the hallux on presurgical radiographs.
OSTEOCHONDRITIS OR OSTEONECROSIS?
There has been a tendency to conveniently group those pathologic conditions where there is an actual osteonecrosis, and those that are merely normal variations or minor growth disturbances, under the general heading of the ‘osteochondroses’. Osteonecrosis is bone death and is seen as part of the pathological process associated with some of the osteochondroses. However, osteonecrosis can be differentiated as an ischaemic necrosis of bone and may be associated with a variety of causes. It may be seen in gout, systemic lupus erythematosis, sickle cell disease and thalassaemias, and it may also be associated with trauma, long-term steroid therapy and alcohol abuse (Resnick 1996).
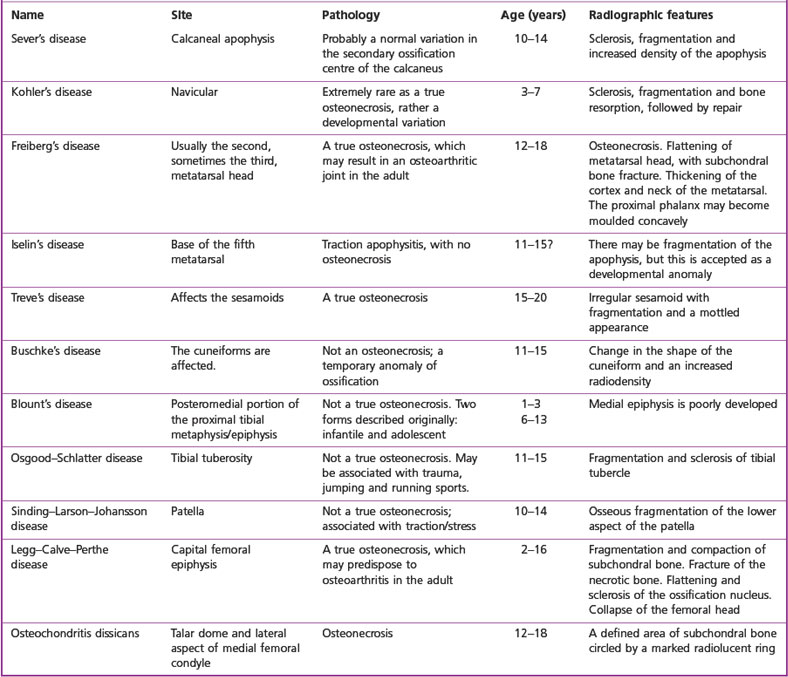
Osteochondrosis has been traditionally used to denote and describe those conditions that share a number of common features. They are only seen in the immature skeleton, and they may involve the epiphyses and the apophyses. Some are associated with joints, some with growth disturbance and others with trauma (Tachdjian 1990). They have a distinctive radiographic appearance characterised by a condensation of the ossification centre, increased sclerosis, fragmentation and possible collapse of that portion of bone. Generally, this is followed by ‘healing’ and restitution of the normal bone architecture. It is important to realise that most conditions will resolve with no residual problems (Cohen & Christman 2003). However, in some cases, for example Freiberg’s disease, there may be a residual problem with the associated joint(s) (Fig. 22.41).
Figure 22.41 Radiograph of osteoarthritis of second metatarsophalangeal joint following Freiberg’s disease.
Table 22.2 outlines the main types and features of the osteochondroses.
BONE TUMOURS
The following is merely offered as an overview of those neoplasms that may occasionally be found in the leg or foot and their radiographic characteristics. The incidence of neoplasia in the lower limb in general, and the foot in particular, is extremely low, with perhaps some 2–4% of all neoplasms being found in the foot (Helm & Newman 1991). Bone tumours may be benign or malignant, with the malignant varieties representing less than 1% of all tumours (Shaylor et al 2000). Some may arise directly from the bone, or from adjacent non-osseous structures. Very rarely, metastases from a primary malignancy elsewhere in the body may be discovered in the lower limb, but these are usually above knee level (Lee 2008). The authenticated reporting of their presence in the foot barely reaches three figures (Anderson & Kakarlapudi 2000).
The identification of any neoplasm needs the expert eye of a consultant radiologist, who will usually base the diagnosis on a number of criteria. Plain radiography may not be sufficient, and other imaging modalities are likely to be employed to confirm a diagnosis. The following criteria are adapted from Shook et al (2003), and may vary slightly from practitioner to practitioner.
Where considered necessary, the above tumours may be removed by surgery and/or curettage.
The main malignant bone tumours that are found throughout the body, but are rare in the foot, are:
Because of their relative rarity, and the fact that they may be unobserved or misdiagnosed, the treatment of these highly dangerous tumours is sometimes delayed. Imaging and bone biopsies will usually confirm the diagnosis. Following this, resective surgery will be necessary to remove the primary tumour, and this may be supported by radiotherapy (Shaylor et al 2000). However, amputation of the limb may be necessary in some cases.
BONES, JOINTS AND CONNECTIVE TISSUES
The arthritides form a complex group of joint and connective-tissue diseases, many with a predilection for the foot. In the early stages of these diseases, radiography may not be of primary importance, and clinical and laboratory investigations may be of more value. As the disease becomes more chronic, there may be an associated development of clearly defined radiological markers (Nuki et al 1999).
The disorders may be classified on the basis of the underlying pathology – whether they are inflammatory, metabolic or degenerative. Alternatively, they may be classified on the basis of specific radiographic characteristics (Christman 1991). Whatever method is used, a logical sequence of examination will be required when viewing the radiographic evidence, such as the ABCDS approach, where A refers to alignment, B to bone mineralisation, C to cartilage (joint) space, D to distal to proximal and S to soft tissue (Kaschak & Laine 1988).
The fundamental radiographic characteristics are represented by either a hypertrophic or an atrophic reaction. Osteoarthritis represents a hypertrophic reaction. While classically considered a degenerative disease, possibly resulting from frank trauma or mechanical overload, it is possible that there may be an underlying genetic link (Spector et al 1996). Osteoarthritis is common in the foot, particularly in the first metatarsophalangeal, the metatarsocuneiform, and the naviculocuneiform and talonavicular joints. The characteristic features associated with osteoarthritis are focal destruction of the articular cartilage and osteophytosis (i.e. the presence of osteophytes), which is particularly noticeable as ‘dorsal lipping’ at the first metatarsophalangeal joint (Fig. 22.43). Metatarsosesamoid involvement is also possible. There is an uneven narrowing of the joint space, which may eventually be totally lost. Subchondral sclerosis, together with cyst formation, completes the picture in moderate to severe osteoarthritis.
Rheumatoid arthritis is a seropositive, inflammatory polyarthritis with various non-articular manifestations. Its course can be highly variable, as is the prognosis. However, the disease tends to follow a relapsing and remitting course in most sufferers (Walker 1996). The incidence of the disease is on the decline, but it is still the most common of the inflammatory arthritides (Helliwell et al 2007). Rheumatoid arthritis has a tendency to begin as a synovitis in the small joints of the hands and feet. The disease may attack any of the pedal joints, but it is generally associated with the metatarsophalangeal joints. Involvement of the midfoot and rearfoot joints also occurs, but whether one joint is more affected than another is uncertain (Wiener-Ogilvie 1999). Radiographs will usually provide good detail at the metatarsophalangeal joints, but imaging the rearfoot will require several views and possibly different modalities (Fig. 22.32).
The radiographic evidence will usually show early joint-space distension, which accompanies the inflammation and hypertrophy of the synovium, and is caused by effusion into the joint. Later the joint space will narrow. Periarticular osteopenia and erosion will usually follow. Eventually, there may be secondary osteoarthritic damage. There may be a much disrupted foot, with subluxations and dislocation of one or more joints. Finally, there may be ankylosis of the joint(s) (Prioli et al 1997).
The spondyloarthropathies are a group of seronegative arthritides that share common features:
Ankylosing spondylitis is a chronic inflammatory disorder, mainly affecting the axial skeleton; however, involvement of the peripheral joints is not uncommon. It is most common in young males. Enthesopathy may occur at certain sites, particularly in the heel, where the inflammation affects the ligamentous attachments, eventually causing erosion of the adjacent bone (Rai & Struthers 2002). Enthesopathy also affects the spine, where healing often leaves scars and new bone formations, known as syndesmophytes, at the junction of the vertebral bodies. Diagnosis is based primarily on signs and symptoms. Recourse to laboratory tests and radiography is of little value, particularly in the early stages. As the condition progresses, changes may be discernible on radiography (e.g. marginal sclerosis at the sacroiliac joints, erosion and sclerosis of the anterior corners of the vertebrae). There may also be some osteopenia. The use of a CT scan early in the disease may reveal some evidence of osseous changes, while the use of MRI may reveal specific changes such as inflammation in the bone marrow adjacent to the joints (McGonagle et al 2002).
Reiter’s disease is mainly seen in young males. It is normally associated with a gastrointestinal or sexually transmitted organism, and manifests as a classic syndromic triad of non-specific urethritis, reactive arthritis and conjunctivitis. Foot and lower limb involvement is high, with possible synovitis of the small foot joints, enthesopathy at the attachment of the plantar fascia and the Achilles tendon, swollen ‘sausage’ toes (dactylitis) and ketatoderma blennorrhagia affecting the plantar skin (Keat 1996). It would be necessary to differentially diagnose for gout, or a septic arthritis. Laboratory tests will be necessary, but imaging might only be of value in a chronic inflammatory case, where it is possible to find periarticular osteopenia, bone erosion at the calcaneus, and periostitis in the metatarsals and phalanges. There may also be a marked sacroiliitis identical to that seen in ankylosing spondylitis.
Psoriatic arthritis is commonly associated with psoriasis, but only approximately 6%–8% of psoriasis sufferers actually develop the arthritic condition. Five clinical patterns are observed (Nuki et al 1999):
Radiological evidence consists of small-joint involvement in the hands and feet. The interphalangeal joints may exhibit marginal erosion of the bone, with adjacent areas producing a proliferation of new bone, often referred to as ‘whiskering’ (Wright & Helliwell 1996). Osteolysis may occur in the metatarsals and phalanges, resulting in their compaction, sometimes referred to as ‘mushrooming’ or ‘telescoping’ of the digits. In the rare, but severe, arthritis mutilans, there may be a ‘pencil in cup’ deformity of the metatarsal. Periostitis and erosion of the terminal phalanges is also common. As in ankylosing spondylitis and Reiter’s disease, involvement of the entheses is widespread, with the calcaneus often involved. Differential diagnosis should be established between this and rheumatoid arthritis, or the spondyloarthropathies.
Systemic lupus erythematosis is a connective-tissue disorder with a wide range of joint and other tissue manifestations. It is an autoimmune disease and predominates in females. There will usually be a symmetrical involvement of the wrists, knees, metacarpophalangeal and metatarsophalangeal joints, and the proximal interphalangeal joints in the hand and foot. The arthritis is migratory and is not usually as destructive as rheumatoid arthritis (Fig. 22.44). In chronic cases there may be some osteopenia and erosion. Avascular necrosis of the hip or knee is a possibility.
Systemic sclerosis (scleroderma) is a complex spectrum of disorders with wide-ranging involvement of the skin, skeleton and major organs. There may be an arthralgia, but there is little erosion in most cases. The most interesting of the radiological manifestations is subcutaneous calcification (Fig. 22.33) and possible resorption of the terminal phalangeal tufts (Black 2002).
Of the crystal deposition diseases, gout is the most frequently encountered by podiatrists. Gout actually represents a group of disorders characterised by a hyperuricaemia leading to the deposition of crystals of monosodium urate monohydrate in the tissues, which in turn leads to an inflammatory reaction. It may attack any joint, but in over 70% of cases it occurs in the first metatarsophalangeal joint. The wrist, knee, ankle and hand may also be affected. Gout is sometimes confused with the less common calcium pyrophosphate dihydrate arthropathy (pseudogout), but analysis of the synovial fluid under a polarising light microscope will allow for identification of the crystals formed in these diseases. Radiographic evaluation will not show changes in the early stages of the disease (Nuki 1998). However, if chronic and poorly managed, ‘punched-out’ erosions may develop at the joint margins. Some subchondral sclerosis may be evident, and secondary osteoarthritis may develop with some osteophytosis. Tophaceous deposits in the soft tissue may show on the radiograph.
FRACTURES
The following is a general overview of the common fractures and their radiographic appearance. Further detail should be sought in a traumatology or orthopaedic text.
A fracture is dissolution in the continuity of a bone which may be complete or incomplete.
(Gambol & Yale 1975, p.138)
The plain radiograph will usually be excellent for the identification of most fractures, providing that one or more views are taken in different projections to confirm the diagnosis. However, it is occasionally necessary to use a different imaging modality to confirm the diagnosis where there is difficulty in identifying a suspected fracture. NM scintigrams will often show a ‘hot spot’ where there may be a stress fracture. CT scans can also disclose difficult-to-see fractures. Any bone in the foot is liable to fracture, and this may include an associated subluxation or dislocation of one or more associated joints (Christman 2003).
Not only are there different types of fracture, but the actual fracture line may run in a transverse, oblique or spiral manner. In a simple fracture there are only two segments of bone, but sometimes there will be multiple fracturing of the bone with a number of separate bone segments. This is known as a comminuted fracture and is sometimes seen in the calcaneus following a fall onto the heel from a height. Impacted fractures occur when one bone is jammed with great force against another. If the skin is penetrated and the bone exposed through the wound, the term open or compound fracture is used. If the deeper structures, together with blood vessels and nerves are involved, the fracture may be classified as complicated.
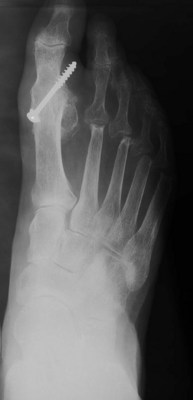
Avulsion fractures occur when there is a forceful tearing of soft-tissue structures, such as muscles, ligament, tendon, or even joint capsule, taking a portion of bone with them. These are common at the base of the fifth metatarsal (Fig. 22.45) (Ekrol & Court-Brown 2004).
Stress, or ‘overuse’, fractures occur as a result of multiple or repetitive damage, as opposed to a single event. They are common in the calcaneus, metatarsals and the tibia. They are often associated with those individuals who increase the demands on their feet through unaccustomed activity levels (e.g. the march fracture associated with new recruits to the armed services).
Pathologic fractures occur where there is an underlying pathology (e.g. a neoplasm) or some systemic illness that has predisposed to osteoporosis.
Greenstick fractures are generally seen in children and are represented by an incomplete breakage through the bone. The fracture line traverses the cortex incompletely, so that the bone bends rather than snaps.
Alazraki N. Radionuclide techniques. In: Resnick D, editor. Diagnosis of bone and joint disorders. Philadelphia, PA: Saunders, 1995.
Anderson M, Kakarlapudi TK. Metastatic lesion in the hallux. The Foot. 2000;10(1):42-43.
Asirvatham R, Rooney RJ, Antonius JI. Giant cell tumour of the metatarsal: a case report & review of the literature. The Foot. 1992;2(1):49-53.
Astor AS, Forster MC, Rajan RA, et al. Radiographic pre-operative assessment in hallux valgus: is it reliable? The Foot. 2004;14(3):129-132.
Bassen H, Schaefer DJ, Zaremba L, et al. IEEE Committee on Man & Radiation (COMAR): Technical information statement: exposure of medical personnel to electromagnetic fields from open MRI systems. Health Physics. 2005;89(6):684-689.
Berquist TH. Radiology of the foot and ankle, 2nd edn. Philadelphia, PA: Lippincot Williams & Wilkins; 2000.
Berrington De Gonzalez A, Darby S. The risk of cancers from diagnostic x-ray: estimates from the UK and 14 other countries. Lancet. 2004;363:345-351.
Betts RP, Bygrave CJ, Jones S, et al. Ultrasonic diagnosis of Morton’s neuroma: a guide to problems, pointers, pitfalls and prognosis. The Foot. 2003;13(2):92-99.
Black C 2002 Systemic sclerosis. In: Collected Reports On The Rheumatic Diseases. The Arthritis Research Campaign, Chesterfield.
Blakemore LC, Cooperman DP, Thompson GH. The rigid flatfoot: tarsal coalitions. Clinics in Podiatric Medicine and Surgery. 2000;17(3):531-550.
Böttcher J, Pheil A, Mentzel HJ, et al. Peripheral bone status in RA evaluated by digital XR and compared with multi-site quantitative ultrasound (QUS). Calcification Tissue International. 2006;78:25-34.
Brown M, Holder LE. Miscellaneous orthopaedic applications of radionuclide bone imaging. In: Collier BD, Fogelman I, Rosenthal L, editors. Skeletal nuclear medicine. St Louis, MI: Mosby Year Book, 1996.
Bullough P. Orthopaedic pathology, 2nd edn. London: Times Mirror International; 1997.
Cassar-Pullicino VN 2002 The place of imaging in rheumatological disorders. In: Collected reports on the rheumatic diseases. The Arthritis Research Campaign, Chesterfield.
Chakrabarti I, Greiss ME, Jennings P. Osteoid osteoma of the os calcis: computed tomography-guided diagnosis and excision. The Foot. 1995;5(3):153-154.
Chambers J. Clinical echocardiography. London: BMJ; 1995.
Cheung Y, Hochman M, Brophy DP. Radiographic changes in the diabetic foot. In: Veves A, Guirini JM, LoGerfo FW, editors. The diabetic foot: medical and surgical management. Totowa, NJ: Humana Press, 2002.
Christman RA. The radiographic presentation of osteomyelitis in the foot. Clinics in Podiatric Medicine and Surgery. 1990;7(3):443-446.
Christman RA. A systematic approach for radiographically evaluating joint disease in the foot. Journal of the American Podiatric Medical Association. 1991;81(4):174.
Christman RA, editor. Foot & ankle radiology. St Louis, MI: Churchill Livingstone, 2003.
Cohen RE, Christman RA. Osteonecrosis and osteochondritis. In: Christman RA, editor. Foot and ankle radiology. St Louis, MI: Churchill Livingstone, 2003.
Collier BD, Fogelman I, Rosenthal L, editors. Skeletal nuclear medicine. St Louis, MI: Mosby Year Book, 1996.
Compston JE, Cooper C, Kanis JA. Bone densitometry in clinical practice. BMJ. 1995;310:1510-1517.
Cryer JR, Otter SJ, Bowen CJ. Use of quantitative ultrasound scans of the calcaneus to diagnose osteoporosis in patients with rheumatoid arthritis. Journal of the American Podiatric Medical Association. 97(2), 2007.
Davies MB. The os trigonum syndrome. The Foot. 2004;14(3):119-123.
Dattner RH. Clinical radiology: the essentials, 2nd edn. Baltimore, OH: Williams & Wilkins; 1999.
Ekrol I, Court-Brown CM. Fractures at the base of the 5th metatarsal. The Foot. 2004;14(2):96-98.
El Rayes MA, El Kordy S. Osteoid osteoma of the talus. The Foot. 2003;13(3):166-168.
Fleming DJ, Murphy MD, McCarthy K. Imaging of the foot and ankle: summary and update. Current Opinion in Orthopedics. 2005;16(2):54-59.
Freschi S, Dodson NB. Osteoid osteoma: an uncommon cause of foot pain. Journal of the American Podiatric Medicine Association. 2007;97:5.
Gambol FO, Yale I. Clinical foot roentogenology, 2nd edn. New York: Krieger; 1975.
George VA, Khan AM, Hutchinson HCE, Maxwell HA. Morton’s neuroma: the role of MR scanning in diagnostic assistance. The Foot. 2005;15:14-16.
Hachiya H. The safety of ultrasonic diagnosis. The Journal of Medical Ultrasonics. 2006;33:195.
Harrelson JM. Tumours of the foot. In Jahss MH, editor: Disorders of the foot and ankle: medical and surgical management, 2nd edn, Philadelphia, PA: WB Saunders, 1991.
Helm RH, Newman RJ. Primary bone tumours of the foot: experience of the Leeds Bone Tumour Registry. The Foot. 1991;1(3):135-138.
Heron C. Magnetic resonance imaging of the foot and ankle. The Foot. 1993;3:1-10.
Helliwell P, Woodburn J, Redmond A, et al. The foot and ankle in rheumatoid arthritis. Edinburgh: Churchill Livingstone; 2007.
Huvos A. Bone tumours: diagnosis, treatment and prognosis. Philadelphia, PA: WB Saunders; 1991.
Journal of the European Communities 1997 Directive 97/43 Euratom.
Kaschak TJ, Laine W. Surgical radiology. Clinics in Podiatric Medicine and Surgery. 1988;5(4):798-804.
Katz JN, Gomoll A. Advances in arthroscopic surgery: indications and outcomes. Current Opinion in Rheumatology. 2007;19(2):106-110.
Keat A 1996 Reiter’s syndrome and reactive arthritis. In: Collected reports on the rheumatic diseases. Arthritis Research Campaign, Chesterfield.
Keats TE. Normal roentgen variants of the foot and ankle that may stimulate disease. Clinics in Podiatric Medicine and Surgery. 1988;5(4):777-795.
Körner M, Christof H, Weber MD, et al. Advances in digital radiography: physical principles & system overview. Radiographics. 2007;27:675-686.
Knobler RL. Reflex sympathetic dystrophy: complex regional pain syndrome, type 1. In: Mandel S, Willis J, editors. Handbook of lower extremity neurology. Philadelphia, PA: Churchill Livingstone, 2000.
Lawson JP. Symptomatic radiographic variants in extremities. Radiography. 1985;157:625-631.
Lee DK. Prostate cancer metastases to the leg and foot. Journal of the American Podiatric Medicine Association. 2008;98(3):242-245.
Loredo D, Metter D. Imaging the diabetic foot. Clinics in Podiatric Medicine and Surgery. 1997;14(2):235-264.
Martins B. Radiation physics, biology and safety. In: Christman RA, editor. Foot and ankle radiology. St Louis, MI: Churchill Livingstone, 2003.
Mayer DP, Kabbani YM. MRI/cross sectional imaging. In: Christman RA, editor. Foot and ankle radiology. St Louis, MI: Churchill Livingstone, 2003.
McGonagle D, Conaghan PG, Emery P 2002 Magnetic resonance imaging in rheumatology. In: Collected Reports On The Rheumatic Diseases. Arthritis Research Campaign, Chesterfield.
Mendicino SS, Rockett MS. Imaging of the foot and ankle. Clinics in Podiatric Medicine and Surgery. 1997;14(2):303-311.
Mohammadian PM, Torabinezhad S, Bagheri MH, Omidvari SH, Mosalae A, Ahmadlou N. Primary Sarcoma of the Foot. The Foot. 2004;14(3):159-163. Elsevier
Mosel LD, Kat E, Voyvodic F. Imaging of the symptomatic type 2 accessory navicular bone. Australian. Radiology. 2004;48(2):267-271.
Newman LG. Imaging techniques in the diabetic foot. Clinics in Podiatric Medicine and Surgery. 1995;12(4):75-86.
Nuki G. Gout. Medicine. 1998;26:54-59.
Nuki G, Ralston SH, Luqmani R. Diseases of the connective tissues, joints and bones. In Haslett C, Chilvers ER, Hunter JAA, Boon NA, editors: Davidson’s principles and practice of medicine, 18th edn, Edinburgh: Churchill Livingstone, 1999.
Oestreich AE. Radiology. In: Drennan JL, editor. The child’s foot. New York: Raven, 1992.
Oloff Solomon J. Computerised Radiographic Evaluation of the Pediatric Patient. In: Clinics in Podiatric Medicine and Surgery. Philadelphia: WB Saunders; 1987:21-36.
Oloff-Solomon J, Solomon MA. Computerised tomographic scanning of the foot and ankle. Clinics in Podiatric Medicine and Surgery. 1988;5(4):931-944.
Oloff J, Moore SG. Diagnostic imaging of the paediatric patient. In: DeValentine SJ, editor. Foot and ankle disorders in children. New York: Churchill Livingstone, 1992.
Picno E. Sustainability of medical imaging. BMJ. 2004;328:578-580.
Prioli F, Bacaini L, Cammisa M. Changes in the feet of patients with early rheumatoid arthritis. Journal of Rheumatology. 1997;24:2113-2118.
Rai A, Struthers GR 2002 Ankylosing spondylitis. In: Collected reports on the rheumatic diseases. Arthritis Research Campaign, Chesterfield.
Raisz LG. Clinical practice screening for osteoporosis. New England Journal of Medicine. 2005;353(3):164-171.
Ralston SH. Science, medicine and the future: osteoporosis. BMJ. 1997;315:469-472.
Resnick D. Bone and joint imaging. 2ndedn. WB Saunders. Philadelphia, PA. 1996.
Romanowski CAJ, Barrington NA. The accessory ossicles of the foot. The Foot. 1991;2:61-70.
Rowlett R. How many? A dictionary of units of measurement. Available at http://www.unc.edu/~rowlett/units/dictT.html, 2004. (accessed 19 September 2009)
Sanders P, Kaval KJ, DiPasquale T, et al. Exposure of the orthopaedic surgeon to radiation. Journal of Bone and Joint Surgery. 1993;75A:326-330.
Saltman CL, Braudser EA, Berbaum KS. Reliability of standard foot radiographic measurements. Foot and Ankle International. 1994;15:661.
Saraffian SK. Anatomy of the foot and ankle. Philadelphia, PA: Lippincot; 1983.
Schauwecker DS. The scintigraphic diagnosis of osteomyelitis. American Journal of Roentgenology. 1992;158:9-18.
Shaylor PJ, Abudu A, Grimer RJ, et al. Management and outcome of the surgical treatment of primary malignant tumours of the foot. The Foot. 2000;10(3):157-163.
Shereff MJ, DiGiovanni L, Beggani FJ. A comparison of non-weight bearing and weight bearing radiographs of the foot. Foot and Ankle. 1990;10:306.
Shook JE, Osher LS, Christman RA. Bone tumours and tumour like lesions. In: Christman RA, editor. Foot and Ankle Radiology. St Louis, MI: Churchill Livingstone, 2003.
Scottish Intercollegiate Guidelines Network 2003 Management of osteoporosis. Report No. 71. SIGN: Edinburgh.
Sobel M, Pavlov H, Geppert MJ, et al. Painful os peroneum syndrome: a spectrum of conditions responsible for lateral foot pain. Foot and Ankle. 1994;15(3):112-124.
Sopov V, Lileson A, Groshar DJ. Bone scintigraphic findings of os trigonum: a prospective study of 100 soldiers on active duty. Foot and Ankle International. 2000;21(10):822-824.
Spector TD, Cicuttini F, Baker J, Loughling J, Hart D. Genetic influences on osteoarthritis in women: a twin study. BMJ. 1996;312:940-943.
Stibe ECL, Cobb JP. Ewing’s sarcoma in the foot. The Foot. 1993;3(3):120-122.
Street MW, Johnston KA, DeWitz MA. Radiographic measurements of the normal adult foot. Foot and Ankle International. 1980;15:661.
Sutton D. Radiology and imaging for medical students, 7th edn. Edinburgh: Churchill Livingstone; 1997.
Tachdijian MO. Tachdjian’s Pediatric Orthopedics, 3rd ed. Philadelphia: Saunders; 1990.
Traughber PD. Imaging of the foot and ankle. In Coughlin MJ, Mann RA, editors: Surgery of the foot and ankle, 7th edn, St Louis, MI: Mosby, 1999.
Walker J. Osteoporosis: pathogenesis, diagnosis and management. Nursing Standard. 2008;22(17):48-56.
Walker DJ 1996 Rheumatoid arthritis. In: Collected reports on the rheumatic diseases. Arthritis Research Campaign, Chesterfield.
Weissman S. Standard radiographic techniques for the foot and ankle. Clinics in Podiatric Medicine and Surgery. 1988;5(4):767-775.
Wiener-Ogilvie S. The foot in rheumatoid arthritis. The Foot. 1999;9:169-174.
Williams M. Bone infection. In: Christman RA, editor. Foot and ankle radiology. St Louis, MI: Churchill Livingstone, 2003.
Wright V, Helliwell PS 1996 Psoriatic arthritis. In: Collected reports on the rheumatic diseases. Arthritis Research Campaign, Chesterfield.
Yeager KK, Mitchell M, Sartoris DJ, Resnick D. Diagnostic imaging of bone tumours of the foot. Clinics in Podiatric Medicine and Surgery. 1988;5(4):859-876.
Yester M, White SL. Advances in medical physics. Wisconsin: Medical Physics Publishing; 2006.