 CHAPTER 5 Normal Growth
Deviations in growth patterns may be nonspecific or may be important indicators of serious and chronic medical disorders. An accurate measurement of length/height, weight, and head circumference should be obtained at every health supervision visit. Table 5-1 summarizes several convenient benchmarks to evaluate normal growth. Growth should be measured and compared with statistical norms in a standard fashion on growth charts. Serial measurements are much more useful than single measurements to detect deviations from a particular child’s growth pattern even if the value remains within statistically defined normal limits (percentiles). Following the trend helps define whether growth is within acceptable limits or warrants further evaluation.
TABLE 5-1 Rules of Thumb for Growth
WEIGHT
HEIGHT
HEAD CIRCUMFERENCE (HC)
Growth is assessed by plotting accurate measurements on growth charts and comparing each set of measurements with previous measurements obtained at health maintenance visits or at other visits if there is a concern over the child’s growth pattern. Please see examples in Figures 5-1 to 5-4. Complete charts can be found at http://www.cdc.gov/growthcharts. The body mass index is defined as body weight in kilograms divided by height in meters squared. The body mass index is an index for classifying adiposity and is recommended as a screening tool for children and adolescents to determine whether an individual is overweight or at risk for being overweight (see Chapter 29).
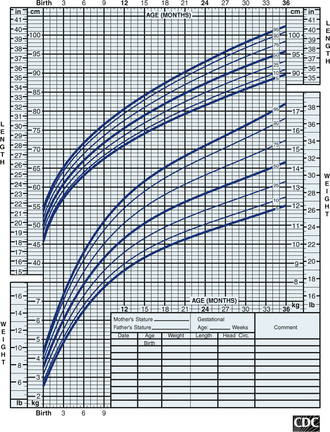
FIGURE 5-1 Length-by-age and weight-by-age percentiles for boys, birth to 36 months of age. Developed by the National Center for Health Statistics in collaboration with the National Center for Chronic Disease Prevention and Health Promotion.
(From Centers for Disease Control and Prevention, Atlanta, Ga, 2000. Available at: http://www.cdc.gov/growthcharts.)
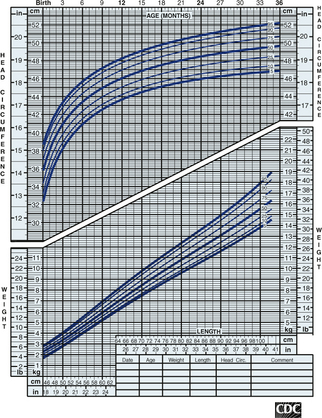
FIGURE 5-2 Head circumference and weight-by-length percentiles for boys, birth to 36 months of age. Developed by the National Center for Health Statistics in collaboration with the National Center for Chronic Disease Prevention and Health Promotion.
(From Centers for Disease Control and Prevention, Atlanta, Ga, 2000. Available at: http://www.cdc.gov/growthcharts.)
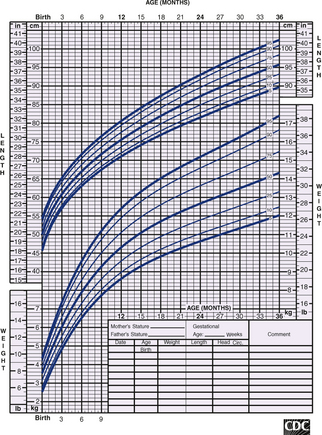
FIGURE 5-3 Stature-for-age and weight-for-age percentiles for girls, 2 to 20 years of age. Developed by the National Center for Health Statistics in collaboration with the National Center for Chronic Disease Prevention and Health Promotion.
(From Centers for Disease Control and Prevention, Atlanta, Ga, 2000. Available at: http://www.cdc.gov/growthcharts.)
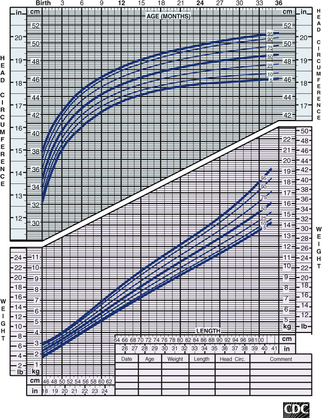
FIGURE 5-4 Body mass index–for-age percentiles for girls, 2 to 20 years of age. Developed by the National Center for Health Statistics in collaboration with the National Center for Chronic Disease Prevention and Health Promotion.
(From Centers for Disease Control and Prevention, Atlanta, Ga, 2000. Available at: http://www.cdc.gov/growthcharts.)
Because growth charts are based on a population sample, they make it seem that children grow in a smooth, continuous fashion. However, normal growth patterns have spurts and plateaus, so some shifting on percentile graphs can be expected. Large shifts in percentiles warrant attention, as do large discrepancies in height, weight, and head circumference percentiles. When caloric intake is inadequate, the weight percentile falls first, then the height, and, lastly, the head circumference. Caloric intake may be poor as a result of inadequate feeding or because the child is not receiving adequate attention and stimulation (nonorganic failure to thrive [see Chapter 21]).
Caloric intake also may be inadequate because of increased caloric needs. Children with chronic illnesses, such as heart failure or cystic fibrosis, may require a significantly higher caloric intake to sustain growth. An increasing weight percentile in the face of a falling height percentile suggests hypothyroidism. Head circumference may be disproportionately large when there is familial megalocephaly, hydrocephalus, or merely catch-up growth in a neurologically normal premature infant. A child is considered microcephalic if head circumference is less than the third percentile, even if length and weight measurements also are proportionately low. Serial measurements of head circumference are crucial during infancy, a period of rapid brain development, and should be plotted regularly until the child is 3 years of age. Any suspicion of abnormal growth warrants at least close follow-up, further evaluation, or both.