3 Titrimetric and chemical analysis methods
Direct acid/base titrations in the aqueous phase
Titrations of the salts of weak bases in mixed aqueous/non-aqueous media
Indirect titrations in the aqueous phase
Karl Fischer titration (coulometric end-point detection)
Automation of wet chemical methods
Principles
An analyte is chemically reacted with a standard solution of a reagent of precisely known concentration or with a concentration that can be precisely determined. The amount of a standard solution required to completely react with all of the sample is used to estimate the purity of the sample.
Applications
• Provide standard pharmacopoeial methods for the assay of unformulated drugs and excipients and some formulated drugs, e.g. those that lack a strong chromophore.
• Used for standardisations of raw materials and intermediates used in drug synthesis in industry. Suppliers of raw materials may provide these materials at a specified purity which has been assayed titrimetrically to a pharmacopoeial standard.
• Certain specialist titrations, such as the Karl Fischer titration used to estimate water content, are widely used in the pharmaceutical industry.
Advantages
• Capable of a higher degree of precision and accuracy than instrumental methods of analysis, with precisions of ca ± 0.1% being achievable.
• The methods are generally robust.
• Cheap to perform and do not require specialised apparatus.
• They are absolute methods and are not dependent on the calibration of an instrument.
Introduction
Titrimetric methods are still widely used in pharmaceutical analysis because of their robustness, cheapness and capability for high precision. The only requirement of an analytical method that they lack is specificity. This chapter covers the theoretical basis of most of the commonly used methods; the practical aspects of titrations have been covered thoroughly by other textbooks.1,2
Instrumentation and reagents
Glassware
The manufacturers’ tolerances for the volumes of a number of items of glassware are given in Chapter 1. The larger the volume measure the smaller the tolerance percentage is of the nominal volume. Thus, for a Grade A 1 ml pipette the volume is within ± 0.7% of the nominal volume, whereas for the 5 ml pipette the volume is within ± 0.3% of the nominal volume. If greater accuracy than those guaranteed by the tolerances is required, then the glassware has to be calibrated by repeated weighing of the volume of water contained or delivered by the item of glassware. This exercise is also useful for judging how good one's ability to use a pipette is, since weighing of the volumes of water dispensed correctly several times from the same pipette should give weights that agree closely.
Primary standards and standard solutions
Primary standards are stable chemical compounds that are available in high purity and which can be used to standardise the standard solutions used in titrations. Titrants such as sodium hydroxide or hydrochloric acid cannot be considered as primary standards since their purity is quite variable. So, for instance, sodium hydroxide standard solution may be standardised against potassium hydrogen phthalate, which is available in high purity. The standardised sodium hydroxide solution (secondary standard) may then be used to standardise a standard solution of hydrochloric acid. Table 3.1 lists some commonly used primary standards and their uses.
Table 3.1 Primary standards and their uses
| Primary standard | Uses |
| Potassium hydrogen phthalate | Standardisation of sodium hydroxide solution |
| Potassium hydrogen phthalate | Standardisation of acetous perchloric acid |
| Potassium iodate | Standardisation of sodium thiosulphate solution through generation of iodine |
| Anhydrous sodium carbonate | Standardisation of hydrochloric acid |
| Zinc metal | Standardisation of EDTA solution |
EDTA, Ethylenediamine tetracetic acid.
Direct acid/base titrations in the aqueous phase
Strong acid/strong base titrations
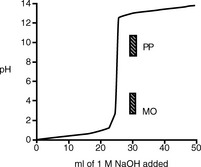
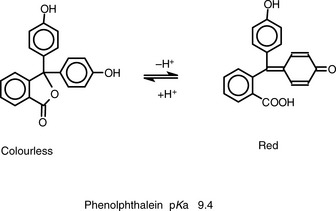
Figure 3.1 shows the titration curve obtained from the titration of a strong acid with a strong base. The pH remains low until just before the equivalence point, when it rises rapidly to a high value. In many titrations a coloured indicator is used, although electrochemical methods of end-point detection are also used. An indicator is a weak acid or base that changes colour between its ionised and un-ionised forms; the useful range for an indicator is 1 pH either side of its pKa value. For example, phenolphthalein (PP) pKa 9.4 (colour changes between pH 8.4 and pH 10.4) undergoes a structural rearrangement as a proton is removed from one of its phenol groups when the pH rises, and this causes the colour change (Fig. 3.2). Methyl orange (MO) pKa 3.7 (colour changes between pH 2.7 and pH 4.7) undergoes a similar pH-dependent structural change. Both these indicators fall within the range of the inflection of the strong acid/strong base titration curve.
There are only a few direct strong acid/strong base titrations carried out in pharmacopoeial assays.
Strong acid/strong base titrations are used in pharmacopoeial assays of: perchloric acid, hydrochloric acid, sulphuric acid and thiamine hydrochloride.
Weak acid/strong base and weak base/strong acid titrations
On addition of a small volume of the strong acid or strong base to a solution of the weak base or weak acid, the pH rises or falls rapidly to about 1 pH unit below or above the pKa value of the acid or base. Often a water-miscible organic solvent such as ethanol is used to dissolve the analyte prior to the addition of the aqueous titrant.
Figure 3.3 shows a plot of pH when 1 M NaOH is added to 25 ml of a 1 M solution of the weak acid aspirin.
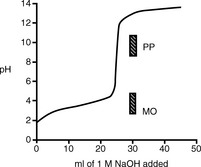
Fig. 3.3 Titration curve for 25 ml of a 1.0 M solution of aspirin (pKa 3.5) titrated with 1.0 M NaOH.
In the case of aspirin, the choice of indicator is restricted by where the inflection in its titration curve lies; PP is suitable as an indicator whereas MO is not.
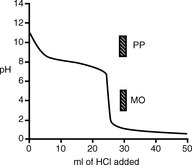
In the example of the titration of quinine with hydrochloric acid (Fig. 3.4), MO is a suitable indicator because it falls within the inflection of the titration curve whereas PP is not suitable.
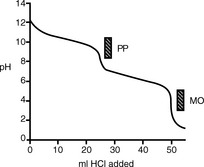
Some acids or bases can donate or accept more than one proton, i.e. 1 mole of analyte is equivalent to more than 1 mole of titrant. If the pKa values of any acidic or basic groups differ by more than ca 4, then the compound will have more than one inflection in its titration curve. Sodium carbonate is a salt of carbonic acid and it can accept two protons. The pKa values of carbonate and bicarbonate are sufficiently different (pKa 10.32 and 6.38) for there to be two inflections in the titration curve. The two stages in the titration are:
Which of these indicators could be used in the titration of aspirin and which could be used in the titration of quinine?
In a titration of sodium carbonate, the first inflection is indicated by PP and the whole titration by MO (Fig. 3.5).
A sample containing 25.14 g of neutral salts, glucose and a sodium carbonate/bicarbonate buffer was dissolved in 100 ml of water. A 25 ml aliquot of the resultant solution required 20.35 ml of 0.0987 M HCl when titrated to the PP end-point. A second 25 ml aliquot was titrated to the MO end-point and required 56.75 ml of the acid. Calculate the percentage of Na2CO3 (molecular weight 106) and NaHCO3 (molecular weight 84) in the sample.
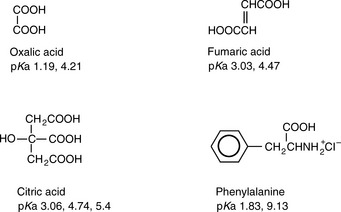
How many inflections do the following substances have in their titration curves when titrated with a strong base? Draw the predominant forms of these substances which would exist at pH 14.
Answers: oxalic acid 1, fumaric acid 1, citric acid 1, phenylalanine 2
Weak acid/strong base titration is used in the pharmacopoeial assays of: benzoic acid, citric acid, chlorambucil injection, mustine injection, nicotinic acid tablets and undecanoic acid.
Titrations of the salts of weak bases in mixed aqueous/non-aqueous media
Non-aqueous titrations, which are described below, are still used for the analysis of acids and salts of weak bases. However, in many instances it is simpler to titrate weak bases as their salts in a mixed non-aqueous/aqueous medium using potentiometric end-point detection. The protonated base behaves as a weak acid when titrated with sodium hydroxide.
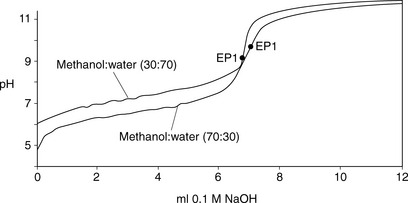
The advantage of adding a water-miscible solvent such as methanol to the titration is twofold. Firstly, the addition of the organic solvent effectively lowers the pKa value of the base, since the ionised form of the base is less stable in a mixed solvent system where the dielectric constant is lower, and, secondly, the organic solvent keeps the base in solution as it is converted to its free base form during the titration. An example of this can be seen for the titration of lidocaine (lignocaine) hydrochloride in methanol/water mixtures (Fig. 3.6), where the size of the inflection in the titration curve increases when moving from 30% methanol to 70% methanol. This is a very convenient procedure for many organic bases.
Indirect titrations in the aqueous phase
These can be of the strong acid/strong base, weak acid/strong base or weak base/strong acid type. The more common examples are weak acid/strong base.
Estimation of esters by back titration
Excess of sodium hydroxide is added to the ester. The following reaction occurs:
The XSNaOH is back titrated with HCl using PP as an indicator.
This procedure is used in pharmacopoeial assays of: benzyl benzoate, dimethyl phthalate, ethyl oleate, methyl salicylate, cetostearyl alcohol, emulsifying wax, castor oil, arachis oil, cod liver oil and coconut oil.
Saponification value
The assay of fixed oils provides a special case of ester hydrolysis since they are triesters of glycerol. The saponification value for a fixed oil is the number of mg of potassium hydroxide (KOH) equivalent to 1 g of oil. A high value means rancidity, a low value possible adulteration with mineral oil. Almost all edible oils have a saponification value between 188 and 196. Hydrolysis of the fixed oil is carried out with ethanolic KOH.
This procedure is used in the pharmacopoeial assays of: castor oil, cod liver oil, cotton seed oil, almond oil and sesame seed oil.
Acid values are also determined for fixed oils. The acid value for a substance is the number of mg of KOH required to neutralise 1 g of the test substance when it is titrated with 0.1 M ethanolic KOH to a PP end-point. This value is quoted for many fixed oils in order to eliminate rancid oils, which contain large amounts of free fatty acid. Typically acid values for fixed oils are in the range of 1–2.
The following data were obtained for a sample of cod liver oil:
Weight of oil taken for analysis = 2.398 g
Ethanolic KOH (molecular weight 56.1) used in determination = 0.986 M
Amount of ethanolic KOH used for hydrolysis and in blank titration = 25 ml
Amount of 0.470 M HCl required to neutralise excess KOH = 35.2 ml
Amount of 0.470 M HCl required in the titration of blank = 52.3 ml
Calculation
Amount of KOH used initially = 52.3 × 0.47 = 24.6 mmole
Amount of HCl required to neutralise excess KOH = 35.20 × 0.470 = 16.5 mmole
Amount of KOH used in hydrolysis = 24.6 – 16.5 = 8.1 mmole × molecular weight = mg
Amount of KOH used in the hydrolysis = 8.1 × 56.1 = 454.0 mg
Amount of KOH/g of fixed oil used in the hydrolysis = 454/2.398 = 189.3 mg
Calculate the saponification value of a sample of castor oil from the following data:
Estimation of alcohols and hydroxyl values by reaction with acetic anhydride (AA)
Alcohols can be determined by reaction with excess acetic anhydride (AA) (Fig. 3.7). This is a useful titrimetric method because the alcohol group is difficult to estimate by any other means.
The excess AA and acetic acid may be back titrated with NaOH using PP as an indicator.
In a related assay, a hydroxyl value is determined for a fixed oil. A 1:3 mixture of AA in pyridine is used in the determination; the pyridine is present as a catalyst. The hydroxyl value may be defined as:
The number of mg of KOH required to neutralise a blank titration of the reagents – the number of mg KOH required to neutralise excess AA + acetic acid after reaction with 1 g of the test substance.
The following data were obtained for a sample of castor oil:
Weight of castor oil taken for analysis = 1.648 g
Volume of acetic anhydride used for the reaction = 5 ml
Molarity of ethanolic KOH used to neutralise the excess AA + acetic acid = 0.505 M
Volume of ethanolic KOH required to titrate 5 ml of reagent = 53.5 ml
Volume of ethanolic KOH required to neutralise excess AA + acetic acid after reaction with the castor oil = 44.6 ml.
Number of mmoles of KOH used in the blank titration = 53.5 × 0.505 = 27.0
Number of mg of KOH used in the titration of the blank = 27.0 × 56.1 = 1515
Number of mmoles of KOH used in titration of AA + acetic acid = 44.6 × 0.505 = 22.5
Number of mg KOH used in titration of excess AA + acetic acid = 22.5 × 56.1 = 1262
To be completely accurate, the acid value for the fixed oil should be added to the hydroxyl value, since any free acid in the oil will titrate along with the excess reagents, giving a small overestimate. The acid value for castor oil is about 2.0, giving a hydroxyl value for the above sample of 156.
Reaction with acetic anhydride is used in pharmacopoeial assays of benzyl alcohol and dienestrol, and determination of hydroxyl values of castor oil, cetosteryl alcohol and cetomacrogol.
Non-aqueous titrations
Theory
Non-aqueous titration is the most common titrimetric procedure used in pharmacopoeial assays and serves a double purpose, as it is suitable for the titration of very weak acids and bases and provides a solvent in which organic compounds are soluble. The most commonly used procedure is the titration of organic bases with perchloric acid in acetic acid. These assays sometimes take some perfecting in terms of being able to judge the end-point precisely.
The theory is, very briefly, as follows: water behaves as both a weak acid and a weak base; thus, in an aqueous environment, it can compete effectively with very weak acids and bases with regard to proton donation and acceptance, as shown in Figure 3.8.
The effect of this is that the inflection in the titration curves for very weak acids and very weak bases is small, because they approach the pH limits in water of 14 and 0 respectively, thus making end-point detection more difficult. A general rule is that bases with pKa < 7 or acids with pKa > 7 cannot be determined accurately in aqueous solution. Various organic solvents may be used to replace water since they compete less effectively with the analyte for proton donation or acceptance.
Non-aqueous titration of weak bases
Acetic acid is a very weak proton acceptor and thus does not compete effectively with weak bases for protons. Only very strong acids will protonate acetic acid appreciably according to the equation shown below:
Perchloric acid is the strongest of the common acids in acetic acid solution, and the titration medium usually used for non-aqueous titration of bases is perchloric acid in acetic acid. Addition of acetic anhydride, which hydrolyses to acetic acid, is used to remove water from aqueous perchloric acid. Weak bases compete very effectively with acetic acid for protons. Oracet blue, quinalidine red and crystal violet (very weak bases) are used as indicators in this type of titration. A typical analysis is shown in Figure 3.9 for L-3,4-dihydroxyphenylalanine (LDOPA).
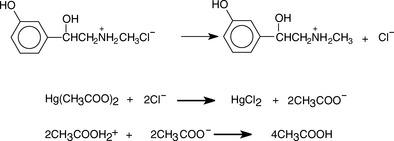
When the base is in the form of a salt of a weak acid, removal of an anionic counter ion prior to titration is not necessary, e.g. for salts of bases with weak acids such as tartrate, acetate or succinate. However, when a base is in the form of a chloride or bromide salt, the counter ion has to be removed prior to titration. This is achieved by the addition of mercuric acetate; the liberated acetate is then titrated with acetous perchloric acid. This is illustrated in Figure 3.10 for the example of phenylephrine HCl.
Non-aqueous titration with acetous perchloric acid is used in the pharmacopoeial assays of: adrenaline, metronidazole, codeine, chlorhexidine acetate, chlorpromazine, amitriptyline HCl, propranolol HCl, lidocaine (lignocaine) HCl, and HCl and quaternary amine salts, such as neostigmine bromide and pancuronium bromide.
Non-aqueous titration of weak acids
For the non-aqueous titration of weak acids, a solvent such as an alcohol or an aprotic solvent is used, which does not compete strongly with the weak acid for proton donation. Typical titrants are lithium methoxide in methanol or tetrabutyl ammonium hydroxide in dimethylformamide. End-point detection may be carried out with thymol blue as an indicator or potentiometrically (see p. 81).
Non-aqueous titration of acidic groups is carried out in pharmacopoeial assays of: barbiturates, uracils and sulphonamides.
Argentimetric titrations
Argentimetric titrations are based on the reaction:
Potassium chromate may be used as an indicator, producing a red colour with excess Ag+ ion. More widely applicable is the method of back titration. Excess AgNO3 is added to the sample containing chloride or bromide ions. The excess AgNO3 is then titrated with ammonium thiocyanate, and ammonium ferrous sulphate is used as an indicator of excess SCN−:
Before the back titration can be carried out, the precipitated AgCl has to be filtered off or coated with diethylphthalate to prevent SCN− causing dissociation of AgCl. Organically combined chlorine has to be liberated by hydrolysis with sodium hydroxide prior to titration. A halogen attached to an aromatic ring cannot be liberated by hydrolysis and aromatic halides have to be burnt in an oxygen flask in order to release the halogen for titration.
Argentimetric titration is used in pharmacopoeial assays of: sodium chloride and potassium chloride tablets, thiamine hydrochloride, mustine chloride and carbromal.
Compleximetric titrations
These titrations are used in the estimation of metal salts. Ethylenediamine tetracetic acid (EDTA) shown in Figure 3.11 is the usual titrant used. It forms stable 1:1 complexes with all metals except alkali metals such as sodium and potassium. The alkaline earth metals such as calcium and magnesium form complexes which are unstable at low pH values and are titrated in ammonium chloride buffer at pH 10. The general equation for the titration is:
The end-point of the reaction is detected using an indicator dye. The dye is added to the metal solution at the start of the titration, and forms a coloured complex with a small amount of the metal. The first drop of excess EDTA causes this complex to break up, resulting in a colour change.
Titration with EDTA is used in the pharmacopoeial assays of: bismuthsubcarbonate, calcium acetate, calcium chloride, calcium gluconate, magnesium carbonate, magnesium hydroxide, magnesium trisilicate, bacitracin zinc, zinc chloride and zinc undecanoate.
Insoluble metal salts are estimated by back titration; the sample is heated with excess EDTA to form the soluble EDTA complex of the metal and then the excess EDTA is titrated with salt solutions containing Mg2 + or Zn2 + of known concentration.
Back titration with EDTA is used in the pharmacopoeial assays of: aluminium glycinate, aluminium hydroxide, aluminium sulphate, calcium hydrogen phosphate.
Redox titrations
Redox titrations are based on the transfer of electrons between the titrant and the analyte. These types of titrations are usually followed by potentiometry, although dyes which change colour when oxidised by excess titrant may be used.
Theory
Reduction potential is a measure of how thermodynamically favourable it is for a compound to gain electrons. A high positive value for a reduction potential indicates that a compound is readily reduced and, consequently, is a strong oxidising agent, i.e. it removes electrons from substances with lower reduction potentials. The oxidised and reduced forms of a substance are known as a redox pair. Table 3.2 lists the standard reduction potentials for some typical redox pairs.
Table 3.2 Standard reduction potential (Eo) for some redox pairs relative to the standard hydrogen electrode potential 0
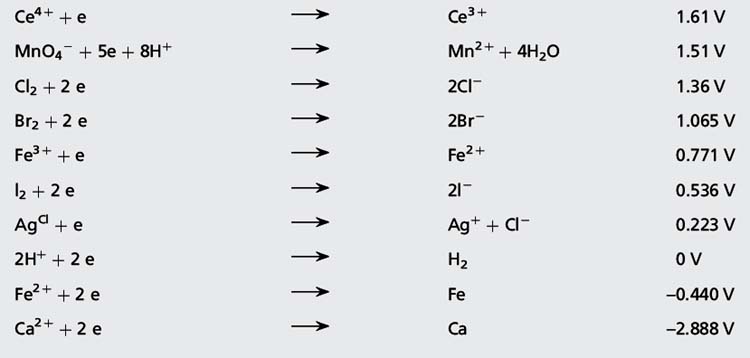
A substance with a higher reduction potential will oxidise one with a lower reduction potential. The difference in potential between two substances is the reaction potential and is approximately the potential difference which would be measured if the substances comprised two halves of an electrical cell. For example Cl2 will oxidise Br− according to the following equation:
Taking values from Table 3.2, the reaction potential is given by: 1.36 – 1.065 = 0.29 V
The reaction potential is given by: 1.36 – (–2.888) = 4.248 V (i.e. a large difference and calcium burns in chlorine).
Complete the equations where reaction is possible and indicate the reaction potential:
Answers: (i) No reaction; (ii) 0.529 V; (iii) 0.839 V; (iv) 0.976 V; (v) No reaction (Ag is already in its Ag+ form)
In the above examples we have ignored the effect of concentration of oxidant and reductant on Eo values; in fact, E (the observed electrode potential) is stable over a wide range of concentrations. The E-value for a solution containing a redox pair is governed by the Nernst equation:
where [Ox] is the concentration of the oxidised form of a particular substance and [Red] is the concentration of the reduced form of a particular substance:
By substituting a value for the constant terms, this equation can also be written as:
where n is the number of electrons transferred during the reaction. It is clear that E is approximately equal to Eo except when there is a large difference between [Ox] and [Red].
Calculate the E for the following redox pair when Mn3 + = 0.5 M and Mn2 + = 0.01 M (Eo Mn3 +/Mn2 + = 1.51 V).
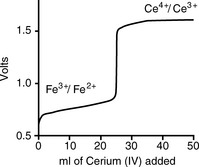
The titration curve for Fe2 + against Ce4 + is shown in Figure 3.12. This curve is for a titration carried out with a standard hydrogen electrode as the reference electrode.
Where a reference electrode has a reduction potential > 0, then the predicted reading of the potential for a redox pair is obtained by subtracting the reduction potential for the reference electrode, e.g. for an Ag/AgCl reference electrode, 0.223 V is subtracted.
Using the values in Table 3.1, what would be the approximate potential measured for the Fe3 +/Fe2 + redox pair present in the first part of the titration shown in Figure 3.12 measured against?
Similarly, what would the approximate potential be for the Ce4 +/Ce3 + redox pair on the plateau after the end-point measured against?
In carrying out redox titrations, standard Ag/AgCl or Hg/Hg2Cl2 electrodes are used as a reference in conjunction with an inert redox electrode, e.g platinum, which takes its potential from the particular redox pair in the solution in which it is immersed.
Redox titration is used in pharmacopoeial assays of: ferrous salts, hydrogen peroxide, sodium perborate and benzoyl peroxide by titration with KMnO4. In the case of KMnO4 titrations, the end-point may be detected when the purple colour of the permanganate persists.
Iodometric titrations
There are a number of types of iodometric assay.
Direct titrations
Iodine is a moderately strong oxidising agent (see Table 3.1). During oxidation iodine is reduced as follows:
It will oxidise substances with lower reduction potentials, e.g. the titration of ascorbic acid is carried out as shown in Figure 3.13.
The iodine solution used is standardised against sodium thiosulphate (see later). In addition, the end-point is detected using starch indicator, which produces a blue coloration with excess iodine.
Direct iodometric titration is used in pharmacopoeial assays of: ascorbic acid, sodium stilbigluconate, dimercaprol injection and acetarsol.
Iodine displacement titrations
These titrations involve displacement of iodine from iodide by a stronger oxidising agent followed by titration of the displaced iodine with sodium thiosulphate. For example, the available chlorine in bleach is estimated as follows:
The displaced iodine is then titrated with thiosulphate according to the following equation:
A different approach is used in the estimation of phenols. Bromine is generated by the reaction of potassium bromide with a defined volume of a standard solution of potassium bromate according to the following equation:
The bromine generated is then reacted with the phenol, and 1 mole of phenol reacts with 3 moles of bromine (Fig. 3.14).
Excess bromine is used and the bromine remaining after the above reaction is reacted with iodide as follows:
The liberated iodine is then titrated with thiosulphate, thus quantifying the excess bromine.
Iodine displacement titrations are used in pharmacopoeial assays of: liquefied phenol, methyl hydroxybenzoate, propyl hydroxybenzoate and phenidione.
A sample of phenol glycerol injection was diluted with water and an aliquot was taken and reacted with excess bromine generated from potassium bromide and potassium bromate solutions. The excess bromine remaining after reaction was reacted with potassium iodide, and the liberated iodine was titrated with sodium thiosulphate. A blank titration was carried out, where the same quantity of bromine was generated as was used in the titration of the diluted injection; potassium iodide was then added and the liberated iodine was titrated with sodium thiosulphate. From the following data calculate the percentage of w/v of the phenol in the injection:
Weight of injection taken for analysis = 4.214 g.
The sample is diluted to 100 ml with water and then 25 ml of the solution is analysed.
The volume of 0.1015 M sodium thiosulphate required to titrate the excess bromine after reaction with the sample = 22.4 ml.
The volume of 0.1015 M sodium thiosulphate required to titrate the bromine blank = 48.9 ml.
Iodine-absorbing substances in penicillins
A major stability problem in penicillins is the hydrolysis of the lactam ring, as shown in Figure 3.15. Penicillins with an open lactam ring are inactive as antibiotics, since it is the reactive lactam ring which kills the bacteria.
When the lactam ring is open it will react with iodine. 1 mole of the ring-open form of penicillin will react with 8 equivalents of iodine; the intact lactam ring will not react. In this type of titration, excess iodine solution is added to a sample of the penicillin, and the iodine that is not consumed in the reaction is estimated by titration with sodium thiosulphate. The value obtained for the amount of hydrolysed penicillin in the sample, should be no more than 5% of that obtained when all the penicillin in the same amount of sample is completely hydrolysed to the ring-open form and then reacted with iodine. Most of the pharmacopoeial monographs for penicillins indicate that this test should be carried out.
Ion pair titrations
This type of titration is widely used in the cosmetics and detergents industry since it is very useful for estimating surfactants, which often cannot be analysed by spectrophotometric methods because they lack chromophores. There are two types of titration used.
Titrations using indicator dyes
A small amount of an anionic or cationic dye is added to an aqueous solution of the analyte, which is a lipophilic cationic or anionic compound. A small amount of coloured lipophilic ion pair is formed and this is extracted into a small amount of chloroform, which becomes coloured by the ion pair. Titration of the lipophilic anion or cation is carried out with a lipophilic counter ion, e.g. benzethonium chloride or sodium dodecyl sulphate. At the end-point, excess of the titrant breaks up the coloured complex in the chloroform layer.
Ion pair titration using a coloured indicator complex is used in pharmacopoeial assays of: dicyclamine elixir, procyclidine tablets, sodium dodecyl sulphate and cetrimide emulsifying ointment.
Titrations using iodide as a lipophilic anion
This procedure is more widely used in pharmacopoeial assays than the dye extraction procedure. Excess potassium iodide is added to an aqueous solution of the analyte, which is a lipophilic cation. A lipophilic ion pair is formed between the cation and the iodide ion and is then removed by extraction into an organic phase such as chloroform. The excess iodide remaining in the aqueous phase is then titrated in concentrated HCl (> 4 M) with potassium iodate. The iodate oxidises iodide to I+, which immediately reacts with Cl− to give ICl, resulting in the following equation:
A small amount of chloroform is used as an indicator and, in the presence of the reaction mixture, it becomes coloured purple by traces of iodine, which are present during titration. The purple colour disappears at the end-point, when the conversion of all I− and I2 into ICl is complete.
Ion pair formation with iodide followed by titration of excess iodide with iodate is utilised in pharmacopoeial assays of: cetrimide, cetylpyridium bromide, domiphen bromide and benzalkonium chloride.
Diazotisation titrations
This type of titration is quite simple to carry out and is very useful for the analysis of sulphonamide antibiotics and aminobenzoic acid-derived local anaesthetics. Titration is carried out with acidified sodium nitrite, causing the primary aromatic amine function to be converted to a diazonium salt shown in Figure 3.16 for sulfacetamide.
A small amount of iodide is included in the titration mixture. At the end-point the first drop of excess nitrous acid converts iodide to iodine and this is detected using starch indicator.
Titration with nitrous acid is used in pharmacopoeial assays of: benzocaine, dapsone, primaquine, procainamide, procaine, sulfacetamide, sulfadoxine, sulfamethizole, sulfapyridine and sulfathiazole.
Potentiometric titrations
Potentiometric end-point detection
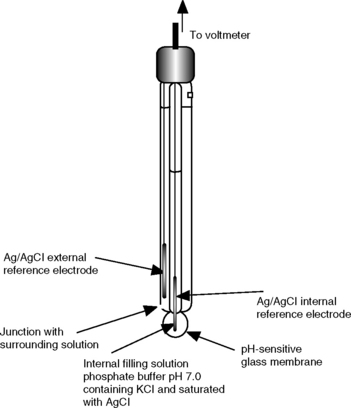
All of the titrations discussed in the preceding sections can be carried out using a suitable electrode to measure the potential of the solution as the titration progresses. The advantage of making potentiometric measurements in order to detect end-points is that the measurements can be made in solutions which are coloured, unlike indicator-based end-point detection, and give unambiguous end-points where indicator colour changes are not clear or sudden. The disadvantage of potentiometric titrations is that they are relatively slow, since time has to be allowed for readings to stabilise, particularly near the end-point of the titration. However, potentiometric titrations can be automated and potentiometric end-point detection is used in automatic titrators, where the titrant is pumped into the sample under microprocessor control. The electrode that is usually used to make the measurements in potentiometric titrations is the pH-sensitive glass indicator electrode. This electrode consists of a pH-sensitive glass membrane bulb which encloses a phosphate buffer solution containing potassium chloride solution and saturated with silver chloride. The solution is in contact with an internal reference electrode which consists of a silver wire. The circuit is completed by a second reference electrode, which in modern combination electrodes is a second silver/silver chloride electrode, which contacts the external solution via a porous junction (Fig. 3.17). The electrode monitors the variation in the potential difference, which is largely caused by the interaction of hydrogen ions with the outer surface of the pH-sensitive glass membrane.
The potential which develops on the inner and outer glass surfaces of the electrode is due to the following equilibria:
The number of Gl− sites on the outer membrane increases with decreasing [H+] and thus its potential becomes increasingly negative with respect to the inner surface with increasing pH. The Nernst equation can be simplified and written in the following form for the glass electrode when the temperature is 20°C:
where E is the measured potential in volts and Ek is a constant composed of the sum of the various potential differences within the electrode, which do not vary appreciably. The combination electrode is constructed so that its potential is ca 0 V at pH 7.0. It can be seen from the equation above that E changes by 59.1 mV for each pH unit.
Assuming an indicator electrode is constructed so that E = 0 V at pH 7.0, calculate what its potential would be at: (i) pH 1; (ii) pH 14.
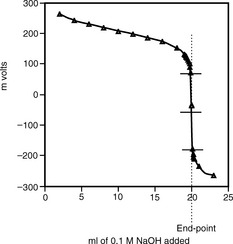
When potentiometric titration is carried out, the volume of titrant added is plotted against the measured potential. Since the electrode takes time to equilibrate, the volume of titrant required to reach the end-point is first calculated and a volume of titrant is added to within ca 1 ml of the end-point. Then the titrant is added in 0.1 ml amounts until the steep inflection in the titration curve is passed. The end-point of the titration is the point where the slope of the titration curve is at its maximum. Thus, if dE/dV is plotted for the titration, the maximum of the plot gives the end-point. The end-point can also be determined from the mid-point of the inflection in the titration curve or from the tabulated data (Table 3.3). Figure 3.18 shows a curve for the titration of 2 mmoles of aspirin with 0.1 M NaOH. The end-point corresponds to the mid-point of the inflection or, if the tabulated data are examined, it can be taken to be the mid-point between the two volumes, where dE/dV is greatest, i.e. at 20.05 ml between 20 and 20.1 ml. The actual end-point for exactly 2 mmoles of aspirin titrated with 0.1 M NaOH should be 20 ml; addition of 0.1 ml aliquots towards the end-point means that the end-point is only accurate to within ± 0.05 ml.
Table 3.3 Potential difference values obtained for titration of 2 mmoles of aspirin (pKa 3.5) against 0.1 M NaOH
| ml of 0.1 M NaOH added | potential mV |
| 14 | 185 |
| 16 | 172 |
| 18 | 151 |
| 19 | 132 |
| 19.1 | 129 |
| 19.2 | 126 |
| 19.3 | 122 |
| 19.4 | 119 |
| 19.5 | 113 |
| 19.6 | 107 |
| 19.7 | 100 |
| 19.8 | 89 |
| 19.9 | 71 |
| 20 | –44 |
| 20.1 | –177 |
| 20.2 | –195 |
| 20.3 | –206 |
| 20.4 | –212 |
| 21 | –236 |
| 23 | –266 |
Use of potentiometric titration to determine pKa values
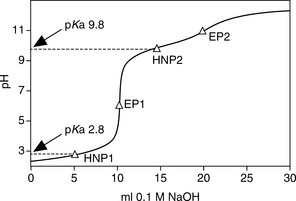
Potentiometric titration provides the principal method for determining pKa values and it is best applied to substances with pKa values < 11. For example, the pKa of benzoic acid can be determined as follows: a 0.01 M solution of benzoic acid (50 ml) is titrated with 0.1 M KOH. The KOH is added in 0.5 ml increments; it would be expected that 5 ml of 0.1 M KOH would be required to neutralise the benzoic acid. The pH of the titration is monitored with a glass electrode and the pH of the mixture after 2.5 ml of 0.1 M KOH has been added will equal the pKa value of benzoic acid, since:
The pKa value may be checked after addition of each 0.5 ml, since the concentrations of acid and salt are known at each point on the titration curve. The slight increase in volume due to the addition of the 0.1 M KOH may be ignored. For a base, the Henderson–Hasselbalch equation is written as given in Chapter 2, page 29. Automatic titrator software will evaluate the titration curve and report half-neutralisation points. Figure 3.19 shows a potentiometric titration curve for the amino acid glycine which has two pKa values.
Karl Fischer titration (coulometric end-point detection)
The Karl Fischer titration is a specialised type of coulometric titration. Coulometry in itself is a useful technique, but is not used as a mainstream technique for pharmaceutical analysis. Essentially, coulometry measures the amount of charge that has to be passed through a solution of analyte in order to reduce or oxidise it. The amount of charge required can be equated to the number of moles of analyte present in solution, since, according to Faraday's law, in the case where one molecule reacts with one electron, 1 mole of analyte will react with 96 485 coulombs of electricity, where coulombs = amps × s. In the case of the Karl Fischer titration, the end-point detection is based on the following reaction:
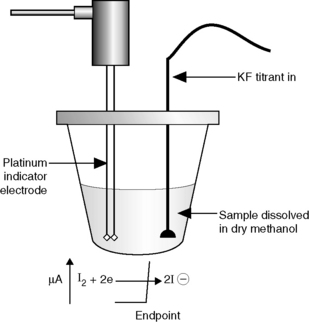
A pair of platinum electrodes that provide variable potential, so that a constant current is supplied to the titration cell, detect the end-point. When excess iodine is produced at the end-point, the resistance of the cell falls. Up to the end-point, the reaction at the cathode of the electrode pair is:
At the end-point it is the excess iodine that is reduced, which requires less voltage than the reaction shown above; this causes the steep drop in potential at the end-point.
The Karl Fischer reagent consists of a mixture of anhydrous methanol, an anhydrous base (the base was originally pyridine but bases such as imidazole or diethanolamine are more commonly used now), iodine and sulphur dioxide. It is important for the reliability of the titration that it remains buffered within the optimal pH range of 4–7. Various other inert co-solvents may be used in the preparation of the reagent. The reaction that occurs in the presence of water with pyridine as the basic component, shown below, looks complicated but essentially the reaction involves the reduction of iodine to iodide by sulphur dioxide, which itself is oxidised to sulphur trioxide.
A variety of automated Karl Fischer systems are available (www.metrohm.com). The apparatus used basically consists of a titration vessel of about 60 ml capacity fitted with two platinum electrodes, a nitrogen inlet tube, burette and a vent tube protected by a suitable desiccant. The substance being examined is introduced through an inlet tube and the sample is stirred during the titration with a magnetic stirrer. The potential is adjusted so that a current of 10 μA passes between the platinum electrodes. At the end of the reaction a steep fall in potential indicates the presence of excess iodine in solution. Karl Fischer volumetric titration can be used to determine water between ca 10 μg and several hundred mg. Figure 3.20 shows an automated Karl Fischer titration apparatus.
Coulometric titration is an alternative to volumetric titration. In this case, the instrument used generates iodine from iodide at a platinum anode; any water present in the sample solution immediately converts the iodine back to iodide until the end-point is reached. The end-point is detected as in the volumetric titration, using a pair of platinum electrodes, in addition to the anode that is used to generate the iodine in situ. In this case, the amount of water present is determined from the number of coulombs required to generate iodine (2 coulombs are equivalent to 1 mole of water) up to the end-point. The coulometric apparatus is best used for low levels of water, down to 10 μg per sample.
Automation of wet chemical methods
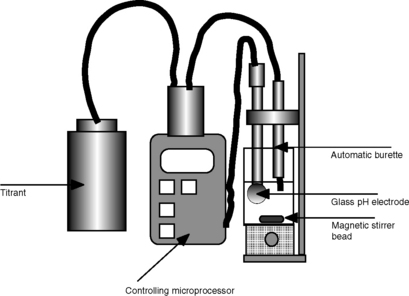
Automatic titration (Fig. 3.21)
Titrations can be automated and controlled by a microprocessor. The titrant is delivered via an automatic burette and the end-point is detected potentiometrically with a glass combination electrode. Alternatively, if ions other than hydrogen are being measured, another ion-selective electrode may be used. The apparatus is microprocessor controlled and can be programmed to run in various modes:
(i) The rate of delivery of the titrant can be controlled according to rate of change of potential, so it is added more slowly as the rate of change in potential increases, i.e. as the end-point is approached.
(ii) For titrations which take time to equilibrate as the titrant is added, the instrument can be programmed to delay after each incremental addition until the potential becomes stable.
(iii) The detection of the end-point can be pre-set at a fixed potential.
The microprocessor control also enables the instrument to be set to calculate pKa values directly from the pH profile it obtains by titration of a sample. A sample changer can be incorporated, so that several samples can be automatically titrated.
Flow injection analysis
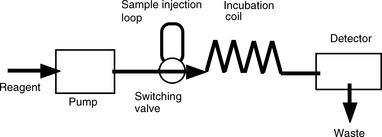
Flow injection analysis (FIA) represents a refinement of wet chemical methods. The basis of the technique is that the sample is injected into a continuously flowing stream of reagent. The sample reacts with the reagent and this reaction is measured with a detector. The range of detectors available is the same as that which is used in conjunction with HPLC (Ch. 12, p. 322) except that there is no chromatographic separation involved. Thus the technique is not as selective as chromatographic methods and its selectivity is dependent on the specificity of the reaction between the analyte and the reagent or the property used for detecting it. A simple schematic diagram of a flow injection analysis system is shown in Figure 3.22. The basic setup may be modified to include several manifolds that allow the introduction of the sample followed by additional reagents. The advantages of the technique are its cheapness and rapidity.
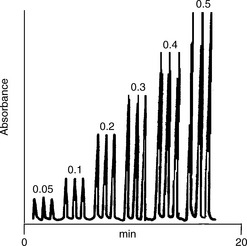
A precise volume of sample (1–100 μl) is injected and passed through the incubation coil, which is of sufficient length to allow the sample to disperse in the reagent but not long enough for the sample to become diluted so much that the integrity of the plug of sample is lost. The detector response is dependent on the degree of dispersion of the sample. A typical flow of the reagent + analyte is as shown in Figure 3.23.
The parameters which have to be optimised include:
Since a number of factors are involved in the optimisation, some time is required to develop the method. However, when set up the method can replace titrations, and replicate analyses can be conducted very quickly with minimal consumption of reagents.
As in chromatography, the ideal peak shape obtained in FIA should be Gaussian, although in practice the ideal shape may not have time to develop. The mathematics governing the dispersion processes have been developed thoroughly and the process is largely analogous to the dispersion occurring in capillary gas chromatography, where longitudinal diffusion is the major factor governing band broadening.
Figure 3.24 illustrates an application of FIA to the Karl Fischer titration. The consumption of the reagent by water is detected spectrophotometrically by monitoring the stream of reagent at 615 nm. The absorbance due to the iodine in the reagent is removed by its reaction with water, which causes formation of iodide and thus negative absorbance is measured.
Applications of FIA in pharmaceutical analysis
Determination of chloroxine
The antibiotic chloroxine was determined utilising the formation of a complex between the drug and Al3 + in an FIA system. The complex was determined by measurement of fluorescence with 399 nm as the excitation wavelength and 496 nm as the emission wavelength. In order to ensure solubility of the complex in the aqueous reagents, a surfactant was included in the reagent mixture. The precision of the method was greater than that obtained using a laborious batch method for measuring samples manually using a fluorescence spectrophotometer.3
Determination of captopril
An FIA method for the determination of captopril was based on the oxidation of the thiol group in the molecule by Ce4 +. This reaction results in the emission of light (chemiluminescence), which can be measured. In this example the dye rhodamine G was used to enhance the emission of light by the reaction. The method developed was rapid and precise.4
Determination of non-steroidal anti-inflammatory drugs
Diclofenac sodium, famotidine and ketorolac were analysed utilising their formation of a coloured charge transfer complex with 2,4 dichloro-6-nitrophenol. The complexes were detected by UV/visible spectrophotometry at 450 nm. The method was not affected by the presence of common excipients in the formulations analysed. The precision and accuracy of the method was comparable to that of HPLC methods used to analyse the same samples.5
Determination of promethazine
The generation of a coloured product upon the oxidation of promethazine with Ce4 + was used in the development of an FIA method. Promethazine in tablet form could be analysed by this method with a precision of ± 1% and at a rate of 122 samples per h.6 In a similar method, promazine was oxidised by passing through a short column containing MnO2 and then the oxidation product was measured.7
Determination of chlorocresol
Chlorocresol is a preservative commonly used in injections and its determination often involves the use of laborious extraction procedures in order to separate it from formulation components, followed by spectrophotometric measurement. An FIA method for chlorocresol was developed by utilising its reaction with nitrous acid to form a coloured nitro compound. The method was accurate to 99.5% of the true value of chlorocresol in a formulation and a precision of ± 1% was achieved.8
Limit test for heavy metals
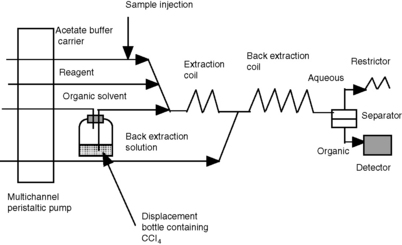
Many pharmacopoeial monographs contain a limit test for heavy metals. Sometimes the metal is specified, e.g. lead, but often the test is more general. Pharmacopoeial tests often involve precipitation of the metals as their sulphides. An FIA method was developed based upon complex formation between heavy metals and diethyldithiocarbamate (DDC). Figure 3.25 shows the FIA system used for this analysis and illustrates how relatively simple components can be assembled to carry out a complex analytical task. The analysis was achieved by using a segmented flow system where alternate segments of buffer solution + reagent and carbon tetrachloride were produced. In the first extraction coil, the heavy metals in the sample are extracted as their complexes, along with some excess complexing agent, into carbon tetrachloride. In the second extraction coil, the excess reagent in the organic layer is back extracted by the borax solution, which is mixed into the carrier stream. The flow was then passed into a phase separator, which only allowed the organic solvent to flow through to the detector.9
Use of segmented flow in determination of partition coefficients
A system similar to the one described above was used for determination of partition coefficients. An FIA system with segmented flow was devised so that the partitioning of a drug between aqueous buffer and chloroform could be measured. The aqueous and organic phases were separated using a phase separator. The system could be set up to measure the concentration of the drug in either the organic or the aqueous phase. Such a system enables rapid repeat determinations of partition coefficient at various pH values with minimal sample consumption.10
Automated dissolution testing
FIA was used to optimise sampling from a tablet dissolution apparatus in order to determine the rate of release of iron (II) from a sustained release formulation. The dissolution medium was automatically sampled at 30-minute intervals and the 100 μl aliquots of medium were mixed with the iron-complexing agent ferrozine, diluted and then passed into a spectrophotometric detector. The system was microprocessor controlled, thus enabling unattended sampling of the dissolution medium for a prolonged period.11
1. 0.4681 g of the acidic (monobasic) drug ibuprofen (molecular weight 206.3) is dissolved in 50 ml of methanol and 0.4 ml of phenolphthalein solution is added. The sample is titrated with 0.1005 M sodium hydroxide until a pink colour is obtained. A blank titration is carried out.
Results
Results
Calculate the % purity of the phenylephrine HCl.
3. 4.079 g of glutaraldehyde (molecular weight 100.1) solution (weight per ml 1.132 g) was mixed with 100 ml of a 7% w/v solution of hydroxylamine hydrochloride solution and allowed to stand for 30 minutes. The solution was titrated with 1.004 M sodium hydroxide using bromothymol blue as an indicator. The equation for the reaction with hydroxylamine is given below.
Calculate the % w/w and the % w/v of glutaraldehyde in the solution.
4. 2.054 g of macrogol monostearate (average molecular weight 706.5) was added to a 200 ml flask and 25 ml of an ethanolic solution of potassium hydroxide (molecular weight 56.1, ca 0.5 M) was added. The sample was heated under a reflux condenser for 1 hour. The excess of alkali was then titrated with 0.5016 M hydrochloric acid using phenolphthalein solution as an indicator. The operation was repeated without the macrogol monostearate.
Results
Calculate the saponification value for the macrogol stearate. How would the value of n given in the formula below affect the saponification value?
5. 1.507 g of macrogol lauryl ether was placed in a 150 ml acetylation flask fitted with an air condenser and 5 ml of acetic anhydride in pyridine (1:3) solution was added. The sample was heated for 1 hour in a water bath, then removed and 5 ml of water was added through the top of the condenser. The flask was shaken and replaced in the water bath for 10 minutes, removed and allowed to cool. The sample was titrated with 0.5034 M ethanolic potassium hydroxide (molecular weight 56.1) using phenolphthalein as an indicator. The process was repeated without addition of the macrogol.
Results
Calculate the hydroxyl value of the macrogol.
6. 20 tablets containing the dibasic drug ethambutol hydrochloride (molecular weight 277.2) were powdered. 0.3354 g of tablet powder was dissolved in 10 ml of 2 M sodium hydroxide and was extracted with 5 × 25 ml quantities of chloroform. The combined extracts were evaporated and the residue was dissolved in 100 ml of anhydrous acetic acid. Nonaqueous titration was carried out using 1-naphtholbenzein solution as indicator and 0.1014 M acetous perchloric acid.
Results
Calculate the % of stated content in the tablets.
7. 20 tablets containing the monobasic drug phenytoin sodium (molecular weight 274.3) were powdered and 0.5541 g of tablet powder was extracted with 40 ml of 0.01 M sodium hydroxide and made up to a final volume of 50 ml with 0.01 M sodium hydroxide. The sample was centrifuged and 25 ml of the sample was acidified and then extracted into ether. The extract was evaporated and the residue was dissolved in 50 ml of anhydrous pyridine and titrated with 0.1024 M tetrabutylammonium hydroxide using thymol blue as indicator.
Results
Calculate the % of stated content.
8. 10 ml of ascorbic acid (molecular weight 176.1) injection was transferred to a 100 ml volumetric flask and made up to volume with deionised water. 20 ml of the diluted injection was transferred to a conical flask and titrated with ca 0.05 M iodine solution using starch mucilage as indicator. The iodine solution was standardised against a solution of sodium thiosulphate primary standard (molecular weight 248.2).
Results
Weight of sodium thiosulphate used to prepare 100 ml primary standard solution = 2.501 g
Volume of thiosulphate solution required to titrate 25 ml of iodine solution = 24.83 ml
Volume of iodine solution required to titrate 20 ml of the diluted ascorbic acid injection = 21.55 ml
Calculate the % of stated content in the injection.
The equations for the reactions are given on p. 74.
9. A limit test was carried out for reducing substances on polyethylene-vinyl acetate for use in packaging materials. 25.27 g of the polymer beads were boiled in 500 ml of water for injections for 5 h. The solution was filtered and 1 ml of dilute sulphuric acid was added to 20 ml of the solution followed by 20 ml of approximately 0.002 M potassium permanganate and the solution was refluxed for 3 minutes. 1 g of potassium iodide was added and the sample was titrated immediately with 0.01046 M sodium thiosulphate, using starch solution as indicator. A blank titration was carried out using 20 ml of water in place of the extract from the polymer. To pass the limit test, the difference between the titration volumes should not be more than 0.5 ml. The equation for reaction of iodide with potassium permanganate is as follows:
1. Beckett A.H., Stenlake J.B. Practical Pharmaceutical Chemistry Part One, 4th ed. London: Athlone Press; 1988.
2. Skoog D.A., West D.M. Fundamentals of Analytical Chemistry, 4th ed. Philadelphia: Sanders College Publishing; 1986.
3. Pérez-Ruiz T., Martinez-Lozano C., Tomás V., Carpene J. Fluorimetric determination of chloroxine using manual and flow-injection methods. J Pharm Biomed Anal. 1996;14:1505–1511.
4. Zhang Z.D., Baeyens W.R.G., Zhang X.R., Vander Weken G. Chemiluminescence flow-injection analysis of captopril applying a sensitized rhodamine 6G method. J Pharm Biomed Anal. 1996;14:939–945.
5. Kamath B.V., Shivram K., Shah A.C. Determination of diclofenac sodium, famotidine and ketorolac tromethamine by flow injection analysis using dichloronitrophenol. J Pharm Biomed Anal. 1994;12:343–346.
6. Calatayud J.M., Sancho T.G. Spectrophotometric determination of promethazine by flow injection analysis and oxidation by CeIV. J Pharm Biomed Anal. 1992;10:37–42.
7. Kojlo A., Puzanowska-Tarasiewicz H., Calatatud J.M. Analytical application of the binary and ternary complexes of 2,10-disubstituted phenothiazines. J Pharm Biomed Anal. 1992;10:785–788.
8. Bloomfield M.N., Prebble K.A. The determination of the preservative, chlorocresol, in a pharmaceutical formulation by flow injection analysis. J Pharm Biomed Anal. 1992;10:775–778.
9. Danielsson L.-G., Huazhang Z. FIA-extraction applied to the limit test for heavy metals. J Pharm Biomed Anal. 1989;7:937–945.
10. Danielsson L.-G., Nord L., Yu-Hui Z. Rapid determination of conditional partition constants in an FIA system. J Pharm Biomed Anal. 1992;10:405–412.
11. Georgiou C.A., Valsami G.N., Macheras P.E., Koupparis M.A. Automated flow-injection technique for use in dissolution studies of sustained-release formulations: Application to iron(II) formulations. J Pharm Biomed Anal. 1994;12:635–641.
Felix F.S., Angnes L. Fast and accurate analysis of drugs using amperometry associated with flow injection analysis. J Pharm Sci. 2010;99:4784–4804.
Lara F.J., Garcia-Campana A.M., Aaron J.J. Analytical applications of photoinduced chemiluminescence in flow systems – A review. Anal Chim Acta. 2010;679:17–30.
Mach H., Bhambhani A., Meyer B.K., Burek S., Davis H., Blue J.T., et al. The use of flow cytometry for the detection of subvisible particles in therapeutic protein formulations. J Pharm Sci. 2011;100:1671–1678.
