Chapter 12 Ultrasound safety
INTRODUCTION
There has been a considerable and rapid growth in the use of ultrasound as a diagnostic imaging tool over the past 50 years since it was first used to image the unborn fetus. This rapid growth has resulted in millions of people worldwide being scanned every year. Changes and advances in technology are leading to increasing power levels being used to obtain diagnostic information. The interaction of ultrasound with biological tissue can result in effects which may cause heating, interfere with the normal functioning of cells, and cause structural damage. The potential damaging nature of ultrasound leads to concern over its safety. All operators therefore need to have an understanding of the safety implications in order to practice safely.
WHY ARE WE INTERESTED?
Ultrasound is a mechanical form of energy which interacts with the biological tissue through which it travels. Millions of women have their pregnancy routinely scanned with ultrasound and any adverse effects are more likely to damage the rapidly developing cells found in embryo, fetus, and neonate.
New research is continually being carried out, but variable parameters of ultrasound exposure and mechanisms of interaction with tissue lead to problems in determining when safe levels are being breached.
Important Parameters
Amplitude, power, and intensity are parameters used to describe the strength of an ultrasound beam.
Amplitude
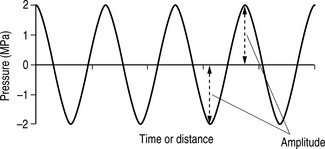
Amplitude is a measure of a wave’s magnitude of oscillation, that is, the magnitude of the maximum disturbance in the medium, and in ultrasound often refers to the maximum variation (see Fig. 12.1). Amplitude is measured in units of pressure: MPa (megapascals).
Power (P)
Power in ultrasound describes the rate at which energy is generated and transferred by the acoustic wave per unit of time. Power is measured in watts (W) and milliwatts (mW), one milliwatt being one thousandth of a watt. Power is proportional to the square of the amplitude, i.e. if the power is doubled then the amplitude is quadrupled.
Intensity (I)
Intensity is the rate at which energy passes through the unit area and is an important quantity when discussing bioeffects and safety.
The average intensity is equal to the power of an ultrasound beam, normally expressed in mW, divided by the cross-sectional area of the beam, expressed in cm2. Units of intensity for diagnostic ultrasound are typically expressed in mWcm−2.
From the equation in Figure 12.2 we can identify that the intensity of an ultrasound beam is directly proportional to its power, i.e. if beam power increases, then intensity increases and, conversely, if beam power decreases, the intensity decreases.
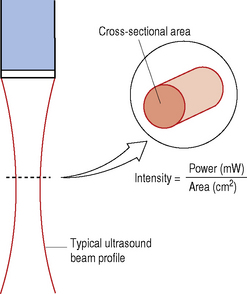
Fig. 12.2 Diagram showing a typical ultrasound beam profile and a cross-sectional area. Cross-sectional area varies with depth and is smallest at the focus where the intensity is the highest
In addition, we can see that intensity is also inversely proportional to the beam area, i.e. if the beam area decreases, then the beam intensity increases and, conversely, if the beam area increases, the beam intensity decreases.
The maximum intensity along an ultrasound beam lies at the focus (the narrowest part of the beam)where all the power is concentrated into a small cross-sectional area.
The intensity within an ultrasound beam also varies from point to point across the beam (spatial considerations), as demonstrated in Figure 12.3. Two values of intensity can de defined:
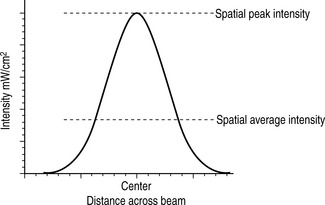
Fig. 12.3 Demonstrating the variation of intensity across an ultrasound beam. The spatial intensity across the beam is at its highest at the center, tailing off towards the edges
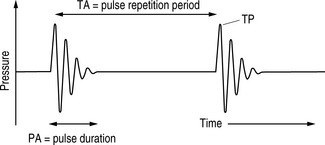
Because of the pulsed nature of ultrasound, the intensity of the ultrasound beam also varies over time (temporal considerations). Figure 12.4 shows the relevant times for three intensities:
These spatial and temporal variations within the ultrasound beam result in the fact that there are a number of ways of defining intensity, as detailed below:
| Highest intensity |
 |
ISPTP – Spatial peak-temporal peak (SPTP) |
| ISATP – Spatial average-temporal peak (SATP) | ||
| ISPPA – Spatial peak-pulse average (SPPA) | ||
| ISAPA – Spatial average-pulse average (SAPA) | ||
| ISPTA – Spatial peak-temporal average (SPTA) | ||
| Lowest intensity | ISATA – Spatial average-temporal average (SATA) |
ISPTA is the measure most associated with temperature rises.
OPERATING MODES AND THEIR POTENTIAL RISK
For any operating mode there is a large variation of output powers and intensities. The output data for all modern day ultrasound machines can be sourced from the operator’s manual.
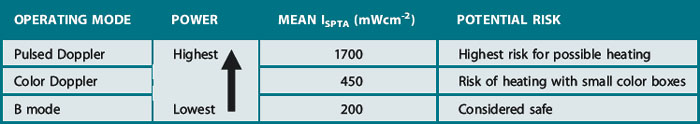
Exposures used in Doppler modes such as spectral pulsed Doppler and color flow imaging are higher than for B and M modes.
B modes
Uses the lowest output power and intensities and is generally considered safe in all applications.
Pulsed Doppler
The longer pulses, higher powers, and pulse repetition rates typically used in pulsed Doppler result in higher average intensities compared to B-mode imaging and therefore there is an increased potential of producing a biological effect, particularly from ultrasound-induced heating.
Dwell time, i.e. the length of time that the ultrasound beam is fixed on a specific tissue area, is an important factor when considering the potential for heating. This is particularly relevant for spectral pulsed Doppler where the beam is held in a fixed position during an investigation; this leads to a further increase in temporal average intensity and therefore increased risk of causing a temperature rise.
Color Flow Mapping and Power Doppler Imaging Modes
These modes involve some beam scanning, and so generally have a heating potential that is somewhere between that of B-mode and that of spectral pulsed Doppler.
Table 12.1 summarizes data collected from a survey conducted by Henderson in 1997. Here you can see that the highest intensities are produced when using pulsed Doppler modes.
Table 12.1 Values of the UK survey of equipment in clinical use (from Henderson et al 1997).
WHO REGULATES ULTRASOUND ACOUSTIC OUTPUT LIMITS?
Surprisingly enough, these are not regulated by a medical body. Regulations governing the output of diagnostic ultrasound have been largely set by the USA’s Food and Drug Administration (FDA). In 1991 the FDA relaxed its regulations and increased the permissible acoustic output and intensity levels used to scan early pregnancy to almost eight times over the level that had been previously allowed (from 94 to 720 mWcm−2). Table 12.2 shows these changes in acoustic output levels in relation to the range of diagnostic areas.
Table 12.2 Shows the changes to maximum allowable output exposure following the changes stipulated by the US FDA. ODS; output display standards.
| APPLICATION | BEFORE 1991 (PRE ODS) INTENSITY LIMIT (ISPTA) (mWcm−2) | AFTER 1991 WITH ODS INTENSITY LIMIT (ISPTA) (mWcm−2) |
|---|---|---|
| Fetal, neonatal imaging | 94 | 720 |
| Cardiac | 430 | 720 |
| Peripheral vascular | 720 | 720 |
| Ophthalmology | 17 | 50 |
However, for the manufacturers to utilize these increased output levels and higher intensities, it was agreed that their equipment should provide an on-screen display relating to the acoustic output. Its purpose is to inform the user of the potential risk for an examination to produce a biological effect. This shifted the onus of safety to the end user who is now responsible for making a risk/benefit assessment. This requires the ultrasound user to understand the potential for biological effects and practice to ensure exposure times are kept to a minimum.
OUTPUT DISPLAY STANDARDS
In 1992, the American Institute of Ultrasound in Medicine (AIUM) and the National Electrical Manufacturers Association (NEMA) defined a set of output display standards (ODS). For each ultrasound examination, a real-time on-screen display indicates the risk of producing biological effects. ODS is based on two indices which give two main measures of output:
This enables users to be aware of output levels during scanning.
These increases in output levels have also driven some of the improvements and developments in diagnostic ultrasound that we mentioned earlier, to the extent that modern ultrasound equipment is capable of producing measurable biological effects in tissues (Barnett 1998, Barnett & Kossoff 1992).
BIOLOGICAL EFFECTS OF ULTRASOUND
Physical Mechanisms
Clinically we know ultrasound energy can be utilized in lithotripsy by using a focused, high-intensity acoustic pulse to destroy a kidney stone. These devices use energies much higher than those utilized in diagnostic ultrasound, however it can be easily demonstrated that there is potential for destruction.
There are two distinct mechanisms that can cause biological effects on tissue when exposed to ultrasound. These are:
Thermal effects
As the ultrasound beam travels through tissue, some of its energy is lost through absorption. This absorbed energy is converted into heat which in turn produces a temperature rise. In most soft tissues, the rate at which energy is absorbed depends on the:
The thermal effect is highest in tissues with a high absorption coefficient such as bone, and is low where there is little absorption such as amniotic fluid (water).
The potential of any temperature rise also depends on the thermal characteristics of the tissue to dissipate this heat to surrounding areas, the ultrasound intensity, and the length of time for which the tissue volume is scanned.
Frequency is another factor and the higher the operating frequency, the higher the absorption and potential to cause heat. This is particularly significant when using endocavity probes which use higher frequencies to improve image quality.
The ultrasound intensity varies along the ultrasound beam and is greatest at the focus where the beam is at its narrowest. The intensity can be changed by other operator controls such as power output, scan depth, and mode of operation, i.e. using color and Doppler modes.
Heat can also be produced at the transducer surface which can be directly transferred to the tissue it is in contact with. This can be particularly significant when using transvaginal probes to investigate a pregnancy during the first eight weeks postconception.
The World Federation for Ultrasound in Medicine and Biology (WFUMB; Barnett 1998), following a review of the literature on the effects of temperature elevation on animal fetuses, concluded that a temperature rise of no more than 1.5 °C may be used clinically without reservation, however, exposures that elevate embryonic and fetal temperatures higher than 4 °C for 5 minutes or more should be considered as potentially hazardous.
Thermal index (TI)
The thermal index (TI) as defined by AIUM/NEMA is the ratio of the acoustic power produced by the transducer (W) to the power required to raise the temperature in tissue by 1 °C (Wdeg). This is mathematically expressed in Equation 1:

Equation 1: Formula for thermal index.
(Derated values compensate for attenuation by soft tissue. Acoustic output measurements are usually performed in a water tank. To take into account the attenuation by soft tissue in practice, these values are adjusted, i.e. ‘derated’, using a value of attenuation of 0.3 dB/cm/MHz.)
A thermal index of 1 indicates the acoustic power achieving a temperature increase of 1 °C. A thermal index of 2 has doubled power but would not necessarily indicate a peak temperature rise of 2 °C. The algorithms in the machine which calculate TI are based on many assumptions and take into account a worst case scenario such as low levels of beam attenuation, a stationary beam, and fairly long exposure times.
There are several classifications of thermal indices:
Cavitation effects
Ultrasound produces an oscillating pressure wave which propagates through tissues. This propagating pressure wave can cause micro-bubbles within tissues to form, grow, oscillate in size and, at sufficiently high intensities and pressure, cause these bubbles to collapse. Small laboratory mammalian experiments have demonstrated this effect in lung and intestine, where small gas bubbles can be present. The most important sources of cavitation are those introduced during contrast studies.
Above diagnostic output levels, cavitation plays an important role in the destruction of kidney stones in shock wave lithotripsy.
There are two forms of cavitation:
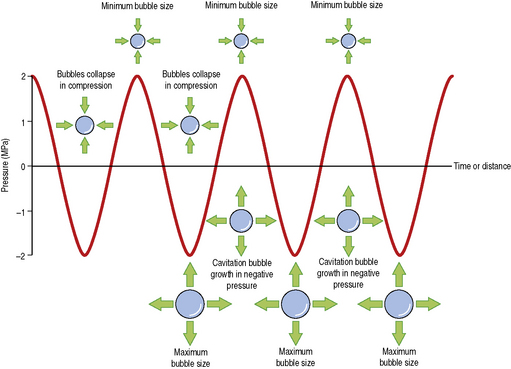
Stable cavitation (non-inertial)
This form of cavitation is the process where small micro-bubbles in a medium are forced to oscillate in the presence of the ultrasound. The cavitation bubbles go through phases of expansion and contraction as they oscillate with the varying ultrasound pressure wave. Generally, this form of stable avitation is regarded as being safe. Figure 12.5 graphically demonstrates the phases of bubble compression and contraction through the varying ultrasound pressure wave.
Unstable cavitation (transient or inertial)
This type of cavitation has the greatest potential to damage tissue. Here, the intensity of the ultrasound field is high enough to cause the oscillations of the micro-bubbles to become so great that the bubbles collapse, generating high pressures and temperatures to the localized area, increasing the potential to cause biological damage. This effect has been demonstrated in small mammalian animal experiments causing lung capillary bleeding at pressure thresholds of 1 MPa which is well within the diagnostic range. Although this process has been reported in mammalian experiments, it has not been observed in humans. However, knowledge that there is a potential risk and hazard for biological damage due to this form of destructive cavitation is especially pertinent in early pregnancy where the tissues are more susceptible to this form of damage.
The use of contrast agents in the form of stabilized gas bubbles increases the probability of cavitation.
Mechanical index (MI)
The mechanical index (MI) is related to the likelihood of cavitation being produced and is defined as the peak rarefactional pressure (Pr) (negative pressure) divided by the square root of the ultrasound frequency:
Equation 2: Formula for calculating mechanical index.
The value of Pr (negative pressure) is significant here and from Equation 2 we can see that the value of MI is directly proportional to Pr. This means if Pr doubles then MI doubles and, conversely, if Pr is halved then MI is halved. Also we can see that frequency is inversely related to MI which means as frequency increases the value of MI actually decreases.
The FDA ultrasound regulations allow a mechanical index of up to 1.9 to be used for all applications except ophthalmic (maximum 0.23). The used range varies from 0.05 to 1.9.
It is stipulated that the values of the TI and MI must be displayed if the ultrasound system is capable of exceeding an index of 1.
The TI and MI are not absolute values but represent a rough approximation of the risk of creating certain biological effects. The higher the index value, the higher the potential of a biological effect.
PRUDENT USE – THE ALARA PRINCIPLE
Changes in power output and increased use of Doppler ultrasound, together with a change in regulations governing output, mean that the onus of safety is placed on the operator. As a consequence, every measure should be taken to ensure safe practice.
All ultrasound users should regularly check both thermal and mechanical indices while scanning and should adjust the machine controls to keep them as low as reasonably possible without compromising the diagnostic value of the examination. Where low values cannot be achieved, examination times should be kept as short as possible.
The ALARA (‘As Low As Reasonably Achievable’) principle should be applied and maintained. Minimize any possible risks by minimizing exposure times and exposure intensity.
GENERAL GUIDELINES
There are many safety guidelines issued by several national and international ultrasound societies and organizations to assist all those who use diagnostic ultrasound so that they are able to make informed decisions about ultrasound safety. These guidelines are based on the best scientific information available at the time.
A list of these organizations is presented in Table 12.3 and further information can be accessed through their Web sites.
Table 12.3 List of ultrasound organizations and societies which offer safety guidelines
| ORGANIZATION/SOCIETY | WEB SITE |
|---|---|
| World Federation For Ultrasound in Medicine and Biology (WFUMB) | http://www.wfumb.org |
| European Federation of Societies for Ultrasound in Medicine and Biology (EFSUMB) | http://www.efsumb.org |
| British Medical Ultrasound Society (BMUS) | http://www.bmus.org |
| American Institute of Ultrasound in Medicine (AIUM) | http://www.aium.org |
| Australasian Society for Ultrasound in Medicine | http://www.asum.com.au |
MACHINE CONTROLS WHICH INFLUENCE HAZARD
The exposure intensity and therefore any possible associated temperature rise are affected by many operator-dependent controls. The operator should understand the influence of the machine controls
Initial Power Setting/Output
Ultrasound machines are normally set up for all application-specific settings. This sets a default acoustic output which should be adequate to perform each examination. Application presets for obstetrics should default the machine’s output to a low setting. The operator should only increase the output power setting if it is necessary and required to improve image quality.
Mode of Operation
B mode generally has the lowest power output and intensity. M mode, color flow imaging, and spectral Doppler have higher outputs which can cause more heating at the site of examination. Examinations should use B mode in the first instance and employ the use of color and spectral Doppler only when and if required.
Exposure Time
The overall examination should be kept as short as possible to obtain the required level of diagnostic information.
Stationary Probe
The probe should not be held in any fixed position for any longer than necessary. Operators should keep the transducer moving so that specific tissues are not subjected to long periods of stationary beam exposure. Use freeze frame and cineloop which allow images to be reviewed without continuing exposure.
Other Machine Controls
The intensity (and temperature rise) is highly dependent on other scanner settings such as:
The operator should be aware of and monitor changes to the values of TI and MI in response to changes in machine control settings and transducer combinations.
Table 12.4 summarizes the recommended guidelines issued by the British Medical Ultrasound Society (BMUS) in 2000 for thermal and mechanical indices. Full details of this can be accessed on their Web site.
Table 12.4 Recommended guidelines for values of MI and TI issued by BMUS
| BIOLOGICAL EFFECT | ACTION BY OPERATOR | |
|---|---|---|
| MI > 0.3 | Possibility of minor damage to neonatal lung or intestines | Reduce exposure times as much as possible |
| MI > 0.7 | Reduce exposure times as much as possible | |
| TI > 0.7 | Increased risk of heating | Overall exposure time of an embryo or fetus should be restricted |
| TI > 1 | Increased risk of heating | |
| TI > 3 | Significant risk of heating | Scanning of an embryo or fetus not recommended |
EPIDEMIOLOGICAL EVIDENCE
Epidemiology is the study of how often diseases occur in different groups of people and why. A key feature of epidemiology is the measurement of disease outcomes in relation to a population at risk.
As a consequence of the rapid development of ultrasound as a diagnostic tool, the general population has been and is being exposed to more ultrasound energy than ever before. This is especially true for exposures of the fetus.
In the case of ultrasound, epidemiological studies have been used to search for risks associated with previous exposure to diagnostic ultrasound of fetuses (in utero) in early pregnancy as it is known that the developing human embryo or fetus is particularly sensitive to the ultrasound beam.
The outcomes of published epidemiology research evidence have suggested associations between ultrasound exposure and factors such as reduced birth weight, delayed speech development, dyslexia, and non-right handedness. However, some of this evidence has been conflicting and the reliability of these outcomes has since been questioned.
To date, diagnostic ultrasound has not been proved to be unsafe in humans. It is important to note that much of this research work was conducted before output levels were relaxed by the FDA in 1991 and that there is limited data for modern powerful diagnostic equipment using Doppler, harmonic imaging, and contrast agents. Ongoing research into bioeffects is necessary to reaffirm that ultrasound is still a safe modality.
Continuous vigilance is necessary, particularly in areas of concern such as the use of pulsed Doppler in the first trimester.
. Conclusions and recommendations on thermal and non thermal mechanisms for biological effects of ultrasound. Barnett SB, editor. WFUMB (World Federation for Ultrasound in Medicine and Biology) Symposium on Safety for Ultrasound in Medicine, 24. Ultrasound in Medicine and Biology. 1998:1-55.
Issues and recommendations regarding thermal mechanisms for biological effects of ultrasound. In: Barnett SB, Kossoff G, editors. WFUMB (World Federation for Ultrasound in Medicine and Biology) Symposium on Safety and Standardisation in Medical Ultrasound. Ultrasound in Medicine and Biology; 1992:18. special issue
British Medical Ultrasound Society (BMUS). Guidelines for the safe use of diagnostic ultrasound equipment. www.bmus.org/ultras-safety/us-safety03.asp. Online. Available:
Henderson J, Whittingham TA, Dunn T. A review of the acoustical output of modern diagnostic ultrasound equipment. BMUS Bulletin. 1997;5:10-14.