Digital Imaging
The advent of digital imaging has revolutionized radiology. This revolution is the result of both technologic innovation in image acquisition processes and the development of networked computing systems for image retrieval and transmission. Dentistry is seeing a steady increase in the use of these technologies, improvement of software interfaces, and introduction of new products. A number of forces are driving the shift from film to digital systems. The detrimental effects of inadequate film processing on diagnostic quality and the difficulty of maintaining high-quality chemical processing are well documented. Digital imaging eliminates chemical processing. Hazardous wastes in the form of processing chemicals and lead foil are eliminated with digital systems. Images can be electronically transferred to other health care providers without any alteration of the original image quality. In addition, digital intraoral receptors require less radiation than film, thus lowering patient exposure.
However, digital systems also have a number of disadvantages in comparison with film. The initial expense of setting up a digital imaging system is relatively high. Certain components such as the electronic x-ray receptor used in some intraoral systems are susceptible to rough handling and are costly to replace. Because digital systems use new or immature technologies, there is a risk—perhaps even a likelihood—of systems becoming obsolete or manufacturers going out of business. The excellent image quality and comparatively low cost of a properly exposed and processed film keeps film-based radiography competitive with digital alternatives.
The trends, however, are certain: computers play a role in the majority of dental practices, and that role is expanding as a variety of functions from appointment scheduling, procedure billing, and patient charting are integrated into seamless practice management software solutions. It is no longer a matter of if but rather when the majority of dental practices will use digital imaging. Already during this time of transition, film-based practices are confronted with digital images from practices that have implemented digital radiography. This chapter describes the characteristics of digital images, image receptors, display options, and storage devices, followed by a discussion of digital image processing.
Analog Versus Digital
The term digital in digital imaging refers to the numeric format of the image content and its discreteness. Conventional film images can be considered an analog medium in which differences in the size and distribution of black metallic silver result in a continuous density spectrum. Digital images are numeric and discrete in two ways: (1) in terms of the spatial distribution of the picture elements (pixels) and (2) in terms of the different shades of gray of each of the pixels. A digital image consists of a large collection of individual pixels organized in a matrix of rows and columns (Fig. 7-1). Each pixel has a row and column coordinate that uniquely identifies its location in the matrix. The formation of a digital image requires several steps, beginning with analog processes. At each pixel of an electronic detector, the absorption of x rays generates a small voltage. More x rays generate a higher voltage and vice versa. At each pixel, the voltage can fluctuate between a minimum and maximum value and is therefore an analog signal (Fig. 7-2, A).
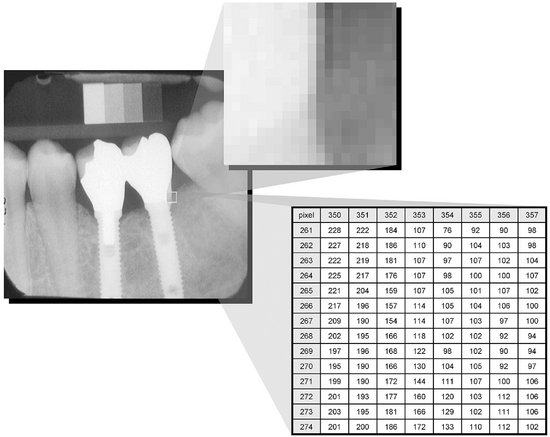
FIG. 7-1 The digital image is made up of a large number of discrete picture elements (pixels). Their size is so small that the image appears smooth at normal magnification. The location of each pixel is uniquely identified by a row and column coordinate within the image matrix. The value assigned to a pixel represents the intensity (gray level) of the image at that location.
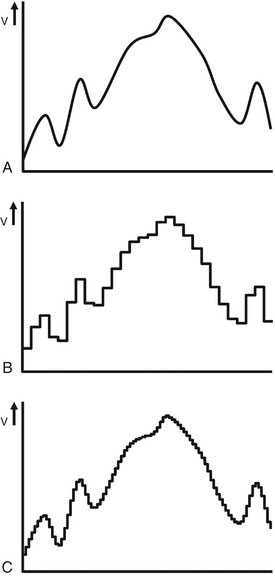
FIG. 7-2 A, Illustration of an analog voltage signal generated by a detector. B, Sampling of the analog signal discards part of the signal. C, Sampling at a higher frequency preserves more of the original signal.
Production of a digital image requires a process called analog-to-digital conversion (ADC). ADC consists of two steps: sampling and quantization. Sampling means that a small range of voltage values are grouped together as a single value (Fig. 7-2, B). Narrow sampling better mimics the original signal but leads to larger memory requirements for the resulting digital image (Fig. 7-2, C). Once sampled, the signal is quantized, which means that every sampled signal is assigned a value. These values are stored in the computer and represent the image. For the clinician to see the image, the computer organizes the pixels in their proper locations and displays a shade of gray that corresponds to the number that was assigned during the quantization step.
To understand the strengths and weaknesses of digital radiography, the clinician establishes which elements of the radiographic imaging chain stay the same and which ones change. The imaging chain can be conceptualized as a series of interconnecting links beginning with the generation of x rays. Exposure factors, patient factors, and the projection geometry determine how the x-ray beam will be attenuated. A portion of the unattenuated x-ray beam is captured by the image receptor to form a latent image. This latent image is then processed and converted into a real image, which is viewed and interpreted by the clinician. The use of digital detectors changes the way we acquire, store, retrieve, and display images. However, besides an adjustment of the exposure time, digital detectors do not fundamentally change the way in which x rays are selectively attenuated by the tissues of the patient. The physics of the interaction of x rays with matter and the effects of the projection geometry on the appearance of the radiographic image are unaltered and remain critically important for understanding image content and for optimizing image quality.
Digital Image Receptors
Digital image receptors encompass a number of different technologies and come in many different sizes and shapes. Unfortunately, a number of different and sometimes confusing names are in use to identify these receptors in medicine and dentistry. Currently, the most useful distinction is that between two main technologies: (1) solid-state technology and (2) photostimulable phosphor technology. Although solid-state detectors can be further subdivided, these detectors have in common certain physical properties and the ability to generate a digital image in the computer without any other external device. In medicine, the use of solid-state detectors is referred to as digital radiography. In dentistry, intraoral solid-state detectors are often called sensors. The other main technology, photostimulable phosphor (PSP), consists of a phosphor coated on top of a plate in which a latent image is formed after x-ray exposure. The latent image is converted to a digital image by a scanning device through stimulation by laser light. Some refer to this technology as storage phosphor on the basis of the notion that the image information is temporarily stored within the phosphor. Others use the term image plates to differentiate them from film and solid-state detectors. The use of PSP plates in medical radiology is referred to as computed radiography.
SOLID-STATE DETECTORS
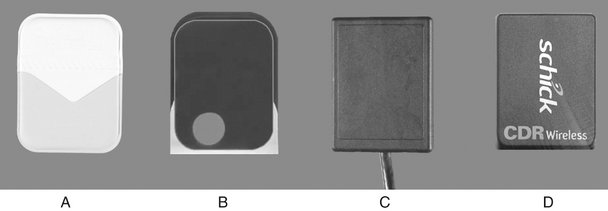
Solid-state detectors collect the charge generated by x rays in a solid semiconducting material. The key clinical feature of these detectors is the rapid availability of the image after exposure. The matrix and its associated readout and amplifying electronics of intraoral detectors are enclosed within a plastic housing to protect them from the oral environment. These elements of the detector consume part of the real estate of the sensor so that the active area of the sensor is smaller than its total surface area. Sensor bulk, although reduced by continued miniaturization of the electronic components, is a potential drawback of intraoral solid-state detectors. In addition, most detectors incorporate an electronic cable to transfer data to the computer. One manufacturer has produced a system that replaces the cable connection with a radiofrequency transmitter. This frees the detector from a direct tether to the computer, but it necessitates some additional electronic components, thus increasing the overall bulk of the sensor.
A number of manufacturers produce detectors with varying active sensor areas roughly corresponding to the different sizes of intraoral film. Detectors without flaws are relatively expensive to produce, and the expense of the detector increases with increasing matrix size (total number of pixels). Pixel size varies from 20 to 70 micrometers (μm). Three types of solid-state sensors are in common use.
Charge-Coupled Device
The charge-coupled device (CCD), introduced to dentistry in 1987, was the first digital image receptor to be adapted for intraoral imaging. The CCD uses a thin wafer of silicon as the basis for image recording. The silicon crystals are formed in a picture element (pixel) matrix (Fig. 7-3). When exposed to radiation, the covalent bonds between silicon atoms are broken, producing electron-hole pairs (Fig. 7-4). The number of electron-hole pairs that are formed is proportional to the amount of exposure that an area receives. The electrons are then attracted toward the most positive potential in the device, where they create “charge packets.” Each packet corresponds to one pixel. The charge pattern formed from the individual pixels in the matrix represents the latent image (Fig. 7-5). The image is read by transferring each row of pixel charges from one pixel to the next in a “bucket brigade” fashion. As a charge reaches the end of its row, it is transferred to a readout amplifier and transmitted as a voltage to the analog-to-digital converter located within or connected to the computer. Voltages from each pixel are sampled and assigned a numeric value representing a gray level (ADC). Because CCD detectors are more sensitive to light than to x rays, most manufacturers use a layer of scintillating material coated directly on the CCD surface or coupled to the surface by fiberoptics. This increases the x-ray absorption efficiency of the detector. Gadolinium oxybromide compounds similar to those used in rare earth radiographic screens or cesium iodide are examples of scintillators that have been used for this purpose.
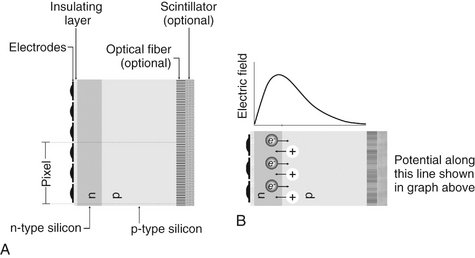
FIG. 7-3 A, Basic structure of the CCD: electrodes insulated from an n-p silicon sandwich. The surface of the silicon may incorporate a scintillating material to improve x-ray capture efficiency and fiberoptics to improve resolution. One pixel utilizes three electrodes. B, Excess electrons from the n-type layer diffuse into the p-type layer while excess holes in the p-type layer diffuse into the n-type layer. The resulting charge imbalance creates an electric field in the silicon with a maximum just inside the n-type layer.
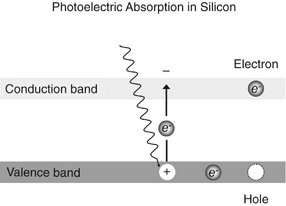
FIG. 7-4 X-ray or light photons impart energy to electrons in the valence band, releasing them into the conduction band. This generates an “electron-hole” charge pair.
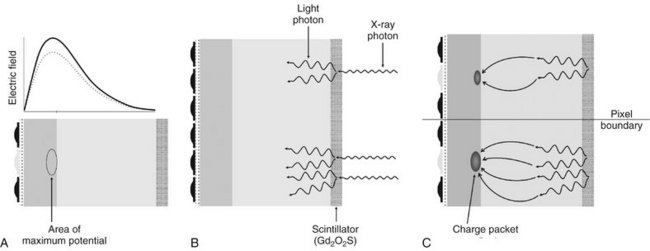
FIG. 7-5 A, Before exposure, the central electrode of each pixel is turned on, thus creating an area of maximum potential or potential well. B, X-ray photons are absorbed in the scintillating material and are converted to light photons. Light photons are absorbed in the silicon through photoelectric absorption. C, Electrons released from the valence band collect selectively near the n-p layer interface in the area of maximum potential to form a charge packet. During CCD readout, the electrical potential of the pixel electrodes are sequentially modulated to shift the charge packet from pixel to pixel.
CCDs have also been made in linear arrays of a few pixels wide and many pixels long for panoramic and cephalometric imaging. In the case of panoramic units, the CCD is fixed in position opposite to the x-ray source with the long axis of the array oriented parallel to the fan-shaped x-ray beam. Some manufacturers provide CCD sensors that may be retrofitted to older panoramic units. Unlike film imaging, the mechanics for cephalometric imaging are different. Construction of a single CCD of a size that could simultaneously capture the area of a full skull would be prohibitively expensive. Combining a linear CCD array and a slit-shaped x-ray beam with a scanning motion permits scanning of the skull over several seconds. One disadvantage of this approach is the increased possibility of patient movement artifacts during the several seconds required to complete a scan.
Complementary Metal Oxide Semiconductors
Complementary metal oxide semiconductor (CMOS) technology is the basis for typical consumer-grade video cameras. These detectors are also silicon-based semiconductors but are fundamentally different from CCDs in the way that pixel charges are read. Each pixel is isolated from its neighboring pixels and is directly connected to a transistor. Like the CCD, electron-hole pairs are generated within the pixel in proportion to the amount of x-ray energy that is absorbed. This charge is transferred to the transistor as a small voltage. The voltage in each transistor can be addressed separately, read by a frame grabber, and then stored and displayed as a digital gray value. CMOS technology is widely used in the construction of computer central processing unit chips and video camera detectors, and the technology is less expensive than that used in the manufacturing of CCDs. Several manufacturers are currently using this technology for intraoral imaging applications (Fig. 7-6).
Flat Panel Detectors
Flat panel detectors are being used for medical imaging but have also been used in several extraoral imaging devices. The detectors can provide relatively large matrix areas with pixel sizes less than 100 μm. This allows direct digital imaging of larger areas of the body, including the head. Two approaches have been taken in selecting x-ray–sensitive materials for flat panel detectors. Indirect detectors are sensitive to visible light, and an intensifying screen (gadolinium oxysulfide or cesium iodide) is used to convert x-ray energy into light. The performance of these devices is determined by the thickness of the intensifying screen. Thicker screens are more efficient but allow greater diffusion of light photons, leading to image unsharpness. Direct detectors use a photoconductor material (selenium) with properties similar to silicon and a higher atomic number, which permits more efficient absorption of x rays. Under the influence of an applied electrical field, the electrons that are freed during x-ray exposure of the selenium are conducted in a direct line to an underlying thin film transistor (TFT) detector element. Direct detectors using selenium (Z = 34) provide higher resolution but lower efficiency in comparison with indirect detectors using intensifying screens with gadolinium (Z = 64) or cesium (Z = 55). The electrical energy generated is proportional to the x-ray exposure and is stored at each pixel in a capacitor. The energy is released and read out by applying appropriate row and column voltages to a particular pixel’s transistor. Currently, flat panel detectors are expensive and likely to be limited to specialized imaging tasks such as cone beam imaging.
PHOTOSTIMULABLE PHOSPHOR
PSP plates absorb and store energy from x rays and then release this energy as light (phosphorescence) when stimulated by another light of an appropriate wavelength. To the extent that the stimulating light and phosphorescent light wavelengths differ, the two may be distinguished and the phosphorescence can be quantified as a measure of the amount of x-ray energy that the material has absorbed.
The PSP material used for radiographic imaging is “europium-doped” barium fluorohalide. Barium in combination with iodine, chlorine, or bromine forms a crystal lattice. The addition of europium (Eu+2) creates imperfections in this lattice. When exposed to a sufficiently energetic source of radiation, valence electrons in europium can absorb energy and move into the conduction band. These electrons migrate to nearby halogen vacancies (F-centers) in the fluorohalide lattice and may become trapped there in a metastable state. While in this state, the number of trapped electrons is proportional to x-ray exposure and represents a latent image. When stimulated by red light of around 600 nm, the barium fluorohalide releases trapped electrons to the conduction band. When an electron returns to the Eu+3 ion, energy is released in the green spectrum between 300 and 500 nm (Fig. 7-7). Fiberoptics conduct light from the PSP plate to a photomultiplier tube. The photomultiplier tube converts light into electrical energy. A red filter at the photomultiplier tube selectively removes the stimulating laser light, and the remaining green light is detected and converted to a varying voltage. The variations in voltage output from the photomultiplier tube correspond to variations in stimulated light intensity from the latent image. The voltage signal is quantified by an analog-to-digital converter and stored and displayed as a digital image. In practice, the barium fluorohalide material is combined with a polymer and spread in a thin layer on a base material to create a PSP. For intraoral radiography, a polyester base similar to radiographic film is used.
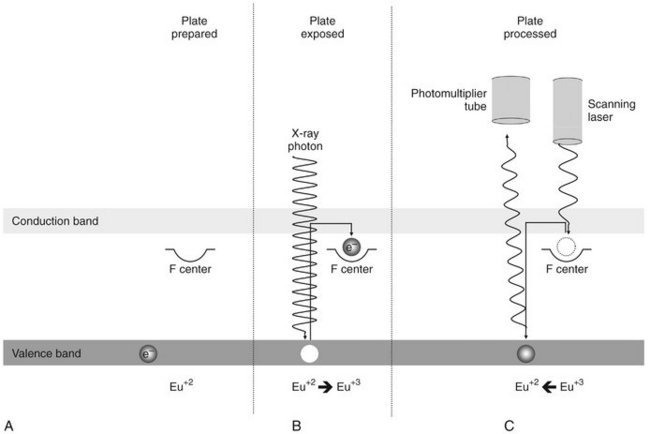
FIG. 7-7 PSP image formation. A, The PSP plate has been flooded with white light to return all electrons to the valence band. B, Exposure to x rays imparts energy to europium valence electrons, moving them into the conduction band. Some electrons become trapped at “F centers.” C, A red scanning laser imparts energy to electrons at the F centers, promoting them to the conduction band from which many return to the valence band. With the electron’s return to the valence band, energy is released in the form of light photons in the green spectrum. This light is detected by a photomultiplier tube or diode with a red filter to screen out the scanning laser light.
When they are manufactured in standard intraoral sizes, these plates provide handling characteristics similar to intraoral film. PSP plates are also made in sizes commonly used for panoramic and cephalometric imaging. Some PSP processors accommodate a full range of intraoral and extraoral plate sizes. Other processors are limited to intraoral or extraoral formats.
Before exposure, PSP plates must be erased to eliminate “ghost images” from prior exposures (note that this is a different type of ghost image than that associated with panoramic radiography). This is accomplished by flooding the plate with a bright light. Placing plates on a dental viewbox with the phosphor side of the plates facing the light for 1 or 2 minutes can accomplish this. More intense light sources can be used for shorter periods of time. Some PSP systems integrate automatic plate-erasing lights. Erased plates are placed in light-tight containers before exposure. In the case of intraoral plates, sealable polyvinyl envelopes that are impervious to oral fluids and light are used for packaging. For large-format plates, conventional cassettes (without intensifying screens) are used. After exposure, plates should be processed as soon as possible because trapped electrons spontaneously release over time. The rate of loss of electrons is greatest shortly after exposure. The rate varies depending on the composition of the storage phosphor and the environmental temperature. Some phosphors lose 23% of their trapped electrons after 30 minutes and 30% after an hour. Because loss of trapped electrons is fairly uniform across the plate surface, early loss of charge does not typically result in clinically meaningful image deterioration. However, underexposed images may suffer noticeable image degradation. Adequately exposed images may be stored for 12 to 24 hours and retain acceptable image quality. A more important source of latent image fading is exposure to ambient light during plate preparation for processing. A semidark environment is recommended for plate handling. The more intense the background light and the longer the exposure of the plate to this light, the greater is the loss of trapped electrons and the more degraded the resultant image. Red safelights found in most darkrooms are not safe for exposed PSP plates, which are most sensitive to the red light spectrum.
Stationary Plate Scans
A number of approaches have been adopted for “reading” the latent images on PSP plates. An approach used by Soredex in its Digora system and Air Techniques in its ScanX system uses a rapidly rotating multifaceted mirror that reflects a beam of red laser light. As the mirror revolves, the laser light sweeps across the plate. The plate is advanced and the adjacent line of phosphor is scanned. The direction of the laser scanning the plate is termed the fast scan direction. The direction of plate advancement is termed the slow scan direction.
Both companies have also introduced image erasing into the scanner. This improves work flow and reduces potential plate damage from manual erasing. Furthermore, the mechanism used for plate intake in the Soredex Optime scanner requires a metal disk on the back of the plate. This disk also serves as a marker to indicate when a plate was exposed backward.
Rotating Plate Scans
An alternate approach to plate reading used by Gendex in the DenOptix system and by Kodak in the CR 7400 system involves a rapidly rotating drum that holds the plate. The rotation of the drum past a fixed laser provides a rapid scan. Incremental movement of the laser in the slow scan direction allows image data to be acquired line by line.
Digital Detector Characteristics
Contrast resolution is the ability to distinguish different densities in the radiographic image. This is a function of the interaction of the following:
• Attenuation characteristics of the tissues imaged
• Capacity of the image receptor to distinguish differences in numbers of x-ray photons coming from different areas of the subject
• Ability of the computer display to portray differences in density
Current digital detectors capture data at 8, 10, 12, or 16 bits. The bit depth is a power of 2 (Fig. 7-8). This means that the detector can theoretically capture 256 (28) to 65,536 (216) different densities. In practice the actual number of meaningful densities that can be captured is limited by inaccuracies in image acquisition, that is, noise. Regardless of the number of density differences that a detector can capture, conventional computer monitors are capable of displaying a gray scale of only 8 bits. Because operating systems such as Windows reserve a number of gray levels for the display of system information, the actual number of gray levels that can be displayed on a monitor is 242. A more important limiting factor is the human visual system, which is capable of distinguishing only about 60 gray levels at any time under ideal viewing conditions. Considering the typical viewing environment in the dental operatory, the actual number of gray levels that can be distinguished falls to less than 30. Human visual limitations are also present for film viewing; however, the luminance (brightness) of a typical radiograph view box is much greater than that of a typical computer display. Therefore the ambient lighting of the room in which the image is viewed will theoretically have a lower impact on film than on digital displays.

FIG. 7-8 Contrast resolution. Examples of gray-scale ramps representing distinct gray levels from black to white. Bit depth controls the number of possible gray levels in the image. The actual number of distinct gray levels that are displayed is dependent on the output device and image processing. The perceived number of gray levels is influenced by viewing conditions and the visual acuity of the observer. A, 6 bits/pixel—64 gray levels. B, 5 bits/pixel—32 gray levels. C, 4 bits/pixel—16 gray levels. D, 3 bits/pixel—8 gray levels.
SPATIAL RESOLUTION
Spatial resolution is the capacity for distinguishing fine detail in an image. Resolution is often measured and reported in units of line-pairs per millimeter. Test objects consisting of sets of very fine radiopaque lines separated from each other by spaces equal to the width of a line are constructed with a variety of line widths (Fig. 7-9). A line and its associated space are called a line pair (lp). At least two pixels are required to resolve a line pair, one for the dark line and one for the light space. Typical observers are able to distinguish about 6 lp/mm without benefit of magnification. Intraoral film is capable of providing more than 20 lp/mm of resolution. Unless a film image is magnified, the observer is unable to appreciate the extent of the detail in the image.
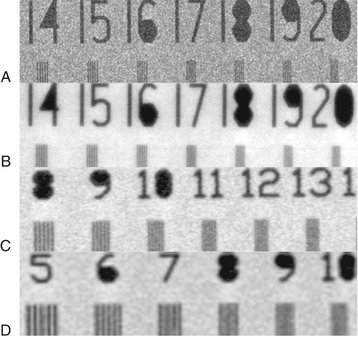
FIG. 7-9 Images of a line-pair resolution test phantom made with various receptors. A, Kodak InSight film. B, Trophy RVGui high-resolution CCD. C, Gendex DenOptix PSP scanned at 600 DPI. D, Gendex DenOptix PSP scanned at 300 DPI.
With solid-state digital imaging systems the theoretic resolution limit is determined by pixel size: the smaller the size of the pixel, the higher the resolution. With 20-μm pixels, a theoretical resolution of 25 lp/mm can be obtained. In practice, however, actual resolution is usually lower because of a variety of sources of electronic noise, diffusion of photons in the scintillator coating, as well as potentially imperfect optical coupling in systems using fiber optics. Currently the highest resolution intraoral CCD for dentistry has a pixel size of approximately 20 μm. This compares with a silver grain size of 8 μm for intraoral film.
Resolution in PSP systems is influenced by the thickness of the phosphor material. Thicker phosphor layers cause more diffusion and yield a lower resolution. On the other hand, a thicker layer enhances x-ray absorption efficiency, resulting in a faster image receptor. Resolution is also inversely proportional to the diameter of the laser beam. Effective beam diameter is increased by vibration in the rotating mirror and drum scanner designs. Slow scan motion influences resolution by the increment of plate advancement. This increment may be adjusted to increase or reduce resolution in some systems. Current PSP systems are capable of providing more than 7 lp/mm of resolution.
Software displays of all digital images permit magnification of images. A periapical image filling the display of a computer monitor may be magnified by a factor of 10 times or more. At this level of magnification, the image takes on a building block pattern or pixelated appearance and the limits of resolution of the imaging system are evident.
DETECTOR LATITUDE
The ability of an image receptor to capture a range of x-ray exposures is termed latitude. A desirable quality in intraoral image receptors is the ability to record a broad range of tissue densities, from gingiva to enamel. At the same time, subtle differences in density within these tissues should be visually apparent. The useful range of densities in film radiography is two orders of magnitude, from 0.5 to 2.5. The dynamic range of film actually extends for more than four orders of magnitude, but densities of 3 and 4, which transmit only 1/1,000th to 1/10,000th of the incident light, require intensified illumination or hot lighting to be distinguished from a density of 2.5. Such devices are not commonly used in general practice. The latitude of CCD and CMOS detectors is similar to that of film and can be extended with digital enhancement of contrast and brightness. PSP receptors enjoy larger latitudes and have a linear response to five orders of magnitude of x-ray exposure (Fig. 7-10).
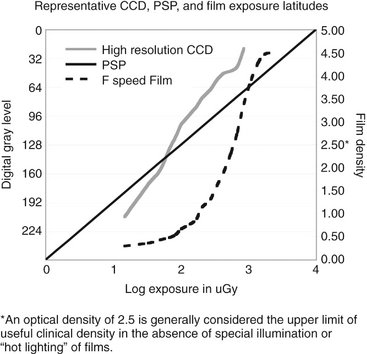
FIG. 7-10 Representative exposure latitudes of CCD, PSP, and intraoral film sensors. Note that the clinically useful optical density of film has an upper limit of 2.5. Use of a more intense viewbox or “hot lighting” can extend the upper end of the usable density range and expand useful film latitude.
DETECTOR SENSITIVITY
The sensitivity, or speed, of a detector is its ability to respond to small amounts of radiation. Intraoral film speed is classified according to speed group by criteria developed by the International Organization for Standardization. Extraoral screen-film combinations use a classification system developed by Eastman Kodak. Currently there are no classification standards for dental digital x-ray receptors. As a result, the reported sensitivity of systems by equipment manufacturers may exaggerate the performance that can actually be achieved in routine practice. The useful sensitivity of digital receptors is affected by a number of factors including detector efficiency, pixel size, and system noise. Current PSP systems for intraoral imaging allow dose reductions of about 50% in comparison with F-speed film with similar diagnostic performance. Subjectively, most observers prefer intraoral PSP images with a higher level of x-ray exposure. Paradoxically this can lead to increased patient doses if the level of x-ray exposure is determined by “most attractive” image criteria. In general, solid-state detectors require less exposure than PSP systems or film. CCD and PSP systems for extraoral imaging require exposures similar to those needed for 200-speed screen-film systems.
Digital Image Viewing
Conventional computer monitors use cathode ray tube (CRT) designs. A beam of electrons emanating from an electron “gun” rapidly scans a phosphor-coated screen. The electron scan is horizontal and builds an image line by line. The image is repeated or refreshed at a rate of 60 times a second (hertz) or more to avoid the appearance of flicker. Color monitors use three electron guns, one each for red, blue, and green phosphors. The variable intensity of the electron beam is responsible for different shades of gray or color hue and intensity. High-quality monitors are able to display 256 different gray values or a combination of gray and color values. CRT displays involve conversion of digital information into analog voltages, which are supplied to the electron guns. Some loss of the original image information is inherent in the digital-to-analog conversion process. A number of factors affect the subjective quality of a monitor. The dot pitch is a measure of the distance between groups of subpixels (red, green, and blue phosphors) in the CRT. Smaller dot pitches, 0.28 mm or less, provide more pixels per area and sharper-looking images. The brightness of the monitor affects perceived contrast in the image. Bright monitors are essential in working environments with bright ambient lighting. Over time, the color phosphors in a CRT fade, reducing the brightness of the monitor and the contrast within the image.
THIN FILM TRANSISTOR DISPLAY
TFT technology, which is used in flat panel detectors, is also used in laptop and flat panel computer displays. The process is somewhat reversed in that a signal is sent to the pixel’s transistor, which in turn causes the associated liquid crystal display (LCD) to transmit light with an intensity proportional to the transistor voltage. Subpixels composed of red, green, and blue phosphors are subjected to varied voltages and in combination create a pixel output of a particular hue and intensity. The output of laptop displays is limited in intensity and does not have the dynamic range or contrast found in conventional desktop CRT or LCD displays. The viewing angle of laptop displays is also limited, and the observer needs to be positioned squarely in front of the display for optimum viewing quality. Current laptop displays are of sufficient quality to be used for typical dental diagnostic tasks. Desktop versions of TFT LCD displays have overcome brightness and viewing angle problems but consume more power and thus are not suited for laptop configurations. An increasing number of flat panel displays are actually brighter than conventional CRT displays and have viewing angles as wide as 160 degrees. Some flat panel displays incorporate a digital video interface, which allows direct display of digital information without digital-to-analog conversion. These displays virtually eliminate signal loss and distortion from digital-to-analog conversion.
ELECTRONIC DISPLAY CONSIDERATIONS
The display of digital images on electronic devices is a fairly straightforward engineering issue. Positioning an image in the context of other diagnostic and demographic information and in useful relationships with other images is a more complex challenge that may vary according to diagnostic task, practice pattern, and practitioner preference. These challenges are answered with varying degrees of success by image display software. The quality, capabilities, and ease of use of display software vary from vendor to vendor. Even with the same software, the display of images can vary dramatically, depending on how the software handles resizing of windows or the size and resolutions of different displays. For instance, on some displays, it may be impossible to view a full-mouth series of images on a single screen at normal magnification (100%). Software may permit reduction in image size or scrolling around the window to compensate for smaller display areas. These approaches are not as fast or flexible as shifting a film mount around on a view box. The visibility of electronic displays is degraded by many of the same elements that degrade viewing of film images. Bright background illumination from windows or other sources of ambient light reduces visual contrast sensitivity. Light reflecting off a monitor surface may further reduce the visibility of image contrast. Images are best viewed in an environment in which lighting is subdued and indirect.
HARD COPIES
Until all dental health care providers and third parties are able to send, receive, store, and display digital images from a variety of acquisition sources, there will be a need for a universal medium to exchange radiographic image information. With the development of digital photography as a mainstream technology, digital image printing has become an economical solution for making digital radiographs transferable. The question is whether the printed image provides adequate image quality to prevent loss of diagnostic information. Any time a digital image is modified, including the process of printing it in hard copy, there needs to be sufficient assurance that the image retains relevant diagnostic information. The requirements for quality vary with the diagnostic task at hand. For instance, assessment of the impaction status of a third molar puts a lower demand on the image quality than caries detection. Unfortunately, there is limited scientific evidence to support the diagnostic efficacy of printed images. The large number of variables that influence the quality of the printed image—for instance, the printing technology, printer quality, printer settings, and type of media—makes the printing process a much more complicated process than it initially appears to be. It is therefore imperative, when images must be printed, to use a printing system that is designed for its intended use and to follow the manufacturer’s recommendations. Of course, it is always preferable to transfer images digitally when possible. The main types of printing technologies available for image printing include laser, inkjet, and dye sublimation with the use of either film or paper.
Film Printers
Radiologists have traditionally relied on film images for common interpretive tasks. Many radiologists still prefer film even for inherently digital technologies such as magnetic resonance and computed tomography imaging. Unfortunately, high-quality film printers that use laser or dye sublimation technologies are expensive, and low-cost alternatives suffer from reduced diagnostic quality. Current film transparencies produced with ink jet technology appear to be suboptimal for tasks such as caries diagnosis.
Paper Printers
Although printing on film allows radiographs to be evaluated in a traditional manner with the transmitted light of a viewbox, paper-printed digital radiographs require reflective light from a normally lit room. This offers a substantial advantage because most dental operatories are not well equipped to control the ambient light level for viewing film images on a viewbox. Moreover, printing digital radiographs on paper allows the dentist to use technologies developed for the digital photography domain.
Photographic printers vary widely in price and quality. Although more costly models usually provide higher print resolution, printer resolution is only one of many factors determining the final quality of the printed image. Ink jet printers are by far the most dominant in the market and offer the most economical alternative. Dye sublimation printers provide excellent image quality but are generally more expensive.
For any printing technology, the printing resolution is usually defined as the number of dots per inch (DPI) the printer can print. A printer with a higher DPI number is capable of laying the ink down more tightly than a printer with a lower DPI number. As a result, printers with a higher DPI number can print smaller objects and thus are said to have “higher resolution.” The resolution of the digital radiograph can never be increased by a printer that prints at a higher resolution than that of the image itself. On the other hand, printing digital radiographs at a lower resolution may reduce the final resolution of the image unless the printed size of the image is increased. Spatial resolution is preserved as long as the image prints pixel for pixel.
The same cannot be said of contrast resolution, which is always reduced by the printing process. The reason for this is that the printer is not actually printing with shades of gray but is instead printing varying numbers of black dots. Typically an 8 × 8 pixel page array is assigned to each image pixel (Fig. 7-11). The number of elements in the array that are filled with a black ink dot determines the relative gray level of the array. The 8 × 8 array provides for 0 to 64 ink dots or 65 gray values. With an 8 × 8 dot array, it may not be possible to print all pixels of an image on a single page. For instance, a PSP panoramic image with a physical size of 15 × 30 cm might be scanned at 150 DPI. For each pixel of this image to print within the same dimensions, a printer resolution of 1200 DPI (8 × 150) is required. If the maximum resolution of the printer is 1200 DPI, then images with higher resolutions must be printed at a larger size to obtain full spatial resolution. Likewise, a bitewing image scanned at 300 DPI must be printed at twice its physical size of 30 × 40 mm to preserve the original resolution. Resizing of an image to fit on a printed page leads to interpolation of pixels and can result in a significant loss of resolution.
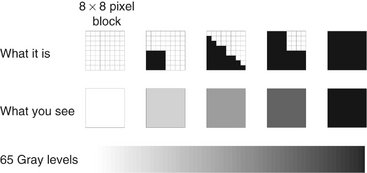
FIG. 7-11 Gray scale printing: Each image pixel is assigned to an 8 × 8 pixel array on the printed page. From 0 to 64 black ink dots can be used to fill each array, resulting in 65 potential gray levels. This means that an 8 bit (256 gray levels) is reduced to 6 bits with a concomitant loss of contrast resolution during the printing process.
IMAGE PROCESSING
Any operation that acts to improve, restore, analyze, or in some way change a digital image is a form of image processing. The use of digital imaging in dental radiography involves a variety of image processing operations. Some of these operations are integrated in the image acquisition and image management software and are hidden from the user. Others are controlled by the user with the intention to improve the quality of the image or to analyze its contents.
IMAGE RESTORATION
When the raw image data enter the computer, they are usually not yet ready for storage or display. A number of preprocessing steps need to be performed to correct the image for known defects and to adjust the image intensities so that they are suitable for viewing. For example, some of the pixels in a CCD sensor are always defective. The image is restored by substituting the gray values of the defective pixels with some weighted average of the gray values from the surrounding pixels. Depending on the quality of the sensor and the choices made by the manufacturer, a variety of other operations may be applied to the image before it becomes visible on the display. They are executed very rapidly and are unnoticed by the user. Most of the preprocessing operations are set by the manufacturer and cannot be changed.
IMAGE ENHANCEMENT
The term image enhancement implies that the adjusted image is an improved version of the original one. Most image enhancement operations are applied to make the image visually more appealing (subjective enhancement). This can be accomplished by increasing contrast, optimizing brightness, and reducing unsharpness and noise. Subjective image enhancement does not necessarily improve the accuracy of image interpretation. Image enhancement operations are often task specific: what benefits one diagnostic task may reduce the image quality for another task. For example, increasing contrast between enamel and dentin for caries detection may make it more difficult to identify the contour of the alveolar crest. Image enhancement operations are also dependent on viewer preference.
Brightness and Contrast
Digital radiographs do not always effectively use the full range of available gray values. They can be relatively dark or light, and they can show too much contrast in certain areas or not enough. Although this can be judged visually, the image histogram is a convenient tool to examine which of the available gray values the image is using (Fig. 7-12). The minimum and maximum values and the shape of the histogram indicate the potential benefit of brightness and contrast enhancement operations.
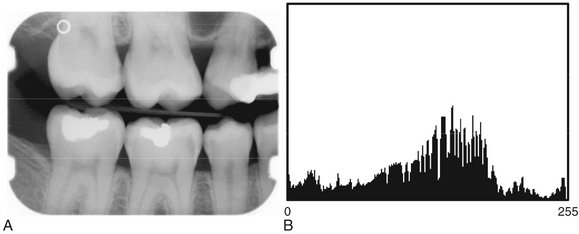
FIG. 7-12 Digital image (A) with image histogram (B). Horizontal axis represents image gray levels (8 bits—256 levels); vertical axis represents number of pixels. Each bar indicates the number of pixels in the image with that particular gray level.
Digital imaging software commonly includes a histogram tool and tools for the adjustment of brightness and contrast. Some also allow adjustment of the γ value. Changing the gamma value of an image selectively enhances image contrast in either the brighter or darker areas of the image. Adjustment of brightness, contrast, and γ value changes the original intensity values of the image (input) to new values (output). The operator can choose to make these changes permanent or to restore the image to its original settings. Figure 7-13 is a graphic representation of the relationship between input values (horizontal axis) and output values (vertical axis) with the corresponding images and their histograms. Digital imaging software usually also includes tools for histogram equalization and contrast inversion. Histogram equalization is an enhancement operation that increases contrast between those image intensities abundantly present within the image while reducing contrast between image intensities that are used only sparsely. The actual effect of histogram equalization depends on the image content and may sometimes lead to unexpected degradation of image quality. Contrast inversion changes the radiographic positive image into a radiographic negative image. Although this may affect the subjective perception of the image content, the altered appearance is foreign to interpretive practice and is little used.
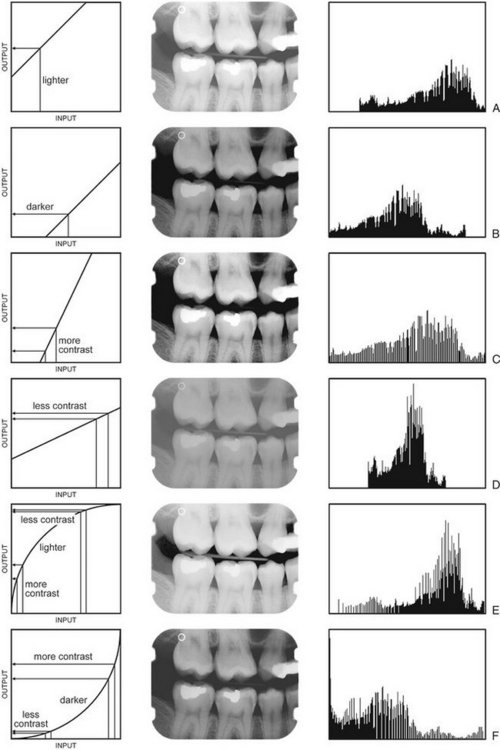
FIG. 7-13 Effect of brightness, contrast, and γ adjustment as illustrated by image transformation graphs (left), digital images (middle), and image histograms (right). The image adjustments are relative to those of Figure 7-12. A, Increase in brightness. B, Decrease in brightness. C, Increase in contrast. D, Decrease in contrast. E, Increase in γ. F, Decrease in γ.
The effect of contrast enhancement on the diagnostic value of digital radiographs is controversial. Some studies show substantial benefits of contrast enhancement operations, whereas others have found only limited value or no improvement at all. The effect of contrast enhancement cannot easily be predicted. The key to successful image enhancement is to selectively enhance relevant radiographic signs without simultaneously enhancing distracting features.
Sharpening and Smoothing
The purpose of sharpening and smoothing filters is to improve image quality by removing blur or noise. Noise is often categorized as high-frequency noise (speckling) or low-frequency noise (gradual intensity changes). Filters that smooth an image are sometimes called despeckling filters because they remove high-frequency noise. Filters that sharpen an image either remove low-frequency noise or enhance boundaries between regions with different intensities (edge enhancement). For the purposeful application of filters, it is important to know what type of noise the filters reduce and how that affects radiographic features of interest. Without this knowledge, important radiographic features may degrade or disappear as noise is removed. Similarly, edge enhancement of radiographic features of interest may enhance noise or enhance local contrast to the extent that it simulates disease. Sharpening and smoothing filters may make the dental radiographic images subjectively more appealing; however, there is no scientific evidence suggesting an increase in diagnostic value. The indiscriminate use of filters made available in most imaging software packages should be avoided if there is no scientific support for their clinical usefulness.
Color
Most digital systems currently on the market provide opportunities for color conversion of gray-scale images, also called pseudocolor. Humans can distinguish many more colors than shades of gray. Transforming the gray values of a digital image into various colors could theoretically enhance the detection of objects within the image. However, this works only if all the gray values representing an object are unique for that object. Because this is rarely the case, boundaries between objects may change and new boundaries may be created. In most cases this will distract the observer from seeing the real content of the image and result in degraded image interpretation. Therefore color conversion of radiographs is neither diagnostically nor educationally useful. Some useful applications of color exist. When objects can be uniquely identified on the basis of a set of image features, color can be used to label or highlight these objects. The development of such criteria is a complex task, and only a limited number of successful studies have been reported in the literature.
Digital Subtraction Radiography
When two images of the same object are registered and the image intensities of corresponding pixels are subtracted, a uniform difference image is produced. If there is a change in the radiographic attenuation between the baseline and follow-up examination, this change shows up as a brighter area when the change represents gain and as a darker area when the change represents loss (Fig. 7-14). The strength of digital subtraction radiography (DSR) is that it cancels out the complex anatomic background against which this change occurs. As a result, the conspicuousness of the change is greatly increased.
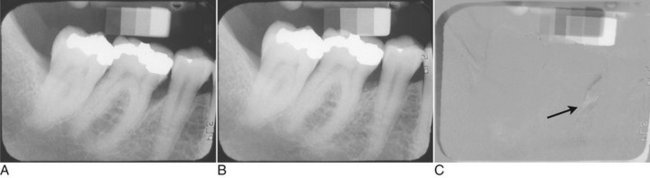
FIG. 7-14 Application of digital subtraction radiography for detection and quantification of periodontal bone healing. A, Baseline image. B, Standardized 1-year follow-up image. C, Subtraction image showing increase in bone (arrow).
For DSR to be diagnostically useful, it is imperative that the baseline projection geometry and image intensities be reproduced. The projection geometry is defined by the position and orientation of the x-ray source, the patient, and the detector, relative to one another. If the projection geometry used for the follow-up image is different from the projection geometry used for the baseline image, the subtraction image will show these differences. They can be difficult to distinguish from actual changes within the patient, or they may hide actual change. Perfect reproduction of the projection geometry would be ideal but is impossible to achieve clinically. Although most changes can be reversed through image processing, horizontal and vertical beam angulation changes cannot be reversed and should be reproduced as accurately as possible. The actual tolerance of changes in the projection geometry depends on how much actual change needs to be detected. Although exact reproduction of the projection geometry is not strictly necessary, some form of mechanical standardization will reduce the reliance on image processing and will generally produce better results.
Subtraction images are well suited for acquiring quantitative information, such as linear, area, and density measurements. Methods used to make such measurements range from visual interpretation and manual measurement to computer-aided image analysis. Regardless of the analytic technique used, detecting and quantifying actual changes within a patient requires that factors affecting such measures be controlled.
IMAGE ANALYSIS
Image analysis operations are designed to extract diagnostically relevant information from the image. This information can range from simple linear measurements to fully automated diagnosis. The use of image analysis tools brings with it the responsibility to understand their limitations. The accuracy and precision of a measurement are limited by the extent to which the image is a truthful and reproducible representation of the patient and by the operator’s ability to make an exact measurement.
Measurement
Digital imaging software provides a number of tools for image analysis. Digital rulers, densitometers, and a variety of other tools are readily available. These tools are usually digital equivalents of existing tools used in endodontics, orthodontics, periodontology, implantology, and other areas of dentistry (Fig. 7-15). Digital imaging has also added new tools that were not available with film-based radiography. The size and image intensity of any area within a digital radiograph can be measured. Tools are also being developed for measuring the complexity of the trabecular bone pattern. Such measurements can be useful as screening tools for osteoporosis assessment and for detecting other diseases.
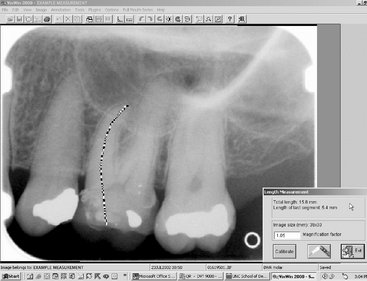
FIG. 7-15 Example of a measurement tool to determine the length of the crown and mesiobuccal root of the first molar. The measurement has been calibrated for a magnification factor of 1.05. The digital measurement tool is more versatile than the analog ruler; however, for both types of measurement tools, the apparent length remains dependent on the projection geometry.
Diagnosis
One of the most challenging areas of research is the development of tools and procedures that automate the detection, classification, and quantification of radiographic signs of disease. The rationale for the use of such methods is to achieve early and accurate disease detection by using reproducible and objective criteria. The development of automated image analysis operations is very complex and requires a thorough understanding of anatomy, pathology, and radiographic image formation. The three basic steps of image analysis are segmentation, feature extraction, and object classification. Of these, segmentation is the most critical step. The goal of segmentation is to simplify the image and reduce it to its basic components. This involves subdividing the image, thus separating objects from the background. Objects of interest are defined by the diagnostic task, for example, a tooth, a carious lesion, a bone level, or an implant. When image segmentation results in the detection of an object, a variety of features can be measured that assist in determining what the object represents. Such features may include measures of size and shape, relative location, average density, homogeneity, and texture. A unique set of values for a certain combination of features can lead to classification of the object. Automated cephalometric landmark identification is an example of this technology. Other dental examples include caries detection, classification of periodontal disease, and detection and quantification of periapical bone lesions. The success of many of these applications is highly dependent on specific imaging parameters. Very few provide reliable results when used clinically. This underscores the complexity of the radiographic image interpretation process.
Image Storage
The use of digital imaging in dentistry requires an image archiving and management system that is very different from that used for conventional radiography. Storage of diagnostic images on magnetic or optical media raises a number of new issues that must be considered. The file size of dental digital radiographs varies considerably, ranging from approximately 200 kilobytes for intraoral images to as much as 6 megabytes for extraoral images. Storage and retrieval of these images in an average-sized dental practice is not a trivial issue. Fortunately, the development of new storage media and the continuing decrease in the price of a unit of storage has alleviated the capacity issue in dental radiography. The hard drive capacities of modern computers already exceed the storage needs of most dental practices.
The simplicity with which digital images can be modified through image processing poses a potential risk with respect to ensuring the integrity of the diagnostic information. Once in a digital format, critical image data can be deleted or modified. It is important that the software prevents the user from permanently deleting or modifying original image data, whether intentional or unintentional. Not all software programs provide such a safeguard. As the use of digital imaging in dentistry continues to expand, the implementation of standards for preserving original image data becomes urgent. It is also imperative that images and other important patient-related information are regularly stored on secondary external media. The use of computers for storing critical patient information mandates the design and use of a backup protocol. Box 7-1 shows some issues that need to be considered when a backup protocol is designed. Backup media suitable for external storage of digital radiographs include external hard drives, digital tapes, CDs, and DVDs. Downloading of data by telephone or dedicated data lines to off-site commercial storage sites is available through a number of vendors and provides essentially unlimited storage and backup. All these technologies are low in cost and have demonstrated reasonable reliability.
The purpose of image compression is to reduce the size of digital image files for archiving or transmission. In particular, storing extraoral images in a busy clinic may pose a challenge to storage capacity and speed of image access. The purpose of file compression is to significantly reduce the file size while preserving critical image information.
Compression methods are generally classified as lossless or lossy. Lossless methods do not discard any image data, and an exact copy of the image is reproduced after decompression. Most compression techniques take advantage of redundancies in the image, which can be expressed in simpler terms. The maximum compression rate for lossless compression is usually less than 3 : 1. Lossy compression methods achieve higher levels of compression by discarding image data. Empiric evidence suggests that this does not necessarily affect the diagnostic quality of an image. Compression rates of 12 : 1 and 14 : 1 were shown to have no appreciable effect on caries diagnosis. For determining endodontic file length, a rate of 25 : 1 was diagnostically equivalent to the uncompressed image. A compression rate of 28 : 1 was acceptable for the subjective evaluation of image quality and the detection of artificial lesions in panoramic radiographs.
Version 3.0 of the DICOM (Digital Imaging and Communications in Medicine) standard adopted JPEG (Joint Photographic Experts Group) as the compression method, which provides a range of compression levels. Other types of image compression methods, such as wavelet compression, are being investigated for their use in medical imaging. Although the use of low and medium levels of lossy compression appear to have little effect on the diagnostic value of dental images, the application of lossy compression should be used with caution and only after its effect for specific diagnostic tasks has been evaluated. With the continuing increase in the capacity of storage media and the widespread use of high-speed data communication lines, lossy compression of dental radiographs is rapidly becoming obsolete. At the same time, new digital image receptors are generating images with more and more pixels and more bits per pixel, thus increasing storage needs. Image compression negates to some extent the gain from such high-end detectors. Whether we need high resolution detectors and whether we can use image compression should be dictated by diagnostic criteria. Current evidence suggests that detector quality and moderate image compression have a limited impact on diagnostic outcomes.
Systems Compatibility
The development of digital imaging systems for dental radiography has largely been driven by industry. Manufacturers have adopted and developed technologies according to individual needs and philosophies. As a result, image formats among systems from different vendors are not standardized, and image archival, retrieval, and display systems are often incompatible. Despite the proprietary nature of imaging software, it is possible to transfer images from one vendor’s system to the other. Most systems provide image export and import tools using a variety of generic image formats, such as JPEG and TIFF (tagged image file format). However, the process of transferring images through export-import procedures is cumbersome. It requires a number of steps, and the operator needs to ensure that the right images are imported into the proper patient folder. It can also not be assumed that the display and calibration of imported and native images will be the same.
Clearly, exporting and importing is not the method of choice when digital imaging is going to be used on a large scale. It has long been recognized that the adoption of a standard for transferring images and associated information between digital imaging devices in medicine and dentistry is necessary. The American College of Radiology and the National Electrical Manufacturers Association formed a joint committee to develop a standard for digital imaging systems. A large number of professional organizations have contributed to this complex development process, which has resulted in the current standard, known as the Digital Imaging and Communications in Medicine (DICOM) standard. Various dental organizations, including the American Dental Association, are playing an active role in defining aspects of the standard related to dentistry. The DICOM standard is not a static set of rules dictating to manufacturers how to build imaging devices. Rather it is an evolving document addressing the interoperability of medical and dental imaging and information systems. Manufacturers of digital imaging systems for dental radiography are responding to the call to adopt the DICOM standard. Not all systems are currently conforming to the DICOM standard, and those that do may not conform to every aspect of the standard. The successful adoption of digital imaging in dentistry requires interoperability of all devices. It is likely that manufacturers do not want to be left behind and that the market will weed out those that are noncompliant. Dentists using different vendors with DICOM-compliant imaging devices will be able to exchange images seamlessly.
Clinical Considerations
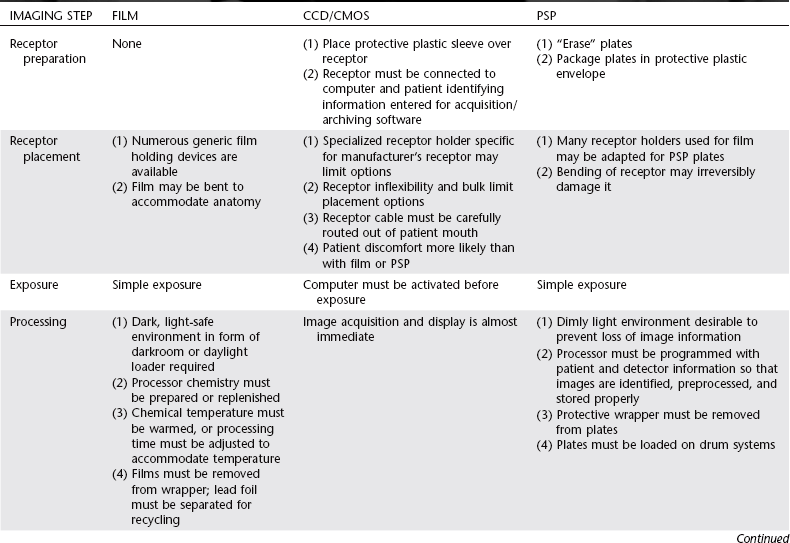
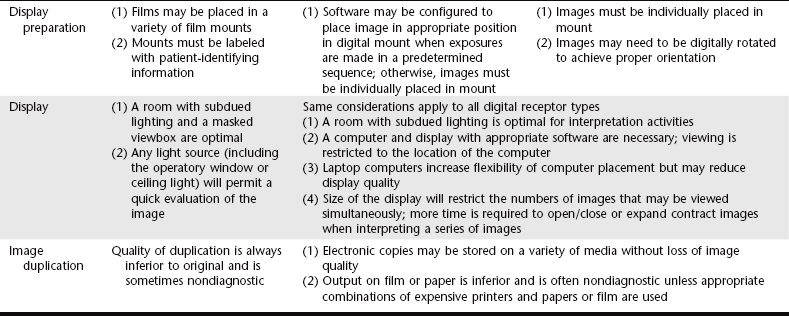
Some fundamental differences from film in the clinical handling of digital receptors should be noted (Table 7-1). Because digital receptors are intended to be reusable, they must be handled with greater care than their film counterparts. Indeed, in certain situations film may be intentionally damaged through bending to accommodate patient anatomy. This is never the case with digital receptors. Examples of common image artifacts found on images made with solid-state or PSP systems are shown in Box 7-2. PSP plates are susceptible to bending and scratching during handling that induce permanent artifacts in the receptor. These artifacts obscure information of potential diagnostic importance and may necessitate disposal of the receptor and repeat imaging of the patient. Because of the inability of digital detectors to be bent to accommodate patient anatomy, new imaging strategies must be used for some patients. It may not be possible to consistently capture the distal surface of the canine on premolar views. An additional projection may be required to adequately visualize this surface.
BOX 7-2 Common Problems in Digital Image Receptor Exposure, Processing, and Handling
Although the brightness of these images has been adjusted to display similar average gray values, notice the noisy appearance of the underexposed bitewing radiograph (Fig. 7-16, A, 0.032 second) compared with the properly exposed radiograph (Fig. 7-16, B, 0.32 second).
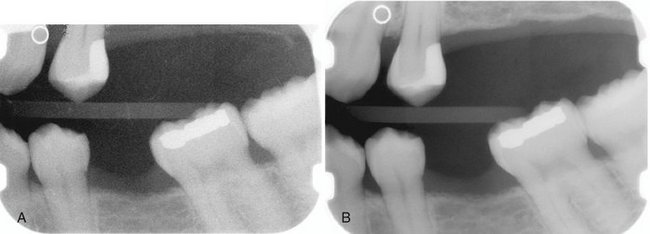
FIG. 7-16
PSP image degradation as a result of excessive exposure to ambient light between image acquisition and plate scanning (Fig. 7-17). This type of noise resembles that of x-ray underexposure.
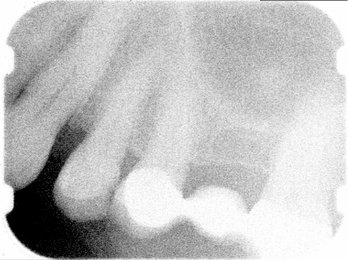
FIG. 7-17
Partial exposure of PSP plates to excessive ambient light prior to scanning results in nonuniform image density (Fig. 7-18, A). This happens when plates are overlapped while exposed to ambient light (Fig. 7-18, B).
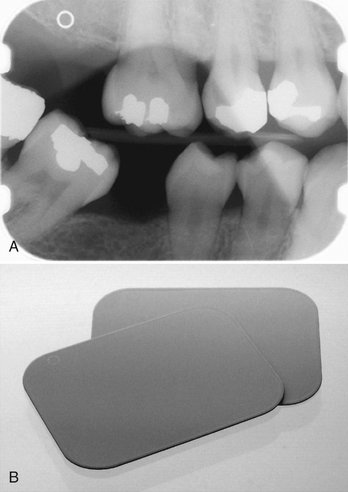
FIG. 7-18
Bending of PSP plates during intraoral placement: moderate bending (Fig. 7-19, A), retake of A (Fig. 7-19, B), severe bending (Fig. 7-19, C), and retake of C (Fig. 7-19, D).
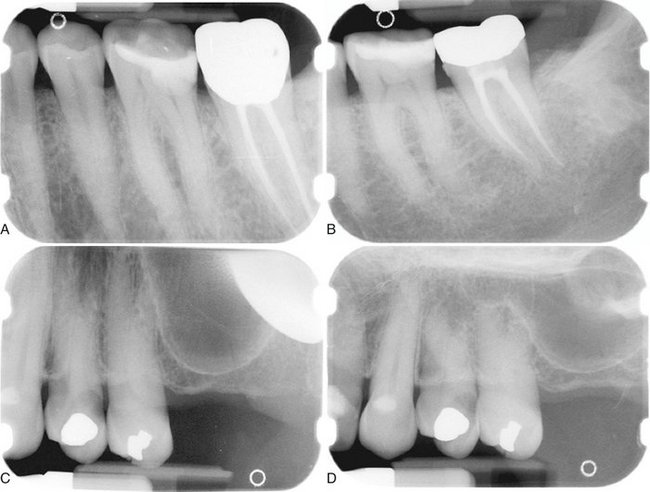
FIG. 7-19
PSP double image on incisor periapical radiograph resulting from incomplete erasure of previous image of posterior periapical region (Fig. 7-20, A) and retake (Fig. 7-20, B).
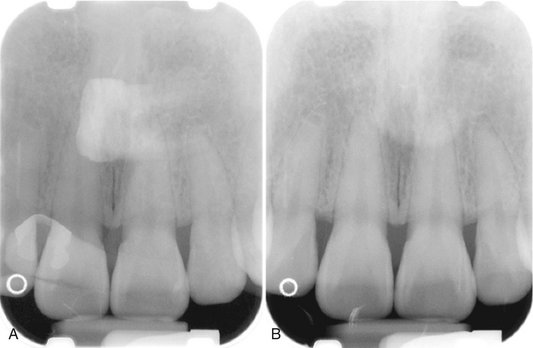
FIG. 7-20
More examples of double images resulting from incomplete erasure of PSP receptors: posterior periapical radiograph with double image (Fig. 7-21, A), retake of A (Fig. 7-21, B), anterior periapical radiograph with double image (Fig. 7-21, C), and retake of C (Fig. 7-21, D).
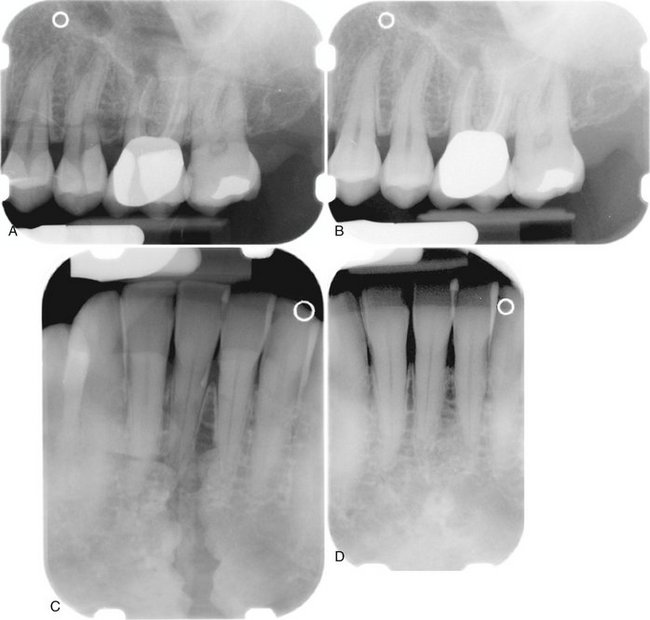
FIG. 7-21
Scratched phosphor surface mimicking root canal filling (Fig. 7-22, A) and retake (Fig. 7-22, B).
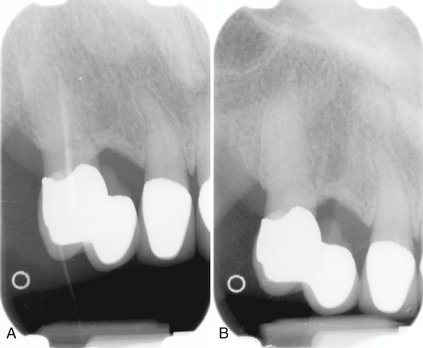
FIG. 7-22
Image artifacts resulting from excessive bending of the PSP plate (Fig. 7-23, A) and excessive bending has resulted in permanent damage to the phosphor plate (Fig. 7-23, B).
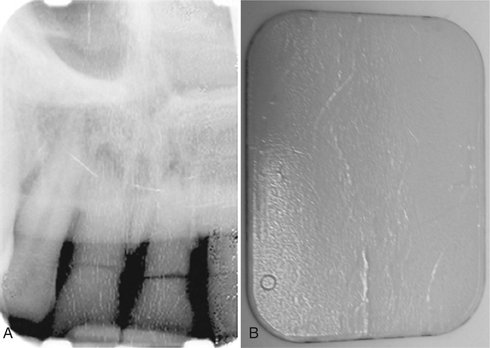
FIG. 7-23
PSP circular artifact as a result of plate damage (Fig. 7-24, A) and localized swelling of the protective coating from disinfectant solution on work surface (Fig. 7-24, B).
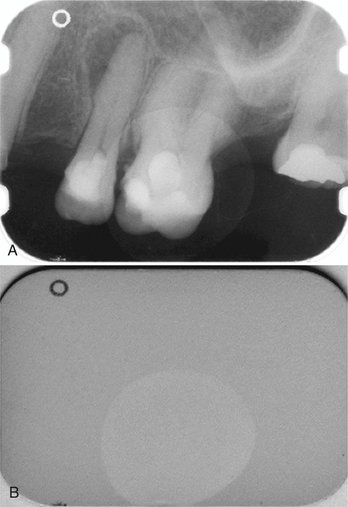
FIG. 7-24
PSP image artifact resulting from plate surface contamination (Fig. 7-25, A). This artifact was caused by a glove powder smudge that prevented proper scanning of the affected area of the PSP plate (Fig. 7-25, B). Contaminants combined with skin oils may permanently damage the phosphor plate surface.
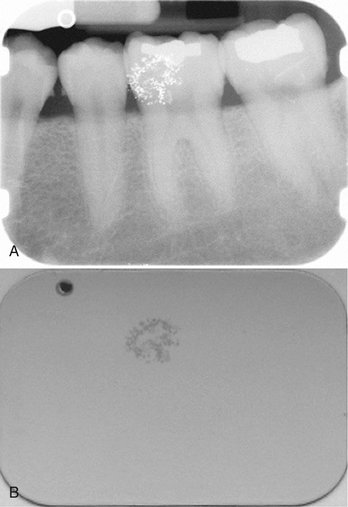
FIG. 7-25
Malfunctioning CCD sensor resulting from rough handling (dropped sensor). The sensor produces geometric image artifacts (Fig. 7-26, A and B).
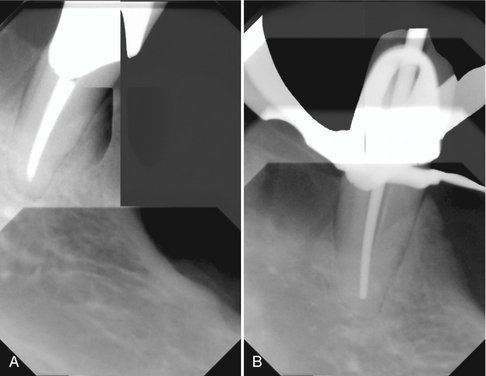
FIG. 7-26
Improper Use of Image Processing
Improper use of image processing tools, such as filters, may result in false-positive findings. An edge enhancement filter was applied to the panoramic image, which produced radiolucencies at restoration edges simulating recurrent caries (Fig. 7-27, A). These radiolucencies are not present in a follow-up intraoral image (Fig. 7-27, B).
FIG. 7-27
A significant potential problem with most PSP systems is the inability to distinguish images from plates that have been exposed backward. Unlike film packets, which incorporate a lead foil with a characteristic embossed pattern that results in an underexposed image of the anatomy with the pattern artifact when exposed backward, PSP images have little x-ray attenuation from the polyester base. It is much too easy for inattentive radiographers to mount these digital images on the contralateral position from their true side. One can imagine the liability that could occur from diagnosing and treating disease on the opposite side of the actual lesion. To date, only the Soredex Optime system has addressed this issue by incorporating a round metal disk on the back of intraoral plates. (See Fig. 7-7.) This marker becomes visible on the image if the imaging plate is exposed backward. The appearance of the marker on the image does not fully obscure the anatomic information and these images can be “mirrored” with imaging software tools without the need for repeated exposure.
Infection control is also an issue with digital receptors. Digital receptors cannot be sterilized by conventional means. They may be disinfected by wiping with mild agents such as isopropyl alcohol but should not be immersed in disinfecting solutions. The adage that “you can autoclave a digital receptor … once” stems from the fact that heat will ruin electronic components in CCD and CMOS sensors and will distort the polyester base of PSP plates. Another potential drawback to drum-based PSP systems is the 2- to 5-minute cycle time required by some devices for plate scanning. During this time, no additional plates may be processed. With film and non–drum-based PSP scanners, there is less delay between the times when additional films or plates may be “fed” into the processor. Although each of the preceding concerns are of potential importance, the advantage of eliminating chemical processing in digital systems should not be overlooked. The time required to properly monitor and maintain a film processor is significant. Too often, insufficient attention is paid to this critical aspect of film radiography. Digital systems may not save the time gained by eliminating film processing, but they will eliminate the loss in diagnostic quality that occurs when insufficient time and effort is spent on film processing quality assurance.
Conclusion
Dental practitioners commonly ask, “Which is better, film or digital imaging?” There is no simple answer to this question (Tables 7-1 and 7-2). Reported technical properties of resolution, contrast, and latitude are confounded by a lack of standardization in the assessment of these characteristics. From a diagnostic standpoint most studies suggest that digital performance is not clinically different from film for typical diagnostic tasks such as caries diagnosis. The “look and feel” of digital displays is distinctly different from film viewing, and some practitioners may find this difference disconcerting. A basic understanding of computers and a mastery of common computing skills is essential for viewing digital images. Beyond this, learning the peculiarities and vagaries of a particular acquisition and display software will take time and may not be intuitive. Multiple mouse clicks through multiple menus may be required to view a full-mouth series of images. This may modestly increase the time required to complete the interpretative process.
TABLE 7-2
Comparison of Physical Properties of Film, Charge-Coupled Device, Complementary Metallic Oxide Semiconductor, and Photostimulable Phosphor Receptors
| FEATURE | TECHNICAL COMMENT | CLINICAL COMMENT |
| Spatial resolution | Intraoral systems: Film > CCD = CMOS > PSP Panoramic systems: Film = CCD = PSP Cephalometric systems: Film > CCD = PSP |
The limits of resolution for digital systems are readily appreciated when magnifying these images. With magnification a “blocky” or “pixelated” appearance is evident. Resolution of panoramic systems is limited by mechanical motion to about 5 lp/mm. |
| Exposure latitude | PSP >> CCD = CMOS ≥ film | Because of the wide latitude of PSP and the automatic brightness and contrast “optimization” by image acquisition software, use of more x-ray exposure than is necessary is possible. |
| Receptor dimensions | For equivalent imaged area, Film = PSP < CCD = CMOS | The “active area” of CCD and CMOS receptors is smaller than the surface area because of other electronic components within the plastic housing. |
| Time for image acquisition | CCD = CMOS << PSP = film | Rapid image acquisition may be important for endodontic procedures or during implant placement. |
| Image quality | Subjective quality is best with film when carefully exposed and well processed. | Digital and film imaging are not significantly different when used for common diagnostic tasks. |
| Image adjustment/ processing | Improves appearance of digital images. | Takes time; may not improve diagnostic performance. |
| Cost | Initial costs of digital systems are greater than film. Subsequent costs vary greatly depending on receptor wear and tear or abuse. | Manufacturers’ estimates of life expectancy of reusable receptors are perhaps overly optimistic. |
| Reliability | Mechanical problems affect digital PSP and film systems. Software reliability varies greatly among manufacturers. Changes in unrelated computer components and software can cause digital systems to malfunction. | Digital systems fail when problems occur with receptors during image acquisition, or with computers during image processing, archiving, and display. |
| Image storage and retrieval | Data backup is critical for digital systems. | Films can be misfiled and lost or be damaged by poor storage conditions. Digital data can be lost as a result of failures in power supplies or storage media and operator error. |
| Transmitting images to others | Rapidly done with digital images. | Facilitates communication between colleagues or with insurance companies. |
In selecting an imaging system, other issues should be considered. Digital images avoid environmental pollutants encountered with film processing, but what about the environmental impact associated with the disposal of broken or obsolete electronic equipment? The initial financial outlay for digital imaging hardware makes these systems more expensive than film. Manufacturers are quick to point out that the costs of film or digital systems should be amortized over the life of the equipment and consumables; however, the life expectancy of newer digital systems is highly speculative. Mishandling of digital system components can catastrophically shorten any projected life expectancy. And what price should we place on the ability to instantly transmit images and to integrate them into a fully electronic record? There are no universal answers to these questions. They must be asked and answered according to the needs and objectives of individual dental practices. As practice patterns and technology change with time, the answers will also change. Although the details of the image in our crystal ball have yet to resolve, the trends of increasing adoption of digital imaging and continuing technologic innovation makes the future of digital imaging in dentistry certain.
DIGITAL DETECTORS AND DISPLAYS
Abreu, M, Jr., Mol, A, Ludlow, JB. Performance of RVGui sensor and Kodak Ektaspeed Plus film for proximal caries detection. Oral Surg Oral Med Oral Pathol Oral Radiol Endod. 2001;91:381–385.
Couture, RA, Hildebolt, C. Quantitative dental radiography with a new photostimulable phosphor system. Oral Surg Oral Med Oral Pathol Oral Radiol Endod. 2000;89:498–508.
Hildebolt, CF, Couture, RA, Whiting, BR. Dental photostimulable phosphor radiography. Dent Clin North Am. 2000;44:273–297.
Sanderink, GC, Miles, DA. Intraoral detectors: CCD, CMOS, TFT, and other devices. Dent Clin North Am. 2000;44:249–255. v
Van der Stelt, PF. Principles of digital imaging. Dent Clin North Am. 2000;44:237–248. v
Analoui, M. Radiographic image enhancement, I: spatial domain techniques. Dentomaxillofac Radiol. 2001;30:1–9.
Analoui, M. Radiographic digital image enhancement, II: transform domain techniques. Dentomaxillofac Radiol. 2001;30:65–77.
Baxes, GA. Digital image processing: principles and applications. New York: John Wiley; 1994.
Gonzalez, R, Wood, R. Digital image processing, ed 3. Upper Saddle River, NJ: Prentice Hall; 2007.
Gröndahl, H-G, Gröndahl, K, Webber, R. A digital subtraction technique for dental radiography. Oral Surg Oral Med Oral Pathol. 1983;55:96–102.
Lehmann, T, Gröndahl, H-G, Benn, D. Computer-based registration for digital subtraction in dental radiology. Dentomaxillofac Radiol. 2000;29:323–346.
Mol, A. Image processing tools for dental applications. Dent Clin North Am. 2000;44:299–318.
Russ, JC. The image process handbook, ed 4. Boca Raton, Fla: CRC Press; 2002.
Ruttimann, U, Webber, R, Schmidt, E. A robust digital method for film contrast correction in subtraction radiography. J Periodont Res. 1986;21:486–495.