Selected Clinical Laboratory Reference Ranges
Reference ranges
Reference ranges are values of a given substance (analyte) obtained in a reference population, which is usually a group of healthy individuals
These values represent the physiologic quantities of a substance to be expected in healthy persons. The term ‘reference range’ is preferred over ‘normal range’ because while the reference population can be clearly defined, no clear definition exists for what is ‘normal’ in a clinical sense.
Deviation above or below the reference range may be associated with a disease process, and the severity of the disease process may be associated with the magnitude of the deviation. The ideal reference population is one that is appropriate for the individual's age, sex and ethnicity. The reference range may also vary with the instrument and assay procedure used for the measurement.
Distribution of values within the reference population
When data from a large cohort of healthy subjects fit a Gaussian distribution, the reference limits are defined as two standard deviations above and below the mean
This constitutes the central 95% interval of the distribution. However, many analyte distributions are non-Gaussian and these values are usually mathematically transformed (e.g. logarithmic, reciprocal, exponential transformation) to yield a Gaussian distribution.
Interpretation of laboratory results in individual persons
The interpretation of results of laboratory tests is based on comparison with reference values
If a value falls outside the reference interval, it signifies that – with the probability of 95% – the result is different from the reference population. Note that this does not necessarily mean that it is abnormal: by definition, 5% of individuals in a reference population (1 in 20 subjects) will have results outside the reference range. However, the further the result is from the reference range, the greater is the probability that it is associated with a pathology.
Clinical decision limits
In some cases instead of reference values, clinical decision limits are the basis for interpretation
Clinical decision limits are used in the interpretation of tests such as plasma glucose, lipids, and cardiac troponin measurements. These limits, or cut-off points, are usually derived from epidemiologic studies linking the levels of an analyte with the risk of a particular condition.
The reference values given here are taken from the UK Pathology Harmonization Reference Ranges and from the NHS Greater Glasgow and Clyde Clinical Biochemistry Service (UK) test menu.
In the tables below we have only included the basic tests that will be helpful in the interpretation of information presented in the Clinical Boxes throughout this book. The reader is referred to Further Reading for comprehensive lists of tests offered in clinical laboratories.
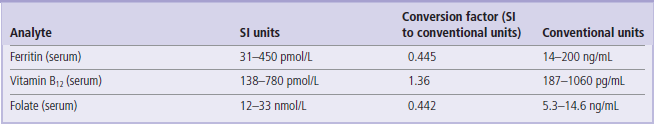
The reference intervals are given in SI and conventional units, wherever possible, with the factor for converting from SI to conventional units.
 To convert from an SI unit to a conventional unit, multiply by the conversion factor.
To convert from a conventional unit to an SI unit, divide by the conversion factor.
Unless indicated, the ranges given are for serum/plasma concentrations.
These values are given for guidance only. Remember that reference ranges may be different in different laboratories. Before interpreting laboratory tests in a clinical situation, it is essential to verify these with the local lab. Also, precisely as the Clinical Boxes aim to illustrate, laboratory tests should always be interpreted in the context of medical history and physical examination.
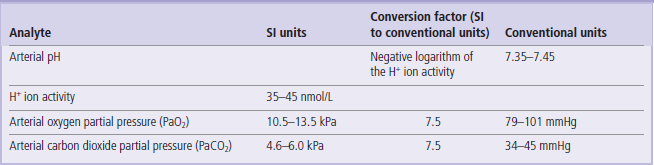
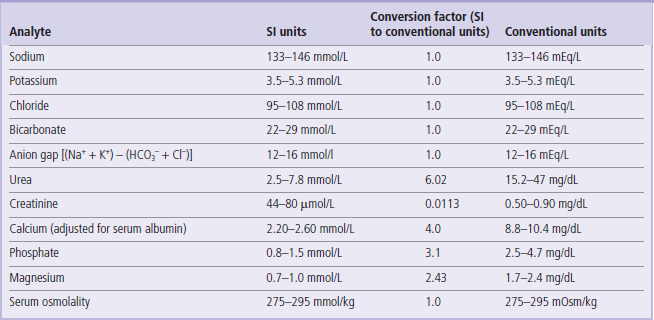
Table 3
Serum proteins and liver function tests
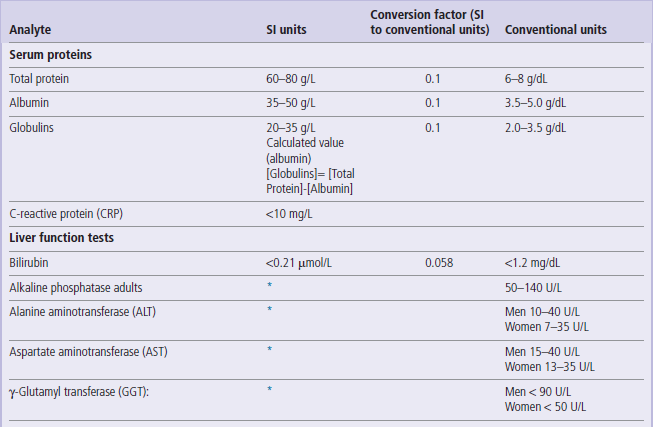
1 U = 1/60 micro katal = 16.67 nano katal.
However, katal is not currently used in clinical practice. Therefore, in accordance with current practice, enzyme activity has been expressed in units per liter (U/L) throughout this book.
*The SI unit of enzyme activity is katal. One katal is the amount of enzyme that converst 1 mole of substrate per second (mol/s). The conversion factor from U/L to katal is:
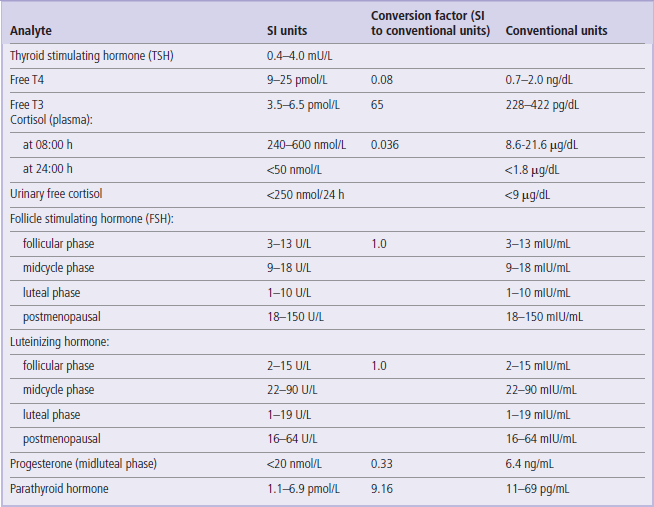
Table 5
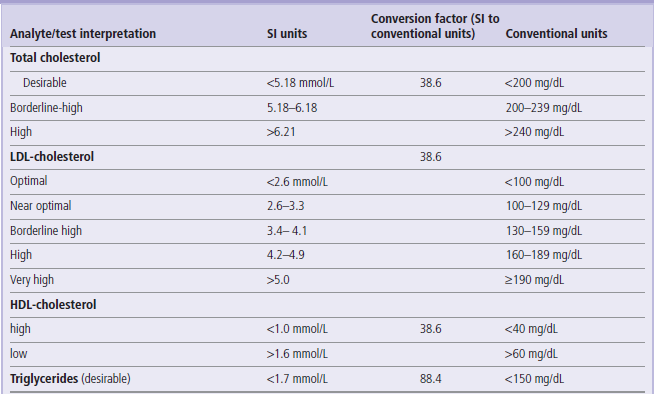
The interpretation of lipid levels is based on clinical decision limits developed by ATP3, and not on reference ranges
ATP3: National Cholesterol Education Program (USA) Adult Treatment Panel 3
For more details on lipid values and goals of treatment see www.nhlbi.nih.gov/guidelines/cholesterol/atp3xsum.pdf (US recommendations) and www.bcs.com/download/651/JBS2final.pdf (British recommendations)
Note also that updated (ATP4) criteria might have been released while this book was in print.
Table 6
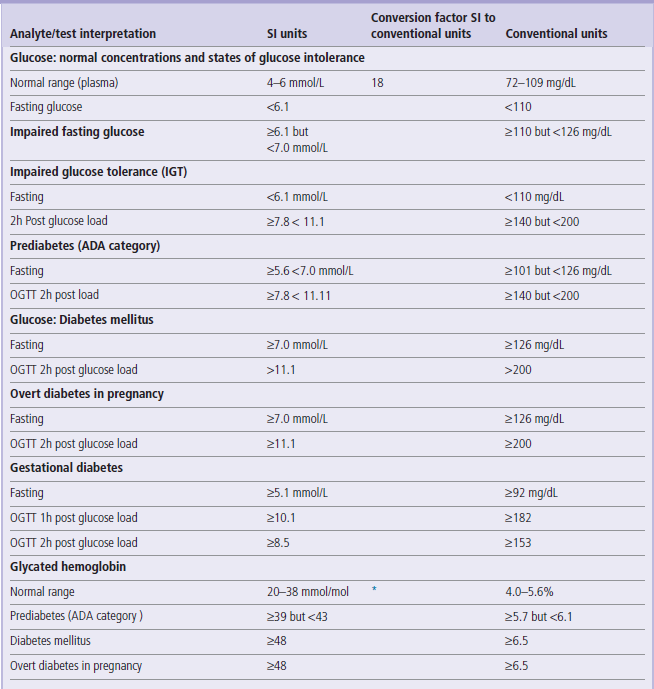
HbA1c (mmol/mol)= [HbA1c(%) −2.15] x 10.929
http://www.diabetes.org.uk/Professionals/Publications-reports-and-resources/Changes-to-HbA1c-values/
Criteria for the diagnosis of diabetes mellitus and glucose intolerance have been developed by several national and international bodies. Here we quote the widely accepted ones, developed by the American Diabetes Association (ADA), the World Health Organization (WHO), and the International Association of Diabetes in Pregnancy Study Groups (IADPSG).
1. The ADA and the WHO criteria for the diagnosis of diabetes in nonpregnant persons are the same. They differ slightly, however, in case of definitions of glucose intolerance. The ADA uses the term ‘prediabetes’, whereas the WHO distinguishes IFG and IGT conditions.
2. Criteria for the diagnosis of overt diabetes in pregnancy are set lower than in nonpregnant persons.
3. Interprtetation of OGTT in pregnancy involves fasting glucose concentration and both 1h and 2h post glucose load values, whereas in non-pregnant persons interpretation is based on the fasting and 2h post load values only.
For further details see Nolan et al in Further Reading.
*Formula to convert the conventional (DCCT) HbA1c values to IFCC (SI) units:
Table 9
| Analyte/test | SI units | Conventional units |
| Hemoglobin: | ||
| men | 130-180 g/L | 13.0–18.0 g/dL |
| women | 120-160 g/L | 12.0–16.0 g/dL |
| Hematocrit | 41–46% | 41–46 mL/dL |
| Erythrocytesw cell count: | ||
| men | 4.4–5.9 × 10¹²/L | 4.4–5.9 × 10⁶/mm3 |
| women | 3.8–5.2 × 10¹²/L | 3.8–5.2 × 10⁶/mm3 |
| Mean corpuscular volume (MCV) | 80–96 fL | 80–96 µm3 |
| Leukocytes, total | 4.0–11.0 × 10⁹/L | 4000–11 000/mm3 |
| Leukocytes, differential count: | ||
| neutrophils | 2–7.5 × 10⁹/L | 45–74% |
| lymphocytes | 1.3–4 × 10⁹/L | 16–45% |
| monocytes | 0.2–0.8 × 10⁹/L | 4.0–10% |
| eosinophils | 0.04–0.4 × 10⁹/L | 0.0–7.0% |
| basophils | 0.01–0.1 × 10⁹/L | 0.0–2.0% |
| Platelets | 150–400 × 109/L | 150 000–400 000/mm3 |
| Reticulocytes | 25–75 × 109/L | 0.5–1.5% of erythrocytes |
| Erythrocyte sedimentation rate (ESR) | 2–10 mm/h | |
| Activated partial thromboplastin time (APTT) | 30–40 sec | |
| Prothrombin time (PT) | 10–15 sec | |
| Thrombin clotting time (TCT) | 10–15 sec | |
| Skin bleeding time | 2.0–9.0 min | |
| d-Dimer | <0.25 g/L |
Bakerman, S. Bakerman's ABC of interpretive laboratory data, ed 4. AZ: Scottsdale; 2002.
Burtis, CA, Ashwood, ER, Bruns, DE. Tietz textbook of clinical chemistry and molecular diagnostics, ed 5. Philadelphia: Saunders; 2011.
Dominiczak MH, ed. Seminars in clinical biochemistry. Glasgow: University of Glasgow, 1997.
Stone, NJ, Robinson, J, Lichtenstein, AH, et al, ACC/AHA Prevention Guideline: 2013 ACC/AHA Guideline on the Treatment of Blood Cholesterol to Reduce Atherosclerotic Cardiovascular Risk in Adults: A Report of the American College of Cardiology/American Heart Association Task Force on Practice Guidelines. Circulation 2013; 0. http://circ.ahajournals.org/content/early/2013/11/11/01.cir.0000437738.63853.7a.citation
This most recent guideline (released in November 2013) provides updated recommendations on the use of statins to lower the risk of atherosclerotic cardiovascular events. It recommends that persons with clinical atherosclerotic disease should be treated irrespective of the plasma LDL-cholesterol concentration. Otherwise, initiation of treatment is based on the pre-treatment LDL-cholesterol: therapy should be initiated when LDL-cholesterol equals or exceeds 4.4 mmol/L (190 mg/dl). Persons with diabetes mellitus and with an overall 10-year risk of event equal or above 7.5% should be treated at LDL levels between 1.8 mmol/L (70 mg/dl) and 4.3 mmol/L (169 mg/dL).
The major change compared to the previous guidelines is that this one no longer recommends treatment to a specific LDL-cholesterol ‘target level’. Instead, it suggests 2 statin regimens, instituted depending on the risk of event and the risk of side effects: a high-intensity therapy regimen that lowers LDL-cholesterol by 50% or more, and a moderate intensity treatment, lowering the LDL-cholesterol by 30–50%. See the reference above for details.
American Diabetes Association. Standards of Medical Care in Diabetes – 2012. http://care.diabetesjournals.org/content/35/Supplement_1/S11.full.
Diabetes: update on ADA guidelines 2012. www.aca.org/conferences/winter2012/WorkshopPresentations/A-1D%20Diabetes%20An%20Update%20on%20American%20Diabetes%20Association%20Guidelines.pdf.
Lab Tests Online. www.labtestsonline.org.uk/.
Lab Tests Online. www.labtestsonline.org.uk/understanding/features/ref-ranges/.
National Cholesterol Education Program ATP III Guidelines At-A-Glance Quick Desk Reference. www.nhlbi.nih.gov/guidelines/cholesterol/atglance.pdf.
Nolan, CJ, Damm, P, Prentki, M. Type 2 diabetes across generations: from pathophysioplogy to prevention and treatment. Lancet. 2011; 378:169–181.
SI values conversion calculator. www.amamanualofstyle.com/oso/public/jama/si_conversion_table.html.