Cellular Radiobiology
At the completion of this chapter, the student should be able to do the following:
1 Describe the effects of in vivo irradiation.
2 Describe the principles of target theory.
3 Discuss the kinetics of cell survival after irradiation.
4 Identify the cell survival model that best describes human cells.
5 Name the most radiation sensitive stage of the human cell.
THE EFFECT of radiation on cells results from an elemental ionizing event that changes the target molecule, DNA.
The response of the cell is either cellular transformation or cell death.
Cellular transformation can result in a late stochastic effect at the human level. Cell death can result in an early deterministic effect at the human level.
Most effects on cells result in no response because of recovery and repair metabolic processes. This chapter deals primarily with cell death as a radiation response.
Target Theory
The cell contains many species of molecules, most of which exist in overabundance. Radiation damage to such molecules probably would not result in noticeable injury to the cell because similar molecules would be available to continue to support the cell.
On the other hand, some molecules in the cell are considered to be particularly necessary for normal cell function. These molecules are not abundant; in fact, there may be only one such molecule. Radiation damage to such a molecule could affect the cell severely because no similar molecules would be available as substitutes.
This concept of a sensitive key molecule serves as the basis for the target theory. According to the target theory, for a cell to die after radiation exposure, its target molecule must be inactivated (Figure 32-1).
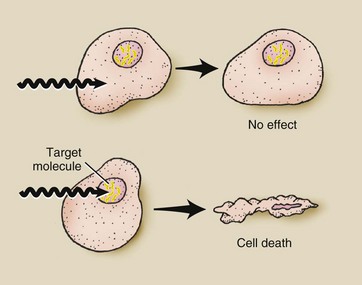
FIGURE 32-1 According to target theory, cell death will occur only if the target molecule is inactivated. DNA, the target molecule, is located within the cell nucleus.
The key molecular target is the DNA. Originally, the target theory was used to represent cell lethality. It can be used equally well, however, to describe nonlethal radiation-induced cell abnormalities.
In the target theory, the target is considered to be an area of the cell occupied by the target molecule or by a sensitive site on the target molecule. This area changes position with time because of intracellular molecular movement.
The interaction between radiation and cellular components is random; therefore, when an interaction does occur with a target, it occurs randomly. No favoritism is seen in radiation to the target molecule. Its sensitivity to radiation occurs simply because of its vital function in the cell.
When radiation does interact with the target, a hit is said to have occurred. Radiation interaction with molecules other than the target molecule also can result in a hit. It is not possible to distinguish between a direct and an indirect hit.
When a hit occurs through indirect effect, the size of the target appears considerably larger because of the mobility of the free radicals. This increased target size contributes to the importance of the indirect effect of radiation.
Figure 32-2 illustrates some of the consequences of using target theory to explain the relationships among linear energy transfer (LET), the oxygen effect (oxygen enhancement ratio [OER]), and direct versus indirect effect. With low-LET radiation, in the absence of oxygen, the probability of a hit on the target molecule is low because of the relatively large distances between ionizing events.
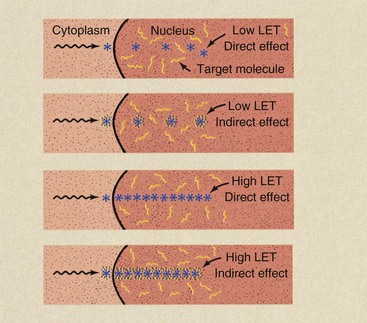
FIGURE 32-2 In the presence of oxygen, the indirect effect is amplified, and the volume of action for low-linear energy transfer (LET) radiation is enlarged. The effective volume of action for high-LET radiation remains unchanged, in that maximum injury will have been inflicted by direct effect.
If oxygen is present, free radicals are formed and the volume of effectiveness surrounding each ionization is enlarged. Consequently, the probability of a hit is increased.
When high-LET radiation is used, the distance between ionizations is so close that the probability of a hit by direct effect is high. When oxygen is added to the system and high-LET radiation is used, the added sphere of influence for each ionizing event, although somewhat larger, does not result in additional hits. The maximum number of hits has already been produced by direct effect with high-LET radiation.
Cell-Survival Kinetics
Early radiation experiments at the cell level were conducted with simple cells, such as bacteria. It was not until the middle 1950s that laboratory techniques were developed to allow the growth and manipulation of human cells in vitro.
One technique for measuring the lethal effects of radiation on cells is shown in Figure 32-3. If normal cells are planted individually in a Petri dish and are incubated for 10 to 14 days, they divide many times and produce a visible colony that consists of many cells. This is cell cloning.
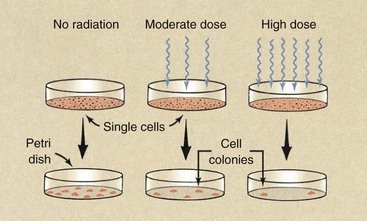
FIGURE 32-3 When single cells are planted in a Petri dish, they grow into visible colonies. Fewer colonies develop if the cells are irradiated.
After irradiation of such single cells, some do not survive; therefore, fewer colonies are formed. A higher radiation dose leads to the formation of fewer colonies.
When a mathematical extension of target theory is used, two models of cell survival result. The single-target, single-hit model applies to biologic targets, such as enzymes, viruses, and simple cells such as bacteria. The multitarget, single-hit model applies to more complicated biologic systems such as human cells.
The following discussion concerns the equation of these models. The mathematics of these models is relatively unimportant but is given here for interested students.
Single-Target, Single-Hit Model
Consider the situation illustrated in Figure 32-4. It is raining on a large concrete runway that contains 100 squares. A square is considered wet when one or more raindrops have fallen on it.
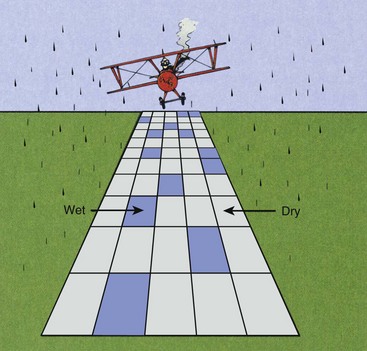
FIGURE 32-4 When rain falls on a dry pavement that consists of a large number of squares, the number of squares that remains dry decreases exponentially as the number of raindrops increases.
When the first drop falls on the pavement, one of the 100 squares becomes wet. When the second drop falls, it will probably fall on a dry square and not on the one already wet. Consequently, two of 100 squares will be wet.
When the third raindrop falls, there will probably be three wet and 97 dry squares. As the number of raindrops increases, however, it becomes more probable that a given square will be hit by two or more drops.
Because the raindrops are falling randomly, the probability that a square will become wet is governed by a statistical law called the Poisson distribution. According to this law, when the number of raindrops is equal to the number of squares (100 in this case), 63% of the squares will be wet, and 37% of the squares will be dry. If the raindrops had fallen uniformly, all 100 squares would become wet with 100 raindrops.
Obviously, many of the 63 squares in this example have been hit twice or more. When the number of raindrops equals twice the number of squares, then 14 squares will be dry. After 300 raindrops, only five squares will remain dry.
Examine a graph of the number of dry squares as a function of the number of raindrops (Figure 32-5). If the number of squares exposed to the rain was large or unknown, the scale on the right, expressed in percent, would be used. Note that the y-axis is logarithmic.
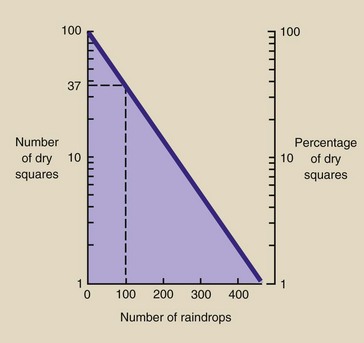
FIGURE 32-5 When the number of dry squares is plotted on semilogarithmic paper as a function of the number of raindrops, a straight line results because when a few drops fall, some squares will be hit more than once.
The wet squares analogy can be extended to the irradiation of a large number of biologic specimens—for example, 1000 bacteria. Bacteria presumably contain a single sensitive site, or target, that must be inactivated for the cell to die. As 1000 bacteria are irradiated with increasing increments of dose, a greater number are killed (Figure 32-6).
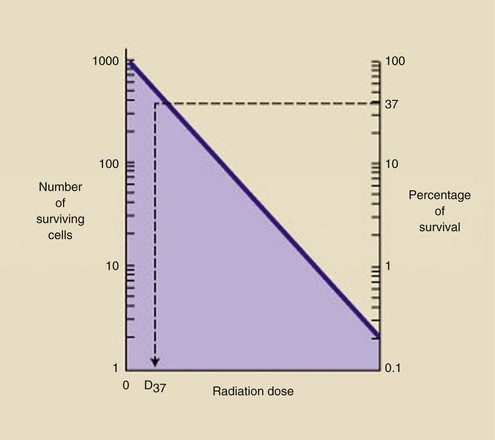
FIGURE 32-6 After irradiation of 1000 cells, the dose-response relationship is exponential. The D37 is the dose that results in 37% survival.
Just as with the wet squares, however, as the dose increases, some cells will sustain two or more hits. All hits per target in excess of one represent wasted radiation dose because the bacteria had been killed already by the first hit.
 A hit is not simply an ionizing event but rather an ionization that inactivates the target molecule.
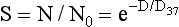
When the radiation dose reaches a level sufficient to kill 63% of the cells (37% survival), it is called D37. After a dose equal to 2 × D37, 14% of the cells would survive, and so forth. D37 is a measure of the radiosensitivity of the cell. A low D37 indicates a highly radiosensitive cell, and a high D37 reveals radioresistance.
If there were no wasted hits (uniform interaction), D37 is the dose that would be sufficient to kill 100% of the cells.
The equation that describes the dose-response relationship represented by the graph in Figure 32-4 is the single-target, single-hit model of radiation-induced lethality as follows:
Multitarget, Single-Hit Model
Returning to the wet squares analogy, suppose that each pavement square were divided into two equal parts, two targets (Figure 32-7). By definition, each half now must be hit with a raindrop for the square to be considered wet. The first few raindrops probably will hit only one half of any given square; therefore, after a very light rain, no squares may be wet.
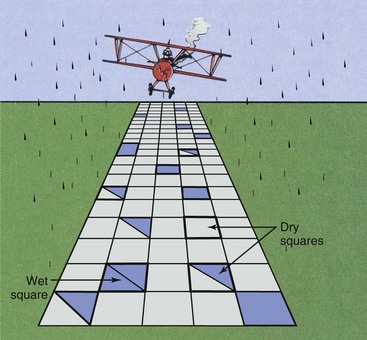
FIGURE 32-7 If each pavement square has two equal parts, each part must be hit for the square to be considered wet.
Many raindrops must fall before any single square suffers a hit in both halves so that it can be considered wet. This represents a threshold because, according to our definition, a number of raindrops can fall, and all squares will remain dry. As the number of raindrops increases, eventually some squares will have both halves hit and therefore will be considered wet. This portion of the curve is represented by region A in Figure 32-8.
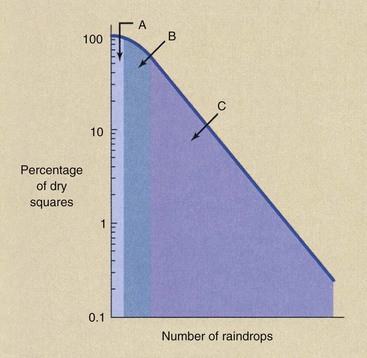
FIGURE 32-8 When a square contains two equal parts, both of which have to be hit to be considered wet, three regions of the dry square versus raindrops relationship can be identified.
When a large number of raindrops have fallen, region C will be reached, where every square will be at least half wet. When this occurs, each additional raindrop will produce a wet square. In region C, the relation between number of raindrops and wet squares is that described by the single-target, single-hit model. The intermediate region B is the region of accumulation of hits.
Complex biologic specimens such as human cells are thought to have more than a single critical target. Suppose that the human cell has two targets, each of which has to be inactivated for the cell to die. This would be analogous to the square having two halves, each of which had to be hit by rain for it to be considered wet. Figure 32-9 is a graph of single-cell survival for human cells that have two targets.
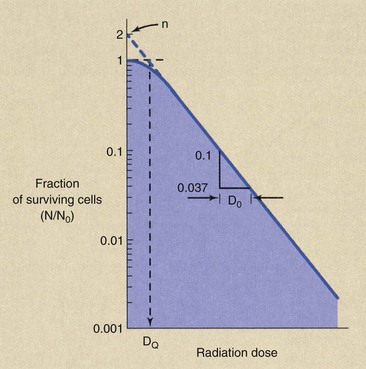
FIGURE 32-9 The multitarget, single-hit model of cell survival is characteristic of human cells that contain two targets.
At very low radiation doses, cell survival is nearly 100%. As the radiation dose increases, fewer cells survive because more sustain a hit in both target molecules.
At a high radiation dose, all cells that survive have one target hit. Therefore, at still higher doses, the dose-response relationship would appear as the single-target, single-hit model.
The model of cell survival just described is the multitarget, single-hit model as follows:
 Multitarget, Single-Hit Model
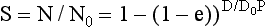
where S is the surviving fraction, N is the number of cells surviving a dose D, N0 is the initial number of cells, D0 is the dose necessary to reduce survival to 37% in the straight-line portion of the graph, and n is the extrapolation number.
The D0 is called the mean lethal dose and is a constant related to the radiosensitivity of the cell. It is equal to D37 in the linear portion of the graph and therefore represents the dose that would result in one hit per target in the straight-line portion of the graph if no radiation were wasted.
A large D0 indicates radioresistant cells, and a small D0 is characteristic of radiosensitive cells.
The extrapolation number is also called the target number. When this type of experiment was first conducted with human cells, the observed extrapolation number was 2. That result agreed with the hypothesis that similar regions on two homologous chromosomes (an identical pair) had to be inactivated to produce cell death. Because chromosomes come in pairs, the experimental results confirmed the hypothesis.
Subsequent experiments, however, have resulted in extrapolation numbers ranging from 2 to 12, and therefore the precise meaning of n is unknown.
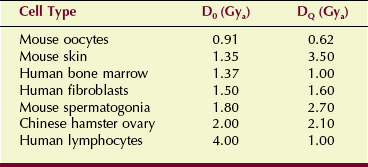
The DQ is called the threshold dose. It is a measure of the width of the shoulder of the multitarget, single-hit model and is related to the capacity of the cell to recover from sublethal damage. Table 32-1 lists reported values for D0 and D0 for various experimental cell lines.
Recovery
The shoulder of the graph of the multitarget, single-hit model shows that for mammalian cells, some damage must be accumulated before the cell dies. This accumulated damage is called sublethal damage. The wider the shoulder, the more sublethal damage that can be sustained and the higher the value of DQ.
Figure 32-10 demonstrates the results of a split-dose irradiation designed to describe the capacity of a cell to recover from sublethal damage. This illustration shows a rather typical human cell survival curve with D0 = 1.6 Gyt (160 rad), DQ = 1.1 Gyt (110 rad), and n = 2. If one takes those cells that survive any large dose (e.g., 4.7 Gyt) and reincubates them in a growth medium, they will grow into another large population.
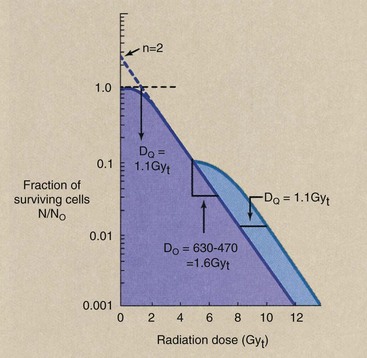
FIGURE 32-10 Split-dose irradiation results in a second cell survival curve with the same characteristics as the first and displaced along the dose axis by DQ.
This new population of cells then can be used to perform a second cell survival experiment. When the cells that survived the first dose are subsequently subjected to additional incremental radiation doses, a second dose-response curve is generated that has precisely the same shape as the first.
After such a split occurs, the extrapolation number is the same, the mean lethal dose is the same, and the second dose-response curve is separated along the dose axis from the first dose-response curve by DQ. For full recovery to occur, the time between such split doses must be at least as long as the cell generation time, usually 24 hours.
Such experiments show that cells that survive an initial radiation insult exhibit precisely the same characteristics as nonirradiated cells; therefore, the surviving cells have fully recovered from the sublethal damage produced by the initial irradiation.
DQ is a measure of the capacity to accumulate sublethal damage and the ability to recover from sublethal damage.
| Question: | From Figure 32-10, estimate the overall surviving fraction for a cell receiving a split dose of 4 Gyt followed by 4 Gyt. |
| Answer: | At a dose of 4 Gyt, approximately 0.15 of the cells survive. Therefore, at a split dose of 4 Gyt and 4 Gyt, the surviving fraction should equal 0.15 × 0.15 = 0.023. |
The total dose is 8 Gyt (800 rad), and the surviving fraction on the split-dose curve at 8 Gyt should equal 0.023, and it does. If the 8 Gyt had been delivered at one time, the surviving fraction would have been 0.012, as is shown by the single-dose curve of Figure 32-10.
Cell-Cycle Effects
When human cells replicate by mitosis, the average time from one mitosis to another is called the cell-cycle time or the cell generation time. Most human cells that are in a state of normal proliferation have generation times of approximately 24 hours.
Some specialized cells have generation times that extend to hundreds of hours, and other cells, such as neurons (nerve cells), do not normally replicate. Longer generation times primarily result from lengthening of the G1 phase of the cell cycle.
A randomly growing population of cells that are uniformly distributed in position throughout the cell cycle can be synchronized in various ways. A population of synchronized cells then can be subdivided into smaller populations and irradiated sequentially as they pass through the phases of the cell cycle.
Figure 32-11 represents results obtained from human fibroblasts. The fraction of cells that survive a given dose can vary by a factor of 10 from the most sensitive to the most resistant phase of the cell cycle.
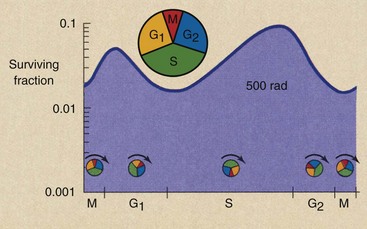
FIGURE 32-11 The age response of human fibroblasts after irradiation shows minimum survival during the M phase and maximum survival during the late S phase. Such cells are most radiosensitive during mitosis and most radioresistant during the late S phase.
This pattern of change in radiosensitivity as a function of phase in the cell cycle is the age-response function, and it varies among cells. Cells in mitosis are always most sensitive. The fraction of surviving cells is lowest in this phase. The next most sensitive phase of the cell cycle occurs at the G1–S transition. The most resistant portion of the cell cycle is the late S phase.
Linear Energy Transfer, Relative Biologic Effectiveness, and Oxygen Enhancement Ratio
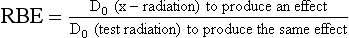
Mammalian cell survival experiments have been used extensively to measure the effects of various types of radiation and to determine the magnitude of various dose-modifying factors, such as oxygen. Because the mean lethal dose, D0, is related to radiosensitivity, the ratio of D0 for one condition of irradiation compared with another is a measure of the effectiveness of the dose modifier, whether it is physical or biologic.
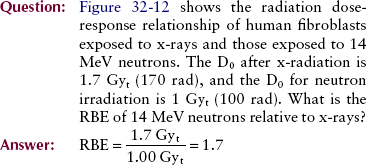
If the same cell type is irradiated by two different radiations under identical conditions, results may appear as in Figure 32-12. At very high LET (as with alpha particles and neutrons), cell-survival kinetics follow the single-target, single-hit model. With low-LET radiation (x-rays), the multitarget, single-hit model applies.
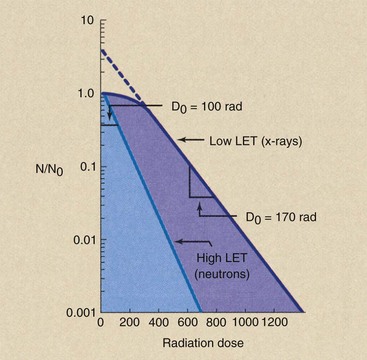
FIGURE 32-12 Representative cell-survival curves after exposure to 200-kVp x-rays and 14-MeV neutrons.
The mean lethal dose after low-LET irradiation is always greater than that after high-LET irradiation. If the low-LET D0 represents x-rays, then the ratio of one D0 to another equals the relative biologic effectiveness (RBE) for the high-LET radiation as follows:
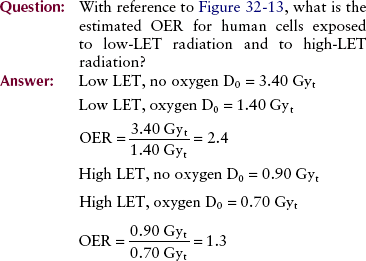
The most completely studied dose modifier is oxygen. The presence of oxygen maximizes the effect of low-LET radiation. When anoxic cells are exposed, a considerably higher dose is required to produce a given effect.
With high-LET radiation, little difference is noted between the response of oxygenated cells and that of anoxic cells. Figure 32-13 shows typical cell-survival curves for each of these combinations of LET and oxygen.

FIGURE 32-13 Cell-survival curves for human cells irradiated in the presence and the absence of oxygen with high- and low-linear energy transfer (LET) radiation.
Such experiments are designed to measure the magnitude of the oxygen effect. The OER determined from single-cell survival experiments is defined as follows:
Summary
The concept of a sensitive key molecule within a cell serves as the basis for the target theory. For a cell to die after radiation exposure, the target molecule, DNA, must be inactivated.
Radiation exposure results in two models of cell survival. The single-target, single-hit model applies to simple cells such as bacteria. The multitarget, single-hit model implies a dose threshold. However, at higher doses, the relationship becomes a single-hit, single-target model. Experiments in cell recovery show that cells can recover from sublethal radiation damage.
1. Define or otherwise identify the following:
2. What type of interaction with tissue results in a hit?
3. What are the phases of the cell cycle?
4. If x-rays interacted uniformly and D0 = 1 Gyt, How many cells would survive 1 Gyt?
5. Why do radiobiologists synchronize human cells?
6. Instead of cell survival, why don’t we measure cell death?
7. What are the three numerical parameters attendant to multitarget, single-hit kinetics?
8. What single cell survival parameter best represents the number of targets in a cell?
9. Describe the relationship between RBE and OER.
10. What happens to radiation-induced free radicals within the cell?
11. What is the target theory of radiobiology?
12. Does radiation interact with tissue uniformly or randomly?
13. Draw cell-survival curves to show the difference between irradiation with low-LET and high-LET radiation.
14. What is the difference between in vitro and in vivo?
15. Which single cell survival parameter best represents a cell’s ability to recover from sublethal damage?
16. The D37 of a cellular species that follows the single-target, single-hit model is 1.5 Gyt. What percentage of cells will survive 4.5 Gyt?
17. What is the RBE of alpha radiation if the D0 is 400 mGyt compared with 1.8 Gyt for x-rays?
18. What is the difference between direct effect and indirect effect?
19. How does the radiosensitivity of human cells vary with stages of the cell cycle?
20. Draw cell-survival curves to show the difference between low-LET irradiation of aerobic cells and anoxic cells.
The answers to the Challenge Questions can be found by logging on to our website at http://evolve.elsevier.com.