4 Pharmacokinetics and Pharmacodynamics
 Be sure to check out the supplementary content available at http://evolve.elsevier.com/Hazinski.
Pearls
• Pharmacokinetics describes how the body alters drug concentration, including how the drug is dispersed in and removed from the body; it is the effect that the body has on the drug. Pharmacokinetics involves drug absorption, distribution, and elimination.
• Pharmacodynamics describes the relationship between drug concentration and drug effect; it is the effect the drug has on the body.
• The steady state is a state of equilibrium between how much of the drug is administered and how much is being removed from the body. In drugs with first-order kinetics (i.e., the systems that eliminate the drug are not saturated), steady state can be predicted from the drug half-life (t1/2).
• The drug half-life is the time it takes for half of the drug to be eliminated from the body. In each half-life, the drug concentration in the blood will fall by half. You can use the half-life to predict the time to steady state and to know when to anticipate drug effects or changes in effects.
• In general, when administering a drug by continuous infusion, a blood concentration of 90% of steady-state value is achieved in approximately four to five half-lives of the drug. Drugs with long half-lives will require a longer time to achieve steady state unless a loading dose is provided.
Introduction
Many drugs used in critical care, particularly vasoactive and sedative agents, must be titrated based on patient response, and both pharmacokinetics and pharmacodynamics influence that response. Pharmacokinetics describes how the body alters drug concentration, including how the drug is dispersed in and removed from the body; it is the effect that the body has on the drug. Pharmacodynamics describes the relationship between drug concentration and drug effect; it is the effect the drug has on the body.
The purpose of this chapter is to highlight principles governing both pharmacokinetic and pharmacodynamic processes and how they affect clinical decisions. This chapter is not intended to be a drug reference; it is a reference regarding principles of drug therapy.
Principles of pharmacokinetics
The effects of drug administration vary with both the drug and the patient. There have been many attempts to model these processes using mathematical equations to guide clinical therapy. In addition, understanding of developmental changes in drug metabolism and excretion and emerging information about pharmacogenetics enable more accurate prediction of pediatric drug dosing and effects.2-5
Paths of Drugs in the Body
The path of a drug in the body from administration and distribution to elimination is complex. We can break this path into individual components for better understanding (Fig. 4-1).
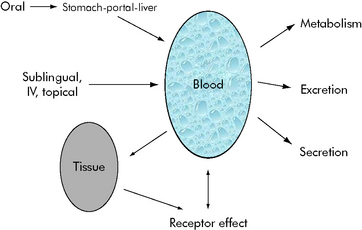
Fig. 4-1 Possible paths of drugs in the body from entry to distribution and elimination. A drug will follow some of these pathways. Drug effects are caused by blood concentration, tissue concentrations, or both.
(Courtesy William Banner, Jr.)
Drug Absorption
Drugs are administered and absorbed by several routes. Bioavailability refers to the fraction of administered drug that reaches the circulation (blood); it is affected by the route of administration. The bioavailability of drugs administered orally can be altered in pediatric patients by developmental changes in the gastric pH. The gastric pH is relatively neutral in the neonate and it becomes more acidic as the child grows. In addition, some drugs (e.g., meperidine) when taken orally, are rapidly metabolized by the liver before they reach the general circulation; this is termed first pass metabolism and it reduces drug bioavailability.
Drugs administered intravenously can also be affected by the site of administration. Drugs administered through an umbilical vein catheter can flow directly into the portal circulation, where they can damage the liver. Administration of a drug into an umbilical artery catheter can cause drug precipitation in the kidneys or lower extremity vascular damage.
Drug Distribution
Drug distribution is affected by factors such as protein binding, lipid solubility, and ionization state, and by conditions such as blood pH, temperature, and other substances in the blood (e.g., blood urea nitrogen [BUN], other drugs). The volume of distribution is the ratio of the concentration of drug in the blood to the total amount of drug in the body. For example, gentamicin has a small volume of distribution; it is principally found in the blood. In contrast, digoxin undergoes widespread distribution to tissues, so the concentration in the blood represents only a fraction of the total body stores (i.e., it has a large volume of distribution). Gentamicin and digoxin are both removed by similar processes in the kidney, but the rates of elimination of the two drugs differ because the amount that is present in the blood affects how quickly the kidneys can remove the drug.
The drug’s site of action can also help predict how drug distribution will affect its efficacy and safety. Shortly after the intravenous administration of digoxin, blood concentrations can be extremely high, but the patient will not exhibit toxicity because digoxin acts on the cardiac muscle. As the blood drug concentration decreases and concentrations in the tissue (including the heart muscle) increase, the likelihood of a toxic effect increases. It is only after the drug is distributed into tissue that blood concentrations can be used to predict the likelihood of a beneficial or toxic effect.
Drug Elimination
Drugs are eliminated from the body in several ways. Some drugs such as ethyl alcohol can be exhaled through the lungs. The most common routes of elimination, however, are through the kidney and the liver. In the kidney, drugs can be filtered in the glomerulus or secreted by tubular cells. The most common method of renal excretion is through filtration. In general, the liver metabolizes drugs to change their solubility so they can be excreted through the biliary tract or the kidney.
A small number of drugs are broken down by enzymes present in plasma. These drugs, including succinylcholine, produce very short-term effects. A few drugs, such as cisatracurium, spontaneously degrade in the blood.
Mathematical modeling of drug paths
Mathematical models of drug kinetics (including elimination), called kinetic modeling, have identified several general patterns of drug behavior. The Michaelis-Menten equation describes drug kinetics, including drug elimination. According to the Michaelis-Menten equation, when the enzyme that metabolizes a drug is not saturated (i.e., there is plenty of enzyme still available to metabolize even more drug than is present), drug elimination will vary based on how quickly the drug is presented to the enzyme. If the enzyme is fully saturated (i.e., all available enzyme is being used to metabolize the drug), then drug elimination will occur at a fixed rate.
Michaelis-Menten Kinetics
A common drug governed by Michaelis-Menten kinetics is phenytoin. With even a single dose of phenytoin, the enzymes that metabolize the drug (the cytochrome P450 enzymes) are typically saturated, so the phenytoin blood concentration will initially fall slowly after administration. However, once the blood concentration falls sufficiently, the enzymes responsible for metabolism are no longer saturated and the blood concentration will then fall quickly (Fig. 4-2, curve A). Giving too much of a drug initially or giving additional doses too soon can increase the drug concentration and risk of toxicity and prolong effects and elimination time. Implications of phenytoin kinetics with repeated dosing are discussed in the next section.
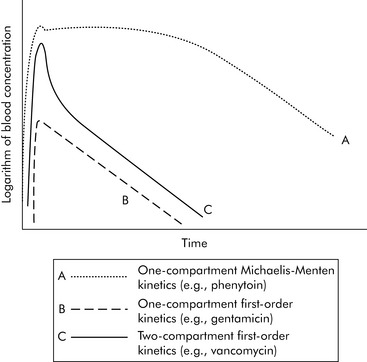
Fig. 4-2 Three general models of drug elimination. After a single dose of a drug is given, the graph of the logarithm (log) of blood concentration produced over time varies based on drug distribution and elimination (kinetics). Curve A: If the drug is primarily distributed in the blood (e.g., phenytoin) and is eliminated by enzyme systems, it demonstrates one-compartment Michaelis-Menten kinetics as shown. The log of the blood concentration over time initially declines slowly until some enzyme systems are no longer saturated. From that time, the concentration will fall more rapidly. Curve B: If the drug is largely distributed in the blood (one compartment) and the elimination systems have plenty of capacity (first-order kinetics), the graph of the log of blood concentration over time will be an inverted V. The concentration rises in a straight line and then declines in a straight line. The log of the drug concentration will fall by half during each half-life of the drug. Curve C: Drugs distributed in the tissues (e.g., vancomycin) typically demonstrate two-compartment kinetics. Immediately after administration the concentration rises. As the drug is distributed into the tissues the drug concentration falls rapidly (the first part of the downward curve). As the drug is eliminated, the drug level falls more gradually.
(Courtesy William Banner, Jr.)
First Order Kinetics
One extreme of the Michaelis-Menten equation occurs when the kidney or the liver is functioning well below its capacity to remove the drug and there is little risk of overloading the system. This extreme is referred to as first-order kinetics.
With first-order kinetics, drugs behave similarly to radioactive decay, and elimination is described in terms of the drug’s half-life (t1/2). The drug half-life is the time it takes for half of the drug to be eliminated from the body. When a half-life is listed in a drug database, the drug has first-order kinetics (see section, Half-life). See Box 4-1 for a metaphor to further explain first- and zero-order kinetics. Many of the principles described in the following sections (e.g., time to study state, volume of distribution, filtration rates) apply chiefly to drugs with first-order kinetics.
Box 4-1 Metaphor for Understanding First Order and Zero-Order Kinetics
Another way to conceptualize first-order kinetics for drug elimination is to compare drug metabolism to customers going through checkout lanes at a store. A group of cashiers has a certain capacity to process customers, much as the liver processes or metabolizes a drug. If the number of cashiers is sufficiently high, when a customer appears that customer will be processed immediately. As long as the number of cashiers exceeds the number of customers presenting at the checkout lanes, the number of customers processed through the checkout lanes will be determined by the number of customers who are present at the checkout lanes. Renal filtration or excretion and liver metabolism typically have sufficient capacity, so they have capacity (“cashiers”) available at all times to eliminate many drugs. This is called first-order kinetics.
If the capacity to process or metabolize the drug is saturated, then the rate of drug metabolism will become constant and if drug administration exceeds the rate of metabolism, the drug will begin to accumulate. Using the cashier metaphor, if the number of customers exceeds the available cashiers, the rate that customers are processed will become constant (for example, 10 customers/h), regardless of how many customers are waiting. The customers will accumulate if the number of customers exceeds the number of cashiers and the customers appear at the checkout line at a rate that is faster than they can be processed. If the capacity to metabolize the drug is saturated (zero-order kinetics) drug concentrations will increase in a manner similar to customer accumulation at the cashiers.
Volume of Distribution
Volume of distribution can be used to predict the drug concentration achieved with a drug loading dose. As noted previously, a drug like gentamicin has a low volume of distribution (it remains in the blood), so effective blood concentrations are quickly established without the need for a loading dose. By comparison, when administering a drug like digoxin, with a high volume of distribution, a relatively large initial loading dose must be given to achieve reasonable blood concentration after tissue distribution.
The volume of distribution is generally expressed as a liquid volume per body weight, such as liters per kilogram (L/kg) or milliliters per kilogram (mL/kg). The volume of distribution is used to calculate loading doses for drugs such as phenytoin, for which a loading dose of 20 mg/kg is administered to occupy the volume of distribution (0.7 L/kg) and achieve a therapeutic blood (serum) concentration.
Although it is tempting to relate anatomic places to the mathematical concept of compartments for drug distribution, the characterization is not entirely accurate. In general, we consider the group of tissues into which the drug distributes at a similar rate as occupying the same compartment, because the tissues all receive the drug at the same time.
Generally speaking, when injecting an intravenous drug, the first compartment it occupies is the blood. If the drug is primarily distributed in the blood (e.g., gentamicin), that is where the drug remains until it is eliminated; these kinetics are described as one-compartment kinetics. The graph of the logarithm of blood concentration over time shows a rise when the drug is administered and a straight line as the drug is eliminated (see Fig. 4-2, curve B).
If a drug is distributed in the blood and the tissues (e.g., vancomycin), intravenous administration temporarily increases the concentration of the drug in the blood. Initially, blood levels decline rapidly as the drug moves into tissue, and then a more gradual decline occurs as the drug is eliminated. This drug activity is called two-compartment kinetics (see Fig. 4-2, curve C).
Implications of Multicompartment Distribution
Drugs can disappear rapidly from the blood if they are distributed in the tissue. The best example of this is sodium thiopental (Pentothal). In clinical practice, a single dose of intravenous thiopental has a short effect. However, the drug has a long final half-life. The explanation for this apparent contradiction is that most thiopental elimination occurs after the drug concentration is below the level needed to keep the patient asleep (i.e., anesthetized). If several doses of thiopental are administered in a short period of time in an attempt to produce anesthesia, the tissues will become saturated and no distribution will occur. If the drug concentration increases to sufficiently high levels, the clinical effect (i.e., anesthesia) may last a long time (see Fig. 4-3).
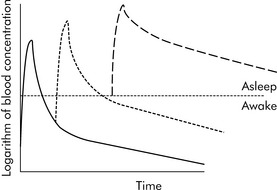
Fig. 4-3 Thiopental accumulation in body compartments: single versus multiple doses. Drugs that appear to have a short duration of action may simply be rapidly distributed into tissue, allowing patients to recover from the drug effects. When pentothal is given in a single dose (solid curve), the drug concentration rises rapidly and then falls rapidly as the drug is distributed into the tissues; as a result, the patient will wake in a short time. If an additional dose is given within a short time (dotted curve), the drug effects last for a longer time. If several doses are administered over a short time, the tissues can become saturated and the drug does not have a rapid distribution phase (dashed curve). The drug accumulates in the blood (i.e., concentration is high), elimination takes more time, and the patient will take much longer to wake. The kinetics of fentanyl are similar.
(Courtesy William Banner, Jr.)
Fentanyl also has a relatively short clinical half-life when administered as a single injection. However, if continuous infusions are used over a period of days, the drug will soon have an elimination half-life of 24 hours, meaning that it will take an extended period of time for the drug levels to decrease sufficiently so the patient wakes up. This long ultimate half-life is sometimes referred to as the beta half-life.
Drug Clearance
The clearance of a drug is a measure of how quickly the drug is eliminated. Whereas half-life describes the rate of decline in drug concentration, and volume of distribution indicates where the drug is located in the body, the overall drug clearance is mathematically related to both half-life and volume of distribution. In clinical practice, half-life and clearance are used almost interchangeably, because it is unusual for the volume of distribution of a drug to change for any given drug, but many changes in development and disease states affect the drug half-life and therefore drug elimination. When comparing different drugs, it is appropriate to speak of clearance as a true measure of how a drug is eliminated from the body.
Frequently Used Terms
Drug concentration is affected by drug administration rate and dose, drug absorption and drug elimination. To evaluate a drug concentration, providers must be familiar with common terms such as half-life, steady state, and loading dose, and they must be familiar with drug metabolism and excretion patterns.
Half-Life
As noted previously, the drug half-life is the time required for half of the drug to be eliminated from the body. In each half-life, the drug concentration in the blood will fall by half. For example, if gentamicin has a 2-hour half-life, this means that the blood concentration will halve in 2 hours; and halve again in 2 more hours, and halve again 2 hours later. Six hours after administration, the blood concentration of a drug with a 2-hour half-life will be 12.5% of the initial drug concentration. The half-life of a drug can be found in many drug data bases.
Steady State
When multiple doses of any medication are given, there is a period of accumulation before the drug reaches what is referred to as steady state. The steady state is a state of equilibrium between the amount of drug administered and the amount of drug being removed from the body. In drugs with first-order kinetics (i.e., the systems that eliminate the drug are not saturated), steady state can be predicted from the drug half-life. When a drug is administered as a continuous infusion, 50% of steady state is achieved during the first half-life of the drug. By the end of the second half-life of the drug, 75% of steady state will be achieved. If there is a need to achieve steady state more rapidly, administer a bolus prior to initiation of the drug infusion (see section, Bolus Plus Infusion Kinetics). Note that the average blood concentration at which steady state ultimately is achieved is the same regardless of whether the drug is given by continuous infusion or intermittent dosing (see Fig. 4-4).
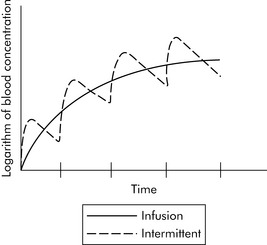
Fig. 4-4 Time to steady-state concentration. Steady-state concentration is achieved after four to five half-lives of the drug (each vertical hatch mark on the time line represents one half-life of the drug) whether the drug is administered by continuous infusion (solid line) or intermittently (dashed line). The time to equilibrium and the blood concentration associated with steady state varies as the result of the drug actions, distribution, interactions, and factors affecting drug elimination.
(Courtesy William Banner, Jr.)
Clinical Examples
Several clinical examples demonstrate the range of time to steady state in drugs given by continuous infusion. Dopamine has a half-life of 1 to 2 minutes. During continuous infusion, dopamine reaches a steady-state value in the first 4 to 10 minutes of administration (four to five times the half-life of 1 to 2 minutes). By comparison, phenobarbital has a half-life of approximately 30 to 60 hours. Therefore, if phenobarbital is given by continuous infusion without a loading dose, it may take days or weeks to reach a steady-state concentration.
In patients with normal renal function, drugs such as aminoglycosides (e.g., gentamicin) have a half-life of approximately 2 hours; such drugs reach a steady state at around 8 to 10 hours, or by about the time of the second dose. However, in a patient with renal failure, the half-life of gentamicin can increase beyond 10 hours; it may take several days to achieve steady state.
Loading Doses
A loading dose is a dose administered to help achieve steady state of a drug. As stated above, loading doses are based on the volume of distribution of the drug. A loading dose is more likely to be recommended for drugs that have long half-lives, such as phenobarbital, because it would take too long (four to five half-lives of such a drug) to achieve steady state. The drug effects and side effects also influence whether and how a loading dose should be administered. For example, when digoxin is administered intravenously, patients will not tolerate administration of the entire digitalizing loading dose at one time, because such a loading dose would produce extremely high serum concentrations that could cause adverse effects.
The loading dose and maintenance dose are mathematically distinct and do not predict one another. As noted previously, the maintenance dose is the dose needed to maintain the blood level required to produce clinical effect.
Many drugs have a similar volume of distribution (L/kg or mL/kg body weight) for neonates and for adults. However, because neonates have limited ability to eliminate drugs, drugs given to the neonate will have longer half-life and lower clearance than when the same drugs are administered to adults. Although loading doses for some drugs can be similar (per kilogram body weight) for neonates and adults, neonates will likely require lower maintenance doses.
Bolus Plus Infusion Kinetics
Critical care nurses often administer analgesics, sedatives, and vasoactive agents by continuous infusion, and these drugs are titrated to clinical effect. As a result, nurses should be familiar with the effects of continuous infusions and loading doses on drug concentration, as shown in Fig. 4-5.
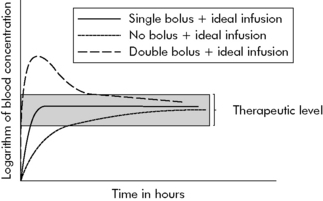
Fig. 4-5 Bolus plus infusion kinetics. The concentration of drug reaches steady state (in this case, synonymous with therapeutic level shaded in grey) in several different ways over different time courses. When a continuous infusion is provided without a loading dose (dotted line), the drug will achieve steady state over approximately four to five half-lives of the drug. The solid line depicts the relationship of the logarithm (log) of blood concentration over time when a bolus dose plus continuous infusion is provided. The bolus dose helps to rapidly achieve steady state (in this example, synonymous with therapeutic drug concentration), and the continuous infusion has been calculated to keep the blood concentration within the therapeutic ranges. If two boluses are given (such as in the operating room to produce deep sedation) before the continuous infusion is provided (see dashed line), the initial concentration will be higher than after a single dose, and it will remain elevated for a longer period of time. The final steady-state concentration is the same whether one or more boluses are administered, provided the clearance is equal.
(Courtesy William Banner, Jr.)
As noted previously, if a drug is administered by either loading dose or continuous infusion, drug concentration will increase over time and achieve 90% of steady state over approximately four to five half-lives of the drug.
To avoid a delay in the onset of effective therapy by continuous infusion, a bolus dose can be given. The bolus dose is followed by the continuous infusion. Note that the same steady-state concentration will ultimately be achieved whether or not a bolus is given; the bolus shortens the time required to achieve this steady state.
A continuous infusion may be erroneously referred to as a maintenance dose. However, the continuous infusion will not maintain the therapeutic level if the infusion is not correctly calculated in light of elimination and other factors affecting blood concentration.
If the patient is unable to eliminate a drug normally (i.e., the patient has a decrease in clearance), a continuous infusion can contribute to drug accumulation (i.e., an elevated steady-state concentration) and toxicity. This can occur, for example, when a neonate is given the same bolus plus infusion dose as an older child. See section, Additional Factors Affecting Drug Elimination for further information.
Michaelis-Menten or Non-linear Kinetics and Dosing
A few common drugs do not obey the basic rules of steady-state equilibrium and can produce toxicity in unexpected ways. The most common of these is phenytoin and its precursor fosphenytoin. At low concentrations, phenytoin has a predictable relationship of dose to steady-state concentration (Fig. 4-6). However, as the dose increases, enzymes that normally inactivate the drug eventually become saturated. At that point, the steady-state concentration begins to rise out of proportion to the increase in dose, and even small increases in dose are then likely to substantially increase drug concentration and produce toxicity.
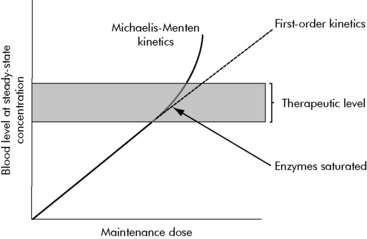
Fig. 4-6 Phenytoin Michaelis-Menten kinetics. This graph depicts the relationship between maintenance dose and steady state dose with phenytoin, a drug with Michaelis-Menten kinetics. For drugs with first-order kinetics (i.e., enzymes or systems that metabolize or inactivate the drug are not saturated), an increase in maintenance dose will produce a linear increase in steady-state concentration (see initial portion of solid line and continuation in dashed line). This is not the case for phenytoin and other drugs that demonstrate Michaelis-Menten kinetics. Once the enzymes that metabolize the drug are fully saturated (arrow), any increase in maintenance dose will produce a significant rise in steady-state concentration (solid line above grey therapeutic level). Other drugs such as salicylate and theophylline demonstrate similar kinetics.
(Courtesy William Banner, Jr.)
Total versus free concentration
The drug concentration typically measured in the clinical laboratory is the total concentration of drug present in blood (actually in the serum). For most drugs it is adequate to monitor the blood/serum concentration when monitoring effects and when toxicity is a concern. Some drugs, however, bind avidly to protein binding sites in the serum. For these drugs, the drug level that most closely correlates with drug benefits and side effects is the “free” concentration of drug—that is, the concentration of drug that is not bound to protein.
Anticonvulsants, particularly phenytoin, have a high degree of protein binding; typically approximately 10% of the drug is free in the serum. It is only this unbound fraction that passes through the blood brain barrier and produces effects in the brain. For these drugs, at a blood concentration of x, the actual active amount of drug available is only 10% of x.
If protein binding sites are diminished (e.g., in hypoalbuminemia) or protein binding sites are occupied by another substance (e.g., BUN), the percent of free or unbound drug available at a given total concentration can be higher than normal. Thus, a patient with a normal amount of protein binding can exhibit therapeutic effects at a given concentration, but that same patient can develop toxic effects at the same total concentration if they develop conditions producing a higher amount of free drug (see Evolve Fig. 4-1 in the Chapter 4 Supplement on the Evolve Website).
When evaluating the concentration of drugs such as phenytoin, providers can request that the laboratory measure only the free, or unbound, concentration if conditions such as a low albumin or high BUN are present. This free portion is interpreted with a different therapeutic scale, usually available from the clinical laboratory.
Additional factors affecting drug elimination
The rate of drug excretion can accelerate or decelerate and still be considered a first-order (nonsaturated) model. Many developmental factors, diseases, and additional drugs can affect enzyme and organ function and influence the rate of drug metabolism
Maturation of Kinetic Processes
Developmental changes associated with hepatic drug metabolism and renal secretion or filtration can accelerate or decelerate drug elimination. Several metabolic processes mature during the first months of life (Fig. 4-7); many drug elimination pathways continue to mature during the first years of life. Failure to recognize these developmental changes in children can lead to drug complications.
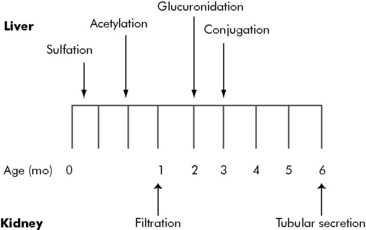
Fig. 4-7 Maturation of drug elimination in infants. Drug elimination in newborns changes rapidly as a result of maturation in liver and kidney function. Providers must consider the immaturity of the newborn’s drug elimination systems when drugs are prescribed.
(Courtesy William Banner, Jr.)
By the end of the first year of life, liver metabolism and drug clearance is similar to that reported in older children and adults. The child’s glomerular filtration rate does not reach adult levels (in mL/min per m2 body surface area) until approximately 3 years of age (Table 4-1)1,6.
Table 4-1 Changes in Glomerular Filtration Rate with Age
| Age | Glomerular Filtration Rate (mL/min per 1.73 m2) |
| Premature infant | 6 |
| Full-term newborn | 8-60 |
| 1 month | 26-90 |
| 1 year | 63-150 |
| 3 years | 89-179 |
| 6 years | 79-170 |
| Adult male | 110-152 |
Consistent with values from Barakat AY, Ichikawa I: Laboratory data. In Ichikawa I, editor: Pediatric textbook of fluids and electrolytes, Baltimore, 1990, Williams and Wilkins; and Tan JM: Nephrology. In Custer JW, Rau RE, editors: The Johns Hopkins Hospital Harriet Lane Handbook, ed 18, Philadelphia, 2009, Mosby-Elsevier.
Clinical Factors Affecting Drug Metabolism
Many factors affect drug metabolism. Metabolism of one drug can slow when other drugs interact or interfere with the enzyme systems that normally inactivate that drug. Drug metabolism is also likely to be slowed if the liver is injured or if it is involved in other processes, such as handling bilirubin. For drugs to be metabolized by the liver, they have to circulate to and through the liver. Fentanyl toxicity can occur when increased intraabdominal pressure decreases blood flow to the liver; the decreased liver circulation slows metabolism and prolongs the terminal half-life of the drug.
Drug elimination can be accelerated by the introduction of drugs such as phenobarbital that induce metabolism. As a result, it can be challenging to regulate levels of drugs such as anticonvulsants that are administered simultaneous with phenobarbital.
Pharmacogenetics
The emerging field of pharmacogenetics is adding new information that is critical to our understanding of drugs. Cells of the liver use the cytochrome P450 system to metabolize drugs. This cytochrome P450 system collaborates with many other systems, such as glucuronidation and acetylation, to metabolize drugs, and it initially breaks down a drug to allow the other enzymes to attack it.
Because the cytochrome P450 system works in the first stage of drug metabolism, its activity can become a critical rate-limiting step in drug metabolism. The capacity and characteristics of the cytochrome P450 system are determined by genetics; many genetically determined subtypes of the system can cause variability in drug kinetics and elimination. Dosing of warfarin can be predicted by monitoring one genetic variant of the cytochrome P450 system, and further individualization of drug therapy might be possible in the future.
Drug Excretion
The kidney can remove drugs from the body through either filtration or secretion. The most common method of renal elimination is filtration through the glomerulus, with passive elimination in the urine. Drugs removed by filtration demonstrate first-order kinetics—the more filtration that occurs, the more drug is removed.
Active transport mechanisms in the renal tubules can secrete some drugs (e.g., penicillin) directly into the urine. Cells lining the tubules actively transport the drug from the blood into the urine. This tubular active transport system is inhibited by a drug called probenecid, which can be used to prolong the effects of penicillin and ampicillin.
Altered renal function will change elimination kinetics for drugs that are filtered or secreted by the kidney. The dose of aminoglycosides such as gentamicin has to be based on the clearance or filtration of these drugs, as estimated by serum creatinine or calculated creatinine clearance.
The premature infant has markedly reduced renal function, glomerular filtration rate, and drug clearance, even when compared with a full-term infant. These renal dynamics improve significantly during the first 3 years of life (see Table 4-1). Dosing requirements for a number of drugs change during infancy, even from week to week during the first months of life. In general, for seriously ill or injured infants, the combination of immature renal function and disease state will likely slow drug elimination.
Practical clinical considerations
Dosing Changes
Providers must be aware of drug kinetics and elimination when adjusting drug dose. For a drug with first-order kinetics, an increase in dose will increase steady-state concentration proportionately. Providers can use that proportional increase to calculate a change in drug dose to reach a given drug concentration: to increase the drug concentration by 20%, increase the dose by 20%.
If the drug has Michaelis-Menten kinetics, any increase in dose will result in a more substantial increase in the drug concentration. For example, a 20% increase in dose may produce a 50% increase in concentration.
Drugs often demonstrate a variety of kinetics and compartments of distribution. Table 4-2 includes a short list of common pediatric critical care drugs with different kinetics and distribution.
Table 4-2 Common Drugs and Kinetic Models
| Drug | Kinetics | Distribution |
| Gentamicin | First order | One compartment |
| Vancomycin | First order | Two compartment |
| Phenytoin | Michaelis-Menten | One compartment |
| Phenobarbital | First order | One compartment |
| Fentanyl | First order | Two compartment |
| Midazolam | First order | Two compartment |
| Digoxin | First order | Multicompartment |
| Pentobarbital | First order | Two compartment |
Bayes’ Theorem
Bayes’ theorem is used to analyze complex clinical situations to give more credibility or weight to the most important variables that will influence the situation. When interpreting any laboratory value, providers make judgments based on the absolute value in addition to other patient variables. One example is analysis of the serum potassium concentration. The clinician should react differently to an elevated potassium concentration obtained from a heelstick sample in a child with a normal electrocardiogram (ECG) than to an elevated potassium concentration obtained by venipuncture in the child with acute renal failure, an elevated serum creatinine, and peaked T waves on the ECG. In the child with the heelstick sample, providers should give less weight to potassium concentration and more weight to the clinical findings and the conditions under which the sample was obtained. The provider should be concerned, however, about the elevated potassium concentration in the child with renal failure, because other indicators suggest that it is clinically significant. Drug level monitoring should use such analysis. Computer programs using mathematical regression analysis models are available to aid in the interpretation of drug levels.
Drug Monitoring and Dosing
Although it is important to understand principles of pharmacokinetics to interpret drug concentrations, few clinicians understand the actual mathematical theories and calculations underpinning the kinetics. Fortunately, most drug databases provide relatively simple dosing recommendations and equations that factor in the kinetics. Recommended drug doses often differ based on postconceptual age, weight, and parameters of renal function.
There are two basic reasons to determine drug levels or concentration: to judge safety or efficacy, and to predict future dosing. Drug levels are most often used to monitor for safety and efficacy and are rarely used to attempt to calculate future dosing.
When a sample is obtained to evaluate drug concentration, it is critical to know the timing of the sampling in regard to drug administration. For drugs that require a timed infusion, failure to accurately time both the drug administration and the blood sampling can yield a falsely high or low drug concentration that can cause erroneous decisions about future dosing. The following general approaches to drug dosing and monitoring form a basis for drug use.
Start from the Expected
Determine the dose based on variables listed in standard databases, which should factor in the postconceptual age of a child, weight range, and actual body weight.
Wait Until Steady State
Identify the time to steady state for a drug. In general, 90% of the steady-state concentration will be achieved in four to five half-lives for a drug. The drug concentration after the third dose will only approximate steady state if the drug (e.g., aminoglycosides or vancomycin) has a relatively short half-life. Drugs with long half-lives will require a longer time to achieve steady state unless a loading dose is provided.
It may be appropriate to evaluate a drug concentration before steady state, to provide additional safety in situations where drug elimination is likely to be compromised by immaturity of the drug elimination system, disease, or organ failure. The best example is a small newborn or infant with renal insufficiency. In this patient, the drug kinetics might be markedly altered, so evaluation of the drug concentration after a small number of doses could provide useful information.
It may also be reasonable to check a drug concentration after a loading dose if a desired drug effect (pharmacodynamic) has not been achieved. For example, if a loading dose of phenytoin does not stop seizure activity, the phenytoin drug level can be checked to predict the benefit of administering an additional loading dose, and to determine the size of such a dose. For phenytoin, a loading dose of 20 mg/kg usually creates a blood concentration of 15 to 20 mcg/mL. A drug level of 12 mcg/mL the day after a loading dose might prompt administration of an additional 10 mg/kg loading dose to raise the concentration to 20 mcg/mL. Note that the drug levels from samples drawn before achieving the predicted steady state are not useful to predict maintenance dosing.
Make Conservative Changes in Dose
When drug concentrations are obtained in the clinical setting, the nurse must interpret the concentrations in light of the patient’s condition. It is particularly dangerous to overinterpret a low drug concentration and make a large increase in dose. Many variables in the patient’s condition and in the blood sampling process in a critical care unit can introduce error and create a falsely low value. A substantial increase in the dose of a drug such as phenytoin can markedly increase the drug concentration (see Fig. 4-6, earlier).
Monitor for Changes in Clinical Condition
In general, once steady-state concentrations have been achieved and appropriate drug levels are documented, providers might expect that levels will remain fairly constant unless organ dysfunction develops. Providers must also consider the effect of organ development on drug excretion as the infant grows. Unless drug doses are increased as the infant’s glomerular filtration rate increases, the concentration of a drug will likely fall if the drug is administered continuously over the first months of life. Such a concentration decline should not be attributed to noncompliance or failure of drug effect.
Drug information in databases
Several well-researched databases are available to guide pediatric drug therapy. These databases contain core information that will be useful to guide therapy.
Indications, Contraindications, and Mechanisms of Action
Nurses should be aware of a drug’s mechanism of action and contraindications, particularly if such contraindications are designated by a black box (indicating a warning from the U.S. Food and Drug Administration). The nurse should discuss concerns regarding potential contraindications with the provider who has ordered the drug.
Pharmacokinetic Parameters
The drug’s volume of distribution, protein binding, clearance, and drug half-life may be listed. A drug with a volume of distribution less than 1 L/kg is chiefly distributed in the blood, with only a small amount of tissue distribution. Larger volumes of distribution (>1 L/kg) reflect greater tissue distribution. The greater the tissue distribution, the more likely that administration of a loading dose will be needed, if it can be tolerated. If a loading dose is recommended, it should be listed with the dosing information.
Protein binding (listed as a percent of total) and its clinical importance may be noted in this section. Highly bound drugs can be displaced from proteins by other drugs or in some clinical conditions (e.g., a high BUN). Providers should consider the degree of protein binding when evaluating drug levels; measurement of the free (unbound) drug concentration may be needed.
The drug clearance reflects changes that occur with disease and maturation of organ function. Such data should also be included with dosing information. If a drug’s clearance is altered by disease states or organ function, it may be necessary to alter initial doses to avoid toxicity.
As noted previously, the drug half-life is an extremely useful piece of information. The nurse can use the half-life to predict time to steady state and to know when to anticipate drug effects or changes in effects. Estimates of time of achievement of steady state (typically four to five half-lives of the drug, unless a bolus is administered), will help determine when to obtain blood levels and when to expect a response to therapy.
The drug half-life can be used to help the nurse anticipate clinical changes when drugs are initiated or discontinued. Intravenous milrinone has a half-life of approximately 3 hours in infants, whereas dopamine has a half-life of approximately 2 minutes. If milrinone is discontinued, the drug concentration will decrease by half every 3 hours in the infant (and more rapidly in children and adults), so the benefits of the milrinone will likely decrease over the same time period. By comparison, if a dopamine infusion is discontinued, the drug concentration will halve in approximately 2 minutes, so clinical changes can be observed in that time.
Some databases will list a half-life for short-term administration and a half-life for long-term administration; these may also be termed the distributional effect (or t1/2-alpha) and terminal elimination (or t1/2-beta), respectively. The terminal elimination half-life will ultimately determine the time to steady state and may be responsible for prolonged effects observed in children after long-term use of sedatives.
Dosing Information
Dosing information is a critical component of any database. Loading dose, if needed, is typically the first parameter listed. The database may list a rapid loading dose, such as with some anticonvulsants, or a divided loading dose to be given over 24 h, such as with digoxin. In general, the loading dose is based on weight and does not factor in disease state or other patient parameters. To determine the loading dose for a patient, providers must identify any constraints (e.g., irritation to veins or maximum rate of infusion) to drug administration.
The initial dosing recommendations are generally divided by age group. For some drugs, dosing can be based on both development (e.g., postconceptual age) and weight (e.g., premature infant weight <1000 g). Note that to increase accuracy, drug orders should include the dose in milligrams per kilogram and the final dose (amount) to be given.
Disease-dependent variables will affect the maintenance but not the loading dose. The database may provide specific recommendations regarding alteration of dose in renal failure or in hepatic dysfunction, but databases often provide only general guidelines. Some drug dosing (e.g., fentanyl) can be affected by technology such as continuous renal replacement therapy or extracorporeal membrane oxygenation (ECMO), so ECMO loading doses and need for increased infusion rates during ECMO therapy may be noted.
Drug Interactions
Most databases list known interactions with food or disease states or other drugs. For example, enteral feedings that are high in calcium concentration (e.g., infant formulas) can interact with and change the bioavailability of some oral medications. Databases can list precautions regarding intravenous administration rate or problems with admixture with other drugs.
Sampling for Monitoring Drug Concentrations
Most drug databases suggest timing for blood sampling to monitor drug concentration. It is important to consider the primary purpose in determining the drug concentration. When monitoring for safety, a blood sample is typically obtained at the end of a dosing interval (i.e., immediately before a dose), and is called a trough level. When monitoring for efficacy, the sample is typically obtained to identify the concentration immediately after a dose (e.g., 30 minutes after a dose is infused), and is called the peak level.
If providers want to perform rigorous pharmacokinetic predictions, both peak and trough levels are evaluated to calculate a half-life and predict future dosing of drugs. Peak and trough levels are evaluated less commonly than in previous years to predict drug dosing, because more accurate information is now available to guide drug dosing.
Pharmacodynamics
Pharmacodynamics is the description of the effects of the drug on the body. Mathematically there is a sigmoidal (S-shaped) relationship between the receptor activation causing a drug response (i.e., clinical effects) and the logarithm of its blood concentration. This relationship is relatively flat at low concentrations, until enough of the drug is present to produce effects. The relationship is also flat at high concentrations, once receptors are saturated and maximal effects are obtained. At moderate doses (i.e., the center part of this S), there is a nearly direct relationship between drug concentration and drug effects. In other words, increasing the dose increases the effects (see Pharmacodynamics in the Chapter 4 Supplement on the Evolve Website for more information and Chapter 6 for additional information about titration of vasoactive infusions).
Critical care providers monitor pharmacodynamics in both concrete and subtle ways. Many of the drugs used in critical care have fairly solid endpoints that are used to titrate a dose (e.g., a target systolic blood pressure when titrating vasopressors such as norepinephrine). However, other drugs can be used to produce more qualitative clinical effects. For example, during milrinone therapy, nurses cannot readily monitor the child’s cardiac output at the bedside, but they monitor quality of systemic perfusion by evaluating a variety of subjective factors including signs of end-organ function (e.g., urine output).
One of the most complex drugs that requires pharmacodynamic assessment is dopamine. Dopamine interacts with three different receptors: the dopamine receptor, the beta-1 receptor, and the alpha receptor. It has a different range of affinities for binding to these three receptors. For each receptor there is a typical S-shaped relationship between the logarithm of dopamine concentration and receptor binding that produces drug effects (Fig. 4-8). As dopamine blood concentration increases, one receptor nears saturation; at the same time, dopamine begins to bind with another receptor, producing additional clinical effects. The net effect on a variable such as systemic vascular resistance is not a typical S because stimulation of different receptors will produce different effects. The key to dopamine titration is understanding that dopamine’s pharmacodynamic effect is modulated by three receptor systems (see Chapter 6).
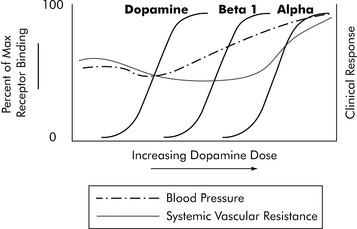
Fig. 4-8 Pharmacodynamics of dopamine. Dopamine has a complex pharmacodynamic model because it acts on three separate receptor systems and will produce effects that change with increasing dose. The net effect on clinical response is indicated by a curve depicting likely changes in systemic vascular resistance (dotted line) and blood pressure (dot and dash line). Of course, individual patient responses vary and the drug must be titrated according to the patient’s response.
(Courtesy William Banner, Jr.)
Summary
The more that critical care nurses understand the potential effects of drug distribution and the child’s age and other factors (e.g., clinical condition) that influence drug elimination, the more they will be able to avoid the problems of drug side effects and toxicities. Through knowledge of basic principles of pharmacokinetics and pharmacodynamics in clinical practice, the nurse can better titrate drugs to maximize therapeutic effects and minimize adverse or toxic drug effects.2-5
1 Barakat A.Y., Ichikawa I. Laboratory data. In: Ichikawa I., editor. Pediatric textbook of fluids and electrolytes. Baltimore: Williams and Wilkins, 1990.
2 Bauer L.: Applied clinical pharmacokinetics. ed 2. New York; McGraw-Hill:2008
3 Birkett D.J. Pharmacokinetics made easy. North Ryde NSW Australia: McGraw-Hill Australia; 2002.
4 Burton M.E., et al, editors. Applied pharmacokinetics and pharmacodynamics, principles of therapeutic drug monitoring. Baltimore: Lippincott Williams & Wilkins, 2006.
5 Potts A.L., et al. Dexmedetomidine pharmacokinetics in pediatric intensive care—a pooled analysis. Paediatr Anaesth. 2009;19(11):1119-1129.
6 Tan J.M. Nephrology. In Custer J.W., Rau R.E., editors: The Johns Hopkins Hospital Harriet Lane Handbook, ed 18, Philadelphia: Mosby-Elsevier, 2009.