Severity of illness and likely outcome from critical illness
It is intuitive that severity of illness might be related to eventual outcome. It is also not unreasonable to assume that outcome might also be related to whether a condition is reversible or to the presence of co-morbidities that might modify resilience. However, although acuity may be related to outcome, the speed of delivery of care, its organisation and avoidance of iatrogenicity can also be expected to play their part. Many patients also acquire conditions and complications that they were not admitted with whilst in the intensive care unit (ICU).
In many conditions there has been a long history of attempting to relate acuity to outcome. For example, the New York Heart Association first classified patients with cardiac disease based on clinical severity and prognosis in 1928 and this has subsequently been updated seven times, the last in 1994. Similarly the Glasgow Coma Scale described the changes in coma following head injury and its association with prognosis.1–3 The Ranson score related outcome to severity of acute pancreatitis,4 while the Pugh modification of Child–Turcotte classification for patients undergoing porto-systemic shunt surgery is widely used for classification of end-stage liver disease.5 More recently the Euroscore has been used to calculate likely mortality following cardiac surgery.6
The earliest attempt to quantify severity of illness in a heterogeneous critically ill population was by Cullen, who devised a score in which therapeutic intervention was used as a surrogate for illness.7 This was followed in 1981 with the introduction of the Acute Physiology, Age and Chronic Health Evaluation (APACHE) scoring system and shortly after by the Simplified Acute Physiology Score (SAPS) and Mortality Prediction Model (MPM).8–10 These scores have since been updated for international use while others have been introduced and calibrated to meet a specific population – such as the ICNARC model for the UK.11
The advantages of quantifying critical illness with scores and relating this to outcome include:
• a common language for discussion of severity of illness
• a method by which critical care practice and processes can be compared both within and between units
• provision of risk-adjusted mortality predictions facilitating acuity comparisons for clinical trials
Limitations of quantifying critical illness with scores are:
Although mortality prediction is the focus of scoring systems, the numerically greater burden of critical illness is continuing physical and social disablement; indeed the survivors of critical care have a higher mortality than the normal population. There is an inherent temptation to use scoring systems to indicate an individual patient's prognosis, but this would be statistically incorrect. The scores were derived from very large cohorts of heterogeneous patients and the prognostic output is a mortality probability estimate for a similar cohort not an individual.
Less controversial has been the common use of scoring systems to demonstrate there is balance in the acuity of patients admitted into the arms of a clinical trial, but even there the use of the score rather than the calculated risk of death can be misleading in heterogeneous patient groups.12 Despite the known controversy in using individual patient scores for predicting outcome, studies have used APACHE II scores as a guide to enrolment for treatment.13
It is of interest that, although the critical care community widely accepts acuity scores to demonstrate balance between groups in clinical trials, it is less enthusiastic to accept the same systems as comparators for between unit and between country performances, citing calibration and case mix as confounders.14 That is unless, of course, the same said individuals' unit performances compare favourably!
Poor calibration (model under or over estimates mortality rate for the cohort under study) can be due to numerous reasons. The patient population may be from a different health system to the one where the model was developed, or there may be a systematic error in documenting the raw data, or the case-mix is very different to the original model, or indeed the model fails to include an important prognostic variable that is present in the cohort. For example, it has become clearer that prognosis is as much affected by local organisation, patient pathways, patient's pre-admission condition or their location prior to admission as it is by acute physiological disturbances.15,16
Scoring systems would be better calibrated if the models were used only on patient populations similar to those from which the models were constructed, but this would limit their international usefulness. An alternative approach would be to develop the model from a wider international cohort, but then such a model could calibrate poorly when used in an individual country. SAPS III (developed internationally) provided a solution to this with customised formulae so that the risk-adjusted expected mortality could be related to geographical location.16
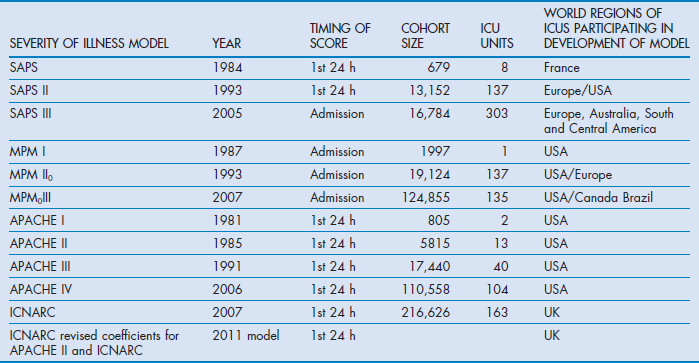
Inevitably, as medical services progress and new treatments become available, risk-adjusted mortality predictions become outdated and trend towards overestimated expected mortality.17,18 Consequently the designers of the scoring systems have reviewed their models every few years. Table 3.1 outlines some of the upgraded systems.
Table 3.1
Revision dates for the most common internationally recognised risk-adjusted models for mortality prediction
Factors indicating severity of illness and risks that might contribute to outcome
• Acute physiological disturbance
• Primary pathological process causing physiological disturbance
• Age, co-morbid states and ‘physiological reserve’
Acute physiological disturbance
It is a reasonable assumption that the degree of physiological disturbance may bear some relationship to severity of illness. This is based on the observation that an untreated pathological insult is followed by increasing compensatory activity in order to retain vital organ function. Most compensatory mechanisms are mediated through neuroendocrine responses directed to maintaining tissue oxygenation ensuring mitochondrial and ultimately organ function. Compensatory signs such as hyperventilation, tachycardia and oliguria associated with cerebral dysfunction are hallmarks of early, untreated critical illness and if decompensation ensues hypotension, metabolic acidosis and stupor develop. Regardless of the insult, organs have limited ways in which they manifest dysfunction and decompensation. Quantifying these common responses is a logical starting point for the basis of a generic scoring system. It is notable that some scoring systems such as SAPS are based solely on the acute physiological disturbance with little or no reference to the driving pathology.
However, acute physiological measurements present some challenges if they are to be translated to scores. The relationship between acute response and insult is non-linear; furthermore anatomical organ damage may not be reflected by measured function until quite extensive. For example, the liver and kidney manifest biochemical abnormality only when a significant proportion of organ mass is malfunctioning. Equally we have a poor understanding of the equivalency of malfunction between organs (e.g. what degree of acidosis is equivalent to a given tachycardia or hypotension).
A further consideration for severity of illness estimation is its timing. Ideally a true estimate of physiological disturbance would be in an untreated state. Logistically this may be quite difficult, and indeed most scores arbitrarily took the first 24 hours after admission to intensive care as the period to estimate severity of illness. However, logic would dictate that estimates would be more appropriate in the hours prior to admission when fluid resuscitation, early antibiotic treatment, ventilation or inotropes have not had time to modify the acute response or extent of decompensation. Such support for the seriously ill can diminish the difference between such patients and, for example, elective surgical admissions who have for convenience been kept ventilated until reaching the ICU. The risk of underestimating physiological disturbance has been mitigated either by taking account of the organ support on admission or by including estimates of physiological disturbance before support has been commenced. For example, SAPS III makes an adjustment for patients on inotropes, whereas MPM II allows measurements for the hour on either side of admission.15,16,19
Primary pathological process
It would be expected that, for a given degree of acute physiological disturbance, the most serious primary pathologies are likely to have the worst predicted outcomes. For example, for a given degree of acute respiratory disturbance at admission a patient with community-acquired pneumonia is likely to have a better outcome than an immunosuppressed patient with an unknown opportunist pneumonia. Furthermore, the potential reversibility of a primary pathological process with specific therapies also greatly influences outcome. For example, patients with diabetic ketoacidosis can be extremely unwell, but specific therapy with insulin and volume therapy can rapidly reverse the physiological disturbance. Conversely failure to identify organisms or sources of sepsis delays specific therapy and adversely affects outcome.
Both APACHE and the most recent SAPS systems include diagnostic categories with the acute physiological data to estimate risk of hospital death.
Age, co-morbid states and physiological reserve
Increasing age is normally associated with diminishing capacity to respond to an insult and decompensation occurs earlier. However, this capacity is only broadly predictable. ‘Biological’ age is a vague term used to imply physiological reserve below that expected for a patient's chronological age. Biological age greater than chronological age is commonly perceived in heavy smokers or abusers of alcohol. These patients may or may not have diminished organ function, but are generally expected to more readily reach a decompensated state. Physiological reserve is a term that hints at the likely ability to cope with an insult and its physiological demands, it is often inferred from age and co-morbidity. Conditions such as diabetes and chronic pulmonary disease are generally considered to have some bearing on physiological reserve, but not always as much as might be expected. On the other hand, co-morbid states such as immunosuppression, cirrhosis and haematological malignancies do result in significant diminution of resistance to infection. These co-morbidities are commonly included in critical illness severity scoring systems, unlike diabetes.
Location prior to admission and emergency status
The location of a patient prior to admission to ICU is a factor recognised by the more recent scoring systems as having an influence on outcome.11,15 This might in part be because location influences the lead time to definitive treatment, or is a health care environment where the likelihood of carrying resistant organisms is higher.
The emergency status of a patient has equally been recognised by all scoring systems to influence outcome. Acute medical and emergency surgery admissions are associated with poorer outcomes than those following elective surgery.
Unit organisation and processes
Soon after the introduction of APACHE II it was recognised that units with effective nursing and medical leadership, good communications and dedicated intensive care specialists had better outcomes than those without such characteristics.20–25 Additionally, factors such as genetic variables, socioeconomic status, access to investigations and normal medical care are likely to have a quantifiable but as yet indeterminate bearing on the widest aspects of outcome.
Risk-adjusted expected outcome
Prior to the advent of scoring systems, expected outcome from critical illness was not calculated and it was difficult to have confidence that control groups in clinical trials were representative or internationally relevant. The common outcome measures are ICU, 28-day and hospital mortalities. Scoring systems provide calculations which can demonstrate that active and control groups have similar risks of death and, importantly, that the control group had observed outcomes similar to those expected. Similarly risk-adjusted expected outcome is a standard tool for monitoring the performance of an ICU and offers some indication of comparative performance particularly when patient case-mix is similar.
However, whereas hospital death and risk of death is a clear-cut outcome measure, morbidity in the guise of serious psychological or physical functional impairment is far more common.26–29 Indeed there is a case that risk-adjusted outcome should be extended to consider time to return to normal function or work as well as survival at 1 year.30,31 Longer-term outcome is confounded by premorbid chronic health status.
Principles of scoring system design
Choice of independent physiological variables and their timing
The designers of the APACHE and SAPS systems originally chose physiological variables that they felt would represent measures of acute illness. The variables chosen by experts were weighted equally on a linear scale with the highest value given to the worst physiological deviation from normal.9,32 In these early models diagnostic details, premorbid conditions, age and emergency status were also included to create a score that was then used in an equation to provide risk of death. Later upgrades to these systems, SAPS, APACHE and MPM, used logistic regression analysis to determine which variables should be included to explain the observed hospital mortality.33 Variables were no longer given equal importance nor their weightings linearly related to the physiological disturbance. Furthermore this statistical approach to developing a scoring system confirmed that factors suspected of influencing outcome such as location prior to admission, cardiopulmonary resuscitation (CPR) or dependence on inotropes prior to admission indeed had discriminatory power and were included in the logistic regression equation from which risk of death could be calculated.11,16
Developing a scoring methodology and its validation
All the commonly used acuity scoring systems have been based on large databases derived from several ICUs (see Table 3.1). Typically more than 50% of the database is used to provide a cohort of patients to act as a developmental group. A number of independent categorical or continuous variables that could feasibly influence outcome are collected. These variables are used in a logistic regression equation to achieve the best fit to explain the dichotomous dependent variables survival or hospital death. The starting point is to include all variables that by univariate analysis are moderately related to outcome, perhaps at the p < 0.15 level. The logistic equation is then modified through multiple iterations during which variables are either removed or combined in order to improve the fit to explaining outcome. Each variable is weighted with a coefficient to provide the best fit that distinguishes survival from non-survival. The best fit is assessed by the Hosmer–Lemeshow test for goodness of fit.34 The model is initially tested on the developmental cohort. This is done by exploring the model's ability to discriminate between survivors and non-survivors by plotting positive predictions of death against false-positive predictions in a receiver operator curve (see below). The area under the curve (AUC) sometimes referred to as the c-statistic (or concordance index), is a value that varies from 0.5 (discriminating power not better than chance) to 1.0 (perfect discriminating power). Clearly when tested on the developmental cohort the discriminatory power would be expected to be high. This is done through statistical techniques such as ‘jack-knifing’ or ‘boot-strapping’ that take numerous small samples of the developmental cohort to demonstrate stability of the chosen variables. The next step is to test the model against a new set of patients, the validation dataset (the other 50% of patients from the database who were not in the developmental set). The aim of validation is to demonstrate that the model can be used to predict likely hospital outcome, which is again measured with the concordance index.
Once a satisfactory equation has been developed it can be used to calculate the overall probability of death for a group of patients.
A perfect model should ideally be able to predict which patients will survive and which will die (discrimination) and correctly predict the overall observed mortality (calibration). Discriminating power is assessed by construction of a receiver operator curve (ROC).
ROC construction
The area under a ROC is constructed by using the logistic regression model to indicate the number of patients predicted to die and comparing this with the observed numbers who died. This is undertaken at different thresholds of predictions of death. So, for example, if the threshold is set at 50% the assumption is that any patient at or above that calculated risk counts as a prediction to die. This in turn is compared with what actually happened. Clearly many patients predicted to die do die, but a not-insignificant number predicted to die at the 50% threshold will survive. One can determine just how unreliable that threshold is as a predictor by determining the true-positive predictions (sensitivity) – that is, the observed deaths among those who were predicted to die – and compare these with the false-positive predictions – that is, the survivors among all those predicted to die. This exercise can be repeated using different thresholds such as 60, 70, 80, 90% where again it is assumed that those with calculated risks at the threshold value or above would all be predicted to die. At each threshold point the sensitivity and false-positive rates are calculated. The false-positive predictions of death can be reduced only if the model also has high specificity, in other words it correctly predicts survivors. It is therefore common for the false-positive rate to be expressed as 1 − specificity or 100 − specificity if expressed as percentages. The ROC convention is to plot sensitivity on the y-axis against 1 – specificity on the x-axis, with each x and y value representing sensitivity and false-positive rates at each threshold point (Fig. 3.1).
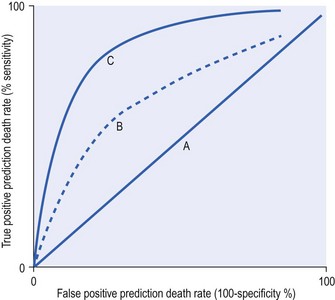
Figure 3.1 A receiver operator curve (ROC) plots true-positive against false-positive rates for a series of cut-off points for risk of death. As sensitivity or true positives increase there is a tendency for more false-positive results. There is a trade-off in making a test or predictor tool very sensitive because it loses specificity. The best curve is one that is above the line of no discrimination (A) and tends towards the y-axis. Therefore the model represented by line C is better than model B. The curve is made up of a series of sensitivity and false-positive estimates based on changing the threshold decision cut-offs. Typically the thresholds would be between 10 and 90% (i.e. when set at 10% the model predicts that every patient above a 10% risk of death will die). This level of cut-off will find every single death, but unfortunately there will be many false positives. This would provide a point towards the right-hand corner of the graph. When the cut-off point is made very high, such as 90%, the model will find only some of the true deaths, but there is less likelihood of a false positive and this will provide a point towards the origin of the graph closely applied to the y-axis.
The curve can be quantified by the area under the curve with higher values indicating more discriminatory power. For binary outcomes such as death and survival the area under the curve expressed as a fraction is the same as the concordance statistic, which varies between 0.5 and 1.
A perfect model would be 100% sensitive and 100% specific and would therefore follow the y-axis with a sensitivity value of 1 and a false-positive value of 0. Conversely a curve that demonstrated no ability to discriminate between survivors and non-survivors would be represented by a line at 45 degrees going through the origin (non-discriminator line). The further the ROC is above the non-discriminator line and towards the y-axis the greater is the model's power of discrimination. This can be quantified by the c-statistic, which is a rank order statistic, or quantified by the area under the curve. The two measures are synonymous when the discrimination is between two mutually exclusive outcomes such as survival and non-survival. Prediction models that have AUC 0.7–0.8 are considered fair, those with AUC 0.8–0.9 are good, while those above 0.9 are considered excellent.
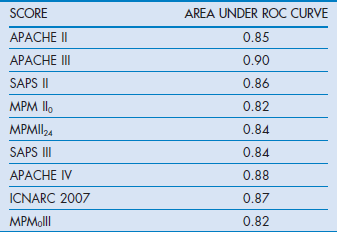
It is also possible to calculate the misclassification rate (patients predicted to die who survived and those predicted to survive who died). For example, in the APACHE II system the misclassification rates were 14.5, 15.2, 16.7 and 18.5% respectively at 50, 70, 80 and 90% predicted risk of death cut-off points, indicating that the best trade-off point between sensitivity and specificity with this model was when it was assumed that any patient with a risk of death greater than 50% would be a non-survivor. The calculations of sensitivity, specificity and misclassification rates are outlined in the (Box 3.1). Table 3.2 indicates the AUC for the commonly used scoring systems.
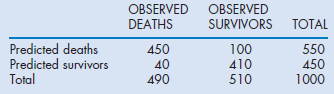
Box 3.1 Calculations of sensitivity and specificity for a prediction model for mortality
When a model is tested against a cohort of patients its ability to correctly discriminate between predicted survivors and non-survivors is a measure of its power and ultimate usefulness.
Based on the data below a number of measures can be determined.
Sensitivity: the proportion of observed deaths correctly predicted to die (true positive).
Specificity: the proportion of survivors correctly predicted to survive (true negative).
1 − specificity is the proportion of survivors that were predicted to be dead (false positive).
Positive predictive value: observed predicted deaths as a proportion of the total predicted deaths = 450/550 = 0.82.
Negative predictive value: observed predicted survivors as a proportion of the total predicted to survive = 410/450 = 0.91.
Misclassification rate is the proportion of patients wrongly predicted: (100 + 40)/1000 = 14%.
Correct classification rate is the proportion of patients correctly predicted: (450 + 410)/1000 = 86%.
False-positive rate = 100% − positive predictive value = 18%.
False-negative rate = 100% − negative predictive value = 9%.
Calibration
A model with good calibration is one that for a given cohort predicts a similar overall percentage mortality to that observed. The extent to which this is achieved can be explored with the Hosmer–Lemeshow goodness-of-fit c-statistic. This compares the model's prediction of death and the actual outcome. The model is deemed to fit well and be well calibrated when there is no statistical difference between the two (i.e. the p value is larger than 0.05).34
Observations with many models have revealed that, unless the case-mix of the test patients is similar to those that were used to develop the model, the models may underperform owing to poor calibration. This is particularly true when the testing is done for patients in different countries.16,35–37
Commonly used scoring systems
Acute physiology age and chronic health evaluation (APACHE) systems I, II, III, IV
In 1981 Knaus described APACHE, a physiologically based classification system for measuring severity of illness in groups of critically ill patients.32 They suggested that it could be used to control for case-mix, compare outcomes, evaluate new therapies, and study the utilisation of ICUs. APACHE II, a simplified version, was introduced in 1985, which was superseded in 1991 by a proprietary version, APACHE III.32,38 APACHE IV was introduced in 2006, but remains a proprietary system.18 APACHE II rather than the later versions has become the most widely studied and used system worldwide for reporting severity of illness.
APACHE II was developed and validated on 5030 ICU patients (excluding coronary bypass patients). The score is the sum of three components:
The 12 variables of the APS and their relative weights were decided by expert opinion. These variables are collected in the first 24 hours after admission to ICU and should represent the worst physiological values. The APACHE II score can be included in a logistic regression equation with a coefficient for one of 50 diagnostic categories representing the reason for admission and a coefficient for admission following emergency surgery. The equation will calculate a probability of death. The probability of death, although calculated for each single individual, will only approximate the model's claimed calibration when a large cohort of patients with the same diagnostic grouping is examined (groups of at least 50). Furthermore, as in all prediction models, although the number of deaths might be predicted correctly, discriminating those who will die from those who will survive will be fraught by misclassification errors and therefore the prediction remains a probability with a defined error and cannot be used for decision making.
APACHE II has functioned best when the ICU patient cohort under test is similar to the original North American development database. The system is now old and overestimates mortality predictions, mainly because critical care management and organisation have improved significantly over the last 30 years. However, simply modifying an old scoring system does not readily correct the calibration problems, hence the need to upgrade the system using recent databases.
APACHE III was introduced in 1991 and was designed to:
• improve prognostic estimates by re-evaluating the selection and weighting of physiological variables with an expanded reference database
• examine how outcome is related to patient selection for ICU admission and its timing
APACHE III was based on a large database (17 440 patients) from 40 US hospitals that was equally divided between developmental and validation groups.
Patients who were admitted for less than 4 hours, with burn injuries or with chest pain were excluded. Coronary artery bypass patients were considered as a separate group.
A total of 17 physiological variables, including a revised version of the Glasgow Coma Scale, were identified through statistical analysis and the diagnostic categories were increased from 50 to 78. The patient location immediately prior to ICU admission was included and only those co-morbidities that affected a patient's immune status were considered. Chronic disease states and age contributed 15% of the calculated mortality risk, the rest being based on the acute physiology disturbance.
APACHE III represented an advance over APACHE II with improved discriminatory power (ROC 0.9 vs 0.85), and better calibration.38 In an early comparative study, Castella et al reported that, although APACHE II proved better calibrated than SAPS and MPM I in a 14 745 mixed patient cohort from European and American ICUs, APACHE III was better calibrated and more discriminating.39
A new characteristic introduced in the APACHE system was not only a calculated risk of death based on the first day values, but also serial calculations on subsequent days to provide an updated risk of death calculation for an individual. The coefficients for the regression equations are not in the public domain, and this has made independent assessment of the predictive aspect of the scoring system difficult.
APACHE IV
It was failure of customisation techniques with APACHE III to account for observations in subgroups that led to development of a new model. The authors of APACHE IV revealed that when APACHE III in its modified form was applied to patients collected between 2002 and 2003 calibration was poor.18
APACHE IV was based on a new database of 131 618 admissions from 104 US ICU in 45 hospitals. The selected hospitals had the APACHE III computerised data collection and analysis system already installed. Of the admissions, 110 558 patients had completed datasets and 60% were randomly selected to make up the developmental dataset. The exclusions included patients who were in hospital for more than a year or admitted from another ICU. Only first admissions were counted. The diagnostic groups were increased to 116 and not only was the location prior to admission included but also the hospital length of stay prior to ICU. The statistical and modelling techniques included cubic regression splines, which allow for a non-linear relationship between variables and outcome.
The AUC ROC derived from the model used on a validation dataset was 0.88, indicating very good discrimination. The relative contribution of the predictor variables for estimating hospital mortality is shown in Table 3.3.
Table 3.3
The relative contribution of the predictor variables for estimating hospital mortality in APACHE IV
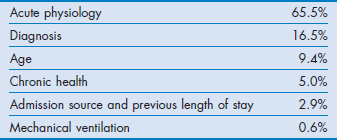
The APACHE IV system has not been tested outside the US and therefore how it calibrates in the rest of the world is unknown. Indeed this might also be the case in the US given the selected units used for the database.40
Simplified acute physiology score (SAPS I–III)
The Simplified Acute Physiology Score (SAPS) was originally based on data derived from French ICU, and based almost entirely on acute physiological variables.9 The chosen 14 physiological variables were selected by experts and arbitrary scores were based on the degree of deviation from normal. Initially the score was not related to an equation for predicting probability of death, although later this was possible. Unlike APACHE II this system included neither diagnostic categories nor chronic health status as part of the severity of illness estimate.
In 1993 SAPS II was introduced and this was based on European and North American patients.41 The database contained 13 152 patients, divided 65% and 35% between developmental and validation cohorts. Excluded patients included those under 18 years, with burns, receiving coronary care or post cardiac surgery.
The weightings given to physiological derangements were derived from logistic regression analysis. The variables included 12 physiological measurements and specific chronic health conditions such as the presence of AIDS, haematological malignancies, cirrhosis and metastasis. Like the original SAPS there was no requirement for inclusion of diagnostic groups. The probability for hospital death could be readily calculated from a logistic regression equation. In the validation sample the area under the ROC was 0.86 with equivalent calibration and discrimination to APACHE III and MPM II. It is the most commonly used scoring system in continental Europe.
SAPS III
SAPS III was introduced in 2005 and developed from a database of 16 784 patients from 303 ICU from around the world including South and Central America.15,16 The model used multilevel logistic regression equations based on 20 variables.
The authors separated variables into those related to the period prior to admission, those concerning the admission itself and those of the acute physiological derangement (Table 3.4).
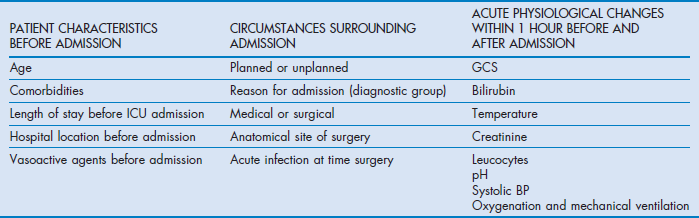
The SAPS III score can be used to derive a risk of death from a logistic regression equation. Discrimination was good, with ROC AUC 0.848. The calibration varied, however, depending on the geographical area tested. The best fits for the general SAPS III risk adjustment model were for Northern European patients while the worst was for Central and South America. This simply reflected the lower number of patients from those areas in the developmental dataset. However, the model can be customised with alternative equations to improve calibration for different regions of the world.
The authors found that 50% of the model's explanatory power for predicting hospital mortality was from patient characteristics prior to admission, while circumstances surrounding admission and acute physiology parameters accounted for 22.5 and 27.5% respectively. The lower explanatory power compared with APACHE IV is notable and may be due to the absence of diagnostic weights in SAPS III.
Mortality prediction models (MPM I–III)
MPM was introduced in 1985 to provide an evidence-based approach to constructing a scoring system.42 The data were derived from a single US institution and included observations at the time of admission to ICU and within the first 24 hours. MPM I0 was based on the absence or presence of some physiological and diagnostic features at the time of admission, while a further prediction model MPM I24 was based on variables reflecting the effects of treatment at the end of the first ICU day. Unlike APACHE and SAPS systems it does not calculate a score based on the extent of physiological derangement, but computes the hospital risk of death from a logistic regression equation from coefficients based on the presence or absence of 15 factors such as coma, chronic renal failure, cirrhosis, heart rate over 150, systolic blood pressure below 90 mmHg (≈12 kPa) and several others.
MPM II is based on the same dataset as SAPS II.33 The system is a series of four models which provide an outcome prediction estimate for ICU patients at admission and at 24, 48 and 72 hours. In common with the early APACHE and SAPS systems, the models excluded burns, coronary care and cardiac surgery patients. The models were derived by using logistic regression techniques to choose and weight the variables with an additional criterion that variables had to be ‘clinically plausible’.
MPM0 and MPMII24 have similar discriminatory power to SAPS II, with ROC AUCs of 0.82 and 0.84 respectively.
In a comparison between MPM II, SAPS II and APACHE III and the earlier versions of these systems, all the newer systems performed better than their respective older versions; however, no system stood out as being superior to the others.39
In 2007 MPM0III was introduced because it was noted that MPM II had lost its calibration against patients who were being recruited into the ongoing Project IMPACT.43 This was probably due to changes in practice rather than case-mix. MPM0III was based on retrospective data from 135 ICUs and 124 855 patients collected between 2001 and 2004. The patients were randomly divided into development (60%) and validation (40%) sets. The same variables as MPM II were collected, but included whether the patient was ‘do not attempt resuscitation’ at the time of admission (1 hour before or after admission). The resulting statistical analysis revealed that not only were the same variables retained but also there was a need to include interactions between age and each of the variables of systolic pressure, cirrhosis, metastatic neoplasms, cardiac dysrhythmia, intracranial mass effect and CPR prior to admission in order to correct overprediction of mortality. The authors achieved better calibration with MPM0III than with their earlier model. The strengths of the MPM systems are that the burdens of data collection are low and the variables are boolean. The data are collected at the time of admission. This simplicity of collecting fewer variables at admission unfortunately has a trade-off in that discriminatory power is lost compared with other models. However, discriminatory power with ROC AUC at 0.82 remains acceptable.
ICNARC models
ICNARC (Intensive Care National Audit and Research Centre) is a UK organisation dedicated to the collection and analysis of critical care data derived from over 160 ICU on a regular basis. It initially collected data for SAPS, APACHE II and MPM, and in the APACHE II model replaced the original diagnostic categories with its own to improve calibration for the UK. Its success has been based on a consistent methodology for data collection and therefore year-on-year data can be used to update diagnostic coefficients for APACHE II to ensure contemporary calibration. Furthermore, confidence in the data has allowed development of its own ICNARC mortality prediction model. The current ICNARC model was introduced in 2007 and upgraded with new coefficients in 2011. The model was originally based on 163 general ICUs using data collected between 1995 and 2003.11 The model ultimately included data from 216 626 patients. Re-admissions during the same hospital spell were not included. This model was also based on logistic regression analysis and isolated 12 physiological variables, which if all at their worst added up to a score of 100. The model also included age, diagnostic categories, source of admission and whether a patient had received CPR prior to admission. The model showed a high degree of discrimination (0.874) and calibration when applied to a validation set. Interestingly the impact of chronic health was found to be less than expected. Its weakness like the APACHE system is that it is entirely based on a national cohort and may not be suitable outside the UK.
Organ failure scores
It is intuitive that as more organs fail the likelihood of death increases. As part of his work with APACHE, Knaus devised a simple predictive table in which, depending on age, the number of organs failed and the duration of failure he could estimate the likely risk of death. The organ system failures (OSFs) were defined for 5 organs.44
The notable observations were that:
• a single OSF lasting more than 1 day resulted in a hospital mortality rate of 40%
• two OSFs for more than 1 day increased rates to 60%
• three or more OSFs lasting more than 3 days were associated with a mortality of 98%.
Advanced chronological age increased both the probability of developing OSF and the probability of death once OSF occurred. These figures probably overestimate the risk of death in most parts of the world today.
Scores have been described that take account of grades of dysfunction and the supportive therapy required. One of these is the Multiple Organ Dysfunction Score (MODS), which was based on specific descriptors in six organ systems (respiratory, renal, neurological, haematological, cardiovascular and hepatic). Progressive organ dysfunction was measured on a scale of 0 to 4; the intervals were statistically determined for each organ based on associated mortality. The summed score (maximum 24) on the first day score was correlated with mortality in a graduated fashion.45
In this organ failure system the ICU mortality was approximately:
The score demonstrated good discrimination with areas under the ROC of 0.936 in the development set and 0.928 in the validation set.
Another organ failure score that is commonly used is the Sequential Organ Failure Assessment (SOFA). This score was originally constructed to provide a simple score for daily organ dysfunction in sepsis trials. Subsequently the ‘sepsis’ in SOFA was renamed ‘sequential’ to broaden its use. It takes into account six organs (brain, cardiovascular, coagulation, renal, hepatic, respiratory) and scores function from 0 (normal) to 4 (extremely abnormal). Experts defined the parameter intervals.46 It has the merit of including supportive therapy and, although increasing scores can be shown to be associated with increasing mortality, it was not designed for estimation of outcome probability.
Around the same time as the introduction of SOFA the more scientifically based LODS (Logistic Organ Dysfunction Score) was also described. LODS is an organ failure score that could be used for hospital outcome prediction.47 It was based on the first-day data of patients who made up the SAPS II and MPM II developmental cohort. The LODS system identified up to three levels of organ dysfunction for six organ systems. Between 1 and 5 LODS points were assigned to the levels of dysfunction. The resulting total LODS scores ranged from 0 to 22 points. Calibration and discrimination were good. It demonstrated that neurological, cardiovascular and renal dysfunction carried the most weight for predictive purposes whereas pulmonary, haematological and hepatic dysfunction carried the least. Unlike SOFA it weights the severity of illness between organs and the degree of severity within an organ system.
Scores for injury and trauma
Patients who suffer physical injury are a relatively homogeneous group, which facilitates categorisation of their illness severity on anatomical damage (Injury Severity Score, ISS) and/or disturbance of vital physiology (Revised Trauma Score, RTS).
ISS is based on the Abbreviated Injury Scale (AIS), which is a consensus-derived anatomically based method for ranking injury for six body regions (head and neck, abdomen, pelvis contents, face, chest and body surface). Unlike the physiologically based general severity of illness scores, which use data at the height of acuity, ISS is anatomical and therefore any injury no matter when detected is relevant; hence data obtained from post-mortem evidence are included.
The first AIS was published in 1969 by the Society of Automotive Engineers.48 The original reason was to provide standardisation for degree of injury for motor vehicle crash investigators to inform vehicle design. Subsequently other organisations became interested, namely the American Medical Association, and Association for the Advancement of Automotive Medicine. The latter has since taken the lead in updating AIS with major changes in 1976, 1980, 1985, 1990, 1998, 2005 and 2008. The changes have been recoding and alteration of the values for injury.49,50 AIS values range from 1 (minor) to 6 (untreatable).49,50 ISS is calculated from the sum of the squares of the highest AIS score (1–5 excluding 6 the non-survivable score) in the three most severely injured body regions. Baker noted that an injury in a second and third region, even if minor, significantly increased mortality; additionally it was observed that the sum of the squares of each score was more linearly related to mortality than the sum of individual scores.51 The highest score in each body region is 5 and consequently the highest ISS is 75. However, the sum of squares means that certain scores such as 7 and 15 will never be obtained, whereas numbers such as 9 and 16 will be common. This means that statistical analysis should avoid parametric tests on the scores.
Major trauma is defined as an ISS greater than 15 and is associated with a greater than 10% risk of mortality. However, ISS is a purely anatomical system and ignores physiological derangements or chronic health status, this reduces its usefulness for predicting the outcome of cohorts. Care should also be taken when using ISS to compare data year on year if the ISS calculation has been based on different versions of AIS.52
A modification of the ISS, the New Injury Severity Score (NISS) has been suggested and considered a better model relating AIS to outcome.53,54 NISS, unlike ISS, uses the three highest AIS scores even if they are in the same anatomical region, because it was felt that ISS would underestimate the effect on outcome of two very severe injuries in one body region. NISS has been adopted as the standard by the EuroTarn (Trauma audit and research network) project, which aims to establish a consistent dataset and registry for data collection and outcome comparisons in Europe.
The Trauma Score (TS) was introduced as a physiologically based triage tool for use in the field, based on systolic blood pressure, capillary refill, respiratory rate, chest expansion and the Glasgow Coma Scale (GCS). It was suggested along with age to compliment the anatomical scores derived from AIS.55 However, incorporation of the TS was later reviewed owing to the difficulties of assessing capillary refill and chest expansion in the field and modified to the Revised Trauma Score (RTS).56
RTS is based on disturbances in three variables, each coded between 1 and 4:
Individually, both ISS and RTS had flaws as predictors of outcome from trauma. Boyd imaginatively combined these physiological and anatomical measures with coefficients to provide the Trauma Injury Severity Score (TRISS) methodology for outcome prediction.57 TRISS, which was developed from the data of 30 000 injured patients, included the presence of penetrating injury and age in its methodology for outcome prediction.51,56,57 Like other scoring systems it facilitates comparisons between trauma centres and year on year within centres by using expected and observed outcomes. However, because it uses the standard ISS rather than NISS, TRISS is exposed to the same tendency to underestimate the impact of more than one severe injury in the same anatomical region and risks poor calibration.58–61 TRISS was found to be no better than APACHE II for the patients requiring ICU admission.62 Also, as might be expected with improvements in trauma care, the TRISS coefficients have become progressively misaligned so that the original model has become less well calibrated.63,64
ASCOT (A Severity Characterization Of Trauma) was introduced to rectify perceived problems with TRISS.65 There are more details on injuries in the same body region, more age subdivisions and the use of emergency room acute physiology details rather than field values. ASCOT predicted survival better than TRISS, particularly for blunt injury. However, there has been reluctance to use ASCOT owing to its increased complexity for only a modest gain in predictive value.
Application of scoring systems
Since their introduction, scoring systems for general ICU patients have acquired a more defined role. Having originally been considered a method for quantifying risk of death and potentially managing ICU resources, they have found a more comfortable niche as the accepted tool for benchmarking research trials where case-mix is often similar in the control and active treatment groups. For an individual ICU the Standardized Mortality Ratio (SMR), which compares the observed hospital outcome with the expected one, is a useful measure. It is particularly helpful when used year on year to follow progress in quality of care. Even if a unit is poorly calibrated nationally, longitudinal within-unit performance comparisons remain valid assuming a wonder drug or treatment has not intervened and the case-mix has remained unchanged. Traditionally SMR values of 1 indicate expected performance, whereas values below 1 and above 1 indicate respectively better and worse performances than expected.
SMR values, which are surrogates for quality of care, have to be used with caution when comparisons are made between intensive care units. A case-mix that deviates from the original developmental case-mix can cause anomalies and variance in calibration from one unit to another.37
When calibration is not a cause for concern it still remains difficult to quantify whether a SMR of 1 is significantly worse than one of 0.8. This assessment would have to take account of the standard deviations around the logistic regression equations. As a rule it is wise to avoid comparisons unless samples are very large and with a similar distribution of similar case-mix.
Scoring systems have also been used to explore the association between nursing resource needs and acuity at presentation, however assessing nurse:patient ratios might be more simply based on organ support requirements. Scoring systems have also been used to predict length of stay and therefore estimate bed requirements.66
Decision making for an individual patient based on the predictions of scoring systems is universally considered inappropriate because these systems are unable to discriminate with certainty and have misclassification rates in excess of 15%.14,32,67,68 The logistic regression equations derived from large cohorts of mixed populations provide a probability for the dichotomous events of death or survival and therefore they have no potential use as a guide to further treatment or limitation orders for an individual.
While there are always attempts to correct for calibration and discrimination through new coefficients or new databases, the closest one can get to providing a system for individual prediction is through on-going recalibration with neural networks. Simplistically these systems use patient data feeding back to continually modify predictor equations. This approach theoretically gets closer and closer to predicting outcome, but it never reaches certainty.
Although it is important to recognise the hopelessly ill patient as early as possible, it is likely that management decisions will remain firmly based on clinical judgement rather than scores for the foreseeable future.
References
1. Teasdale, G, Jennett, B. Assessment of coma and impaired consciousness. A practical scale. Lancet. 1974; 2(7872):81–84.
2. Teasdale, G, Jennett, B. Assessment and prognosis of coma after head injury. Acta Neurochir (Wien). 1976; 34(1-4):45–55.
3. Jennett, B, Teasdale, G, Braakman, R, et al. Predicting outcome in individual patients after severe head injury. Lancet. 1976; 1(7968):1031–1034.
4. Ranson, JH, Rifkind, KM, Turner, JW. Prognostic signs and nonoperative peritoneal lavage in acute pancreatitis. Surg Gynecol Obstet. 1976; 143(2):209–219.
5. Pugh, RN, Murray-Lyon, IM, Dawson, JL, et al. Transection of the oesophagus for bleeding oesophageal varices. Brit J Surg. 1973; 60(8):646–649.
6. Nashef, SA, Roques, F, Michel, P, et al. European system for cardiac operative risk evaluation (EuroSCORE). Eur J Cardiothorac Surg. 1999; 16(1):9–13.
7. Cullen, DJ, Civetta, JM, Briggs, BA, et al. Therapeutic intervention scoring system: a method for quantitative comparison of patient care. Crit Care Med. 1974; 2:57–60.
8. Knaus, WA, Zimmerman, JE, Wagner, DP, et al. APACHE − acute physiology and chronic health evaluation: a physiologically based classification system. Crit Care Med. 1981; 9(8):591–597.
9. Le Gall, JR, Loirat, P, Alperovitch, A, et al. A simplified acute physiology score for ICU patients. Crit Care Med. 1984; 12(11):975–977.
10. Teres, D, Lemeshow, S, Avrunin, JS, et al. Validation of the mortality prediction model for ICU patients. Crit Care Med. 1987; 15(3):208–213.
11. Harrison, DA, Parry, GJ, Carpenter, JR, et al. A new risk prediction model for critical care: the Intensive Care National Audit & Research Centre (ICNARC) model. Crit Care Med. 2007; 35(4):1091–1098.
12. Palazzo, M, Soni, N. Critical-care studies: redefining the rules. Lancet. 1998; 352(9136):1306–1307.
13. Abraham, E, Laterre, PF, Garg, R, et al. Drotrecogin alfa (activated) for adults with severe sepsis and a low risk of death. N Engl J Med. 2005; 353(13):1332–1341.
14. Murphy Filkins, R, Teres, D, Lemeshow, S, et al. Effect of changing patient mix on the performance of an intensive care unit severity-of-illness model: how to distinguish a general from a specialty intensive care unit. Crit Care Med. 1996; 24(12):1968–1973.
15. Metnitz, PG, Moreno, RP, Almeida, E, et al. SAPS 3 – from evaluation of the patient to evaluation of the intensive care unit. Part 1: Objectives, methods and cohort description. Intensive Care Med. 2005; 31(10):1336–1344.
16. Moreno, RP, Metnitz, PG, Almeida, E, et al. SAPS 3 – from evaluation of the patient to evaluation of the intensive care unit. Part 2: Development of a prognostic model for hospital mortality at ICU admission. Intensive Care Med. 2005; 31(10):1345–1355.
17. Popovich, MJ. If most intensive care units are graduating with honors, is it genuine quality or grade inflation? Crit Crit Care Med. 2002; 30(9):2145–2146.
18. Zimmerman, JE, Kramer, AA, McNair, DS, et al. Acute Physiology and Chronic Health Evaluation (APACHE) IV: hospital mortality assessment for today's critically ill patients. Crit Care Med. 2006; 34(5):1297–1310.
19. Teres, D, Lemeshow, S. Using severity measures to describe high performance intensive care units. Crit Care Clin. 1993; 9(3):543–554.
20. Zimmerman, JE, Rousseau, DM, Duffy, J, et al. Intensive care at two teaching hospitals: an organizational case study. Am J Crit Care. 1994; 3(2):129–138.
21. Zimmerman, JE, Shortell, SM, Rousseau, DM, et al. Improving intensive care: observations based on organizational case studies in nine intensive care units: a prospective, multicenter study. Crit Care Med. 1993; 21(10):1443–1451.
22. Knaus, WA, Draper, EA, Wagner, DP, et al. An evaluation of outcome from intensive care in major medical centers. Ann Int Med. 1986; 104(3):410–418.
23. Blunt, MC, Burchett, KR. Out-of-hours consultant cover and case-mix-adjusted mortality in intensive care. Lancet. 2000; 356(9231):735–736.
24. Hackner, D, Shufelt, CL, Balfe, DD, et al. Do Faculty Intensivists Have Better Outcomes When Caring for Patients Directly in a Closed ICU versus Consulting in an Open ICU? Hosp Pract (Minneap). 2009; 37(1):40–50.
25. Wallace, DJ, Angus, DC, Barnato, AE, et al. Nighttime intensivist staffing and mortality among critically ill patients. N Engl J Med. 2012; 366(22):2093–2101.
26. Connors, AF, Dawson, NV, Thomas, C, et al. Outcomes following acute exacerbation of severe chronic obstructive lung disease. The SUPPORT investigators (Study to Understand Prognoses and Preferences for Outcomes and Risks of Treatments). Am J Respir Crit Care Med. 1996; 154(4 Pt 1):959–967.
27. Hamel, MB, Goldman, L, Teno, J, et al. Identification of comatose patients at high risk for death or severe disability. SUPPORT Investigators. Understand Prognoses and Preferences for Outcomes and Risks of Treatments. JAMA. 1995; 273(23):1842–1848.
28. Pochard, F, Azoulay, E, Chevret, S, et al. Symptoms of anxiety and depression in family members of intensive care unit patients: ethical hypothesis regarding decision-making capacity. Crit Care Med. 2001; 29(10):1893–1897.
29. Hayes, JA, Black, NA, Jenkinson, C, et al. Outcome measures for adult critical care: a systematic review. Health Technol Assess. 2000; 4(24):1–111.
30. Ridley, S, Plenderleith, L. Survival after intensive care. Comparison with a matched normal population as an indicator of effectiveness. Anaesthesia. 1994; 49(11):933–935.
31. Sage, W, Rosenthal, M, Silverman, J. Is intensive care worth it? An assessment of input and outcome for the critically ill. Crit Care Med. 1986; 14:777–782.
32. Knaus, WA, Draper, EA, Wagner, DP, et al. APACHE II: a severity of disease classification system. Crit Care Med. 1985; 13(10):818–829.
33. Lemeshow, S, Teres, D, Klar, J, et al. Mortality Probability Models (MPM II) based on an international cohort of intensive care unit patients. JAMA. 1993; 270(20):2478–2486.
34. Lemeshow, S, Hosmer, DW, Jr. A review of goodness of fit statistics for use in the development of logistic regression models. Am J Epidem. 1982; 115(1):92–106.
35. Bastos, PG, Sun, X, Wagner, DP, et al. Application of the APACHE III prognostic system in Brazilian intensive care units: a prospective multicenter study. Intens Care Med. 1996; 22(6):564–570.
36. Vazquez Mata, G, Rowan, K, Zimmerman, JE, et al. International comparisons of intensive care: meeting the challenges of different worlds of intensive care. Intensive Care Med. 1996; 22(2):156–157.
37. Harrison, DA, Brady, AR, Parry, GJ, et al. Recalibration of risk prediction models in a large multicenter cohort of admissions to adult, general critical care units in the United Kingdom. Crit Care Med. 2006; 34(5):1378–1388.
38. Knaus, WA, Wagner, DP, Draper, EA, et al. The APACHE III prognostic system. Risk prediction of hospital mortality for critically ill hospitalized adults. Chest. 1991; 100(6):1619–1636.
39. Castella, X, Artigas, A, Bion, J, et al. A comparison of severity of illness scoring systems for intensive care unit patients: results of a multicenter, multinational study. The European/North American Severity Study Group. Crit Care Med. 1995; 23(8):1327–1335.
40. Afessa, B. Benchmark for intensive care unit length of stay: One step forward, several more to go. Crit Care Med. 2006; 34(10):2674–2676.
41. Le Gall, JR, Lemeshow, S, Saulnier, F. A new Simplified Acute Physiology Score (SAPS II) based on a European/North American multicenter study. JAMA. 1993; 270(24):2957–2963.
42. Lemeshow, S, Teres, D, Pastides, H, et al. A method for predicting survival and mortality of ICU patients using objectively derived weights. Crit Care Med. 1985; 13(7):519–525.
43. Higgins, TL, Teres, D, Copes, WS, et al. Assessing contemporary intensive care unit outcome: an updated Mortality Probability Admission Model (MPM0-III). Crit Care Med. 2007; 35(3):827–835.
44. Knaus, WA, Draper, EA, Wagner, DP, et al. Prognosis in acute organ-system failure. Ann Surg. 1985; 202(6):685–693.
45. Marshall, JC, Cook, DJ, Christou, NV, et al. Multiple organ dysfunction score: a reliable descriptor of a complex clinical outcome. Crit Care Med. 1995; 23(10):1638–1652.
46. Vincent, JL, Moreno, R, Takala, J, et al. The SOFA (Sepsis-related Organ Failure Assessment) score to describe organ dysfunction/failure. On behalf of the Working Group on Sepsis-Related Problems of the European Society of Intensive Care Medicine. Intensive Care Med. 1996; 22(7):707–710.
47. Le Gall, JR, Klar, J, Lemeshow, S, et al. The Logistic Organ Dysfunction system. A new way to assess organ dysfunction in the intensive care unit. ICU Scoring Group. JAMA. 1996; 276(10):802–810.
48. States, JD. The Abbreviated and the Comprehensive Research Injury Scales. STAPP Car Crash J. 1969; 13:1532–8546.
49. American Association for Advancement of Automotive Medicine, The Abbreviated Injury Scale 1990 Revision. American Association for Advancement of Automotive Medicine, Arlington Heights, IL, 1990.
50. American Association for Automotive Medicine, The Abbreviated Injury Scale 1985 Revision. American Association for Advancement of Automotive Medicine, Arlington Heights, IL, 1985.
51. Baker, S, O'Neill, B, Haddon, W, Jr., et al. The injury severity score: A method for describing patients with multiple injuries and evaluating emergency care. J Trauma. 1974; 14:187–196.
52. Salottolo, K, Settell, A, Uribe, P, et al. The impact of the AIS 2005 revision on injury severity scores and clinical outcome measures. Injury. 2009; 40(9):999–1003.
53. Osler, T, Baker, SP, Long, W. A modification of the injury severity score that both improves accuracy and simplifies scoring. J Trauma. 1997; 43(6):922–925.
54. Haider, AH, Villegas, CV, Saleem, T, et al. Should the IDC-9 Trauma Mortality Prediction Model become the new paradigm for benchmarking trauma outcomes? J Trauma Acute Care Surg. 2012; 72(6):1695–1701.
55. Champion, HR, Sacco, WJ, Carnazzo, AJ, et al. Trauma score. Crit Care Med. 1981; 9(9):672–676.
56. Champion, HR, Sacco, WJ, Copes, WS, et al. A revision of the Trauma Score. J Trauma. 1989; 29(5):623–629.
57. Boyd, CR, Tolson, MA, Copes, WS. Evaluating trauma care: the TRISS method. Trauma Score and the Injury Severity Score. J Trauma. 1987; 27(4):370–378.
58. Cayten, CG, Stahl, WM, Murphy, JG, et al. Limitations of the TRISS method for interhospital comparisons: a multihospital study. J Trauma. 1991; 31(4):471–481.
59. Demetriades, D, Chan, L, Velmanos, GV, et al. TRISS methodology: an inappropriate tool for comparing outcomes between trauma centers. J Am Coll Surg. 2001; 193(3):250–254.
60. Norris, R, Woods, R, Harbrecht, B, et al. TRISS unexpected survivors: an outdated standard? J Trauma. 2002; 52(2):229–234.
61. Osler, TM, Rogers, FB, Badger, GJ, et al. A simple mathematical modification of TRISS markedly improves calibration. J Trauma. 2002; 53(4):630–634.
62. Wong, DT, Barrow, PM, Gomez, M, et al. A comparison of the Acute Physiology and Chronic Health Evaluation (APACHE) II score and the Trauma-Injury Severity Score (TRISS) for outcome assessment in intensive care unit trauma patients. Crit Care Med. 1996; 24(10):1642–1648.
63. Schluter, PJ, Nathens, A, Neal, ML, et al. Trauma and Injury Severity Score (TRISS) coefficients 2009 revision. J Trauma. 2010; 68(4):761–770.
64. Rogers, FB, Osler, T, Krasne, M, et al. Has TRISS become an anachronism? A comparison of mortality between the National Trauma Data Bank and Major Trauma Outcome Study databases. J Trauma Acute Care Surg. 2012; 73(2):326–331.
65. Champion, HR, Copes, WS, Sacco, WJ, et al. A new characterization of injury severity. J Trauma. 1990; 30(5):539–545.
66. Zimmerman, JE, Kramer, AA, McNair, DS, et al. Intensive care unit length of stay: Benchmarking based on Acute Physiology and Chronic Health Evaluation (APACHE) IV. Crit Care Med. 2006; 34(10):2517–2529.
67. Metnitz, PG, Lang, T, Vesely, H, et al. Ratios of observed to expected mortality are affected by differences in case mix and quality of care. Intens Care Med. 2000; 26(10):1466–1472.
68. Ridley, S. Severity of illness scoring systems and performance appraisal. Anaesthesia. 1998; 53(12):1185–1194.