Capnography
Overview
The capnograph functions as an “electronic stethoscope” that shows the cyclic appearance and disappearance of carbon dioxide (CO2): it appears when the lungs are being ventilated, and it disappears when they are not. The American Society of Anesthesiologists (ASA) updated their standards for basic anesthetic monitoring in July 1989, recommending that not only should carbon dioxide be identified in the expired gas to confirm correct placement of an endotracheal tube or laryngeal mask airway, it should also be a standard monitor for assessing ventilation for “every patient receiving general anesthesia.”1 The standards related to carbon dioxide monitoring were again updated effective July 2011 to include carbon dioxide monitoring for any patient undergoing moderate or deep sedation.2 Carbon dioxide homeostasis involves many organ systems. Most importantly, the clinician skilled in capnography can interpret the capnogram to gain information about a patient’s adequacy of ventilation as well as metabolism and the cardiovascular system.
Terms and Definitions
The Greek root kapnos, meaning “smoke,” is used to form the word capnometry, the practice of measuring the carbon dioxide in respiratory gas, and capnometer, the instrument used for this purpose. Carbon dioxide can be thought of as the “smoke” of cellular metabolism. The term capnometer is used to identify an instrument that provides only digital data—specifically, the minimum and maximum values of carbon dioxide during each respiratory cycle. This is in contrast to a capnograph, an instrument that displays, in addition to digital data, a capnogram, the graphic representation of the CO2 concentration, or partial pressure, over time (Fig. 10-1).
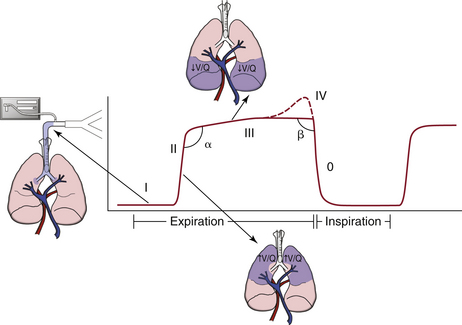
FIGURE 10-1 A typical capnogram of the upright lung during controlled mechanical ventilation. A capnogram has two segments, inspiratory and expiratory, that flow seamlessly into one another. The expiratory segment has an α-angle and three, or sometimes four, phases: anatomic dead space reveals an inspiratory baseline (I); a mixture of anatomic and alveolar dead space reveals the expiratory upstroke (α-angle) that divides phases II and III and reveals the ventilation/perfusion status of the lung (II); the alveolar plateau (III); and, occasionally, the terminal upswing (IV). The inspiratory segment includes the β-angle that follows phase III, and phase 0, showing the inspiratory downstroke.
Carbon dioxide levels are most commonly represented as a pressure-versus-time plot, or time capnography. An alternative and newer representation is as a pressure-versus-volume plot, or volumetric capnography (Fig. 10-2).3 The physiologic mechanisms responsible for the different phases in time capnography can be translated to the phases represented in volumetric capnography.4 The tracing of carbon dioxide concentration versus expired volume allows for a real-time continuous calculation and display of anatomic and physiologic dead space ventilation. The alterations of physiologic dead space measured in real time can be used to indicate changes in the alveolar dead space component because the anatomic component usually remains static. In fact, the volumetric capnogram and its derivative calculations may give a more accurate picture of the ventilation/perfusion (V/Q) ratio than the corresponding CO2-versus-time trace (Table 10-1).5,6
TABLE 10-1
Advantages of Time vs. Volume Capnography
| Time Capnography | Volume Capnography |
| Familiar, commonplace | Informs about lung V/Q status |
| Intubation not required | Provides Vd/Vt composition |
| Expiratory phase obvious | Provides airway gas flow data |
Vd/Vt, dead-space volume to tidal volume; V/Q, ventilation/perfusion.
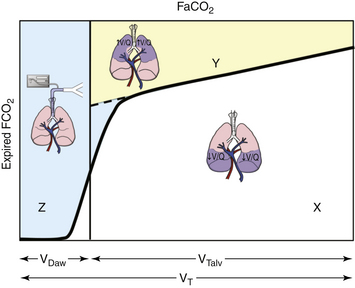
FIGURE 10-2 Volumetric capnograph of a single breath. FaCO2 represents the fraction of carbon dioxide of gas in equilibrium with arterial blood. Area Z (blue area) is the anatomic dead space. Area Y (yellow area) is the alveolar dead space, and area X (white area) is the volume of carbon dioxide (CO2) exhaled. The alveolar dead space fraction is Y/(X + Y), and the physiologic dead space fraction is (Y + Z)/(X + Y + Z). VDaw, anatomic dead space; VT, tidal volume; VTalv, alveolar tidal volume.
Both capnometers and capnographs digitally report carbon dioxide concentrations as “inspired” and “end tidal.” Actually, these instruments do not and cannot determine the different phases of respiration; they simply report the minimum and maximum CO2 values detected during each CO2 (respiratory) cycle. In certain instances—such as with an incompetent inspiratory valve, a Mapleson-type breathing system, or an erratic breathing pattern—the minimum CO2 concentration may not always equal the inspired CO2 concentration. Similarly, the maximum concentration measured may not always be the end-tidal concentration. Thus the terms minimum inspired (PICO2min) and maximum expired (PETCO2max) partial pressure of CO2 (PaCO2) are actually more correct. Most time-based capnograph devices can be configured to display the carbon dioxide recorded at two speeds: a high speed allows the user to interpret information about each breath, and a slow speed enables appreciation of the CO2 trend.
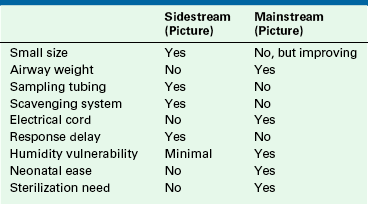
Two types of capnographs are in use; each has its advantages and disadvantages (Table 10-2). Sidestream, or sampling, capnographs aspirate respiratory gas from an airway sampling site at a rate of 50 to 400 mL/min. The sampled gas is transported through a tube to a nearby CO2 analyzer. Mainstream, or in-line, capnographs position the actual CO2 analyzer on the airway, and respiratory gas is analyzed in situ as it passes through a special adapter. No gas is removed from the airway with a mainstream analyzer.
Measurement Techniques
Several analytical techniques can be used to measure respiratory CO2. Carbon dioxide strongly absorbs infrared (IR) light, particularly at a wavelength of 4.3 μm. Thus most stand-alone capnometers and capnographs use IR light absorption, a relatively inexpensive technique, to measure respiratory carbon dioxide. The IR light absorbed is proportional to the concentration of the absorbing molecules, such as CO2, and the concentration of the gas can be determined by comparing the measured absorbance against a known standard. IR light absorbs all polyatomic gases; therefore CO2 concentration may be slightly influenced by the presence of water vapor or nitrous oxide (N2O). Mass spectrography, molecular correlation spectrography, Raman spectrography, and photoacoustic spectrography also can be used to measure CO2 concentration but are expensive and rarely used, or they are no longer available for clinical use. A chemical carbon dioxide indicator, the FEF end-tidal detector (Fenem, New York, NY) is a pH-sensitive chemical paper that changes color on exposure to CO2.7 The indicator paper changes color from purple (non–CO2-containing gas) to yellow (CO2-containing gas) in a semiquantitative manner (Fig. 10-3). This response is evident with the respiratory cycle as the carbon dioxide appears and disappears. This indicator is very sensitive to even low levels of CO2, such as may be present in the esophagus8; therefore proper intubation must still be recertified by the usual clinical techniques.
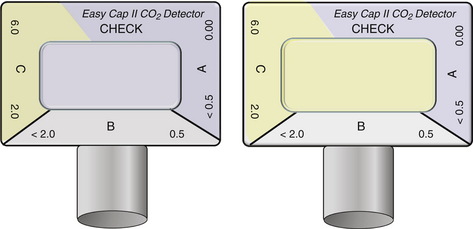
FIGURE 10-3 The color change in the chemical indicator of the Easy Cap II carbon dioxide detector reveals the semiquantitative presence of carbon dioxide (CO2). The image on the right demonstrates CO2 in the 2% to 6% range. (Image used by permission from Nellcor Puritan Bennett LLC, Boulder, CO, doing business as Covidien.)
Systematic Interpretation of Time Capnography
Carbon dioxide analysis can be broken down into three individual components: numbers (capnometry), curves (capnography), and gradients (arterial end-tidal CO2).9 When interpreting carbon dioxide values, presumptions of blood CO2 levels, pulmonary blood flow, and alveolar ventilation can be made; however, assessment of the numbers in conjunction with CO2 curves assists in correctly identifying clinical situations while taking into proper consideration the adequacy of gas sampling, presence of leaks in the system, and possible malfunction of the CO2 measuring equipment.
Is there exhaled CO2? This is the fundamental question for managing every airway. When the capnograph does not register exhaled CO2 following the patient’s exhalation, failure to ventilate the patient’s lungs is the most likely explanation, although other etiologies also should be entertained. This differential diagnosis includes esophageal intubation, accidental extubation, disconnection or failure of the sampling line or device, apnea, or cardiac arrest. The importance of capnography in helping to detect esophageal intubation cannot be overemphasized. To avoid misinterpretation of esophageal intubation as endotracheal, clinicians should confirm tracheal intubation not only by the presence, but also the persistent reappearance, of the CO2 waveform with each respiratory cycle. This repetitive efflux of carbon dioxide from the trachea easily distinguishes itself from CO2 trapped in the stomach or esophagus because esophageal intubation shows a progressive stepwise decrease in CO2 with successive ventilation (Fig. 10-4).10
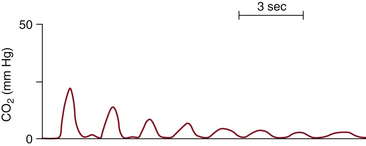
FIGURE 10-4 A typical capnogram from an esophageal intubation. Note the rapid decline of the exhaled CO2 to nearly zero. Compare this capnogram with the normal capnogram in Figure 10-1.
Interpreting CO2 in the midst of a cardiac arrest requires additional evaluation to affirm correct airway management. Lack of end-tidal CO2 or absence of color change on the CO2 indicator device following intubation alerts the practitioner to a likely incorrect placement of the airway device. However, in the event of a cardiac arrest, little or no end-tidal carbon dioxide (ETCO2) will be detected because no pulmonary blood flow is present to permit gas exchange. Direct visualization of the endotracheal tube passing through the vocal cords or the detection of bilateral breath sounds will aid further decision making.
Disconnection within the breathing system is easily detected with capnography by a flat capnogram and a CO2 reading of zero. A flat capnogram also is correctly produced by apnea, which may ensue when patients who were previously spontaneously breathing receive agents that hinder respiratory drive. Not until all the above mechanisms have been absolutely ruled out by clinical examination should failure of the capnograph be considered. If the capnograph itself is suspect, the anesthesiologist can quickly disconnect the sampling or sensing adapter and exhale into it to determine whether the capnograph is working and the sampling catheter is patent.
Inspiratory Segment
During mechanical inspiration (phase 0), fresh gas with no carbon dioxide flows by the CO2 sampling or sensing site, and the capnograph traces the inspiratory baseline (see Fig. 10-1). The CO2 concentration during this phase is zero because there is no rebreathing of CO2 with a normally functioning circle breathing system. If the inspiratory baseline is elevated and carbon dioxide is greater than zero, CO2 is being rebreathed; the differential diagnosis includes an incompetent expiratory valve, exhausted CO2 absorbent, gas channeling through the absorbent, or an imperfectly calibrated capnometer. Also, a rapid respiratory rate combined with a low tidal volume, as is often seen in small children, may exceed the frequency response characteristics of the monitor. The inspiratory baseline may or may not be elevated when the inspiratory valve is incompetent, depending on the size of the breath—that is, if the tidal volume is greater than the volume of the inspiratory hose, it will reach zero; if the tidal volume is less, it will not. Typically, a malfunctioning inspiratory valve and a sidestream capnograph with a high response time show an extension or decrease in the slope of the downstroke.11-14
Expiratory Segment
This segment of the capnograph tracing is divided into phases I, II, III, and occasionally IV (see Fig. 10-1).
Phases and Angles
Phase I
Shortly after mechanical inspiration ends, the lungs recoil, gas quickly exits through the trachea, and CO2-free gas from the apparatus and anatomic dead space, roughly one third of the tidal volume, passes by the IR sensor. Phase I appears as an extension of the horizontal baseline, extending that initiated during phase 0.
Phase II
As the CO2-free gas from the apparatus and the anatomic dead space is washed out and replaced by CO2-rich alveolar gas, the expiratory upstroke appears on the capnogram. The upstroke, which should be steep, becomes slanted or S-shaped if gas flow is partially obstructed, the sidestream analyzer is sampling gas too slowly,15 or the response time of the capnograph is too slow for the patient’s respiratory rate.16 Gas flow may be obstructed in the breathing system, such as by a kinked tracheal tube, or in the patient’s airway, as with chronic obstructive pulmonary disease or acute bronchospasm.
α-Angle
Phase II and phase III are separated by the α-angle.9 Changes in the α-angle correlate with the sequential emptying of the alveoli and thus the overall V/Q matching of the lung. As V/Q matching becomes more heterogenous, the variations in lung time constants increase, and the α-angle increases (α >90 degrees).17 This is further demonstrated by an increasing slope in phase III.
Phase III
As exhalation continues, the capnogram plateaus, with a slightly increasing slope. If ventilation and perfusion were perfectly matched in all lung regions, alveolar gas would have a constant CO2 concentration, and the expiratory plateau would be perfectly horizontal. However, ventilation and perfusion are not perfectly matched in all lung units, especially in patients who are supine and whose lungs are being mechanically ventilated with positive pressure.17 Therefore CO2 typically continues to increase slowly as a result of cyclic variation in alveolar CO2 during ventilation, which is greatest during expiration, or because of late emptying of the alveoli with the lowest V/Q ratio, which are therefore the richest in CO2.
β-Angle
The downstroke that follows phase III is normally 90 degrees (β-angle)9 and represents the inspiratory phase, during which CO2-free gas passes over the sampling sensor and is inhaled. Malfunctioning inspiratory valves and rebreathing and a low–tidal volume rapid respiratory rate will increase the β-angle and delay or prevent the inspiratory baseline from returning to zero. Examples of typical abnormal CO2 capnograms are illustrated in Figures 10-5 to 10-9.
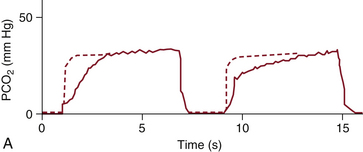
FIGURE 10-5 A capnogram showing increased airway resistance caused by bronchospasm or a kinked tracheal tube. The characteristic abnormal waveform (solid line) is superimposed on a normal waveform (dashed line). PCO2, partial pressure of carbon dioxide. (From van Genderingen HR, Gravenstein N, van der Aa JJ, et al: Computer-assisted capnogram analysis. J Clin Monit 1987; 3:198.)
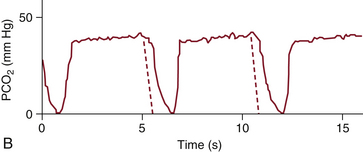
FIGURE 10-6 A capnogram showing an incompetent inspiratory valve, in which part of the expired gas flows back into the inspiratory limb and is inspired with the next breath. The characteristic abnormal waveform (solid line) is superimposed on a normal waveform (dashed line). PCO2, partial pressure of carbon dioxide. (From van Genderingen HR, Gravenstein N, van der Aa JJ, et al: Computer-assisted capnogram analysis. J Clin Monit 1987; 3:198.)
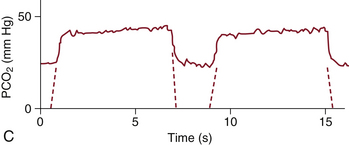
FIGURE 10-7 A capnogram showing an incompetent expiratory valve or soda lime depletion, in which expired gas is reinspired through the expiratory limb. The characteristic abnormal waveform (solid line) is superimposed on a normal waveform (dashed line). PCO2, partial pressure of carbon dioxide. (From van Genderingen HR, Gravenstein N, van der Aa JJ, et al: Computer-assisted capnogram analysis. J Clin Monit 1987; 3:198.)
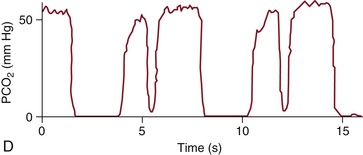
FIGURE 10-8 A capnogram of a patient taking breaths and overriding mechanical ventilation (solid line). PCO2, partial pressure of carbon dioxide. (From van Genderingen HR, Gravenstein N, van der Aa JJ, et al: Computer-assisted capnogram analyses. J Clin Monit 1987; 3:198.)
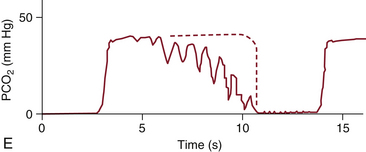
FIGURE 10-9 A capnogram showing cardiogenic oscillations caused by the rhythmic increase and decrease in intrathoracic volume with each cardiac cycle. The characteristic abnormal waveform (solid line) is superimposed on a normal waveform (dashed line). PCO2, partial pressure of carbon dioxide. (From van Genderingen HR, Gravenstein N, van der Aa JJ, et al: Computer-assisted capnogram analysis. J Clin Monit 1987; 3:198.)
Phase IV
Following the alveolar plateau, a terminal upswing may be seen (phase IV). Barring any intrinsic lung disease, this finding is linked to differing time constants within the lung, indirectly indicating V/Q matching. Phase IV tracings are most frequently seen in pregnant and obese patients because of a decrease in lung compliance and functional residual capacity.18
Arterial and End-Tidal Carbon Dioxide Gradient
The best measure of the adequacy of ventilation of the lungs is partial pressure of carbon dioxide (PaCO2). Typically, PaCO2 and PETco2 differ in patients without lung disease by approximately 5 mm Hg. This difference is due to V/Q mismatching in the lungs that results from temporal, spatial, and alveolar mixing defects. Several factors cause the normally small difference between PaCO2 and PETco2 to increase, and these can be divided into three components (Fig. 10-10):
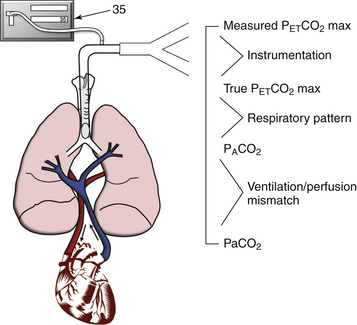
FIGURE 10-10 Components of the difference between partial pressure of carbon dioxide (PaCO2) and maximum concentration of end-tidal carbon dioxide (PETCO2 max).
1. PaCO2 − PACO2. The difference between arterial partial pressure of CO2 and the mixed alveolar partial pressure of CO2 (PACO2). Mismatching of ventilation (V) and perfusion (Q) increases the difference between PaCO2 and PACO2. Examples are pulmonary embolism and endobronchial intubation. Both increases and decreases in V/Q enlarge the difference between arterial and alveolar CO2. Consider a simplified, two-unit lung model (Fig. 10-11) with perfect matching of V and Q. Blood with a PaCO2 of 46 mm Hg returns to the lungs, and after equilibration, both the pulmonary capillary blood and the alveolar gas have a PaCO2 of 40 mm Hg. The alveolar gas is exhaled, and the capnograph reports a PETCO2 of 40 mm Hg. The PaCO2 is also 40 mm Hg, so in this simplified model the difference between PaCO2 and PETCO2 is zero.
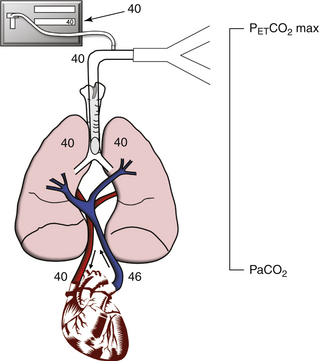
FIGURE 10-11 An idealized two-unit lung model demonstrates how ventilation/perfusion (V/Q) mismatching increases the difference between partial pressure of arterial carbon dioxide (PaCO2) and maximum concentration of end-tidal carbon dioxide (PETCO2 max). This figure shows perfect V/Q matching, in which the V/Q ratio equals 1; PaCO2 and PETCO2 max are both 40 mm Hg.
Endobronchial intubation is an extreme example of V/Q less than 1 (Fig. 10-12). All the blood flowing through the nonventilated lung represents shunt. As before, mixed venous blood with PCO2 of 46 mm Hg returns to the lungs; gas is exchanged in the ventilated lung, and pulmonary blood and alveolar gas in this lung unit end up with a PaCO2 of 40 mm Hg. The nonventilated lung unit allows no exchange of alveolar gas, so both pulmonary blood and alveolar gas eventually equilibrate at a PaCO2 of 46 mm Hg. Assuming equal distribution of blood flow, after pulmonary blood from the two lung units mixes, the resultant PaCO2 is 43 mm Hg ([46 + 40]/2). Alveolar gas from the ventilated lung unit only is exhaled and reaches the capnograph, which reports a PETCO2 of 40 mm Hg. In this simplified lung model, a decreased V/Q increases the difference between PaCO2 and PETCO2 from 0 to 3 mm Hg.
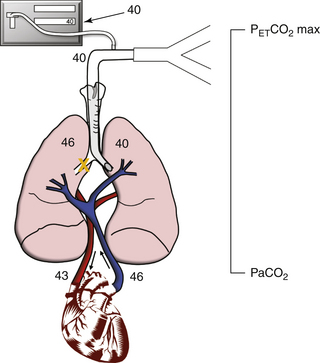
FIGURE 10-12 The effect of a large increase in shunt from a mainstem intubation. The ventilation/perfusion ratio is less than 1 because part of the lung is perfused but not ventilated. In this case, there is a 3 mm Hg difference between partial pressure of arterial carbon dioxide (PaCO2; 43 mm Hg) and the end-tidal carbon dioxide (PETCO2 max; 40 mm Hg).
In contrast, the much greater effect of a V/Q greater than 1 is illustrated by pulmonary embolism (Fig. 10-13). This is an example of increased dead space ventilation. Blood returning to the lungs has a PaCO2 of 46 mm Hg and can flow to only one lung unit because of the embolus. Thus alveolar gas in the nonperfused lung unit has a PaCO2 of zero. Pulmonary capillary blood and alveolar gas equilibrate in the perfused lung unit at a PaCO2 of 40 mm Hg, and the resulting PaCO2 is 40 mm Hg. Assuming equal ventilation of both lung units, the resultant PETCO2 is 20 mm Hg (from [40 + 0]/2). In this simplified lung model, an increased V/Q, such as that caused by pulmonary embolism, markedly increases the difference between PaCO2 and PETCO2 to 20 mm Hg. This increase is consistent with the difference between PaCO2 and PETCO2 measured in patients with acute pulmonary embolism.19,20
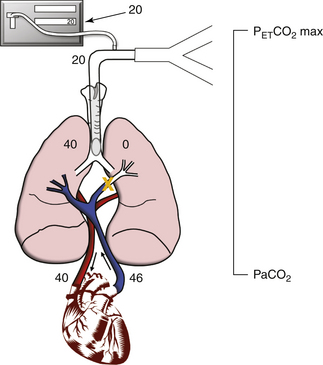
FIGURE 10-13 The effect of a large dead space from a pulmonary embolus. The ventilation/perfusion ratio is greater than 1 because part of the lung is ventilated but not perfused. In this case, a 20 mm Hg difference is seen between partial pressure of arterial carbon dioxide (PaCO2; 40 mm Hg) and the end-tidal carbon dioxide (PETCO2 max; 20 mm Hg).
2. PACO2 − true PETCO2. The difference between PACO2 and the true partial pressure of CO2 delivered to the upper airway, or actual CO2 at the sensing or sampling site (true PETco2). Breathing patterns that fail to deliver undiluted alveolar gas to the upper airway increase the difference between PACO2 and true PETCO2. An example is the higher frequency ventilation that occurs in neonates and infants. If the patient has a rapid respiratory rate and is breathing erratically or is not exhaling completely—such as in Figure 10-8, with chronic obstructive pulmonary disease or acute bronchospasm—a fully mixed alveolar gas sample may not be delivered to the upper airway. The alveolar sample not only must be delivered to the upper airway and then the CO2 sensor, it also must remain there long enough for the capnometer to measure it. Capnometry in neonates and small children typically results in a larger PaCO2 − PETCO2 gradient than in adults. Factors that contribute to this increase include a low tidal volume/equipment dead space ratio, a rapid respiratory rate, a high rate of fresh gas flow, and a rate of sampling by CO2 analyzer higher than the expiratory flow rate of these small subjects at the time of end exhalation.21 Uncuffed tracheal tubes, which are used in neonates and infants, compound the problem because exhaled gas escaping around the tube is not seen by the CO2 sensor in the capnometer.
3. True PETco2 − measured PETco2. The difference between true PETco2 and measured PETco2 reported by the capnograph. Problems with the capnograph itself can increase this component of the PaCO2 minus PETco2 gradient. Examples are sampling catheter leaks, calibration error, and slow instrument response time relative to the breathing pattern. Even if a mixed alveolar gas sample reaches the CO2 sensing or sampling site, problems with the capnograph itself, such as a miscalibrated unit, may result in inaccurate CO2 measurement. Small inaccuracies can arise if the processing algorithms in the capnograph do not accurately account for water vapor.22 IR analyzers must also compensate for high concentrations of nitrous oxide and oxygen. A capnograph with a slow response time increases the apparent inspired CO2 and decreases the PETCO2, thereby increasing the true PETCO2 − measured PETCO2 difference. Response time refers to how fast the instrument can measure a step change in CO2 concentration. For example, if the CO2 or sampling site is exposed to room air (CO2 free) and suddenly is flooded with 5% CO2, how long does it take for the capnograph to report a CO2 value of 5%? A typical IR 10% to 90% carbon dioxide analyzer response time is in the range 100 to 150 ms, which means it takes one tenth of a second for the device to go from measuring 10% of the CO2 concentration to 90% of the sampled concentration. The response time effect is operational both during inspiration and expiration. Because the inspiratory time is often shorter than the expiratory time, such as if the inspiratory/expiratory (I:E) ratio is 1:3, the artifactual appearance of inspired CO2 with rapid respiratory rates is easy to understand.
Why is response time clinically important? If the capnograph has a slow response time and the patient has a rapid respiratory rate, the respiratory gas may not remain at the CO2 sensing site long enough to be completely measured. The more rapid the response time, the more likely it is that the capnograph will accurately measure CO2 when the respiratory rate is high.23
A subtle problem with sidestream capnographs that leads to an increase in the true PETCO2 − measured PETCO2 difference is partial obstruction of the sampling system. For example, if the water filter becomes saturated or extra filters are inserted, resistance to gas flow increases, and the pressure within the CO2 analyzing chamber may become subambient.
Attempting to protect a sidestream analyzer from moisture by routinely inserting an extra filter may create a systematic error that increases the PaCO2 to PETCO2 difference in all patients. A solution to this moisture problem is to interpose a heat and moisture exchanger (HME) between the tracheal tube and the CO2 sampling site or to use a section of Nafion tubing (which is semipermeable to water vapor and reduces the moisture burden presented to the analyzer) for sampling linear to the airway
Clinical Applications
It is difficult to find scientific data that support the notion that anesthesia is inherently safer when PaCO2 is kept in the normal range (between 35 and 45 mm Hg). An objective during virtually every routine administration of anesthesia, however, is to maintain the patient’s vital signs and physiologic parameters as near as possible to preanesthetic values. This is certainly the goal for heart rate and blood pressure, and it makes intuitive sense to do this for carbon dioxide as well.
The physiologic consequences of hypercarbia and hypocarbia are well recognized. Increased PaCO2 causes respiratory acidosis, increases cerebral blood flow and intracranial pressure in susceptible patients,24 increases pulmonary vascular resistance, and causes potassium to shift from the intracellular fluid into the serum. Conversely, hypocarbia caused by excessive mechanical ventilation of the lungs causes respiratory alkalosis, decreases cerebral blood flow, decreases pulmonary vascular resistance, and causes potassium to shift from the serum to the intracellular fluid. For certain patients, each of these situations can have hazardous effects. The human body has the capacity to buffer 120 L of CO2,25 but during a prolonged anesthetic state in which the lungs are hyperventilated, this buffer becomes progressively depleted. Following emergence from anesthesia, metabolically produced CO2 is sequestered in this buffer. Consequently, PaCO2 increases at a slower rate than normal. In the same patients, the hypoxia-driven urge to breathe is blunted by residual anesthetics and also shifts the CO2 ventilatory drive curve to the right. Thus the patient can hypoventilate, or even become apneic, with neither a strong oxygen or carbon dioxide stimulus to breathe. With capnometry and an estimation of the difference between PaCO2 and PETCO2, the parameters for mechanical ventilation can be adjusted to better maintain normocapnia and avoid the adverse sequelae of either hyperventilation or hypoventilation.
Cardiopulmonary Resuscitation
Capnography is emerging as an important monitor during cardiopulmonary resuscitation (CPR), during which PETCO2 is low; this reflects the decreased pulmonary blood flow generated by chest compression when compared with that during normal cardiac contraction. Return of spontaneous circulation and increased pulmonary blood flow immediately and significantly increases PETCO2,26 which often makes this the earliest sign of successful resuscitation. In one study of 10 patients who had out-of-hospital cardiac arrests, the mean PETCO2, which was 1.7% ± 0.6% (12.1 mm Hg ± 4.3 mm Hg) during chest compression, rose rapidly to 4.6% ± 1.4% (32.8 mm Hg ± 10 mm Hg) following the return of spontaneous circulation.27 Noting the difficulty in palpating peripheral arterial pulses during CPR, some investigators use PETCO2 to assess the hemodynamic responses to CPR noninvasively.28 Unlike the electrocardiogram (ECG), invasive pressure manometer, and pulse palpation, the capnograph does not require interruption of chest compressions, nor is it vulnerable to the mechanical artifacts of chest compressions. Therefore PETCO2 can be assessed without interrupting CPR.
Other studies have examined whether PETCO2 can be used to differentiate cardiac arrest patients likely to be resuscitated from those unlikely to be resuscitated. In one study, Callahan and Barton29 found that following tracheal intubation, an initial PETCO2 greater than 15 mm Hg during CPR predicted the eventual return of pulsatile circulation with a sensitivity of 71% and a specificity of 98%. Similarly, Sanders and colleagues30 demonstrated that a PETCO2 greater than 10 mm Hg during CPR helped predict those patients who would eventually be resuscitated. The investigators in each study cautioned, however, that a few patients with low PETCO2 were eventually resuscitated, so the clinician must incorporate all other available clinical data when deciding whether or not to continue CPR. If the patient’s PETCO2 is greater than 10 or 15 mm Hg during stable minute ventilation, this indicates that CPR is achieving some pulmonary blood flow. Because of a higher probability of the return of pulsatile circulation, CPR should be continued in these patients.
A persistently low or progressive decrease in PETCO2 during CPR requires consideration of several, possibly concurrent diagnoses that include 1) esophageal intubation, 2) cardiac tamponade, 3) tension pneumothorax, 4) massive pulmonary embolus, 5) hypovolemia, 6) hyperventilation, and 7) ineffective CPR.
A low or absent PETCO2 is not necessarily diagnostic of esophageal intubation; however, during CPR, this possibility must still be ruled out by clinical assessment. Hypovolemia, cardiac tamponade, pneumothorax, and pulmonary embolus can each create a V/Q ratio greater than 1 by interfering with cardiac filling and pulmonary blood flow, causing a low PETCO2; ineffective CPR may have a similar effect and may be the result of poor technique (compression location, compression depth, or compression/relaxation) or resuscitator fatigue.31 Alveolar hyperventilation is common during CPR when an enthusiastic resuscitator manually hyperventilates the lungs of a patient who already has a markedly decreased pulmonary blood flow. Keeping constant and normal minute ventilation is essential to derive maximum benefit from airway CO2 monitoring during CPR.
Ventilatory Management
Intensivists have long sought a noninvasive method to guide the weaning of patients from mechanical ventilation. Can capnography be used in lieu of blood gas analysis? Two studies showed that, although changes in PETCO2 parallel changes in PaCO2, the large and often variable difference between PaCO2 and PETCO2 in patients in the intensive care unit (ICU) renders capnograph relatively insensitive to hypercarbia in this setting.32,33 For example, in one case, a patient had a 10 mm Hg increase in PaCO2 with no change in PETCO2.32 Thus, although capnography is useful for detecting many critical incidents in the ICU, at present, unless PaCO2 − PETCO2 is known and stable, periodic blood gas analysis remains the method preferred by most intensivists for weaning patients from mechanical ventilation.
The insensitivity to hypercarbia in many ICU patients is also a shortcoming of capnography in the operating room (OR). Therefore, regardless of the setting, if it is important to know a patient’s precise PaCO2, blood gas analysis is still needed. Once the relationship between PaCO2 and PETCO2 for a patient has been quantified, the value serves as a useful guide for future clinical management. Any time a significant change is seen in blood pressure, tidal volume, continuous positive airway pressure, or any other parameter that can alter a patient’s V/Q, its effect on PaCO2 and PETCO2 must be considered. Some investigators have used changes in PaCO2/PETCO2 to define recovery from pulmonary disease and to guide therapy.34 Even in patients with a large PaCO2 –PETCO2 gradient, if maximal exhalation is actively or passively performed, or if the peak PETCO2 encountered over several minutes is used, the PaCO2/PETCO2 gradient becomes very small.35 A patient’s metabolic rate may be evaluated with PETCO2 once it is correlated with the arterial value, and appropriate ventilator settings can be applied for CO2 elimination.36 This can further help guide decisions on the likelihood of successful extubation in light of high metabolic rates, such as occurs with sepsis.
Capnography is also increasingly used in the ICU, or during transport to and from the ICU, for the same purpose as in the OR: to alert the clinician to life-threatening problems such as disconnection,37 failure of the mechanical ventilator, and severe hypercapnia or hypocapnia. In patients dependent on stable ventilation, such as those with elevated intracranial pressure, the capnograph is an indispensable real-time monitor that is especially relevant during transport.24
An additional application of capnography is to maximize the benefits of positive end-expiratory pressure (PEEP) in acute respiratory distress syndrome (ARDS). By minimizing the arterial to end-tidal CO2 gradient, excessive development of “West zone 1” in the lung will be limited.38 This titration of PEEP can assist in 1) restoring lung volume, 2) decreasing pulmonary vascular resistance, 3) decreasing dead space (Vd/Vt), and 4) improving V/Q matching. Recognizing the ventilation of alveolar dead space led Hubble and colleagues39 to devise predictions of successful extubation. One predictor of successful extubation is a difference between dead space and tidal volume (Vd/Vt) of 0.5 or less, and a Vd/Vt of 0.65 or greater was associated with a need for additional respiratory support. Nuckton and colleagues40 found that patients with a Vd/Vt of 63% or greater were at a significant risk of death; therefore this (arterial–end-tidal) CO2 parameter is of particular clinical interest for patient management.
Pulmonary Embolism
Capnography has been used to aid in the diagnosis of embolisms of all types. A pulmonary embolism represents an increase in pulmonary dead space that results from a sudden decrease in pulmonary perfusion without ventilatory change. These nonperfused alveoli (Vd/Vt) mix with the exhaled gas from perfused alveoli and result in a decreased PETCO2 relative to the PaCO2. The magnitude of the decrease in PETCO2 resulting from an embolism has been shown to correlate with the severity of the size of the perfusion deficit and pulmonary artery pressure.41
A definitive diagnosis of pulmonary embolism by capnometry often is limited by the lack of a known baseline alveolar dead space for each patient and other pathologic mechanisms that decrease pulmonary perfusion and increase dead space. A common clinical situation that mimics alveolar dead space development is pulmonary arterial hypotension stemming from hemorrhagic, septic, or cardiogenic shock. Pulmonary artery hypotension is also exacerbated by positive-pressure ventilation, which further confounds the issue.
Untoward Events
Clinicians use capnography intraoperatively to detect untoward events that might injure the anesthetized patient if undetected and uncorrected. A number of studies support the premise that capnography can detect many of the problems most likely to injure an anesthetized patient and help guide clinical management. For example, when the technique of critical incident analysis was adapted to study human error and equipment failure in anesthesia, disconnection of the breathing circuit during mechanical ventilation was the most frequently identified critical incident.42 Capnography readily detects disconnection within the breathing system. Of the 25 most frequent critical incidents identified in this study, more than 40% could have been identified with data from the capnometer.
Another study that strongly supports the intraoperative use of capnography is the ASA’s closed claim study.43 In this study, experts reviewed closed malpractice claims against anesthesiologists. After reviewing 1541 cases, they identified “respiratory events” as the single largest class of problems that resulted in litigation. More than one third (34%) of the adverse outcomes were associated with respiratory events. Of these, 35% were attributed to inadequate ventilation of the patient’s lungs, 18% to esophageal intubation, and 17% to difficult tracheal intubation. Both inadequate ventilation of the patient’s lungs and esophageal intubation are readily detected with capnography.
Noninvasive Capnography for Sedation
Providing sedation for patients undergoing minor procedures is an increasingly common clinical practice. Of particular concern for the provider is maintaining appropriate oxygenation for these spontaneously breathing patients. Vargo and colleagues44 studied outpatient endoscopy patients and found that unrecognized apnea is a constant risk that is detectable via pulse oximetry, auscultation, or clinical observation less than half the time. Closed claim analysis of dental procedures performed in 1991 showed that an “avoidable” ventilatory depression or airway obstruction that led to hypoxia was primarily responsible for the majority of catastrophic complications.45 In fact, ventilatory depression is such a frequent occurrence during monitored sedation that in many procedures, it represents a greater danger than the procedure itself.46
Detecting respiratory obstruction and insufficiency is a key element in the utility of capnography for spontaneously breathing patients undergoing sedation. If patients are breathing supplemental oxygen, pulse oximetry may lag behind ventilatory deficiency long enough to allow drastically elevated PaCO2 levels to occur.47,48 Noninvasive capnography can provide an early warning signal to detect respiratory obstruction or insufficiency, which affords the provider the time to implement interventions to avert ensuing hypoxia. The American Society of Gastrointestinal Endoscopy published guidelines for the use of deep sedation and anesthesia for gastrointestinal endoscopy, acknowledging that “capnography more readily identifies patients with apneic episodes and, when used to guide sedation, results in less CO2 retention.”44
The provider should consider the cardiovascular status and pulmonary disease of the patient when interpreting the PETCO2 during noninvasive monitoring. The alveolar/end-tidal CO2 gradient is easily altered by conditions of hypoventilation, mouth breathing, poor respiratory effort, and coadministration of high-flow oxygen; thus attention to the details of acquiring a good expiratory gas specimen are particularly important in this setting. Regardless, the trend of end-tidal carbon dioxide and the respiratory rate as reported by the capnometer both alert the provider to respiratory obstruction or insufficiency. Subsequently, the utility of capnography has been extended to monitor patients with acute bronchoconstriction,49 obstructive sleep apnea,50 neuromuscular disease,51 and diabetic ketoacidosis52 as well as those receiving emergency medical technician and ambulance services and emergency department procedures.53,54
The success of capnography to detect inadequate ventilation and thwart hypoxia has led the ASA to mandate the monitoring of ventilation with capnometry during procedural sedation: “During moderate or deep sedation the adequacy of ventilation shall be evaluated by continual observation of qualitative clinical signs and monitoring for the presence of exhaled carbon dioxide unless precluded or invalidated by the nature of the patient, procedure, or equipment.”55
Common Pitfalls
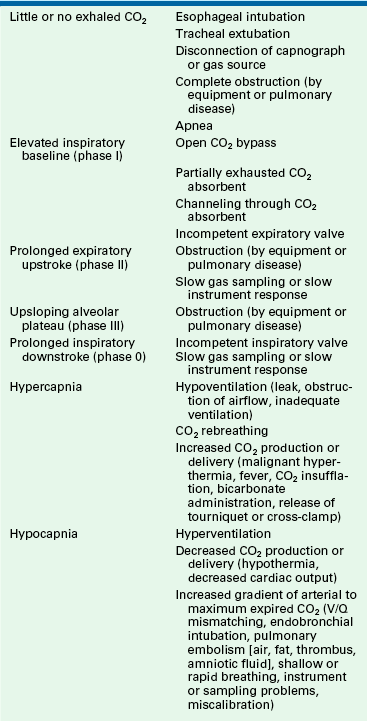
The clinician using the capnograph must avoid three common pitfalls. First, capnography is not a substitute for maintaining sharp clinical skills (inspection, palpation, and auscultation). The capnometer is a very reliable electrical, optical, and mechanical instrument, but it will still occasionally fail; therefore data from the capnography and clinical assessment should be combined to serve as a check-and-balance system so that even in the event of instrument failure, competent monitoring will continue. Second, clinicians using a capnograph must do more than assess the end-tidal CO2 value reported; they must also interpret the capnogram. Third, and most important, the effective use of capnography depends on understanding the relationship between PaCO2 and PETCO2. Table 10-3 summarizes common problems that can be diagnosed completely or in part with the capnograph.
References
1. American Society of Anesthesiologists. Standards for Basic Anesthetic Monitoring. Approved by the House of Delegates 21 October 1986 and last amended on 15 October 2003.
2. American Society of Anesthesiologists. Standards for Basic Anesthetic Monitoring. Approved by the House of Delegates 21 October 1986 and last amended on October 20, 2010.
3. Romero P.V., Lucangelo U. Lopez Aguilar J, Fernandez R, Blanch L: Physiologically based indices of volumetric capnography in patients receiving mechanical ventilation. Eur Respir J. 2000;10:232–233.
4. Schmmitz B.D., Shapiro B. Capnography. Resp Care Clin North Am. 1995;1:107–117.
5. Hoffbrand B.I. The expiratory capnogram: a measure of ventilation-perfusion inequalities. Thorax. 1966;21:518–523.
6. Bhavani-Shanker K., Kumar A.Y., Moseley H., Hallsworth R.A. Terminology and the current limitations of time capnography: a brief review. J Clin Monit. 1995;11:175–182.
7. Goldberg J.S., Rawle R.P., Zehnder J.L., et al. Colorimetric end-tidal carbon dioxide monitoring for tracheal intubation. Anesth Analg. 1990;70:191–194.
8. Puntervoll S.A., Soreide E., Jacewicz W., Bjelland E. Rapid detection of esophageal intubation: take care when using colorimetric capnometry. Acta Anaesthesiol Scand. 2003;46:455–457.
9. Bhavani-Shanker K., Philip J.H. Defining segments and phases of a time capnogram. Anesth Analg. 2000;91:973–977.
10. Good M.L., Modell J.H., Rush W. Differentiating esophageal from tracheal capnograms. Anesthesiology. 1988;69:A266. (abstract)
11. van Ganderingen H.R., Gravenstein N., van der Aa J.J., Gravenstein J.S. Computer-assisted capnogram analysis. J Clin Monit. 1988;3:194–200.
12. Berman L.S., Pyles S.T. Capnographic detection of anesthesia circle valve malfunctions. Can J Anaesth. 1988;35:473–475.
13. Pascucci R.C., Schena J.A., Thompson J.E. Comparison of sidestream and mainstream capnometers in infants. Crit Care Med. 1989;17:560–562.
14. Kumar A.Y., Bhavani-Shanker K., Moseley H.S.L., Delph Y. Inspiratory valve malfunction in a circle system: pitfalls in capnography. Can J Anaesth. 1992;39:997–999.
15. Gravenstein J.S. Gas monitoring and pulse oximetry. Boston: Butterworths; 1990.
16. Gravenstein N. Capnometry in infants should not be done in lower sampling rates [letter]. J Clin Monit. 1989;5:63.
17. Hess D. Capnometry and capnography: technical aspects, physiologic aspects, and clinical applications. Resp Care. 1990;35:557–576.
18. Fletcher R., Jonson B., Cumming G., Brew J. The concept of deadspace with special reference to the single breath test for carbon dioxide. Br J Anaesth. 1981;53:77–88.
19. Hatle L., Rokesth R. The arterial to end-expiratory carbon dioxide tension gradient in acute pulmonary embolism and other cardiopulmonary disease. Chest. 1974;66:352–357.
20. Warwick W.J. The end-expiratory to arterial carbon dioxide tension ratio in acute pulmonary embolism. Chest. 1975;68:609–611.
21. Badgewell J.M., Heavner J.E., May W.S. End-tidal PCO2 monitoring in infants and children ventilated with either a partial rebreathing or a non-rebreathing circuit. Anesthesiology. 1987;66:959–964.
22. Severinghaus J.W. Water vapor calibration errors in some capnometers: respiratory conventions misunderstood by manufacturers. Anesthesiology. 1989;70:996–998.
23. Brunner J.X., Westenskow D.R. How carbon dioxide analyzer rise time affects the accuracy of carbon dioxide measurements. J Clin Monit. 1988;4:134.
24. Kerr M.E., Zempsky J., Serika S., Orndoff P., Rudy E. Relationship between arterial carbon dioxide and end-tidal carbon dioxide in mechanically ventilated adults with severe head trauma. Crit Care Med. 1996;24:785–796.
25. Nunn J.F. Applied respiratory physiology, ed 3. London: Butterworths; 1987. p 226
26. Falk J.L., Rackow E.C., Weil M.H. End-tidal carbon dioxide concentration during cardiopulmonary resuscitation. N Engl J Med. 1988;318:607–711.
27. Garnett AR, Ornato JP, Gonzalez ER, et al: End-tidal carbon dioxide monitoring during cardiopulmonary resuscitation, JAMA 257:512–515.
28. Weil M.H., Gazmuri R.J., Kette F., et al. End-tidal PCO2 during cardiopulmonary resuscitation. JAMA. 1990;263:814–815.
29. Callaham M., Barton C. Prediction of outcome from cardiopulmonary resuscitation from end-tidal carbon dioxide concentration. Crit Care Med. 1990;18:358–362.
30. Sanders A.B., Kern K.B., Otto C.W. Prediction from outcome of cardiopulmonary resuscitation: a prognostic indicator for survival. JAMA. 1989;262:1347–1351.
31. Kalenda Z: The capnogram as a guide to the efficacy of cardiac massage, Resuscitation 6:259–263.
32. Healey C.H., Fedullo A.J., Swinburne A.J., et al. Comparison of non-invasive measurement of carbon dioxide during withdrawal from mechanical ventilation. Crit Care Med. 1987;15:764–768.
33. Niehoff J., del Guercio C., LaMorte W., et al. Efficacy of pulse oximetry and capnography and capnometry in positive ventilatory weaning. Crit Care Med. 1988;16:701–705.
34. Chopin C., Fesard P., Mangaloaboyi J., et al. Use of capnography in diagnosis of pulmonary embolism during acute respiratory failure of chronic obstructive respiratory disease. Crit Care Med. 1990;18:353–357.
35. Weigner M.B., Brimm J.E. End-tidal carbon dioxide as a measure of arterial carbon dioxide during intermittent mandatory ventilation. J Clin Monit. 1987;3:73–79.
36. Tasker V., John J., Larsson A., Wetterberg T., Johnson B. Dynamics of carbon dioxide elimination following ventilator resetting. Chest. 1995;8:196–202.
37. Palmon S., Maywin L., Moore L., Kirsch J. Capnography facilitates tight control of ventilation during transport. Crit Care Med. 1996;24:608–611.
38. Rose J.T., Banner M.J. Effects of positive end-expiratory pressure (PEEP) on physiologic deadspace volume to tidal volume ratio (Vd/Vt) [abstract]. Crit Care Med. 2000;28:A86.
39. Hubble C.L., Gentile M.A., Tripp D.S., et al. Dead space to tidal volume ratio predicts successful extubation in infants and children. Crit Care Med. 2000;38:2034–2040.
40. Nuckton T.J., Alonso J.A., Kallet R.H., et al. Pulmonary dead-space fraction as a risk factor for death in the acute respiratory distress syndrome. N Engl J Med. 2002;346:1281–1286.
41. Kline J.A., Kubin A.K., Patel M.M., Easton E.J., Seupal R.A. Alveolar dead space as a predictor of severity of pulmonary embolism. Acad Emerg Med. 2000;7:611–617.
42. Cooper J.B., Newbower R.S., Kitz R.J. An analysis of major errors and equipment failures in anesthesia management: considerations for prevention and detection. Anesthesiology. 1984;60:34–42.
43. Caplan R.A., Posner K., Ward R.J., et al. Adverse respiratory advents in anesthesia: a closed claims analysis. Anesthesiology. 1990;72:828–833.
44. Vargo J., Waring P., Faigel D., et al. Guidelines for the use of deep sedation and anesthesia for GI endoscopy. Gastrointest Endosc. 2002;56:613–617.
45. Jastek J.T., Peskin R.M. Major morbidity or mortality from office anesthetic procedures: a closed-claim analysis of 13 cases. Anesth Prog. 1991;38:39–44.
46. Galandiuk S., Ahmad P. Impact of sedation and resident teaching on complications of colonoscopy. Dig Surg. 1998;15:60–63.
47. Croswell R.J.R., Dilley D.C., Lucas W.J., Vann W.F. A comparison of conventional versus electronic monitoring of sedated pediatric dental patients. Pediatric Dent. 1995;17:332–339.
48. Hart L.S., Berns S.D., Houck C.S., Boenning D.A. The value of end-tidal CO2 monitoring when comparing three methods of conscious sedation for children undergoing painful procedures in the emergency department. Pediatr Emerg Care. 1997;13:189–193.
49. Toubas P.L., Duke J.C., Seakr K.C., McCaffree M.A. Microphonic versus end-tidal carbon dioxide nasal airflow detection in neonates with apnea. Paediatrics. 1990;6:950–954.
50. Magnan A., Philip-Joet F., Rey M., et al. End-tidal CO2 analysis in sleep apnea syndrome: conditions for use. Chest. 1993;102:129–131.
51. Kotterba S., Patzold T., Malin J.B., Orth M., Rasche K. Respiratory monitoring in neuromuscular disease. Clin Neurol Neurosurg. 2001;103:87–91.
52. Garcia E., Abramo T.J., Okada P., et al. Capnometry for noninvasive continuous monitoring of metabolic status in pediatric diabetic ketoacidosis. Crit Care Med. 2003;31:2539–2543.
53. Miner J.R., Heegaard W., Plummer D. End-tidal carbon dioxide monitoring during procedural sedation. Acad Emerg Med. 2002;9:275–280.
54. McQuillen K.K., Steele D.W. Capnography during sedation/analgesia in the pediatric emergency department. Pediatr Emerg Care. 2000;16:401–404.
55. Practice Guidelines for Sedation and Analgesia by Non-Anesthesiologists. Approved by the House of Delegates on October 25, 1995 and last amended October 17, 2001.