Pulse Oximetry
Steven J. Barker∗
Overview
No monitor of oxygenation has had as much impact on the practice of anesthesiology as the pulse oximeter. Unknown in the operating room (OR) before the 1980s, the pulse oximeter is now a minimum standard of care for all patients who receive anesthetics, whether general, regional, or local. Its operation requires no special skill or training, and its use is noninvasive and therefore almost risk free. The pulse oximeter gives continuous, real-time estimates of arterial hemoglobin saturation, which can warn of hypoxemia from many causes, including loss of airway patency, loss of oxygen supply, and increases in venous admixture. As illustrated in Figure 11-1, pulse oximetry provides a monitor of the second of four stages of the oxygen transport process. This important advance goes beyond the first stage of inspired gas monitoring, but it does not ensure the third stage of adequate oxygen delivery to vital organs.
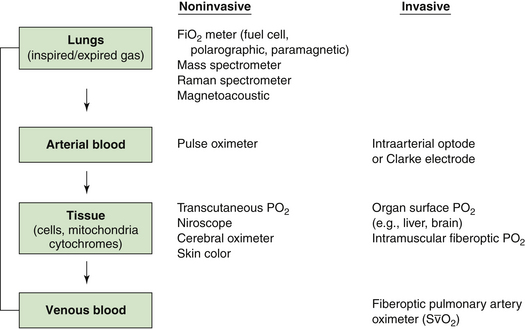
FIGURE 11-1 The four stages of the oxygen transport system, showing that the pulse oximeter monitors oxygen at the level of the arterial blood. Respired gas monitors can confirm only that oxygen is being delivered to the lungs, but the pulse oximeter also monitors the function of the lungs in transporting this oxygen to the arterial blood. Pulse oximetry does not guarantee that oxygen is being delivered to or used by the tissues; this can be determined only by monitors that function further down the oxygen transport chain. FiO2, fractional concentration of inspired oxygen; PO2, oxygen tension; S O2, mixed venous oxygen saturation.
This chapter reviews the historic development of pulse oximetry, its underlying physical and engineering principles, and recent improvements such as artifact reduction and multiwavelength processing. An understanding of these principles will enable the reader to predict sources of measurement error. Pulse oximeter accuracy, response, clinical applications, limitations, and future potential are also discussed.
Hemoglobin Saturation and Oxygen Transport
The pulse oximeter provides a noninvasive estimate of arterial hemoglobin saturation, a variable directly proportional to the oxygen content of arterial blood. Two definitions of hemoglobin saturation are in current use. The older definition, called functional saturation, or SaO2, is related to the concentrations of oxyhemoglobin (O2Hb) and deoxygenated, or “reduced,” hemoglobin (RHb) as follows:

Additional species of hemoglobin are often present in adult blood, including carboxyhemoglobin (COHb) and methemoglobin (MetHb). This leads to the definition of fractional hemoglobin saturation, or O2Hb%, which is the ratio of oxyhemoglobin to the total concentration of all hemoglobin species:

In this formula, Hb is the total hemoglobin, the sum of all species present. Fractional saturation is sometimes called oxyhemoglobin fraction or oxyhemoglobin percent.1 Fractional arterial hemoglobin saturation is related to the arterial oxygen content, CaO2, by the following formula:

Here PaO2 is the arterial oxygen tension in millimeters of mercury. The first expression in brackets in Equation 11-3 represents the oxygen bound to hemoglobin, which under normal conditions (Hb = 15 g/dL and O2Hb% = 98) equals approximately 20 mL oxygen per 100 mL blood. The second expression represents oxygen dissolved in plasma, which equals 0.3 mL per 100 mL for a PaO2 of 100 mm Hg. Plasma-dissolved oxygen usually does not play a significant role in oxygen transport. Equation 11-3 shows that arterial oxygen content is directly proportional to both total hemoglobin (Hb) and fractional saturation. O2Hb% and PaO2 are related by the oxyhemoglobin dissociation curve, shown in Figure 11-2. Under normal conditions, this relationship predicts a hemoglobin saturation for adults of 50% at a PaO2 of 27 mm Hg, 75% at a PaO2 of 40 mm Hg (the typical venous blood value), and 90% at a PaO2 of 60 mm Hg. This normal dissociation curve is shifted to the right by acidosis, hypercarbia, hyperthermia, and increases in 2,3-diphosphoglycerate (2,3-DPG) concentration. Note that for PaO2 values greater than 90 mm Hg, O2Hb% is nearly independent of PaO2. This saturation property of hemoglobin has important implications in the clinical interpretation of pulse oximeter data, discussed below.
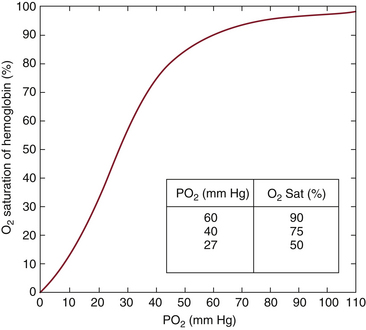
FIGURE 11-2 The oxyhemoglobin dissociation curve. Hemoglobin saturation is plotted as a function of arterial oxygen tension (PaO2) in millimeters of mercury. Under normal conditions for adults, a PaO2 of 27 mm Hg yields a saturation of 50% (P50). The curve is shifted to the right by acidosis, hypercarbia, increases in 2,3-diphosphoglycerate (2,3-DPG), and hyperthermia.
The amount of oxygen delivered to the tissues by the arterial blood (O2del) is simply the product of the arterial oxygen content (CaO2) and the cardiac output, or

The factor of 10 appears because CaO2 is measured in milliliters per deciliter, whereas cardiac output is measured in liters per minute. The quantity of oxygen consumed per minute is then the difference between the arterial oxygen delivery (O2del) and the venous oxygen return (O2ret):
Arterial oxygen content and mixed venous oxygen content (CvO2) in this form of the Fick equation can be replaced by corresponding expressions in terms of hemoglobin saturation from Equation 11-3:

Subscripts a and v denote arterial and mixed venous fractional hemoglobin saturations, respectively. The small contributions of plasma-dissolved oxygen have been neglected in this form of the Fick equation. Equation 11-6 describes the relationship between oxygen consumption, arterial and mixed venous hemoglobin saturations, total hemoglobin, and cardiac output. An understanding of this equation is vital to the interpretation of data from pulse oximeters and other oxygen monitors and to understanding their relationship to other hemodynamic variables.
History of Pulse Oximetry
Although the pulse oximeter became a monitoring standard in the OR in the 1980s, in vivo oximeters date to the 1930s. In 1935, Carl Matthes developed the first instrument that measured hemoglobin oxygen saturation by transilluminating tissue. Matthes’s device used two wavelengths of light, one visible and one infrared (IR), much like the modern pulse oximeter. This instrument could follow saturation trends but was difficult to calibrate. J.R. Squires developed a similar instrument that calibrated itself by compressing the ear to eliminate blood, a technique used later in the first commercially marketed in vivo oximeters.
Glenn Millikan created the first lightweight ear oximeter in the early 1940s for aviation research. Millikan coined the term oximeter to describe his device, which measured hemoglobin saturation in pilots flying at high altitudes. Similar devices developed in the 1940s were used by Wood and others in the OR. The first perioperative application of an in vivo oximeter to appear in the anesthesiology literature was published in 1951.2 Figure 11-3 shows a record of the hemoglobin saturation obtained from an ear oximeter plotted against time during a tonsillectomy. Even though this record shows a dramatic fall in saturation during the induction of anesthesia, curiously described as “breath holding” in the original figure, the device drew little attention from anesthesiologists until much later.
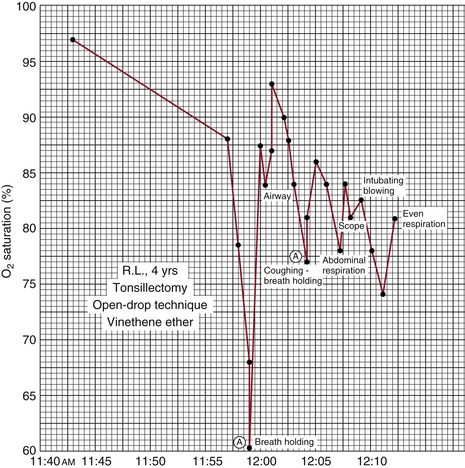
FIGURE 11-3 Ear oximeter hemoglobin saturation plotted as a function of time. Graph for a 4-year-old child undergoing general anesthesia for tonsillectomy under open-drop ether with no supplemental oxygen. Note the significant desaturation associated with breath holding during induction of anesthesia. Saturation does not return to its preinduction baseline value at any time during the record. (From Steven RC, Slater HM, Johnson AL, et al: The oximeter: a technical aid for the anesthesiologist. Anesthesiology 1951;12:548.)
The lack of acceptance of early in vivo oximeters was mostly due to their serious limitations. They were delicate instruments that required technician support for calibration and operation. In addition, the earpiece sensor was large and cumbersome, and it produced enough heat to cause occasional burns. Hewlett-Packard (HP) made a major advance in ear oximetry in the 1970s, when it marketed a self-calibrating, eight-wavelength ear oximeter. The HP oximeter was reasonably accurate for intraoperative monitoring, but it was still burdened by the size and bulky nature of the sensor as well as the expense of the instrument.3 Although the HP oximeter became a standard tool in pulmonary function laboratories, it had virtually no impact in the OR.
The first true pulse oximeter was invented by Takuo Aoyagi in 1975.4 While investigating a method to measure intravenous dye washout curves using light transmission through the ear, Aoyagi discovered that his data on light absorbance versus time contained fluctuations caused by the arterial pulse. In dealing with this “artifact,” he discovered that the relative amplitudes of the fluctuations at the two light wavelengths varied with arterial hemoglobin saturation. This fortuitous discovery led him to the creation of the first two-wavelength pulse oximeter, which was developed and marketed by Nihon Kohden Corporation. However, Aoyagi’s oximeter used filtered light sources and fiberoptic transmission cables between the instrument and the earlobe sensor, rendering it somewhat awkward for use in the OR.
The next breakthrough in technology came in the late 1970s, when Scott Wilbur of the Biox Corporation (later Ohmeda) developed the first ear sensor that used light-emitting diodes (LEDs) and solid-state photodetectors built into the sensor itself. The fiberoptic cables of Aoyagi’s pulse oximeters were thereby replaced by a thin electrical cable.5 The accuracy of the pulse oximeter was also improved by the incorporation of digital microprocessors into the instrument. Further electronic improvements were made by Biox and Nellcor in the early 1980s, and the pulse oximeter was ready to take its place as a standard perioperative monitor.
The success of Nellcor in marketing its N-100 pulse oximeter to anesthesiologists in the mid-1980s brought these devices into the OR in large numbers. The instrument had now become fairly reliable and easy to use as well as relatively inexpensive. It gained rapid acceptance and became a standard of care in the OR by 1986. Today, no anesthesiologist would feel comfortable inducing general anesthesia without a functioning pulse oximeter. An excellent review of the history of pulse oximetry and the development of blood gas analysis has been written by Severinghaus and Astrup.4
Physics and Engineering of Pulse Oximetry
Spectrophotometry uses the measurement of light absorbance to determine the concentrations of various solutes in clear solutions. Carl Matthes used this technique to determine hemoglobin oxygen saturation as early as the 1930s.4 The measurement is based on the Lambert-Beer law, which relates solute concentrations to the intensity of light transmitted through a solution:

Itrans represents the intensity of light transmitted through solution, Iin is the intensity of incident light, d is the distance light is transmitted through the solution (optical path length), C is the concentration of the solute, and ε is the extinction coefficient of the solute.
The extinction coefficient ε determines the tendency of a given solute to absorb light at a specific wavelength or color. Equation 11-7 shows it as the natural logarithm of the ratio Iin/Itrans for a solution whose concentration C and thickness d are both unity. The extinction coefficient is a known constant for a given solute at a specified wavelength. If a solute of known extinction coefficient (ε) is in solution in a cuvette, a transparent measurement chamber of known dimensions, the solute concentration can then be calculated using Equation 11-7 and the measured intensities of incident and transmitted light. If multiple solutes are present, the exponent in Equation 11-7 is simply the sum of similar expressions for each solute; for example, if there are two solutes, it is dC1ε1 + dC2ε2. The extinction coefficients of the four most common hemoglobin species in the red to IR wavelength range are shown in Figure 11-4.
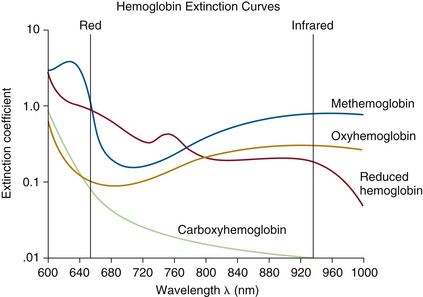
FIGURE 11-4 Extinction coefficient (ε) plotted versus light wavelength in nanometers for the four most common hemoglobin species: oxyhemoglobin (O2Hb), reduced hemoglobin (RHb), carboxyhemoglobin (COHb), and methemoglobin (MetHb). The absorbance of COHb is very similar to that of O2Hb in the visible red wavelengths. MetHb has a high absorbance over a broad spectrum, giving it a characteristic brown color. (Modified from Tremper KK, Barker SJ: Pulse oximetry: applications and limitations. In Advances in oxygen monitoring: International Anesthesiology Clinics. Boston, 1987, Little, Brown, pp 155-175.)
Laboratory in vitro blood oximeters, usually called CO- oximeters, use spectrophotometry to determine the concentrations of several common hemoglobin species by measuring light transmitted through a cuvette filled with a hemoglobin suspension produced from lysed red blood cells.1 The analysis above assumes 1) that both the solvent and the cuvette are transparent at the wavelengths used, 2) the light path length is exactly known, and 3) no unknown light-absorbing substances are present in the solution. It is difficult to meet these requirements precisely in clinical devices; hence CO-oximeters theoretically based on the Lambert-Beer law require empirical corrections to improve accuracy.
Engineering Principles
Conventional pulse oximeters estimate arterial hemoglobin saturation by measuring the transmission of light at two wavelengths through a pulsatile vascular tissue bed. The pulse oximeter effectively uses the finger, ear, or other tissue as a “cuvette” containing hemoglobin. However, living tissue contains a number of light absorbers other than arterial hemoglobin; these include skin, soft tissue, bone, and venous and capillary blood. Early in vivo oximeters, such as Millikan’s, compensated for these additional tissue absorbances by compressing the soft tissues to eliminate all blood during a calibration cycle. The absorbance of the bloodless tissue was then used as a baseline. Some of these oximeters heated the tissue during measurement to render it hyperemic and thus obtain an absorbance more dependent on arterial blood.
The pulse oximeter distinguishes arterial blood from other light absorbers in the tissue in a novel way. As shown in Figure 11-5, light absorbance in tissue can be divided into a constant or direct current (DC) component and a pulsating or alternating current (AC) component. The AC component of absorbance is almost exclusively the result of arterial blood pulsations; this was Aoyagi’s original hypothesis. These pulsations are caused by the systolic volume expansion of the arteriolar bed, which produces an increase in optical path length and thereby increases the absorbance (Equation 11-7). Conventional pulse oximetry thus assumes that arterial blood is the only pulsatile absorber; any other fluctuating light absorbers will constitute sources of error. The consequences of and recent modifications to this assumption are discussed below (see Motion Artifact and Adaptive Digital Signal Filtering).
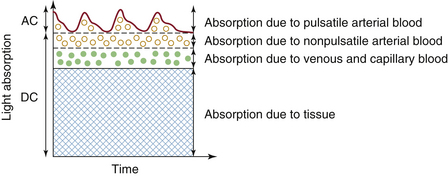
FIGURE 11-5 Schematic of the light absorbances of living tissue plotted versus time. The fixed direct current (DC) absorbance results from solid tissues, venous and capillary blood, and nonpulsatile arterial blood. The alternating current (AC) component is caused by pulsations in the arterial blood volume. (Modified from Ohmeda Pulse Oximeter Model 3700 service manual. Boulder, CO, 1986, Ohmeda, p 22.)
Most pulse oximeters use the same two wavelengths of light: 660 nm (red) and 940 nm (near IR). The pulse oximeter measures the AC component of the light absorbance at each wavelength and then divides it by the corresponding DC component (see Fig. 11-5), yielding the pulse-added absorbances S660 = AC660/DC660 and S940 = AC940/DC940. The pulse-added absorbances at the two wavelengths are independent of the intensity of the incident light. The oximeter then calculates the ratio (R) of the two pulse-added absorbances:

The Lambert-Beer law implies that in the absence of dyshemoglobins (e.g., COHb, MetHb), the ratio R is uniquely related to the arterial hemoglobin saturation. Although the pulse oximeter saturation estimate SpO2 can be mathematically derived from the value of R via the Lambert-Beer law, the pulse oximeter uses an empirical calibration curve to relate SpO2 to this ratio. A typical calibration is shown in Figure 11-6. This curve, as for all other pulse oximeter calibrations, is based on experimental data from human volunteers. The calibration data are stored in the oximeter’s microprocessor memory; pulse oximeters do not require user calibration because they assume one calibration algorithm for the entire human race. This does not imply that the instrument “calibrates itself for each patient,” as is sometimes erroneously stated.
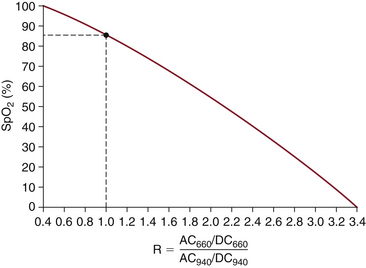
FIGURE 11-6 A typical pulse oximeter calibration algorithm, in which estimated oxygenation (SpO2) is plotted against the ratio R from Equation 11-8. The value of R varies from roughly 0.4 at 100% saturation to 3.4 at 0% saturation. Note that an R value of 1.0 corresponds to an SpO2 reading of 85%. This calibration curve is a best fit of experimental data obtained on healthy volunteers. AC, alternating current; DC, direct current. (Modified from Pologe JA: Pulse oximetry: technical aspects of machine design. In Tremper KK, Barker SJ, editors: Advances in oxygen monitoring: International Anesthesiology Clinics. Boston, 1987, Little, Brown, p 142.)
To summarize these engineering principles, conventional two-wavelength pulse oximetry requires three implicit assumptions regarding human physiology: 1) that the two and only two light absorbers in human blood are oxyhemoglobin and reduced hemoglobin; 2) that all pulsations in light absorbance are caused by fluctuations in the local volume of arterial blood; and 3) that one empirical, experimental calibration curve—the relationship between the ratio R and SpO2—is valid for the entire human race.
Sources of Error
Given the physics and engineering principles of pulse oximetry, as well as the three assumptions noted above, the major sources of error in SpO2 readings are predictable. This section examines the common sources of error as well as some design approaches and new developments aimed at reducing errors. The wise user of pulse oximetry must be aware of these problems and be able to anticipate erroneous data.
Dyshemoglobins and Intravenous Dyes: Conventional Pulse Oximetry
Because the conventional pulse oximeter measures light absorbance at two wavelengths, it can deal with unknown concentrations of only two solutes, that is, the two hemoglobin species O2Hb and RHb. If any light-absorbing substance other than O2Hb and RHb is present, violating the first assumption above, the pulse oximeter cannot accurately estimate saturation. As shown by the light absorbance spectra in Figure 11-4, both carboxyhemoglobin (COHb) and methemoglobin (MetHb) absorb light at one or both of the wavelengths commonly used by the pulse oximeter. Significant concentrations of either dyshemoglobin will therefore produce erroneous SpO2 values. The fact that functional saturation (SaO2) does not depend explicitly on dyshemoglobin concentrations (Equation 11-1) does not imply that SaO2 can be determined by a two-wavelength oximeter. In the presence of additional hemoglobins, an oximeter cannot measure the concentrations of any hemoglobin species using only two wavelengths of light (Equation 11-7).
The effects of COHb on SpO2 values were first determined experimentally in dogs in 1987.6 Figure 11-7 shows SpO2 from conventional pulse oximetry, as well as fractional saturation O2Hb% determined by in vitro CO-oximetry, plotted as functions of COHb%. Even when COHb% increases to levels greater than 70%, the displayed SpO2 values remain greater than 90% at all times. COHb% levels above 50% are considered potentially lethal in humans. The pulse oximeter thus interprets COHb as though it were composed mostly of O2Hb, a fact that can be predicted from the absorbance spectra in Figure 11-4. At the red wavelength of 660 nm, COHb has roughly the same absorbance as O2Hb; at 940 nm, COHb is relatively transparent. This is consistent with the clinical observation that patients with carboxyhemoglobinemia exhibit a bright pink skin color.
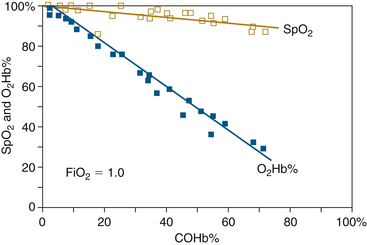
FIGURE 11-7 Estimated oxygen saturation (SpO2) and fractional saturation (O2Hb%) plotted against carboxyhemoglobin level (COHb%) for dogs inhaling carbon monoxide at 200 ppm. SpO2 seriously overestimates arterial fractional hemoglobin oxygen saturation in the presence of COHb and remains greater than 90% even for a COHb% of 70. The pulse oximeter “sees” COHb as though it were mostly O2Hb. (From Barker S, Tremper K: The effect of carbon monoxide inhalation on pulse oximetry and transcutaneous PO2Anesthesiology 1987;66:677-679.)
The effects of MetHb on conventional SpO2 values were similarly evaluated in animal experiments in 1989.7 Figure 11-8 shows SpO2 and O2Hb% determined by CO-oximetry and plotted as functions of MetHb%. As in the case of COHb, the presence of MetHb causes the pulse oximeter to overestimate fractional hemoglobin saturation. However, unlike the behavior of SpO2 with COHb, here the SpO2 values tend to decrease with increasing MetHb until they reach a plateau at approximately 85%. For MetHb% values greater than roughly 30%, there is little further decrease in SpO2 (see Figure 11-8). This fact is again consistent with the light absorbance spectra in Figure 11-4, which shows that MetHb has high absorbance values at both wavelengths used by the pulse oximeter. This high absorbance, which tends to give MetHb its characteristic brown color, adds to both the numerator and denominator of the ratio R in Equation 11-8. Increasing both the numerator and denominator of this ratio by a fixed amount tends to drive the value of R toward 1.0. The pulse oximeter calibration curve of Figure 11-6 shows that an R value of 1.0 corresponds to an SpO2 value of 85%. This may explain why the pulse oximeter tends to read near 85% saturation in the presence of high MetHb levels.7 A case report of methemoglobinemia caused by herbal medicines illustrates this phenomenon.8
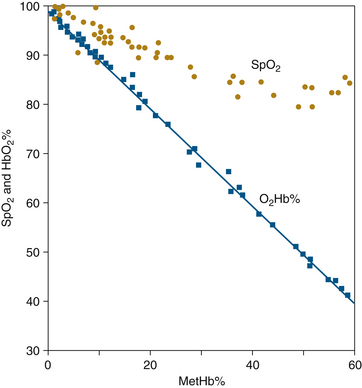
FIGURE 11-8 Estimated oxygen saturation (SpO2) and fractional saturation (O2Hb%) vs. methemoglobin level (MetHb%) for dogs with benzocaine-induced methemoglobinemia. Although SpO2 shows a downward trend with increasing MetHb%, O2Hb% is consistently overestimated, and it appears that a plateau is reached at an SpO2 of 85%. When fractional concentration of inspired oxygen (FiO2) is varied during this experiment, SpO2 measures neither functional nor fractional saturation. (From Barker SJ, Tremper KK, Hyatt J: Effects of methemoglobinemia on pulse oximetry and mixed venous oximetry. Anesthesiology 1989;70:112-117.)
Fetal hemoglobin (HbF) appears to have little effect on the accuracy of conventional pulse oximetry. This is because the extinction coefficients of HbF at the two usual pulse oximeter wavelengths, 660 and 940 nm, are similar to the corresponding values for adult hemoglobin (HbA). This is fortunate because the percentage of HbF present in neonatal blood varies with gestational age and is not very predictable. HbF also produces small errors in multiwavelength in vitro CO-oximeters. The oxygenated state of HbF is interpreted by some older laboratory oximeters as consisting partially of COHb.9
Theoretical considerations suggest that sickle hemoglobin (HbS) should also have little effect on pulse oximeter accuracy, but this is difficult to confirm experimentally. It would be unethical to subject sickle cell patients to intentional hypoxemia to study pulse oximeter accuracy. A few clinical case reports have involved sickle cell patients, either under healthy conditions or during a sickle cell crisis; however, these have produced conflicting results. One issue is that there is no clear gold standard for comparison of SpO2 values in sickle cell patients. One study, which concluded that SpO2 overestimated SaO2 with a bias of 6.9%, used a CO-oximeter as the gold standard.10 However, laboratory CO-oximeters are generally designed to function in the presence of only four types of hemoglobin: 1) reduced Hb, 2) O2Hb, 3) COHb, and 4) MetHb. Accuracy in the presence of HbS is not specified. Some studies have used as a standard the SaO2 calculated from the PaO2, which is measured by a blood gas electrode (Clarke electrode). This method is dubious because it must assume a “normal” oxygen-hemoglobin dissociation curve (see Fig. 11-2), when it is well known that sickle cell patients have right-shifted dissociation curves. At least two studies have measured the O2 dissociation curves of individual sickle cell patients and then used these to calculate SaO2 from PaO2.11,12 These studies concluded that pulse oximeter accuracy is maintained in sickle cell disease as long as differences in O2 dissociation curves are accounted for. Other abnormal hemoglobins, such as hemoglobin Bassett, also have produced erroneous SpO2 readings.13
The ratio R, and hence the SpO2 value, can be affected by any substance present in the blood that absorbs light at 660 or 940 nm. Dyes injected intravenously for diagnostic purposes can have significant effects on SpO2. For example, intravenous methylene blue produces sudden large decreases in SpO2 values in normal subjects.14 Indigo carmine yields small decreases in SpO2, and indocyanine green has an intermediate effect. The extinction coefficients of these three dyes are plotted against light wavelength in Figure 11-9.14 A comparison of these absorbance spectra with those of hemoglobin (see Fig. 11-4) predicts the relative effects of the three dyes on SpO2 values. Bilirubin, another common pigment found in blood, appears to have no significant effect on SpO2 at concentrations seen clinically.15
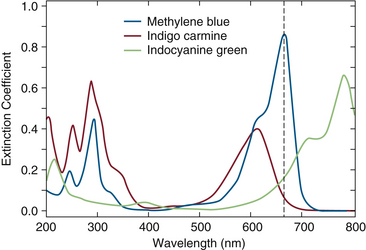
FIGURE 11-9 Extinction coefficient (ε) versus wavelength (λ) in the range 200 to 800 nm for three dyes: methylene blue, indigo carmine, and indocyanine green. (Modified from Scheller MS, Unger RJ, Kelner MJ: Effects of intravenously administered dyes on pulse oximetry readings. Anesthesiology 1986;65[5]:550-552.)
Nail polish has variable effects upon SpO2 values and usually produces falsely low readings.16 Highly opaque, acrylic nail coverings can prevent the pulse oximeter from detecting any pulsatile absorbance at all. This problem can usually be averted by rotating the fingertip sensor 90 degrees so that the coated fingernail does not fall within the optical path.
Multiwavelength Pulse Oximetry
Until 2005, only a few investigations had been made into the possibilities of multiwavelength pulse oximetry. Aoyagi, the inventor of pulse oximetry, performed experiments with three-wavelength sensors in 2002.17 Although his purpose in using an additional wavelength was to improve the accuracy of the SpO2 value, he noted that “Dyshemoglobins (e.g., COHb and MetHb) can be measured with a multiwavelength system.” A four-wavelength pulse oximeter that estimated total hemoglobin was reported by Noiri and colleagues in 2005.18 However, this device was never commercially produced and did not see widespread clinical use. Several investigators have used multiwavelength IR in vivo oximetry to estimate hemoglobin saturation in the internal jugular vein or in brain tissue, but again, only the ratio of oxyhemoglobin to total hemoglobin was measured.19,20
In 2005, the Masimo Corporation (Irvine, CA) announced the development of their Rainbow technology Rad-57 pulse oximeter. This device uses eight wavelengths of light to measure SpO2, SpCO (pulse oximeter estimate of COHb%), and SpMet (pulse oximeter estimate of MetHb%). The handheld, battery-powered Rad-57 was later followed by a bench-top version, Radical-7. The first human study of the performance of the Rad-57 was published in 2006.21 Twenty healthy volunteers were instrumented with radial artery catheters, electrocardiograms (ECGs), sphygmomanometers, and Rad-57 sensors on the fingers. In the COHb arm of the study, volunteers were exposed to inspired CO at 150 ppm until their COHb% levels reached 15%. Arterial blood samples were analyzed by CO-oximetry, and the resulting COHb% values were compared with the SpCO readings. The bias—that is, the mean difference between SpCO and COHb% by CO-oximeter—was −1.22%, and the precision (standard deviation [SD] of the difference) was 2.19%. These values are nearly the same as the manufacturer-specified uncertainties for conventional pulse oximeters in the measurement of SpO2. This volunteer study obviously could not investigate the more pathologic COHb% levels found in smoke-inhalation injuries.
Subjects in the MetHb arm of the study were given 300 mg of intravenous sodium nitrite, a drug approved by the Food and Drug Administration (FDA) for treatment of cyanide toxicity; this resulted in methemoglobin levels of up to 13%. The comparison of SpMet with simultaneous CO-oximeter values of MetHb% yielded a bias of 0.00% and a precision of 0.45%. These uncertainties for SpMet are approximately one fourth of those measured for SpCO. This greater accuracy is a result of the fact that MetHb has a high light absorbance at all wavelengths in the range of interest; hence it provides a larger absorbance signal for the pulse oximeter’s processing algorithm.
Laboratory volunteer studies cannot predict a monitor’s performance in clinical conditions, nor can they establish its effects on patient outcome. For this we rely on clinical studies and case reports, a number of which have been published in the past few years. Coulange and colleagues22 measured SpCO from Rad-57 and simultaneous values of COHb% from blood CO-oximetry in smoke-inhalation victims. In data from 12 patients, they found a bias of −1.5% and a precision of 2.5%. Layne and colleagues measured SpCO and COHb% (Avox 400 CO- oximeter) in 130 outpatients, both smokers and nonsmokers.23 They found a bias of −0.65% and a precision of 1.8% in a COHb range from 0% to 31%. Both of these clinical studies found SpCO uncertainties to be essentially the same as in the Barker volunteer study.21
Numerous case reports have been published on the use of Rad-57 to detect and measure COHb levels. Some authors have used SpCO as a screening tool to identify smokers and track smoking cessation.24,25 Another promising application for the handheld device is in fire departments and for emergency medical services (EMS) responders. Hostler and colleagues26 showed that SpCO could be used as a diagnostic tool for firefighters who respond to CO alarm activations. They found that patients who require transport to the emergency department had mean SpCO levels of 27.8%, whereas patients not in need of treatment had mean levels of 3.2%. A similar study of 149 patients by the New York Fire Department concluded that the Rad-57 “can be used as a screening tool to uncover cases of CO poisoning in which the diagnosis is not suspected.”27 Firefighters themselves have been screened with SpCO in other investigations.28 Case reports from emergency departments have shown the value of SpCO monitoring for tracking the progress of carbon monoxide poisoning victims and in the detection of CO poisoning in unsuspected cases.29-31 Figure 11-10 shows an example of SpCO trend monitoring and response to treatment in an 81-year-old woman who was trapped in a house fire.29
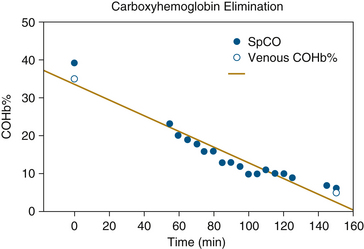
FIGURE 11-10 Carboxyhemoglobin (COHb%) and its pulse oximetry estimate (SpCO) plotted vs. time in an 81-year-old victim of smoke inhalation. (From Plante T, Harris D, Savitt J, et al: Carboxyhemoglobin monitored by bedside continuous CO-oximetry. J Trauma 2007;63[5]:1187-1190.)
Several case reports were published of Rad-57 being used to detect and monitor methemoglobinemia. Many life-threatening methemoglobinemia cases reported involve the use of topical benzocaine.32 This is one of a large number of commonly used drugs that induce methemoglobinemia as a side effect, a problem that undoubtedly has been underdiagnosed in the past.33 Macknet and colleagues presented a case of severe benzocaine-induced methemoglobinemia during transesophageal echocardiography, in which the Rad-57 was used to make the diagnosis and to monitor treatment with methylene blue.34 Barker and colleagues reported a similar case in the OR following topical benzocaine for awake intubation.35 In both of these cases, the multiwavelength pulse oximeter played a major role in diagnosis and treatment; in vitro laboratory CO-oximeter values were delayed too much to guide treatment.
The current versions of the Masimo Rad-57 and Radical-7 have two limitations. First, they still use a conventional two-wavelength red-over-IR algorithm to calculate the SpO2 value. Thus, when levels of either COHb or MetHb are significant, the displayed SpO2 is subject to the same errors described above.6,7 Of course, the presence of a displayed SpCO or SpMet value would alert the user to the likelihood of this SpO2 error. The second limitation is the existence of “crosstalk” between the MetHb and COHb measurement channels. That is, in the presence of significant MetHb levels, the instrument will display a falsely elevated SpCO value while also displaying a correct SpMet value. This situation is detected by the device, which will display an error message indicating that the SpCO value may not be accurate.
In March 2008, Masimo announced another innovation in multiwavelength pulse oximetry: the noninvasive measurement of total hemoglobin. Macknet and colleagues36 published the first clinical validation study, in which 30 surgical patients and 18 healthy volunteers were monitored with the new prototype. The subjects followed a hemodilution protocol in which one unit of blood was withdrawn and replaced with normal saline. Arterial blood was sampled periodically and analyzed for total hemoglobin (Hbt) by a Radiometer ABL-735 CO-oximeter, and the values obtained were compared with the simultaneous Radical-7 measurements of hemoglobin (SpHb), as shown in Figure 11-11. In a range of Hbt values from 4.4 to 15.8 g/dL, this comparison revealed a bias and precision of 0.03 and 1.12 g/dL, respectively. Macknet and colleagues36a published a similar study in 20 healthy volunteers and concluded that pulse CO-oximetry–based SpHb measurement was accurate to within 1.0 g/dL compared with laboratory CO-oximeter measurements.
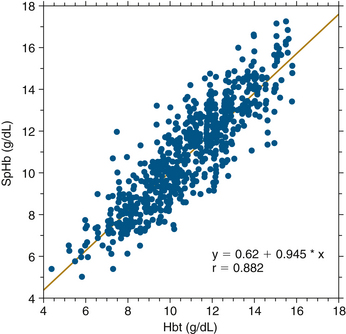
FIGURE 11-11 Radical-7 (Masimo Corporation, Irvine, CA) measurement of total hemoglobin (SpHb) plotted against simultaneous laboratory CO-oximeter value. Included were 48 subjects and 802 data points. Bias was 0.03 and precision was 1.12. Hbt, total hemoglobin. (From Macknet M, Norton S, Kimball-Jones P, et al: Continuous non-invasive measurement of hemoglobin via pulse CO-oximetry. Anesth Analg 2007;105[6]:S-108.)
A presentation at the 2008 World Congress of Anesthesiology described a case in which casual screening with the Radical-7 revealed an abnormally low SpHb (11 g/dL) in a 72-year-old man.37 This led to further testing, which yielded the early diagnosis of an asymptomatic esophageal carcinoma. The early complete surgical excision resulted in the probable cure of a highly lethal disease. The noninvasive measurement of Hbt by pulse oximetry is very new, and more case reports and clinical outcome studies can be expected in the future.
Multiwavelength pulse oximetry is now capable of the continuous, noninvasive measurement of MetHb, carboxyhemoglobin, and total hemoglobin. Technology has made real progress in correcting one of the chief weaknesses of pulse oximetry: performance in the presence of abnormal hemoglobin species. Clinical studies and case reports have already documented the importance of these new developments, and it is hoped that further developments will lead to the continuous measurement of other substances in the blood.
Wavelength Variability
The LED used as a light source by the pulse oximeter is not an ideal monochromatic (single-wavelength) radiator. The LED emits light over a narrow but finite range of wavelengths. The center wavelength, or wavelength of peak energy radiation, varies by as much as 15 nm among diodes of the same specification. Figure 11-4 shows that such a variation in wavelength can yield a significantly different extinction coefficient, particularly at the 660-nm wavelength. Manufacturers use at least two approaches to this problem. The simplest method is to measure the center wavelength of all LEDs and reject those that fall outside a specified range, for example, 660 (±5) nm. This method is effective but expensive because of the large number of LEDs that must be discarded. The second method is to store multiple calibration algorithms in the pulse oximeter software, corresponding to different LED center wavelengths. The electrical connector on the sensor cable is then pin coded so that only the appropriate algorithm can be selected for a given sensor. Neither method entirely eliminates the effect of center frequency variation. This variability does not affect the pulse oximeter’s ability to follow changes in saturation, but it does produce differences between sensors in the absolute value of SpO2.38
Signal/Noise Ratio
The amplitude of the fluctuating (AC) component of the light absorbance can be much less than 1% of the amplitude of the DC component (see Fig. 11-5). Any influence that decreases the AC component, increases the DC component, or adds an artifactual AC component not related to arterial pulsations will worsen the signal/noise ratio. For example, the AC signal is decreased in low perfusion states, such as shock; the DC signal is increased when ambient room light reaches the detector; and artifactual AC signals are caused by patient motion, such as shivering.
The photodiode light detector in the pulse oximeter sensor cannot discriminate one wavelength of light from another—it is effectively color blind. The detector therefore responds to ambient room light and to light from either of the LED sources. In most two-wavelength pulse oximeters, this problem is solved by activating the red and infrared LEDs in an alternating sequence. During one part of this sequence, both LEDs are turned off, and the photodetector measures the ambient background light. This sequence is repeated many times per second (e.g., 480 Hz) in an attempt to eliminate light interference from rapidly changing ambient sources. Despite this ingenious design, ambient light artifact can create problems with the signal/noise ratio; however, this difficulty can be minimized by covering the sensor with an opaque shield of some sort, such as a surgical drape or towel.
If the peripheral pulse is weak, the AC absorbance signal becomes smaller compared with the DC signal. The pulse oximeter uses an automatic gain control that adjusts either the LED intensity or the photodetector amplifier gain to compensate for changes in AC signal amplitude. Unfortunately, this process also amplifies background noise from all sources, including ambient light. At the highest amplifier gain setting, the pulse oximeter may interpret background noise as a pulsatile absorbance and may generate an SpO2 value from this artifact.4 This phenomenon could be demonstrated in early pulse oximeters by inserting a piece of paper between the photodetector and the LEDs. Some of these pulse oximeters would amplify background noise and display a pulse and saturation value from the paper.
This signal/noise ratio problem is also illustrated by the penumbra effect.39 If a finger sensor is partially dislodged or malpositioned in such a manner that light passes through the fingertip at a grazing incidence, the pulse oximeter may display a correct heart rate but an erroneous SpO2 value. The SpO2 value from a malpositioned sensor is usually falsely low during normoxemia, but it may be falsely high during moderate hypoxemia.40 This behavior may be another example of the R = 1.0 phenomenon (Equation 11-8).
Most pulse oximeters display some sort of visual indicator of pulsatile absorbance signal, usually in the form of an absorbance-versus-time plethysmogram. This displayed waveform usually represents the AC signal after amplification and therefore does not directly correspond to the actual amplitude of the absorbance pulsations. However, a few manufacturers display a waveform whose height actually does represent pulsatile absorbance amplitude before amplification. The user must therefore determine what the waveform of the pulse oximeter in use measures; in general, it is not safe to assume that waveform amplitude represents pulse amplitude. The plethysmograph is not a quantitative monitor of peripheral perfusion, and it cannot be relied upon to warn of impending ischemia, despite claims to the contrary.
The behavior of first-generation pulse oximeters during shock or low-perfusion states has been studied in both humans and animals.41-45 During hemorrhagic shock, pulse oximeters may display no SpO2 value at all, or they may give falsely low saturation estimates. Loss of signal is likely with hypothermia, severe anemia, low cardiac output states, and extremes in systemic vascular resistance. An early study of failure rates in the OR found that pulse oximeters (Nellcor N-100, Ohmeda 3700) failed in 1.12% of all patients.46 Higher failure rates were associated with poor preoperative physical status, long operations, and elderly patients. A later study used computerized anesthesia records and found that 9% of all cases (n = 9203) had gaps in SpO2 data of 10 minutes or more.47 Higher failure rates were associated with higher ASA physical status number and with hypotension and hypothermia. The largest failure rate study was done by Moller and colleagues,48 in which more than 20,000 surgical patients were followed. Interestingly, this controlled study found little difference in postoperative outcome between patients monitored with pulse oximetry and unmonitored patients, but it did find a very significant variation in failure rate with ASA physical status, shown in Figure 11-12. The failure rate for ASA-4 patients was more than five times that for ASA-1 patients; these higher failure rates in sicker patients have led some to describe the pulse oximeter as a “fair-weather friend.”
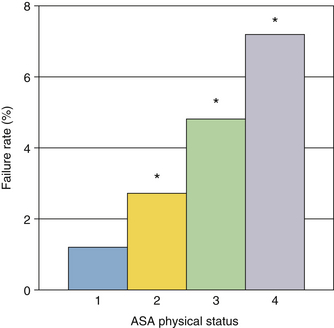
FIGURE 11-12 Pulse oximeter failure rates as a function of American Society of Anesthesiologists (ASA) physical status. Data shown are from both the operating room and postanesthesia care unit in 10,312 patients. Failure rate increased from 1% to more than 7% as physical status worsened. Asterisks denote significance. (From Moller JT, et al: Randomized evaluation of pulse oximetry in 20,802 patients. Anesthesiology 1993;78:436-453.)
Several studies have determined thresholds for loss of signal during low-perfusion states. Lawson and colleagues41 produced gradual occlusion of blood flow with a blood pressure cuff while monitoring flow at the fingertip using a Doppler flow probe. They found loss of signal when blood flow had decreased to an average of 8.6% of its baseline value, which occurred at a cuff pressure of 96% of systolic pressure. On cuff deflation, the signal returned at a blood flow of only 4% of baseline. Severinghaus and colleagues49 studied pulse oximeter behavior during various types of reduction in extremity blood flow, including via blood pressure cuff, brachial artery pressure clamp, and extremity elevation. Failure occurred at higher mean arterial pressures with the arterial clamp than with gravitational hypotension, showing the importance of blood volume pulsatility. These studies demonstrate that the pulse oximeter functions over a wide range of blood flows and blood pressures in the extremity. Because the pulse oximeter is designed to function independently of changes in flow or pressure, loss of signal cannot be used to determine the adequacy of peripheral perfusion, even though this has been attempted.50 (See also the related discussion of the plethysmograph above.)
The electrosurgical unit (ESU) is another source of artifact. The intense, high-frequency, electromagnetic radiation from the ESU electrode fills the OR whenever the device is activated. The electrical cable from the pulse oximeter sensor acts as an antenna that receives the ESU radiation. Earlier generations of pulse oximeters were essentially shut down by ESU activation and required up to 30 seconds to recover. More recent pulse oximeters—that is, those made after the year 2000—are much improved in this respect and usually continue to display and update SpO2 and heart rate values during ESU use. However, some pulse oximeters display their last “valid” SpO2 value for up to 30 seconds during loss-of-signal periods. In these instruments, the user can be certain that the pulse oximeter is measuring SpO2 during ESU activation only if a reasonable plethysmograph waveform is observed.
Motion Artifact and Adaptive Digital Signal Filtering
Artifacts caused by patient motion have plagued pulse oximetry, particularly in the recovery room, intensive care unit (ICU), and emergency settings. Although loss of signal or erroneous readings as a result of motion are infrequent in the OR (1% to 2%), they can cause a false alarm incidence that exceeds 50% in recovery room and ICU settings.51 Patient motion, especially shivering, causes a large, fluctuating absorbance artifact that is incorrectly interpreted by the pulse oximeter algorithm. Much of this artifact results from venous blood volume pulsations created by the motion, thus violating the second assumption of conventional pulse oximetry, that the light path length is exactly known.
Until fairly recently, manufacturers used two approaches to this problem: increased signal averaging time and ECG synchronization. In the first approach, the value of the ratio R is stored on a beat-to-beat basis and averaged for several seconds. This running average is less sensitive to patient motion but is also slower to respond to sudden saturation changes. The reduction in the false-alarm rate resulting from motion is thus accompanied by a slower response to true alarms, which is particularly risky in pediatric or neonatal applications. The second approach, ECG pulse rate synchronization, was developed by Nellcor and applied in their N-200 pulse oximeter.52 Although this “C-lock” feature seemed to be a useful innovation, it was not particularly successful and was abandoned in later models.
A recent, more elegant solution to motion artifact is to determine the “noise signal” and subtract it from the total signal, leaving a noise-free signal from which to calculate the SpO2. Masimo has used this “adaptive digital filtering” approach to develop an algorithm called signal extraction technology (SET), which improves pulse oximeter performance in the presence of motion artifact.53-55 The method makes two assumptions, the first being that most of the noise associated with motion artifact is produced by pulsations in venous blood volume, which produce the SpO2 errors described above. In fact, errors from venous pulsations were documented in an early volunteer study that showed that SpO2 may decrease by 8% when the arm is moved from a raised to a dependent position.56 The second assumption is that the saturation values from the venous pulsations will be less than arterial values, which seems rather obvious. The Masimo SET electronically scans all possible values of the ratio R that correspond to saturations of 0% through 100%, and it calculates the signal intensity at each possible R value, as shown in Figure 11-13. In this example of a discrete saturation transform curve, two intensity peaks occur at 79% and 97% saturation: the higher peak corresponds to the arterial pulsations and is used to calculate SpO2, and the lower peak at 50% presumably represents the venous pulsations. The entire sequence is repeated once per second on the most recent 6 seconds of raw data. The displayed SpO2 value thus represents a 6-second running average of arterial hemoglobin saturation, updated every second.
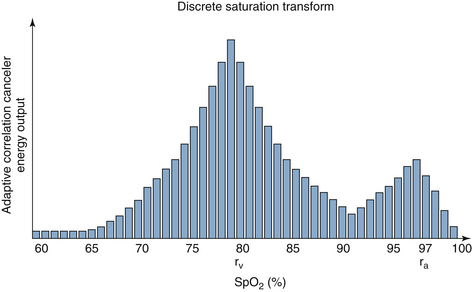
FIGURE 11-13 An example of a discrete saturation transform during patient motion. The signal strength calculated by the algorithm is plotted against saturation for all possible estimated pulse oximetry (SpO2) values. The peak at 97% corresponds to the saturation of arterial blood (ra); the peak at 79% represents venous blood (rv).
This new technology has been evaluated in two volunteer experiments in which motion was induced in one hand while the other hand served as a stationary control.53,54 In both of these experiments, done 5 years apart, the latest version of Masimo SET was compared with the current versions of other manufacturers’ instruments, most of which claimed to be “motion resistant.” The results of the more recent study are summarized in Table 11-1. These findings are supported by several clinical studies conducted on patients in postoperative care units.55,57,58 Additional studies will determine whether this approach yields improved performance in clinical settings of low perfusion, such as with shock or after cardiopulmonary bypass.
TABLE 11-1
Performance of Several Pulse Oximeters During Mechanically Controlled Hand Motion
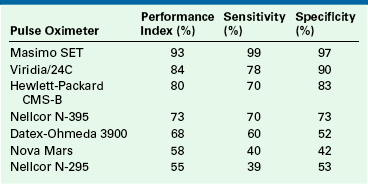
Performance index is the percent of time during which estimated oxygenation by pulse oximetry on the hand in motion is within 7% of the simultaneous value on the stationary (control) hand. Sensitivity and specificity for detection of hypoxemia (saturation values <90%) are also shown. All instruments except the N-295 claim to be “motion resistant.”
From Barker SJ: “Motion-Resistant” pulse oximetry: a comparison of new and old models. Anesth Analg 2002;95:967-972.
Clinical Applications: Accuracy, Response, and Limitations
This section reviews clinical applications of pulse oximetry and its physiologic limitations, that is, the clinical changes that can and cannot be detected by saturation monitoring. In reviewing studies of pulse oximeter accuracy, simple statistical tools are needed. Studies of pulse oximeter accuracy are generally methods-comparison studies, in which two independent methods are used to measure the same variable simultaneously. One of the two methods usually is a new or unproven technique—in this case, pulse oximetry—and the other method is considered a gold standard. The most common gold standard for pulse oximeter studies is a multiwavelength in vitro CO-oximeter used to analyze arterial blood samples. These laboratory devices claim an uncertainty on the order of ±1% (1 SD) for measurements of fractional saturation (Equation 11-2). Because the accuracy of current pulse oximeters is comparable to this figure (generally ±2%), it must be noted that both methods in all comparison studies are subject to uncertainty; a true gold standard of absolute accuracy for any monitor is rare.
The most commonly used statistics for evaluating methods-comparison studies are bias and precision as defined by Bland and Altman.59 Bias is defined as the mean of the differences between simultaneous measurements by the two methods, and precision is the standard deviation of this difference. (We have suggested calling the latter quantity the imprecision because a larger value implies a less precise measurement.) This text defines the difference between measurements as the pulse oximeter SpO2 value minus the CO-oximeter O2Hb% value; however, in some of the literature, the opposite sign is used. The bias indicates systematic error; that is, it shows the tendency of one of the two methods to consistently overestimate or underestimate one value relative to the other. The precision represents the variability or random error between the two methods. If both the systematic and random errors are within acceptable clinical limits, the methods-comparison study suggests that one method can replace the other. Unfortunately, many published methods-comparison studies do not include bias and precision values. Reported statistics often include a correlation coefficient r and a linear regression slope and intercept of the scatterplot, or a graph of method A versus method B values. Correlation coefficient is not a measure of agreement between two variables; rather, it is a measure of their association and is affected by the range of values covered by the data as well as agreement between the two methods. Similarly, linear regression slope and intercept may be meaningless if the data points fall within a narrow range of values.
Accuracy Studies
Most pulse oximeter manufacturers claim an uncertainty of ±2% (1 SD) for SpO2 values between 70% and 100%. This uncertainty increases to ±3% for SpO2 values between 50% and 70%; no accuracy is specified for SpO2 values below 50%. This implies that for saturations above 70%, the SpO2 value should be within 2% of the actual saturation 68% of the time and within 4% (2 SDs) 95% of the time. These accuracy specifications have not changed since the mid-1980s. The seemingly generous 2% uncertainty is the direct result of the third assumption for pulse oximetry as stated above: one empirical calibration curve—that is, the relationship between the ratio R and SpO2—fits the entire human race.
In the 1980s and 1990s, a number of studies of pulse oximeter accuracy were done that included both laboratory volunteer tests and clinical trials.60,61 Three of the studies from this era are of special interest because they evaluated not only accuracy but also response times to sudden changes in hemoglobin saturation.62-64 These studies found some significant errors in pulse oximeter calibrations, which were subsequently revised by the manufacturers. As a result of such “aftermarket” software revisions, seemingly identical pulse oximeters may actually perform differently. Experimental study reports must therefore specify the software version and the pulse oximeter manufacturer and model used.
The volunteer studies of Severinghaus and Naifeh compared the performance of various pulse oximeters during severe, transient desaturations.62,64 Subjects underwent brief (45 seconds) desaturations to an O2Hb% value of 40% to 70%. Pulse oximeter response times to these sudden saturation changes were much shorter for earlobe sensors than for finger sensors (Figure 11-14). The time for a 50% response to rapid desaturation, or “resaturation,” ranged from 10 to 20 seconds for the earlobe sensor; for the finger sensors, it varied between 24 and 50 seconds. A similar result was obtained in another study that compared response times of finger sensors to those of both earlobe sensors and reflectance sensors on the forehead.65 Both of these studies showed wide variations among subjects in response times for finger sensors, reflecting a wide range of lung-to-finger circulation times. These physiologic time delays and their interpatient variability should be considered in the selection of sensor sites in clinical settings, in which SpO2 can change rapidly (e.g., the OR). However, clinical studies have also found that finger sensors are the most reliable in obtaining SpO2 values during periods of hemodynamic instability.66
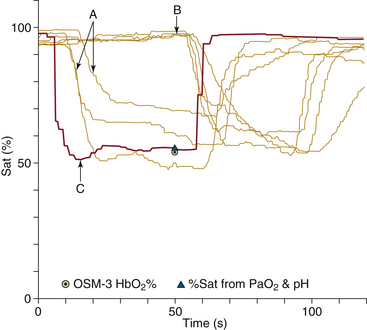
FIGURE 11-14 Tracings of pulse oximetry values plotted against time for seven pulse oximeters during a rapid, brief desaturation in a healthy volunteer. Tracings labeled A represent three earlobe sensors, tracings labeled B are four finger sensors, and tracing C is the pulmonary venous saturation calculated from exhaled oxygen tension measured by mass spectrometry. The earlobe sensors register the desaturation with a 10- to 15-second time lag, whereas the finger sensors show a 50-second time lag in this volunteer. Hb, hemoglobin; OSM-3, CO-oximeter; PaO2, arterial oxgyen tension; Sat, saturation. (Modified from Severinghaus JW, Naifeh KH: Accuracy of response of six pulse oximeters to profound hypoxia. Anesthesiology 1987;67:553.)
The pulse oximeter’s response to sudden saturation changes is also affected by the signal-averaging time of the instrument, which is often user selectable. The displayed SpO2 value represents a running average of data obtained over the most recent averaging time period, which may range between 1 and 15 seconds. The SpO2 value will respond more quickly to a sudden change in SaO2 if a short averaging time is selected. On the other hand, if the signal/noise ratio is marginal or artifacts are present, such as with patient motion, a longer averaging time will yield better accuracy. The user must determine the most appropriate averaging time for the clinical setting. The default averaging time, which is the value applied when the power is turned on, varies among manufacturers; hence, the user must know the default value of the particular instrument in use.
Clinical studies of accuracy usually combine data from multiple patients to determine the SpO2 uncertainty. This procedure yields a more pessimistic view of accuracy than would be obtained by studying results for individual patients. If a sensor is placed on a patient, and the SpO2 value is 95%, the probability is 68% that the patient’s true saturation lies between 93% and 97% (±1 SD). On the other hand, if the displayed SpO2 on that same patient decreases from 95% to 93%, the amount by which the saturation has decreased is more certain than the original absolute SpO2 value. In other words, trend accuracy is greater than absolute value accuracy. Variability among patients is a price we pay for the convenience of having the pulse oximeter precalibrated with a universal algorithm (see the third pulse oximetry assumption). The calibration algorithm is a best fit of data from a large number of healthy adult volunteers. Alternatively, manufacturers could have chosen to require user calibration on each individual patient. This would have improved absolute accuracy, but it would have lost an important advantage of pulse oximetry, namely, the absence of a need for user calibration.
Plethysmograph Variability Applications
In 1873, Kussmaul proposed that respiratory variation of the pulse intensity is an important sign of various physiologic derangements, including pericardial tamponade.67 Nearly 100 years later, Kussmaul’s observation led to the measured association between pulsus paradoxus and intravascular volume status.68 This concept evolved into a relationship between “arterial pulse pressure” from the arterial cannula and fluid responsiveness, addressing the basic clinical question of whether the patient would benefit from additional intravascular fluids.69,70 Numerous studies over the years have shown that the traditional “static” parameters, including central venous pressure and pulmonary artery occlusion pressure, are of limited value in answering this question. Perhaps “dynamic parameters” such as pulse-pressure variation can be more predictive.71
Meanwhile, other investigators had already extrapolated this pulse-variation principle to the dependence of pulse oximeter plethysmograph variations on intravascular volume.72 These early efforts to use pulse oximetry for the estimation of volume status were interesting but found little clinical use because they were neither sensitive nor specific. However, more recent advances in pulse oximeter signal processing have made this noninvasive possibility more promising. Masimo has developed a new parameter called the plethysmograph variability index (PVI), which is defined as

where PImax is the maximum value of the perfusion index, the ratio of AC to DC absorbance signal during the respiratory cycle, and PImin is the minimum value during the cycle. This parameter can be continuously displayed by the pulse oximeter, thus quantifying the respiratory variation of the plethysmograph amplitude. Higher values of PVI are suggestive of lower intravascular volume status and a stronger probability of a positive hemodynamic response to fluid infusion.
Clinical studies of PVI have shown that it correlates strongly with arterial pulse pressure variations during positive-pressure ventilation.73 More importantly, recent studies have found that PVI is predictive of response to intravascular volume infusion, with a sensitivity and specificity superior to those of either central venous pressure or wedge pressure.74,75 Figure 11-15 shows typical plethysmograph waveforms and PVI trend plots for patients who are fluid responders and nonresponders.75 As intravascular fluids are infused, the PVI falls dramatically in fluid responders, but it changes little in the nonresponders.
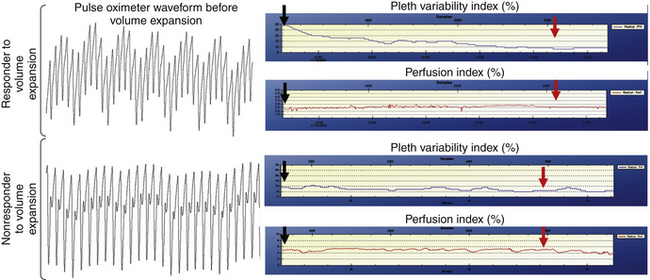
FIGURE 11-15 Plethysmograph (Pleth) waveforms and plethysmograph variability index trend plots for patients who are fluid responders and nonresponders. (From Canneson M, Desebbe O, Rosamel P, et al: Pleth variability index to monitor the respiratory variations in the pulse oximeter plethysmographic waveform amplitude and predict fluid responsiveness in the operating theatre, Br J Anaesth 101[2]:200-206, 2008.)
Plethysmograph variability, like pulsus paradoxus, is sensitive to a number of physiologic factors other than volume status (Box 11-1). The astute clinician must consider all possible causes for changes in PVI. Additional clinical data must be used to distinguish hypovolemia from tamponade, bronchospasm, or pneumothorax for example. Nevertheless, early studies suggest that pulse oximeter plethysmograph variability has excellent potential for monitoring hemodynamics in OR and critical care settings.
Limitations of Pulse Oximetry
Since the pulse oximeter became a minimum standard of care in the OR in 1986,76 it has been unethical to perform randomized controlled studies of its clinical effectiveness in that setting.77 Before that time, several such studies were performed. Coté and colleagues78 studied 152 pediatric patients during anesthesia and surgery. In half of these patients, the SpO2 data were unavailable to the anesthesiologist. The study found that “major events,” defined as SpO2 below 85% for more than 30 seconds, occurred significantly more often in the patients for whom the SpO2 values were hidden, and most of these events occurred in patients younger than 2 years. On the other hand, none of these controlled studies demonstrated a statistically significant difference in patient outcomes—that is, morbidity and mortality—and this includes the Moller study48 of more than 20,000 patients cited above. This merely shows the difficulty of performing outcomes studies in anesthesiology. When a study cannot disprove the null hypothesis of no difference between treatments, it does not mean that the null hypothesis is true. This basic fact of statistics is too often overlooked in interpretations of clinical studies.
Since becoming an intraoperative standard of care in the 1980s, the pulse oximeter also has had major impact in other clinical settings. Two studies monitored SpO2 during transport from the OR to the recovery room; both found a high incidence of desaturations with SpO2 values below 90% in patients who did not receive supplemental oxygen.79,80 These studies strongly support a uniform policy of transport to the postanesthesia care unit (PACU) with supplemental oxygen for all patients. Similar studies suggest that SpO2 should be continuously monitored in most patients in the recovery room. One study of postoperative pediatric patients showed no correlation between SpO2 and a traditional postanesthesia score based on motor activity, respirations, blood pressure, mental status, and color.81 The authors concluded that postoperative pediatric patients should be monitored by pulse oximetry or be given supplemental oxygen regardless of their apparent state of wakefulness. Another study found that 14% of adult PACU patients had SpO2 values below 90% and that significant desaturations were associated with obesity, extensive surgery, advanced age, and poor physical status.82 In fact, most patients are more likely to have hypoxemia in the PACU than in the OR. Recovery room patients no longer have a protected airway and are not receiving mechanical ventilation, yet they have not fully recovered from the depressant effects of anesthesia and surgery.
The pulse oximeter warns of developing hypoxemia, but at the increased inspired oxygen fractions typically used in the OR, SpO2 may not provide an early warning of decreasing arterial oxygen tension. The oxyhemoglobin dissociation curve (see Fig. 11-2) shows that PaO2 must decrease to less than 80 mm Hg before SaO2 falls significantly. A good example of this limitation is in the detection of inadvertent endobronchial intubation.
Figure 11-16 shows data from four different oxygenation monitors plotted as functions of time for an animal undergoing general anesthesia at an fractional concentration of inspired oxygen (FiO2) of 0.5.83 In addition to SpO2, the plot shows PaO2 values from sequential arterial blood samples, transcutaneous oxygen tension (PTCO2), and oxygen tension from an intraarterial fiberoptic “optode” blood gas sensor (OpPO2). At 0 minutes on the time axis, the endotracheal tube was advanced from the trachea into the left mainstem bronchus. Within 3 minutes, the PaO2 decreased from 360 mm Hg to 120 mm Hg, and the PTCO2 and OpPO2 values also fell significantly. However, SpO2 never fell below 98% during the entire experiment. In this situation, the pulse oximeter provided no indication that an endobronchial intubation had taken place, whereas the other monitoring techniques all showed significant changes. Only when the experiment was repeated for FiO2 values of 0.3 or less did the pulse oximeter display consistent SpO2 decreases of 6% or more. This illustrates an important physiologic limitation of saturation monitoring: when increased FiO2 is used, the PaO2 value must decrease far below its baseline before the pulse oximeter will alert the clinician. Metaphorically speaking, the pulse oximeter is a sentry standing on the edge of the cliff of desaturation (see Fig. 11-2), and it gives no warning as we approach the edge; it only sounds an alarm when we have fallen off.
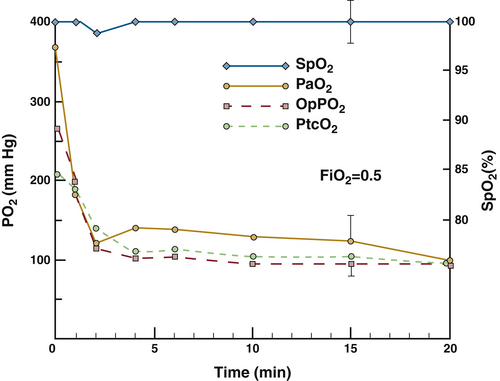
FIGURE 11-16 Four oxygenation variables plotted against time from the onset of endobronchial intubation in a dog at a fraction of inspired oxygen (FiO2) of 0.5. Arterial oxygen tension (PaO2), optode intraarterial oxygen tension (OpPO2), and transcutaneous oxygen tension (PTCO2) all decreased rapidly during the first 2 minutes following endobronchial intubation, whereas the pulse oximetry value (SpO2) did not change significantly at any time. (From Barker SJ, Tremper KK, Hyatt J, et al: Comparison of three oxygen monitors in detecting endobronchial intubation. J Clin Monit 1988;4:241.)
Finally, no discussion of a clinical device is complete without a description of the risks and complications of the monitoring process. Because the pulse oximeter is noninvasive and typically does not produce heat or radiation, these risks might be expected to be nonexistent. Because of human error, however, this is unfortunately not true. In a case report, a Physio-Control (Redmond, WA) pulse oximeter sensor was mistakenly connected to an Ohmeda (now GE Healthcare) instrument.84 The two oximeters used the same electrical connector for the sensor, but the internal pin connections were different; this resulted in severe thermal burns to both the finger and the earlobe of a newborn infant. The lesson from this case is that compatibility between sensor and instrument must be ensured before a sensor is placed on a patient. This risk has been reduced in more recent designs, but the clinician should never assume that just because the plug fits, it is acceptable to interconnect sensors and instruments of different manufacturers.
The pulse oximeter is unquestionably the most important advance in oxygen monitoring since the development of the blood gas analyzer. It is the only oxygen monitor that provides continuous, real-time, noninvasive data on arterial oxygenation without the need for user calibration. Because it is noninvasive and almost risk free, the pulse oximeter should be used in all clinical settings in which risk of arterial hypoxemia is present. It is a minimum standard of care in the OR and is rapidly becoming a standard in most other critical care settings. Hypoxia remains the most common cause of anesthesia-related preventable death.85,86 Therefore the prudent use of pulse oximetry is a fundamental responsibility of the anesthesiologist.
The pulse oximeter is not an ideal instrument because it is subject to both measurement error and physiologic limitations.87-95 With an understanding of the physics and engineering principles of pulse oximetry as outlined in this chapter, the astute clinician will be aware of measurement errors and when they are likely to occur. The impact of these errors also can be minimized by obtaining appropriate supportive data. For example, a smoke inhalation victim should have carboxyhemoglobin levels determined by in vitro CO oximetry or be monitored with a multiwavelength pulse oximeter capable of measuring COHb.21 The pulse oximeter signal/noise ratio should be optimized by careful sensor application, prevention of ambient light from reaching the sensor, and consideration of alternative sensor sites in patients who are shivering or who have diminished peripheral pulses. The avoidance of hypoxia is a fundamental goal of every anesthesiologist, and an understanding of the physics and physiology of arterial saturation monitoring by pulse oximetry will help accomplish this task.
References
1. Brown L.J. A new instrument for the simultaneous measurement of total hemoglobin, % oxyhemoglobin, % carboxyhemoglobin, % methemoglobin, and oxygen content in whole blood. IEEE Trans Biomed Eng. 1980;27:132–138.
2. Stephen C.R., Slater H.M., Johnson A.L., et al. The oximeter: a technical aid for the anesthesiologist. Anesthesiology. 1951;12:541–555.
3. Knill R.L., Clement J.L., Kieraszewicz H.T., et al. Assessment of two noninvasive monitors of arterial oxygenation in anesthetized man. Anesth Analg. 1982;61:582–586.
4. Severinghaus J.W., Astrup P.B. History of blood gas analysis. VI. Oximetry, J Clin Monit. 1986;2:270–288.
5. Wukitsch M.W., Tobler D., Pologe J., et al. Pulse oximetry: an analysis of theory, technology and practice. J Clin Monit. 1988;4:290–301.
6. Barker S.J., Tremper K.K. The effect of carbon monoxide inhalation on pulse oximetry and transcutaneous PO2. Anesthesiology. 1987;66:677–679.
7. Barker S.J., Tremper K.K., Hyatt J. Effects of methemoglobinemia on pulse oximetry and mixed venous oximetry. Anesthesiology. 1989;70:112–117.
8. Chui J., Poon W., Chan K., Chan A., Buckley T. Nitrite-induced methemoglobinaemia: aetiology, diagnosis, and treatment. Anaesthesia. 2005;60:496–500.
9. Cornelissen P.J.H., van Del W.C., de Jong P.A. Correction factors for hemoglobin derivatives in fetal blood as measured with the IL282 CO oximeter. Clin Chem. 1983;29:1555–1556.
10. Craft J.A., Alessandrini E., Kenney L.B., et al. Comparison of oxygenation measurements in pediatric patients during sickle cell crises. J Pediatr. 1994;124:93–95.
11. Rackoff W.R., Kunkel N., Silber J.H., et al. Pulse oximetry and factors associated with hemoglobin oxygen desaturation in children with sickle cell disease. Blood. 1993;81:3422–3427.
12. Weston Smith S.G., Glass U.H., Acharya J. Pearson TC: Pulse oximetry in sickle cell disease. Clin Lab Haematol. 1989;11:185–188.
13. Das A., Sinha S., Hoyer J. Hemoglobin Bassett produces low pulse oximeter and co-oximeter readings. Chest. 2007;131:1242–1244.
14. Scheller M.S., Unger R.J., Kelner M.J. Effects of intravenously administered dyes on pulse oximetry readings. Anesthesiology. 1986;65:550–552.
15. Veyckemans F., Baele P., Guillaume J.E., et al. Hyperbilirubinemia does not interfere with hemoglobin saturation measured by pulse oximetry. Anesthesiology. 1989;70:118–122.
16. Coté C.J., Goldstein E.A., Fuchsman W.H., et al. The effect of nail polish on pulse oximetry. Anesth Analg. 1988;67:683–686.
17. Aoyagi T., Miyasaka K. The theory and applications of pulse spectrophotometry. Anesth Analg. 2002;94:S93–S95.
18. Noiri E., Kobayashi N., Takamura Y., et al. Pulse total hemoglobinometer provides accurate noninvasive monitoring. Crit Care Med. 33, 2005. E2831
19. Petrov Y., Petrova I., Patrikeev I., Esenaliev R., Prough D. Multiwavelength optoacoustic system for noninvasive monitoring of cerebral venous oxygenation: a pilot clinical test in the internal jugular vein. Optics Letters. 2006;31:1827–1829.
20. Nelson L., McCann J., Loepke A., Wu J. Development and validation of a multiwavelength spatial domain near-infrared oximeter to detect cerebral hypoxia-ischemia. J Biomed Opt. 11(6), 2006. 064022
21. Barker S., Curry J., Redford D., Morgan S. Measurement of carboxyhemoglobin and methemoglobin by pulse oximetry. Anesthesiology. 2006;105:892–897.
22. Coulange M., Barthelemy A., Hug F., Thierry A., DeHaro L. Reliability of new pulse CO-oximeter in victims of carbon monoxide poisoning. Undersea Hyperb Med. 2005;32(2):1–5.
23. Layne T., Snyder C., Brooks D., Enjeti S. Evaluation of a new pulse CO-oximeter: non-invasive measurement of carboxyhemoglobin in the outpatient pulmonary lab and emergency departments. December 2006. Presented at the 52nd Annual Meeting of the American Association for Respiratory Care (AARC), Las Vegas.
24. Hampson N., Ecker E., Scott K. Use of noninvasive pulse CO-oximeter to measure blood carboxyhemoglobin levels in bingo players. Resp Care. 2006;51(7):758–760.
25. Light A., Grass C., Pursley D., Krause J. Carboxyhemoglobin levels in smokers vs. non-smokers in a smoking environment. December 2006. Presented at the 52nd Annual Meeting of the American Association for Respiratory Care (AARC), Las Vegas.
26. Hostler D., Roth R., Kaufman R., et al. The incidence of carbon monoxide poisoning during CO alarm investigations. Pre-Hospital Emergency Care. 2008;12(1):115.
27. Ben-Eli D., Peruggia J., McFarland J., et al. Detecting CO: FDNY studies prehospital assessment of COHb. JEMS. 2007;32(10):S36–S37.
28. Dickinson E., Mecham C., Thom S., Shofer F., Band R. The non-invasive carboxyhemoglobin monitoring of firefighters engaged in fire suppression and overhaul operations. Pre-Hospital Emergency Care. 2008;12(1):96.
29. Plante T., Harris D., Savitt J., et al. Carboxyhemoglobin monitored by bedside continuous CO-oximetry. J Trauma. 2007;63(5):1187–1190.
30. Li Z., Gao C., Huang X., Wang G., Ge H. Clinical analyses of 429 cases of acute CO poisoning. Anesthesiology. 107, 2007. A1490
31. Suner S., Partridge R., Sucov A., et al. Non-invasive pulse CO-oximetry screening in the emergency department identifies occult carbon monoxide toxicity. J Emerg Med. 2008;34(4):441–450.
32. Throm M., Stevens M., Hansen C. Benzocaine-induced methemoglobinemia in two patients: interdisciplinary collaboration, management, and near misses. Pharmacotherapy. 2007;27(8):1206–1214.
33. Ash-Bernal R., Wise R., Wright S. Acquired methemoglobinemia: a retrospective series of 138 cases at two teaching hospitals. Medicine. 2004;83(5):265–273.
34. Macknet M., Kimball-Jones P., Applegate R., Martin R., Allard M. Benzocaine induced methemoglobinemia after TEE. Respir Care. 52(11), 2007.
35. Barker S.J., Annabi E.H. Life-threatening methemoglobinemia detected by pulse oximetry: a case report. Anesth Analg. 2009;108(3):898–899.
36. Macknet M., Norton S., Kimball-Jones P., et al. Continuous non-invasive measurement of hemoglobin via pulse CO-oximetry. Anesth Analg. 105(6), 2007. S-108
36a. Macknet M.R., Allard M., Applegate R.L., II., Rook J. The accuracy of noninvasive and continuous total hemoglobin measurement by pulse CO-oximetry in human subjects undergoing hemodilution. Anesth Analg. 2010;111:1424–1426.
37. Allard M., Viljoen J. Casual screening of haemoglobin noninvasively positively affects a colleague’s future? A case report http://www.wca2008.com/images/abstractWCA/monitoring.pdf 14th Annual World Congress of Anesthesiology; March 2008, Capetown, South Africa. Accessed online at.
38. Pologe J.A. Pulse oximetry: technical aspects of machine design. Int Anesthesiol Clin. 1987;25:137–153.
39. Kelleher J.F., Ruff R.H. The penumbra effect: vasomotion-dependent pulse oximeter artifact due to probe malposition. Anesthesiology. 1989;71:787–791.
40. Barker S.J., Hyatt J., Shah N.K., et al. The effect of sensor malpositioning on pulse oximeter accuracy during hypoxemia. Anesthesiology. 1993;79:248–254.
41. Lawson D., Norley I., Korbon G., et al. Blood flow limits and pulse oximeter signal detection. Anesthesiology. 1987;67:599–603.
42. Narang V.P.S. Utility of the pulse oximeter during cardiopulmonary resuscitation. Anesthesiology. 1986;65:239–240.
43. Nowak G.S., Moorthy S.S., McNiece W.L. Use of pulse oximetry for assessment of collateral arterial flow. Anesthesiology. 1986;64:527.
44. Skeehan T.M., Hensley F.A., Jr. Axillary artery compression and the prone position. Anesth Analg. 1986;65:518–519.
45. Barrington K.J., Ryan C.A., Finer N.N. Pulse oximetry during hemorrhagic hypotension and cardiopulmonary resuscitation in the rabbit. J Crit Care. 1986;1:242–246.
46. Freund P.R., Overand P.T., Cooper J., et al. A prospective study of intraoperative pulse oximetry failure. J Clin Monit. 1991;7:253–258.
47. Reich D.L., Timcenko A., Bodian C.A., et al. Predictors of pulse oximetry data failure. Anesthesiology. 1996;84:859–864.
48. Moller J.T., et al. Randomized evaluation of pulse oximetry in 20,802 patients. Anesthesiology. 1993;78:436–453.
49. Severinghaus J.W., Spellman M.J., Jr. Pulse oximeter failure thresholds in hypotension and vasoconstriction. Anesthesiology. 1990;73:532–537.
50. Graham B., Paulus D.A., Caffee H.H. Pulse oximetry for vascular monitoring in upper extremity replantation surgery. J Hand Surg. 1986;11A:687–692.
51. Lawless S.T. Crying wolf: false alarms in a pediatric intensive care unit. Crit Care Med. 1994;22:981–985.
52. Nellcor N-200 pulse oximetry note number 6: C-Lock ECG synchronization principles of operation. Hayward, California: Nellcor; 1988.
53. Barker S.J., Shah N.K. Effects of motion on the performance of pulse oximeters in volunteers. Anesthesiology. 1997;86:101–108.
54. Barker S.J. “Motion-resistant” pulse oximetry: a comparison of new and old models. Anesth Analg. 2002;95:967–972.
55. Dumas C., Wahr J.A., Tremper K.K. Clinical evaluation of a prototype motion artifact resistant pulse oximeter in the recovery room. Anesth Analg. 1996;83(2):269–272.
56. Kim J.M., Arakawa K., Benson K.T., et al. Pulse oximetry and circulatory kinetics associated with pulse volume amplitude measured by photoelectric plethysmography. Anesth Analg. 1986;65:1333–1339.
57. Bohnhorst B., Peter C.S., Poets C.F. Pulse oximeters’ reliability in detecting hypoxemia and bradycardia: comparison between a conventional and two new-generation oximeters. Crit Care Med. 2000;28(5):1565–1568.
58. Malviya S., Reynolds P.I., Voepel-Lewis T., et al. False alarms and sensitivity of conventional pulse oximetry versus the Masimo SET technology in the pediatric postanesthesia care unit. Anesth Analg. 2000;90(6):1336–1340.
59. Bland J.M., Altman D.G. Statistical methods for assessing agreement between two methods of clinical measurement. Lancet. 1986;1:307–310.
60. Tremper K.K., Barker S.J. Pulse oximetry. Anesthesiology. 1989;70:98–108.
61. Severinghaus J.W., Kelleher J.F. Recent developments in pulse oximetry. Anesthesiology. 1992;76:1018–1038.
62. Severinghaus J.W., Naifeh K.H. Accuracy of response of six pulse oximeters to profound hypoxia. Anesthesiology. 1987;67:551–558.
63. Kagle D.M., Alexander C.M., Berko R.S., et al. Evaluation of the Ohmeda 3700 pulse oximeter: steady-state and transient response characteristics. Anesthesiology. 1987;66:376–380.
64. Severinghaus J.W., Naifeh K.H., Koh S.O. Errors in 14 pulse oximeters during profound hypoxia. J Clin Monit. 1989;5:72–81.
65. Barker S.J., Hyatt J. Forehead reflectance pulse oximetry: time response to rapid saturation change. Anesthesiology. 1990;73(3A):A544.
66. Barker S.J., Le N., Hyatt J. Failure rates of transmission and reflectance pulse oximetry for various sensor sites. J Clin Monit. 1991;7:102–103.
67. Kussmaul A. Über schwielige Mediastino-Peikarditis und den paradoxen Puls. Berl Klin Wochenschr. 1873;10:433–435. 445-449, 461-464
68. Cohn J.N., Pinkerton A.L., Tristani F.E. Mechanism of pulsus paradoxus in clinical shock. J Clin Investigation. 1967;46(11):1744–1755.
69. Michard F., Boussat S., Chemla D., et al. Relation between respiratory changes in arterial pulse pressure and fluid responsiveness in septic patients with acute circulatory failure. Am J Respir Crit Care Med. 2000;162:134–138.
70. Lopes M.R., Oliveira M.A., Pereira V.O., et al. Goal-directed fluid management based on pulse pressure variation monitoring during high-risk surgery: a pilot randomized controlled trial. Crit Care. 11, 2007. R100
71. Michard F. Changes in arterial pressure during mechanical ventilation. Anesthesiology. 2005;103:419–428.
72. Partridge B.L. Use of pulse oximetry as a non-invasive indicator of intravascular volume status. J Clin Monitoring. 1987;3:263–268.
73. Canneson M., Delannoy B., Morand A., et al. Does pleth variability index indicate the respiratory-induced variation in the plethysmogram and arterial pressure waveforms? Anesth Analg. 2008;106:1189–1194.
74. Canneson M., Desebbe O., Rosamel P., et al. Pleth variability index to monitor the respiratory variations in the pulse oximeter plethysmographic waveform amplitude and predict fluid responsiveness in the operating theatre. Br J Anaesth. 2008;101(2):200–206.
75. Canneson M., Slieker J., Desebbe O., et al. The ability of a novel algorithm for automatic estimation of the respiratory variations in arterial pulse pressure to monitor fluid responsiveness in the operating room. Anesth Analg. 2008;106:1195–1200.
76. American Society of Anesthesiologists. Standards for basic intraoperative monitoring. Anesthesia Patient Safety Newsletter. 1987. March:3
77. Eichhorn J.H., Cooper J.B., Cullen D.J., et al. Standards for patient monitoring during anesthesia at Harvard Medical School. JAMA. 1986;256:1017–1020.
78. Coté C.J., Goldstein E.A., Coté M.A., et al. A single-blind study of pulse oximetry in children. Anesthesiology. 1988;68:184–188.
79. Pullerits J., Burrows F.A., Roy W.L. Arterial desaturation in healthy children during transfer to the recovery room. Can J Anaesth. 1987;34:470–473.
80. Tyler I.L., Tantisira B., Winter P.M., et al. Continuous monitoring of arterial oxygen saturation with pulse oximetry during transfer to the recovery room. Anesth Analg. 1985;64:1108–1112.
81. Soliman I.E., Patel R.I., Ehrenpreis M.B., et al. Recovery scores do not correlate with postoperative hypoxemia in children. Anesth Analg. 1988;67:53–56.
82. Morris R.W., Buschman A., Warren D.L., Philip J.H., Reamer D.B. The prevalence of hypoxemia detected by pulse oximetry during recovery from anesthesia. J Clin Monit. 1988;4:16–20.
83. Barker S.J., Tremper K.K., Hyatt J., et al. Comparison of three oxygen monitors in detecting endobronchial intubation. J Clin Monit. 1988;4:240–243.
84. Murphy K.G., Segunda J.A., Rockoff M.A. Severe burns from a pulse oximeter. Anesthesiology. 1990;73:350–352.
85. Keenan R.L., Boyan C.P. Cardiac arrest due to anesthesia: a study of incidence and causes. JAMA. 1985;253:2373–2377.
86. Taylor G., Larson C.P., Jr., Prestwich R. Unexpected cardiac arrest during anesthesia and surgery: an environmental study. JAMA. 1976;236:2758–2760.
87. Chapman K.R., Liu F.L.W., Watson R.M., et al. Range of accuracy of two-wavelength oximetry. Chest. 1986;4:540–542.
88. Nickerson B.G., Sakrison C., Tremper K.K. Bias and precision of pulse oximeters and arterial oximeters. Chest. 1988;93:515–517.
89. Mihm F.G., Halperin B.D. Noninvasive detection of profound arterial desaturations using a pulse oximetry device. Anesthesiology. 1985;62:85–87.
90. Cecil W.T., Thorpe K.J., Fibuch E.E., et al. A clinical evaluation of the accuracy of the Nellcor N-100 and the Ohmeda 3700 pulse oximeters. J Clin Monit. 1988;4:31–36.
91. Fait C.D., Wetzel R.C., Dean J.M., et al. Pulse oximetry in critically ill children. J Clin Monit. 1985;1:232–235.
92. Boxer R.A., Gottesfeld I., Singh S., et al. Non-invasive pulse oximetry in children with cyanotic congenital heart disease. Crit Care Med. 1987;15:1062–1064.
93. Mok J., Pintar M., Benson L., et al. Evaluation of noninvasive measurements of oxygenation in stable infants. Crit Care Med. 1986;14:960–963.
94. Durand M., Ramanathan R. Pulse oximetry for continuous oxygen monitoring in six newborn infants. J Pediatr. 1986;109:1052–1055.
95. Yelderman M., New W. Evaluation of pulse oximetry. Anesthesiology. 1983;59:349–352.
∗Dr. Barker is a member of the Scientific Advisory Board of Masimo Corporation (Irvine, CA) and is also a community member of their Board of Directors. He is not an employee or a paid consultant of Masimo or any other company involved in pulse oximetry.