Electrocardiographic Monitoring
Electrocardiography
The intraoperative use of the electrocardiogram (ECG) has developed markedly over the past several decades.1 Originally, this monitor was primarily used during anesthesia for the detection of arrhythmias in high-risk patients. In recent years, however, it has become a standard perioperative monitor used during the administration of all anesthetics.2 Beyond its usefulness for the intraoperative recognition of arrhythmias, one of the major indications for ECG monitoring is the intraoperative diagnosis of myocardial ischemia.3 ECG monitoring for ischemia is inexpensive and noninvasive. Most modern operating room (OR) monitors provide automated ST-segment monitoring, which can be set to alarm if changes are detected.4
Normal Electrical Activity
Figure 13-1 shows the segments and intervals of the normal ECG. These elements are explained in the following subsections.
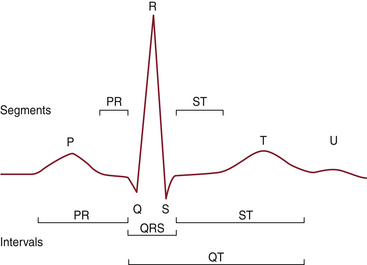
P Wave
Under normal circumstances, the sinoatrial (SA) node has the most rapid rate of spontaneous depolarization and therefore is the dominant cardiac pacemaker. From the SA node, the impulse spreads through the right and left atria. Specialized tracts can conduct the impulse to the atrioventricular (AV) node, but they are not essential. On the ECG, depolarization of the atria is represented by the P wave. The initial depolarization primarily involves the right atrium and predominantly occurs in an anterior, inferior, and leftward direction. Subsequently, it proceeds to the left atrium, which is located in a more posterior position.
PR Interval
Once the wave of depolarization has reached the AV node, a delay is observed. The delay permits contraction of the atria and allows supplemental filling of the ventricular chambers. On the ECG, this delay is represented by the PR interval.
QRS Complex
After passing through the AV node, the electrical impulse is conducted along the ventricular conduction pathways, consisting of the common bundle of His, the left and right bundle branches, the distal bundle branches, and the Purkinje fibers. The QRS complex represents the progress of the depolarization wave through this conduction system. After terminal depolarization, the ECG normally returns to baseline.
ST Segment and T Wave
Repolarization of the ventricles, which begins at the end of the QRS complex, consists of the ST segment and T wave. Ventricular depolarization occurs along established conducting pathways, but ventricular repolarization is a prolonged process that occurs independently in every cell. The T wave represents the uncanceled potential differences of ventricular repolarization. The junction of the QRS complex and the ST segment is called the J junction. The T wave is sometimes followed by a small U wave, the origin of which is unclear. Prominent U waves are characteristic of hypokalemia (as well as hypothermia, hypomagnesemia, and hypocalcemia) and sometimes also observed after cerebrovascular accidents. Very prominent U waves may be seen in patients taking medications such as sotalol or one of the phenothiazines. Negative U waves may appear with positive T waves, an abnormal finding that has been noted in left ventricular hypertrophy and myocardial ischemia.5
Lead Systems
Standard Limb and Precordial Leads
The small electric currents produced by the electrical activity of the heart spread throughout the body, which behaves as a volume conductor, allowing the surface ECG to be recorded at any site. The standard leads are bipolar leads because they measure differences in potential between two electrodes. The electrodes are placed on the right arm, the left arm, and the left leg. The leads are formed by the imaginary lines connecting the electrodes, and the polarities correspond to the conventions of Einthoven’s triangle. They are labeled leads I, II, and III. By convention, lead I is formed by connecting the right arm and left arm electrodes, with the left arm being positive; lead II is formed by connecting the right arm and left leg, with the left leg being positive; lead III is formed by connecting the left arm and left leg, with the left leg being positive. If the three electrodes of the standard leads are connected through resistances of 5000 ohms each, a common central terminal with zero potential is obtained. When this common electrode is used with another active electrode, the potential difference between the two represents the actual potential. On a standard 12-lead ECG, three unipolar limb leads usually are recorded: aVR, aVL, and aVF. The a indicates that the limb leads are augmented and were obtained via Goldberger’s modification, in which the resistors are removed from the lead wires and the exploring electrode is disconnected from the central terminal. Goldberger’s modification produces larger voltage deflections on the ECG.
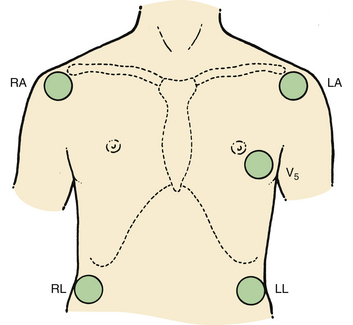
Additional information on the heart’s electrical activity is obtained when electrodes are placed closer to the heart or around the thorax. In the precordial lead system (Fig. 13-2), the neutral electrode is formed by the standard leads, and an exploring electrode is placed on the chest wall. The ECG normally is recorded with the exploring electrode in one or more of six precordial positions. Each lead is indicated by the letter V followed by a subscript numeral from 1 to 6, which indicates the location of the electrode on the chest wall.
Electrocardiogram Monitoring Systems
As the name implies, the three-electrode system uses only three electrodes to record the ECG. In such a system, the ECG is observed along one bipolar lead between two of the electrodes; the third electrode serves as a neutral lead, and a selector switch allows the user to alter the designation of the electrodes. Three ECG leads can be examined in sequence without changing the location of the electrodes. Although the three-electrode system has the advantage of simplicity, its use is limited in the detection of myocardial ischemia because it provides a narrow picture of myocardial electrical activity.
Modified Three-Electrode System
Numerous modifications of the standard bipolar limb lead system have been developed. Some of these are displayed in Figure 13-3. They are used in an attempt to maximize P-wave amplitude for the diagnosis of atrial arrhythmias or to increase the sensitivity of the ECG for the detection of anterior myocardial ischemia. In clinical studies, these modified three-electrode systems have been shown to be at least as sensitive as the standard V5 lead system for the intraoperative diagnosis of ischemia.6
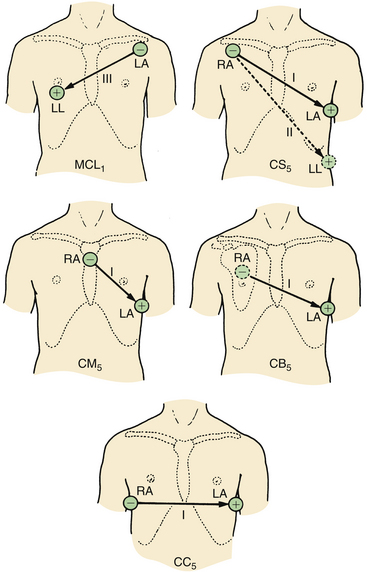
FIGURE 13-3 Modified precordial lead arrangements. RA, right arm; LA, left arm; LL, left leg. (From Thys DM, Kaplan JA, editors: The ECG in anesthesia and critical care. New York, 1987, Churchill Livingstone.)
Central Subclavicular Lead
The central subclavicular (CS5) lead (see Fig. 13-3) is particularly well suited for the detection of anterior wall myocardial ischemia. The right arm (RA) electrode is placed under the right clavicle, the left arm (LA) electrode is placed in the V5 position, and the left leg electrode is in its usual position to serve as a neutral lead. Lead I is selected for detection of anterior wall ischemia, and lead II can be selected either for monitoring inferior wall ischemia or for the detection of arrhythmias. If a unipolar precordial electrode is unavailable, this CS5 bipolar lead is the best and easiest alternative to a true V5 lead for monitoring myocardial ischemia.6
Central Back Lead
The central back (CB5) lead is useful for the detection of ischemia and supraventricular arrhythmias, as demonstrated in a study that compared CB5 and V5 in patients with closed and open chests.7 The P wave was 90% larger in lead CB5 than in lead V5, and a good association between ventricular deflections of CB5 and V5 leads was noted. CB5 is obtained by placing the RA electrode over the center of the right scapula and placing the LA electrode in the V5 position. The lead selector switch should be set to lead I. The CB5 lead may be useful in patients with ischemic heart disease who are susceptible to the development of perioperative arrhythmias.
When modified bipolar limb leads are used, the user should be aware that in certain aspects, they differ significantly from true unipolar precordial leads. The modified precordial leads usually show a greater R-wave amplitude than standard precordial leads, which can result in amplification of the ST-segment response. The criteria for diagnosing myocardial ischemia may therefore need to be adjusted when modified bipolar leads are used. It has been shown during exercise stress testing that normalization of the degree of ST-segment depression to the height of the R wave increases the sensitivity and specificity of the ECG for the recognition of myocardial ischemia.8 Although similar corrections have not yet been tested during intraoperative monitoring, their possible importance should be kept in mind when intraoperative ECG recordings are examined.
Five-Electrode System
The use of five electrodes permits the recording of the six standard limb leads—I, II, III, aVR, aVL, and aVF—as well as one precordial unipolar lead. In general, the unipolar lead is placed in the V5 position, along the anterior axillary line in the fifth intercostal space. With the addition of only two electrodes to the ECG system, up to seven different leads can be monitored simultaneously. This allows several areas of the myocardium to be monitored for ischemia, which is helpful in the establishment of a differential diagnosis between atrial and ventricular arrhythmias.
In 1976, Kaplan and King9 suggested monitoring lead V5 as the best choice for the detection of intraoperative ischemia. London, and colleagues10 demonstrated that in high-risk patients undergoing noncardiac surgery, when a single lead was used the greatest sensitivity was obtained with lead V5 (75%), followed by lead V4 (61%). Combining leads V4 and V5 increased the sensitivity to 90%, whereas the standard combination of leads II and V5 produced a sensitivity of only 80%. They also suggested that if three leads (II, V4, and V5) could be examined simultaneously, the sensitivity would increase to 98%.
Recently, Landesberg and colleagues11 investigated the usefulness of analyzing data obtained from continuous online 12-lead ECG monitoring for the detection of myocardial ischemia. During 11,132 patient-hours of monitoring, the investigators reported that V4 was most sensitive to ischemia (83.3%), followed by V3 and V5 (75% each). Combining two precordial leads increased the sensitivity for detecting ischemia (97.4% for V3 + V5 and 92.1% for either V4 + V5 or V3 + V4) and infarction (100% for V4 + V5 or V3 + V5 and 83.3% for V3 + V4). They found that the baseline preanesthesia ST segment was above isoelectric in V1 through V3 and below isoelectric in V5 through V6. Lead V4 was closest to the isoelectric level on the baseline ECG, rendering it most suitable for ischemia monitoring. The authors recommended that two or more precordial leads were necessary to approach a sensitivity of greater than 95% for the detection of perioperative ischemia and infarction.
However, in an editorial entitled “Multilead Precordial ST-segment Monitoring: ‘The Next Generation?’” London12 concluded that multilead precordial ST-segment monitoring is not practical. It presents a significant logistical problem, particularly if a patient needs to be mobilized quickly. It is also likely to result in a high rate of false-positive responses and artifacts. Instead, London recommended the use of true V4 or V5 leads, control of heart rate and pain, and the use of β-blockers as tolerated for all patients at risk (diabetics or patients with left ventricular hypertrophy).
Invasive Electrocardiography
The electrical potentials of the heart can be measured not only from a surface ECG but also from body cavities adjacent to the heart (esophagus or trachea) or from within the heart itself.
Esophageal Electrocardiography
The concept of esophageal ECG is not new, and numerous studies have demonstrated the usefulness of this approach in the diagnosis of complicated arrhythmias. A prominent P wave usually is displayed in the presence of atrial depolarization, and its relationship to the ventricular electrical activity can be examined. The esophageal electrodes are incorporated into an esophageal stethoscope and are welded to conventional ECG wires (Fig. 13-4). To record a bipolar esophageal ECG, the electrodes are connected to the right and left arm terminals, and lead I is selected on the monitor. In one study of 20 cardiac patients, 100% of atrial arrhythmias were correctly diagnosed with the esophageal lead (intracavitary ECG was used as the standard); lead II led to a correct diagnosis in 54% of the cases, and V5 led to a correct diagnosis in 42% of the cases.13 In addition, the esophageal ECG may be helpful in the detection of posterior wall ischemia because of its proximity to the posterior aspect of the left ventricle. Jain14 described the use of esophageal ECG and compared it with surface ECG (SECG) in patients undergoing coronary bypass grafting. He found that the recognition and measurement of all the PQRST waves could be improved and automated by simultaneous use of esophageal ECG and SECG. The P-wave amplitude was greater in esophageal ECG than in SECG, which might facilitate the identification of supraventricular versus ventricular arrhythmias. ST-segment deviation in the unipolar esophageal ECG was not suitable for the routine detection of ischemia because of excessive noise.
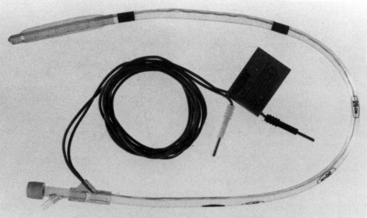
FIGURE 13-4 The cardioesophagoscope. The esophageal leads are embedded in plastic. The electrocardiogram wires are connected to the right arm and left arm leads, and lead I is selected on the monitor.
To minimize the risk of esophageal burn injury, an electrocautery protection filter capable of filtering radio frequencies greater than 20 kHz should be inserted between the ECG cable and the esophageal lead.
Intracardiac Electrocardiography
For many years, long central venous catheters filled with saline have been used to record the intracardiac ECG (IC-ECG).15 To best illustrate an IC-ECG, 1) attach a plastic adapter to the hub of the central venous catheter (CVC), whose most distal port is at the low superior vena cava or superior region of the right atrium; 2) instill saline via a syringe needle inserted through the rubber head of the adapter, ensuring by previous aspiration that no blood clots are present and air bubbles are cleared; 3) connect the needle of the syringe with one of the six precordial cables of a standard ECG machine using an alligator clamp; and 4) record a standard ECG, which will show the IC-ECG substituting for the selected V lead. Lead V1 is used most often, but any of leads V1 through V6 can be used.16
Chatterjee and colleagues17 described the use of a modified balloon-tipped flotation catheter for recording intracavitary electrograms. The multipurpose pulmonary artery catheter presently available has all the features of a standard pulmonary artery catheter. In addition, three atrial and two ventricular electrodes have been incorporated into the catheter (Fig. 13-5). These electrodes allow the recording of intracavitary ECGs and the establishment of atrial or AV pacing. The diagnostic capabilities of this catheter are great because atrial, ventricular, and AV nodal arrhythmias and conduction blocks can be demonstrated. The large voltages obtained from the intracardiac electrodes are relatively insensitive to electrocautery interference and are therefore useful for intraaortic balloon pump triggering.18 Other pulmonary artery catheters have ventricular and atrial ports that allow passage of pacing wires. These catheters also can be used for diagnostic purposes or for therapeutic interventions (pacing).
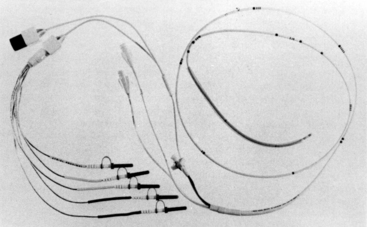
FIGURE 13-5 The multipurpose pacing pulmonary artery catheter. Three atrial and two ventricular electrodes are shown.
Benzadon and colleagues19 compared the amplitude of the P wave obtained by IC-ECG with those of the P waves obtained by esophageal ECG and SECG. They found that IC-ECG and esophageal ECG made it possible to register P waves larger than those registered by SECG but reported no difference between IC-ECG and esophageal ECG.
Tracheal Electrocardiography
Tracheal ECG allows monitoring when it is impractical or impossible to monitor the SECG. The tracheal ECG consists of a standard tracheal tube in which electrodes have been embedded. In a recent report, a tracheal tube was described with two coiled-wire stainless steel electrodes embedded in the tube’s cuff (Fig. 13-6).20 The same safety precautions as for esophageal ECG should be followed for tracheal ECG.
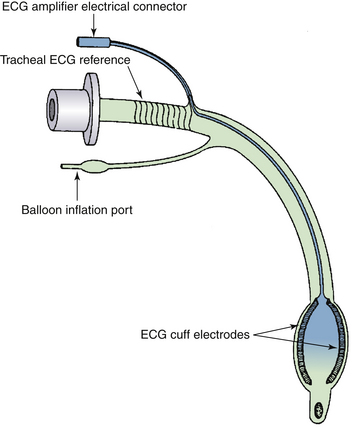
FIGURE 13-6 Schematic representation of an endotracheal tube with cuff electrodes, spiral reference electrode, and electrocardiograph (ECG) amplifier connector. (From Hayes JK, Peters JL, Smith KW, et al: Monitoring normal and aberrant electrocardiographic activity from an endotracheal tube: comparison of the surface, esophageal, and tracheal electrocardiograms. J Clin Monit 1994;10:81-90.)
Display, Recording, and Interpretation
The American Heart Association (AHA) has published instrumentation and practice standards for ECG monitoring in special care units.21 Because many of the principles enumerated in these standards also are applicable to intraoperative monitoring, they are often referred to in this chapter.
Basic Requirements
The function of the ECG monitor is to detect, amplify, display, and record the ECG signal. The ECG signal usually is displayed on an oscilloscope, and most monitors now offer nonfade storage oscilloscopes to facilitate wave recognition. All ECG monitors for use in patients with cardiac disease also should have paper recording capabilities. The recorder is needed to make accurate diagnoses of complex arrhythmias and allow careful analysis of all the ECG waveforms. In addition, the recorder allows differentiation of real ECG changes from oscilloscope artifacts. The AHA special report defines a number of requirements that should be met by ECG monitoring equipment (Boxes 13-1 to 13-3).20
Oscilloscope Displays
Most modern oscilloscopes are high-resolution monochrome or color monitors similar to those used in computer technology. They frequently allow considerable flexibility in screen configuration and include waveform positions, colors, and sweep speeds. The norm in modern technology is to display two or three ECG channels simultaneously. These usually consist of two limb leads and one unipolar precordial lead. Average heart rates and optional arrhythmia and ST-segment information are displayed in alphanumeric format in addition to the waveforms.
Standard Electrocardiogram Recordings
The ECG is recorded on special paper marked with a grid of horizontal and vertical lines. Distances between vertical lines represent time intervals, and distances between horizontal lines represent voltages. The lines are 1 mm apart, and every fifth line is heavier than the others. The speed of the paper is standardized to 25 mm/sec; on the horizontal axis, 1 mm equals 0.04 seconds and 0.5 cm equals 0.20 seconds. On the vertical axis, 10 mm represents 1 mV. On every recording, a calibration mark (1 cm = 1 mV) indicates that the ECG is appropriately calibrated. The user should follow the manufacturer’s recommended calibration procedures for each monitoring episode. Strip chart recorders that are part of an ECG monitoring system should meet all the standards for time-based accuracy—frequency response, linearity, and so forth—proposed for conventional ECG recording systems.22,23
Artifacts
The electrical signal generated by the heart and monitored by the ECG is very weak, amounting to only 0.5 to 2 mV at the skin surface. To avoid signal loss at the interface of skin and electrode, the skin must be properly prepared. Hair should be removed from the electrode sites with scissors and a razor, and the skin should be cleaned with alcohol and must be free of all dirt. It is best to abrade the skin lightly to remove part of the stratum corneum, which can be a source of high resistance to the measured voltages. To avoid the problem of muscle artifact, electrodes should be placed over bony prominences whenever possible. Muscle movement in the form of shivering can produce significant ECG artifact.
Electrodes and Leads
Loose electrodes and broken leads can produce a variety of artifacts that may simulate arrhythmias, Q waves, or inverted T waves. Pre-gelled, disposable electrodes made of silver metal and silver chloride electrolyte are usually used in the OR. The technical standards for such electrodes have been published by the Association for the Advancement of Medical Instrumentation (AAMI).24 It is important that all the electrodes be moist, uniform, and not out of date. Needle electrodes should be avoided because of the risk of thermal injury. Some ECG monitors have built-in cable testers that enable a lead to be tested when the cable’s distal (patient) end is connected to test terminals on the monitor. A high resistance causes a large voltage drop, indicating that the lead is faulty. The main source of artifact from ECG leads is loss of the integrity of the lead insulation. This subsequently leads to pickup of other electric fields in the OR, such as the 60-Hz alternating current (AC) from lights and currents from the electrocautery device. Any damaged ECG lead should be discarded for this reason. Movement of leads also can lead to artifact.
Operating Room Environment
Many pieces of equipment in the OR emit electrical fields that can interfere with the ECG. These include the 60-Hz AC power lines for lights, electrosurgical equipment, cardiopulmonary equipment, and defibrillators. Most of this interference can be minimized by proper shielding of the cables and leads, although to date the interference created by the electrosurgical equipment cannot be reliably filtered without distortion of the ECG. Electrocautery, the most important source of interference on the ECG in the OR, frequently obliterates the ECG tracing. Analysis of the electrocautery equipment has identified three component frequencies. Radiofrequency (RF) energy between 800 and 2000 kHz accounts for most of the interference. Also contributing to electrocautery interference are the 60-Hz AC energy and the 0.1- to 10-Hz low-frequency noise from intermittent contact of the electrosurgical unit with the patient’s tissues. Preamplifiers can be modified to suppress RF interference, but these filter circuits are still not widely available in the OR.
Other causes of ECG artifacts in the OR environment have been reported. Intraoperative monitoring of somatosensory evoked potentials (SSEPs) has been known to simulate pacemaker spikes.25 These spikes are caused by the incorporation of a pacer enhancement circuit into certain ECG monitors. The problem can be eliminated by disabling this circuit. Artifactual spikes have been noted to coincide with the drip rate in the drip chamber of a warming unit.26 The spikes were probably related to the generation of static electricity from water droplets. Use of an automated percutaneous lumbar discectomy nucleotome has been reported to simulate supraventricular tachycardia related to a mechanical interference.27
Monitoring System
All ECG monitors use filters to narrow the bandwidth in an attempt to reduce environmental artifacts. The high-frequency filters reduce distortions from muscle movement, 60-Hz electrical current, and electromagnetic interference from other electrical equipment.28 The low-frequency filters ensure a more stable baseline by reducing respiratory and body movement artifacts as well as those resulting from poor electrode contact. The AHA recommends that a flat frequency response be obtained at a bandwidth of 0.05 to 100 Hz.12 The high-frequency limit of 100 Hz ensures that tracings are of sufficient fidelity to assess QRS morphology and to accurately evaluate rapid rhythms such as atrial flutter. The low-frequency limit of 0.05 Hz allows accurate representation of slower events, such as P-wave and T-wave morphology and ST-segment excursion.
Most modern ECG monitors allow the operator a choice among several bandwidths. The actual filter frequencies tend to vary from manufacturer to manufacturer. One manufacturer (Hewlett-Packard, Andover, MA) allows a choice between a “diagnostic mode,” with a bandwidth of 0.05 to 130 Hz for adults and 0.5 to 130 Hz for neonates, a “monitoring mode” with a bandwidth 0.5 to 40 Hz for adults and 0.5 to 60 Hz for neonates, and a “filter mode” with a bandwidth of 0.05 to 20 Hz.
The importance of bandwidth selection for the detection of perioperative myocardial ischemia has been evaluated by Slogoff and colleagues.29 They simultaneously used five ECG systems: a Spacelabs Alpha 14 Model Series 3200 Cardule with a bandwidth of 0.05 to 125 Hz and one with a bandwidth of 0.5 to 30 Hz (Spacelabs Healthcare, Issaquah, WA); a Marquette Electronics (now GE Healthcare, Waukesha, WI) MAC II ECG with a bandwidth of 0.05 to 40 Hz and one with a bandwidth of 0.05 to 100 Hz; and a Del Mar Reynolds (now Spacelabs Healthcare) Holter recorder with a bandwidth of 0.1 to 100 Hz. The ST-segment positions with the three systems that used the lower filter limit (0.05 Hz) recommended by the AHA were similar, whereas with the Spacelabs 0.5 to 30 Hz system, they were consistently more negative. The ST-segment displacement on the Holter recorder was consistently less negative and less positive. In at least one automated ST-segment analysis system (Hewlett-Packard), the lower frequency filter (0.05 Hz) is automatically enabled when the ST analyzer is turned on.
Indications
Arrhythmias are common during surgery, and their causes are numerous. They are most common during tracheal intubation or extubation and arise more frequently in patients with preexisting cardiac disease. The major contributing factors to the development of perioperative arrhythmias are:
1. Anesthetic agents. Halogenated hydrocarbons, such as halothane or enflurane, are known to produce arrhythmias, probably by a reentrant mechanism.30 Halothane has also been shown to sensitize the myocardium to endogenous and exogenous catecholamines. Drugs that block the reuptake of norepinephrine, such as cocaine and ketamine, can facilitate the development of epinephrine-induced arrhythmias.
2. Abnormal arterial blood gases or electrolytes. Hyperventilation is known to reduce serum potassium concentration.31 If the preoperative potassium is low, it is possible that serum potassium will decrease to the range of 2 mEq/L and thus precipitate severe cardiac arrhythmias.
3. Tracheal intubation. This may be the most common cause of arrhythmias during surgery and is commonly associated with hemodynamic alterations.
4. Reflexes. Vagal stimulation may produce sinus bradycardia and may allow ventricular escape mechanisms to occur. In vascular surgery, these reflexes may be related to traction on the peritoneum or direct pressure on the vagus nerve during carotid artery surgery. Stimulation of the carotid sinus can also lead to arrhythmias, and the ocular cardiac reflex can be activated during eye surgery, leading to bradyarrhythmias.
5. Central nervous system stimulation and dysfunction of the autonomic nervous system.
6. Preexisting cardiac disease. Angelini and colleagues32 have shown that patients with known cardiac disease have a much higher incidence of arrhythmias during anesthesia than patients without known disease.
7. Central venous cannulation. The insertion of catheters or wires into the central circulation often causes arrhythmias.
Once an arrhythmia is recognized, it is important to determine whether it produces a hemodynamic disturbance, what type of treatment is required, and how quickly treatment should be instituted. Treatment should be initiated promptly if the arrhythmia leads to marked hemodynamic impairment. In addition, treatment should be instituted if the arrhythmia is a precursor of a more severe arrhythmia (e.g., frequent multifocal premature ventricular complexes [PVCs] with R-on-T phenomenon can lead to ventricular fibrillation), or if the arrhythmia could be detrimental to the patient’s underlying cardiac disease (e.g., tachycardia in a patient with mitral stenosis). The standard limb lead II is preferred for the detection of rhythm disturbances, because it usually displays large P waves.
Diagnosis of Ischemia
Factors that predispose to the development of perioperative ischemia include perioperative events that affect the myocardial oxygen balance and the presence of preexisting coronary artery disease. A number of perioperative clinical studies have found a high incidence of ECG evidence of ischemia (20% to 80%) in patients with coronary artery disease undergoing surgery, both cardiac and noncardiac.33,34 In the anesthetized patient, the detection of ischemia by ECG becomes even more important because the hallmark symptom of angina is not available.
In recent years, it has also become evident that a significant number of patients have asymptomatic, or silent, ischemia,35 manifested by characteristic ECG signs of myocardial ischemia in the absence of angina and not necessarily associated with changes in hemodynamics or heart rate. Among patients with chronic, stable angina who have ST-segment depression during exercise, ambulatory ECG monitoring during daily life identifies transient ischemic episodes in approximately 40% to 50% of ambulating patients. In these patients, silent ischemic episodes account for approximately 75% of all ischemic episodes while ambulating.36 The ECG changes that arise during myocardial ischemia often are characteristic and will be detected with careful ECG monitoring. Although the ECG criteria for ischemia were established in patients undergoing exercise stress testing, they also can be applied to anesthetized patients (Box 13-4).37 These criteria are 1) horizontal or downsloping ST-segment depression of 0.1 mV (Fig. 13-7, A and C); 2) slowly upsloping ST-segment depression (Fig. 13-7, B) of 0.2 mV, all measured from 60 to 80 ms after the J point; and 3) ST-segment elevation of 0.1 mV in a non–Q-wave lead.
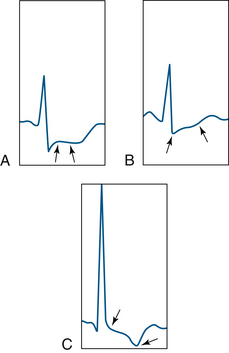
FIGURE 13-7 Examples of ST-segment depression (between arrows). A, Horizontal ST segment. B, Upsloping ST segment. C, Downsloping ST segment.
It is commonly believed that monitoring for intraoperative myocardial ischemia is unnecessary in neonates. Whereas ECG lead monitoring for adults is concerned with the detection of ischemia and arrhythmias, neonatal ECG monitoring has focused on arrhythmia recognition alone. Recent studies, however, suggest that the neonatal heart is more susceptible to ischemia than the adult heart. Bell and colleagues 38 have demonstrated the importance of calibrated ECG monitoring in neonates with congenital heart disease.
Although analysis of the ST segment provides sensitive information about myocardial ischemia, it should nonetheless be remembered that in approximately 10% of patients, underlying ECG abnormalities hinder the analysis. Some abnormalities are caused by hypokalemia, administration of digitalis, left bundle branch block, Wolff-Parkinson-White syndrome, or left ventricular hypertrophy with strain. In patients with these problems, other diagnostic modalities, such as transesophageal echocardiography, should be considered.
Diagnosis of Conduction Defects
Conduction defects also can arise during surgery. They can result from the passage of a pulmonary artery catheter through the right ventricle, or they can be a manifestation of myocardial ischemia. Because high-grade conduction defects (second- and third-degree AV blocks) often have deleterious effects on hemodynamic performance, their intraoperative recognition is important.
Automated Recording
A number of anesthesiologists have used Holter monitoring to document the incidence of perioperative arrhythmias and ischemia. In Holter monitoring, ECG information from one or two bipolar leads is recorded by a miniature recorder. Up to 48 hours of ECG signals can be collected. The data are subsequently processed by a playback system, and the ECG signals are analyzed. On most modern systems the playback unit includes a dedicated computer for rapid analysis of the data and automated recognition of arrhythmias. A significant limitation of traditional Holter monitoring in the perioperative period is that recordings usually are analyzed and interpreted retrospectively. A real-time Holter monitor records specific ECG segments for later playback and analyzes the rhythm and ST segment in real time and alerts the user to acute perturbations.39 The application of Holter monitoring in anesthesiology is, as of yet, primarily limited to the research environment.
Computer-Assisted Electrocardiogram Interpretation
Modern monitoring equipment is highly computerized, and most of the physiologic information is manipulated, analyzed, and stored in a digital format. Therefore an early step in data collection involves the conversion of analog signals (time-variable voltages or amplitudes) into digital format via an analog-to-digital converter. Once in digital format, the physiologic information can be readily subjected to a variety of analyses. In electrocardiography, the most common analyses, besides rate calculations, are related to the recognition of an arrhythmia and the detection of myocardial ischemia.
Arrhythmias
There is little doubt that during prolonged visual observation of the ECG on the oscilloscope, certain arrhythmias will go undetected. This was clearly demonstrated by Romhilt and colleagues,40 who showed that nurses in coronary care units failed to detect serious ventricular arrhythmias in 84% of their patients. Computers have therefore been designed for the automated detection of arrhythmias in an attempt to increase the detection of abnormal rhythms. Using an early preprocessing algorithm called AZTEC, a computer accurately detected 78% of ventricular ectopic beats. It measured QRS width, offset, amplitude, and area to classify complexes in morphologic families.41 In a prospective evaluation of such a system, it was found that the computer accurately detected 95.4% of ventricular premature beats but only 82.4% of supraventricular premature beats.42 Other systems have depended on QRS recognition and cross-correlation with stored QRS complexes.43 In cross-correlation, each detected QRS complex is compared with a list of previously detected complexes. If a complex does not correlate with a previously stored complex, it is considered to have a new configuration and is added to the list. A number of points of the complex, such as the PR interval and ST segment, are stored as a template for future comparison. Whenever a new complex matches an existing template, it is averaged into that template so that each template represents a running average of all complexes of a particular configuration.44 Each template is defined as normal, abnormal, or questionable according to previously defined criteria. The AHA has published several parameters that need to be tested to permit a meaningful understanding of a system’s values and limitations and to allow a reasonable comparison of systems.21
Myocardial Ischemia
Several computer programs for the online detection of ischemia and analysis of ST segments are now commercially available. Most cardiac monitor algorithms are intentionally set for high sensitivity at the expense of specificity.45 As a result, numerous false alarms occur that must be evaluated by health care professionals so that overtreatment of patients will not occur. Each manufacturer uses a different analysis technique, and not all of the algorithms are in the public domain.
In one system (GE Healthcare, Waukesha, WI), an ST learning phase begins by looking at the first 16 beats, in all leads, for the dominant normal or paced shape. The shapes are correlated via a selected number of points on each of the active, valid lead waveforms. An algorithm looks for leads in the fail or artifact mode to determine the number of valid leads used in the analysis. The algorithm also makes all leads positive to enable the sum of the points on the valid leads to be calculated. This sum is used in determining a peak, or fiducial point, which is used as a point of reference on the QRS complex, and a template is formed from selected points around the fiducial point for each ECG lead. As each beat is analyzed, its template is compared to templates of previous beats. If the templates correlate within 75% of a previously stored shape, a match is declared and the template is classified as an existing shape. If no match is found, the template becomes a new shape. On the seventeenth beat, the dominant QRS shape or paced shape is determined. The algorithm then searches for an additional 16 beats that correlate with the dominant template. With the eighteenth beat, a process called incremental averaging is initiated.
Incremental averaging is a method of tracking positive or negative changes occurring on the waveform. These changes are tracked for each of the valid leads. The changes may be either physiologic, such as ST-segment changes as a result of ischemia, or related to artifact caused by high-frequency noise. The changes are tracked by allowing an adjustment of only 0.1 mm, either positive or negative, from the prior shape of each beat. At the 30-second beat, the products of the incrementally averaged templates become the learned ST templates. Until ST is relearned, all changes in the QRS shape are tracked against this learned template. The isoelectric point and ST points are determined during the learning phase and are based on the width of the QRS shape. The isoelectric point is placed 40 ms before the onset of the QRS, and the ST point is placed 60 ms past the offset of the QRS measurement. The isoelectric point provides the point of reference for determining the measurement of the ST segment.
The technique of incremental averaging is well suited to a continuous input with slow changes. However, it links the heart rate to the speed at which changes occur in the template.46 This system was evaluated intraoperatively in patients undergoing cardiac surgery.43 The device monitored three selected leads and displayed the absolute values of the ST segment as a line. Upward deflection of the trend line indicated worsening ischemia, whereas a downward trend reflected return of the ST segment toward the isoelectric line. The authors concluded that once the device was clinically accepted, the awareness of ischemic changes increased among the participating anesthesiologists, and therapeutic interventions were instituted more rapidly.
Other systems differ from the above in various ways. In the Hewlett-Packard system, a period of 15 seconds is analyzed first, and the ST displacement is determined on five “good’’ beats. These displacements are ranked, and the median value is determined. This eliminates the influence of occasional PVCs and ensures that a representative beat is selected. The objective of this procedure is to obtain a representative beat rather than an average template. The measurement point for the ST segment can be selected as the R wave plus 108 ms (default) or the J point plus 60 or 80 ms. ST values and representative complexes are stored at a resolution of 1 minute for the most recent 30-minute trend and at a resolution of 5 minutes for the preceding 7.5-hour trend.
In a third system (Spacelabs Healthcare), a composite ST-segment waveform is developed every 30 seconds and compared with a reference tracing acquired during an initial learning period. The isoelectric and ST-segment points can be manually adjusted to any location on the ECG tracing, or they can be automatically set to predetermined values.
In 1998, Leung and colleagues47 reported the accuracy of ST trending monitors with that of Holter ECG recorders in detecting ST-segment changes (both analyzed offline) in 94 patients undergoing coronary artery bypass graft surgery. They found the sensitivity of the three ST-trending monitors in detecting ischemia was 75%, 78%, and 60% for Marquette (now GE Healthcare), Hewlett-Packard, and Datex (now GE Healthcare) monitors, respectively. The specificity was 89%, 71%, and 69% relative to the Holter. Compared with the Hewlett-Packard and Datex monitors, the Marquette monitor had the best agreement with the Holter.
In a case report, Brooker and colleagues48 described a case in which continuous automated ST-segment analysis (Component Monitoring System, Merlin Software Revision C, Hewlett-Packard) displayed significant and progressive ST-segment depression in three leads. Simultaneous ECG strip-chart recording failed to demonstrate any changes in the ST segments of the three monitored leads. The authors postulated that the erroneous automated interpretation may have been due to an inaccurate location of the measurement points in the ECG tracing.
To better define the role of QRS morphology on automated ST-segment analysis, London and colleagues49 tested a commercially available ECG monitor (PC2 Bedside Monitor, ECG software version 6.05.16, Spacelabs Healthcare) using an ECG simulator (M311; Fogg System Company, Aurora, CO). Using seven different QRS shapes, they noted subtle errors in placement of the J point for each of the QRS shapes. In two QRS shapes, the isoelectric point was displaced onto the upstroke of an R wave, leading to erroneous ST-segment values (Figs. 13-8 and 13-9). Because each manufacturer uses distinct analysis algorithms, differences in results are expected. London and colleagues suggested that common testing standards be developed. They believe that the factors leading to differences between manufacturers are the location of fiducial points and the number of measurement points being used.
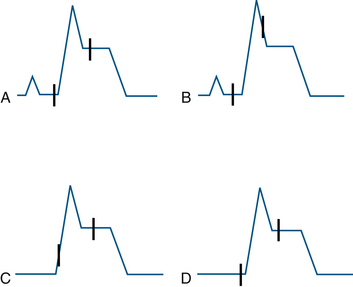
FIGURE 13-8 Schematic representation of isoelectric reference and J-point marker errors in ST-segment elevation templates. The interval between the J point and the isoelectric point is fixed at 115 ms by the algorithm. Two different patterns were noted for each of the two templates. In B, the J point is misplaced onto the downstroke of the R wave; in C, the isoelectric marker is misplaced onto the upstroke of the R wave. A and D demonstrate adequate placement of the points. (From London MJ, Ahlstrom LD: Validation testing of the Spacelabs PC2 ST-segment analyzer, J Cardiothorac Vasc Anesth 1995;9:684-693.)
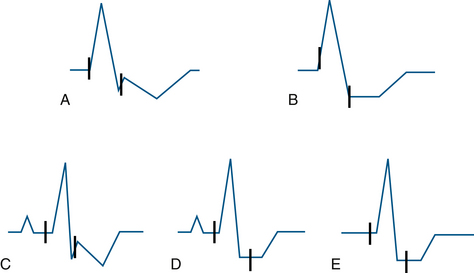
FIGURE 13-9 Schematic representation of isoelectric and J-point errors noted in ST-segment depression templates. A and B represent templates with prolonged QRS duration (120 ms), whereas the C, D, and E show those with normal QRS duration (80 ms). (From London MJ, Ahlstrom LD: Validation testing of the Spacelabs PC2 ST-segment analyzer. J Cardiothorac Vasc Anesth 1995;9:684-693.)
Artifacts mimicking arrhythmias have been reported that can lead to aggressive treatment, which may be unnecessary. Marco and colleagues50 reported that SSEP monitoring caused an artifact that imitated supraventricular tachycardia; they treated the patient with esmolol before realizing that it was an artifact. According to the authors, these artifacts can be explained by partial or complete displacement of the stimulating electrode from the skin or by improper connection between stimulator outputs of the evoked potentials at the different stimulus sites.
Similarly, high-field magnetic resonance imaging (MRI; 1.5 T) in the neurosurgical OR for intraoperative resection control and functional neuronavigational guidance has been reported to cause artifacts.51 Even MRI-compatible ECG monitoring interferes with electromagnetic fields, so several ECG artifacts can be observed in static and pulsed magnetic fields that can imitate malignant arrhythmias or provoke ST-segment abnormalities. The knowledge of possible and characteristic ECG artifacts during high-field MRI is therefore essential to prevent misinterpretation. When interference makes ECG monitoring difficult, interference-free parameters, such as pulse oximetry or invasive blood pressure curves, can be used for monitoring during intraoperative MRI scans. Others investigators have reported ECG monitoring artifacts inducing pacemaker-driven tachycardia both intraoperatively and in the recovery room.52,53
Cleland and colleagues54 reported ECG pacemaker “pseudo-spikes” from RF interference in a patient in the postanesthesia care unit. The ECG artifact resulted in a misdiagnosis of pacemaker malfunction.
ElectrocardiograPHIC Monitoring During Magnetic Resonance Imaging
Conventional ECG monitoring is not possible during MRI because the lead wires must traverse magnetic fields, which causes distortion of the electrical signal. The need for wires can be eliminated by use of a telemetric ECG.55 Fiberoptic technology for transmission of ECG signals has become commercially available in MRI-compatible monitoring systems (Veris, Warday Premise, Surrey, UK). The system provides five-lead ECG waveform monitoring and is compatible with 1.5T and 3T MRI systems. Other ECG monitors (Invivo, Gainesville, FL) use wireless technology and 8-hour battery capacity, thus eliminating the need for placement of the ECG monitor in the MRI suite. Digital signal processing and filtering removes MRI-related artifact during all MRI procedures to provide enhanced ECG performance and gating. The proprietary digital cardiac and peripheral gating algorithms ensure the best possible MR image quality.
In addition to ECG signals, capillary blood flow in the earlobe or lip measured by a laser Doppler system can be transmitted using fiberoptics.56 With either transmission system, ECG artifacts are common with rapid pulse rates from the scanner.
The ECG should be monitored in all patients undergoing regional or general anesthesia. Although it does not provide information on the heart’s mechanical function, it allows detection of electrical disturbances that can profoundly affect cardiac function. Today, with the judicious use of selected lead combinations, most arrhythmias and ischemic events can be precisely diagnosed intraoperatively. This diagnostic activity is time consuming, however, and considerable evidence suggests that many intraoperative ECG changes go undetected. There is little doubt that future technologic developments will facilitate the intraoperative recognition of ECG disturbances and lead to better patient outcomes.
References
1. Thys D.M., Kaplan J.A., eds. The ECG in anesthesia and critical care. New York: Churchill Livingstone, 1987.
2. American Society of Anesthesiologists: Standards for basic anesthetic monitoring, Park Ridge, IL, American Society of Anesthesiologists.
3. Skeehan T.M., Thys D.M. Monitoring the cardiac surgical patient. In: Hensley F.A., Martin D.E., eds. The practice of cardiac anesthesia. Boston: Little, Brown, 1990.
4. Shanewise J.S. How to reliably detect ischemia in the intensive care unit and operating room. Semin Cardiothorac Vasc Anesth. 2006;10:101–109.
5. Goldberger. Clinical electrocardiography: a simplified approach, ed 7. St. Louis: Mosby; 2006. pp 8, 16
6. Griffin R.M., Kaplan J.A. Myocardial ischaemia during noncardiac surgery: a comparison of different lead systems using computerized ST-segment analysis. Anaesthesia. 1987;42:155–159.
7. Bazaral M.G., Norfleet E.A. Comparison of CB5 and V5 leads for intraoperative electrocardiographic monitoring. Anesth Analg. 1981;60:849–853.
8. Hollenberg M., Mateo G., Massie B.M., et al. Influence of the R-wave amplitude on exercise-induced ST depression: need for a “gain factor” correction when interpreting a stress electrocardiogram. Am J Cardiol. 1985;56:13–17.
9. Kaplan J.A., King S.B. The precordial electrocardiographic lead (V5) in patients who have coronary artery disease. Anesthesiology. 1976;45:570.
10. London M.J., Hollenberg M., Wong M.G., et al. Intraoperative myocardial ischemia: localization by continuous 12 lead electrocardiography. Anesthesiology. 1988;69:232–241.
11. Landesberg G., Mosseri M., Wolf Y., et al. Perioperative myocardial ischemia and infarction: identification by continuous 12-lead with on-line ST-segment monitoring. Anesthesiology. 2002;96(2):259–261.
12. London M.J. Multilead precordial ST-segment monitoring: “the next generation”? Anesthesiology. 2002;96(2):259–261.
13. Kates R.A., Zaidan J.R., Kaplan J.A. Esophageal lead for intraoperative electrocardiographic monitoring. Anesth Analg. 1982;61:781.
14. Jain U. Wave recognition and use of the intraoperative unipolar esophageal electrocardiogram. J Clin Anesth. 1997;9(6):487–492.
15. Colley P.S., Artru A.A. ECG-guided placement of Sorenson CVP catheters via arm veins. Anesth Analg. 1984;63:953–956.
16. Madias J.E. Intracardiac electrocardiographic lead: a historical perspective. J Electrocardiology. 2004;37:83–88.
17. Chatterjee K., Swan H.J.C., Ganz W., et al. Use of a balloon-tipped flotation electrode catheter for cardiac monitoring. Am J Cardiol. 1975;36:56.
18. Lichtenthal P.R. Multipurpose pulmonary artery catheter. Ann Thorac Surg. 1983;36:493.
19. Benzadon M.N., Ortega D.F., Thierer J.M., et al. Comparison of the amplitude of the P-wave from intracardiac electrocardiogram obtained by means of a central venous catheter filled with saline solution to that obtained via esophageal electrocardiogram. Am J Cardiol. 2006;98(7):978–981.
20. Hayes J.K., Peters J.L., Smith K.W., et al. Monitoring normal and aberrant electrocadiographic activity from an endotracheal tube: comparison of the surface, esophageal, and tracheal electrocardiograms. J Clin Monit. 1994;10:81–90.
21. Mirvis D.M., Berson A.S., Goldberger A.L., et al. Instrumentation and practice standards for electrocardiographic monitoring in special care units. Circulation. 1989;79:464–471.
22. Pipberger H.V., Arzbaecher R.L., Berson A.S., et al. Recommendations for standardization of leads and of specifications for instruments in electrocardiography and vectorcardiography. Report of the Committee on Electrocardiography, American Heart Association. Circulation. 1975;52:11–31.
23. Sheffield L.T., Berson A.S., Bragg-Remschel D., et al. Recommendations for standards of instrumentation and practice in the use of ambulatory electrocardiography. The task force of the Committee on Electrocardiography and Cardiac Electrophysiology of the Council on Clinical Cardiology. Circulation. 1985;71:626A–636A.
24. Association for the Advancement of Medical Instrumentation (AAMI). American National Standards for Disposable Electrodes: ANSI/AAMI EC12: 2000(R 2010). Arlington, VA: American National Standards Institute/AAMI; 1984.
25. Legatt A.D., Frost E.A.M. ECG artifacts during intraoperative evoked potential monitoring. Anesthesiology. 1989;70:559–560.
26. Paulsen A.W., Pritchard D.G. ECG artifact produced by crystalloid administration through blood/fluid warmer sets. Anesthesiology. 1988;69:803–804.
27. Lampert B.A., Sundstrom F.D. ECG artifacts simulating supraventricular tachycardia during automated percutaneous lumbar discectomy. Anesth Analg. 1988;67:1096–1098.
28. Arbeit S.R., Rubin I.L., Gross H. Dangers in interpreting the electrocardiogram from the oscilloscope monitor. JAMA. 1970;211:453–456.
29. Slogoff S., Keats A.S., David Y., et al. Incidence of perioperative myocardial ischemia detected by different electrocardiographic systems. Anesthesiology. 1990;73:1074–1081.
30. Atlee J.L., Rusy B.F. Ventricular conduction times and AV nodal conductivity during enflurane anesthesia in dogs. Anesthesiology. 1977;47:498.
31. Edwards R., Winnie A.P., Ramamurthy S. Acute hypocapneic hypokalemia: an iatrogenic anesthetic complication. Anesth Analg. 1977;56:786–792.
32. Angelini L., Feldman M.I., Lufschonowski R., et al. Cardiac arrhythmias during and after heart surgery: diagnosis and management. Prog Cardiovasc Dis. 1974;16:469.
33. Sonntag H., Larsen R., Hilfiker O., et al. Myocardial blood flow and oxygen consumption during high-dose fentanyl anesthesia in patients with coronary artery disease. Anesthesiology. 1982;56:416–422.
34. Coriat P., Harari A., Daloz M., et al. Clinical predictors of intraoperative myocardial ischemia in patients with coronary artery disease undergoing non-cardiac surgery. Acta Anaesthesiol Scand. 1982;26:287.
35. Coy K.M., Imperi G.A., Lambert C.R., et al. Silent myocardial ischemia during daily activities in asymptomatic men with positive exercise response. Am J Cardiol. 1987;59:45–49.
36. Pepine C.J. Is silent ischemia a treatable risk factor in patients with angina pectoris? Circulation. 1990;82(Suppl II):135–142.
37. Chaitman B.R., Hanson J.S. Comparative sensitivity and specificity of exercise electrocardiographic lead systems. Am J Cardiol. 1981;47:1335–1349.
38. Bell C., Rimar S., Barash P. Intraoperative ST segment changes consistent with myocardial ischemia in the neonate: a report of three cases. Anesthesiology. 1989;71:601–604.
39. Dodds T.M., Delphin E., Stone J.G., et al. Detection of perioperative myocardial ischemia using Holter with real-time ST segment analysis. Anesth Analg. 1988;67:890–893.
40. Romhilt D.W., Bloomfield S.S., Chai T.C., et al. Unreliability of conventional electrocardiographic monitoring of arrhythmia detection in coronary care units. Am J Cardiol. 1973;31:457.
41. Oliver G.E., Nolle F.M., Wolff G.A., et al. Detection of premature ventricular contractions with a clinical system for monitoring electrocardiographic rhythms. Comput Biomed Res. 1971;4:523.
42. Shah P.M., Arnold J.M., Haberen N.A., et al. Automatic real-time arrhythmia monitoring in the intensive coronary care unit. Am J Cardiol. 1977;39:701.
43. Kotter G.S., Kotrly K.J., Kalbfleisch J.H., et al. Myocardial ischemia during cardiovascular surgery as detected by an ST-segment trend monitoring system. J Cardiothorac Vasc Anesth. 1987;1:190–199.
44. Morganroth J. Ambulatory Holter electrocardiography: choice of technique and clinical uses. Ann Intern Med. 1985;102:73.
45. Drew B.J., Robert M., Funk M., et al. Practice Standards for Electrocardiographic Monitoring in Hospital Settings: An American Heart Association Scientific Statement from the Councils on Cardiovascular Nursing, Clinical Cardiology, and Cardiovascular Disease in the Young. Circulation. 2004;110(17):2721–2746.
46. London M.J. Monitoring for myocardial ischemia. In: Kaplan J.A., ed. Vascular anesthesia. New York: Churchill Livingstone, 1991.
47. Leung J.M., Voskanian A., Bellows W.H., Pastor D. Automated electrocardiograph ST-segment trending monitors: accuracy in detecting myocardial ischemia. Anesth Analg. 1998;87:4–10.
48. Brooker S., Lowenstein E. Spurious ST segment depression by automated ST segment analysis. J Clin Monit. 1995;11:186.
49. London M.J., Ahlstrom L.D. Validation testing of the Spacelabs PC2 ST-segment analyzer. J Cardiothorac Vasc Anesth. 1995;9:684–693.
50. Marco A.P., Rice K. Pseudoarrythmia from evoked potential monitoring. J Neurosurg Anesthesiol. 2001;13(2):143–145.
51. Birkholz T., Schmid M., Nimsky C., et al. ECG artifacts during intraoperative high-field MRI scanning. J Neurosurg Anesthesiol. 2004;16(4):271–276.
52. Southorn P.A., Kamath G.S., Vasdev G.M., Hayes D.L. Monitoring equipment induced tachycardia in patients with minute ventilation rate responsive pacemakers. Br J Anaesth. 2000;84(4):508–509.
53. Hu R., Cowie D.A. Pacemaker-driven tachycardia induced by electrocardiograph monitoring in the recovery room. Anaesth Intensive Care. 2006;34(2):266–268.
54. Cleland M.J., Crosby E.T. Electrocardiographic “pacemaker pseudo-spikes” and radio frequency interference. Can J Anaesth. 1997;44(7):751–756.
55. Roth J.L., Nugent M., Gray J.E., et al. Patient monitoring during magnetic resonance imaging. Anesthesiology. 1985;62:80–83.
56. Higgins C.B., Lanzer P., Stark D., et al. Imaging by nuclear magnetic resonance in patients with chronic ischemic heart disease. Circulation. 1984;69:523–531.