Chapter 10
Endocrinology
I. Websites
Children with Diabetes (www.childrenwithdiabetes.com)
American Diabetes Association (www.diabetes.org)
International Society for Pediatric and Adolescent Diabetes (www.ispad.org)
Pediatric Endocrine Society (www.lwpes.org)
II. Diabetes
1. Diagnostic criteria (must meet 1 of 4):
a. Symptoms for diabetes (polyuria, polydipsia, or weight loss) and random blood glucose ≥ 200 mg/dL
b. Fasting blood glucose (FPG = no caloric intake for at least 8 hours) ≥ 126 mg/dL∗
c. Oral glucose tolerance test (OGTT) with a 2-hour postload blood glucose ≥ 200 mg/dL∗
d. Hemoglobin A1c(HbA1c) ≥ 6.5%
2. Defining increased risk: FPG 100–125, 2-hour post OGTT 140–199, HbA1c 5.7%–6.4%†
3. Interpreting HbA1c: Estimates average blood glucose for the past 3 months; 6% approximately equals an average of 130 mg/dL, each additional 1% ≈ 30 mg/dL more
4. Oral glucose tolerance test:
a. Pretest preparation:
(1) Calorically adequate diet required for 3 days before the test, with 50% of total calories taken as carbohydrate.
(2) Delay test 2 weeks after illness.
(3) Discontinue all hyperglycemic and hypoglycemic agents (e.g., salicylates, diuretics, oral contraceptives, phenytoin).
c. Interpretation: 2-hour blood glucose < 140 mg/dL = normal; 140–199 mg/dL = impaired glucose tolerance; ≥200 mg/dL = diabetes mellitus (DM).
1. Type I or type II (most common types, polygenic):
a. Patient characteristics (Table 10-1)
b. Laboratory characteristics:
(1) Islet cell autoantibodies: (GAD-65, insulin, islet cell antibodies) suggestive of type 1. However, ≈15% of children with type 1 diabetes will not have autoantibodies to a specific islet cell antigen and ≈5% will not have any detectable islet cell autoantibodies.
NOTE: Some children with type 2 diabetes will have measurable islet cell autoantibodies.
(2) Ketoacidosis: Usually associated with type 1 but does not exclude type 2 (see Sections C and D). Recurrent ketosis, especially diabetic ketoacidosis (DKA), in a type 2 patient should prompt reevaluation of classification.
(3) C-peptide: In a type 1 patient, a measurable level >2 years after diagnosis should prompt reevaluation of classification.
(4) Insulin and C-peptide: Often unhelpful in initial classification. At presentation, levels usually low in type 1, but there is significant overlap with type 2.
a. Monogenic diabetes: 1%–2% of DM cases. Due to single-gene mutations, typically relating to insulin production or release. Identifying the gene can have clinical significance.
b. Maturity-onset diabetes of youth (MODY):
(1) Suspect if autosomal dominant inhertance pattern of early-onset (<25 years) diabetes, insulin independence, absent diabetes mellitus type 2 (DM2) phenotype (nonobese), preservation of C-peptide.
(2) Six well-described subtypes: MODY1 and MODY3, which are due to mutations in transcription factors for insulin production, are responsive to sulfonylureas.
TABLE 10-1
CHARACTERISTICS SUGGESTIVE OF TYPE 1 VS. TYPE 2 DIABETES AT PRESENTATION
| Characteristic | Type 1 | Type 2 |
| Onset | Usually prepuberty | Usually postpuberty |
| Polydipsia and polyuria | Present for days to weeks | Absent or present for weeks to months |
| Ethnicity | Caucasian | African American, Hispanic, Asian, Native American |
| Weight | Weight loss | Obese |
| Other physical findings | Acanthosis nigricans | |
| Family history | Autoimmune diseases | Type 2 diabetes |
| Ketoacidosis | More common | Less common |
c. Neonatal diabetes (NDM):
(1) Defined as DM onset < 6 months of age
(2) Rare: 1:160000–260000 lives births, typically a de novo mutation
(3) May be transient (50% recur) or permanent
(4) Subset respond to sulfonylureas
d. Other causes of DM: Diseases of exocrine pancrease due to pancreatitis, trauma, infection, invasive disease (cystic fibrosis [CF], hemochromatosis). Can also be drug or chemically induced.
1. Definition: Hyperglycemia, ketonemia, ketonuria, and metabolic acidosis (pH < 7.30, bicarbonate < 15 mEq/L)
2. Assessment:
a. History: In suspected diabetic, determine whether there is a history of polydipsia, polyuria, polyphagia, weight loss, vomiting, or abdominal pain, as well as history of infection or inciting event. In a known diabetic, also determine the usual insulin regimen, timing and amount of last dose.
b. Examination: Assess for dehydration, Kussmaul respirations, fruity breath, change in mental status, and current weight.
c. Laboratory tests: See Fig. 10-1. Also consider HbA1c to assess for chronic hyperglycemia (normal values are 4.5%–5.9%). In a new-onset diabetic, consider islet cell antibodies, insulin antibodies, thyroid antibodies, thyroid function tests, and celiac screen (endomesial antibody or tissue transglutaminase and total immunoglobulin [Ig]A).
3. Management: See Fig. 10-1. Because fluid and electrolyte requirements of patients in DKA vary greatly, the following guidelines are a starting point; therapy must be individualized based on patient dynamics.
a. Acidosis: pH is an indicator of insulin deficiency; if acidosis is not resolving, patient may need more insulin. NOTE: Initial insulin administration may cause transient worsening of acidosis as potassium is driven into cells in exchange for hydrogen ions.
b. Hyperglycemia: Blood glucose is an indicator of hydration status.
4. Cerebral edema: Most severe complication of DKA. Overly aggressive hydration and rapid correction of hyperglycemia may play a role in its development.
5. Insulin requirements: Once DKA is resolved, patient will need to be started on a regimen of subcutaneous (SQ) insulin. See Table 10-2 for calculations (also see Table 10-3). Insulin doses are subsequently adjusted based on actual blood sugars. Initially check blood sugars before meals (QAC), at bedtime (QHS), and at 2 AM.
1. Prevalence: Increasing among children, especially among African Americans, Hispanics, and Native Americans. Increase is related to increased prevalence of childhood obesity.
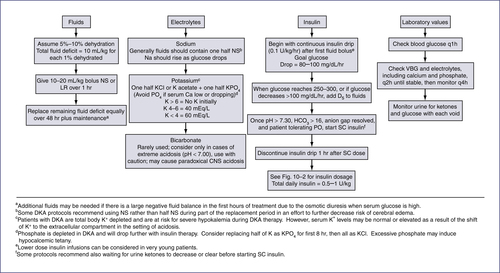
TABLE 10-2
| Insulin | Dose Calculation | Sample Calculation for 24-kg child | Dose | |
| Total daily dose | 0.5–1 unit/kg/day | 0.75 x 24 = 18 units/day | 18 units | |
| Basal | Glargine | 1/2 daily total | 1/2 18 units = 9 | 9 units |
| OR | ||||
| Detemir | 1/2 daily total ÷ BID | |||
| Carbohydrate coverage ratio | Lispro, aspart | 450 ÷ daily total | 450 ÷ 18 = 25 | 1 unit: 25 g carbohydrate |
| OR | ||||
| Regular | 500 ÷ daily total | |||
| Correction factor | Lispro, aspart | 1800 ÷ daily total | 1800 ÷ 18 = 100 | 1 unit: 100 mg/dL > 120 |
| OR | ||||
| Regular | 1500 ÷ daily total |
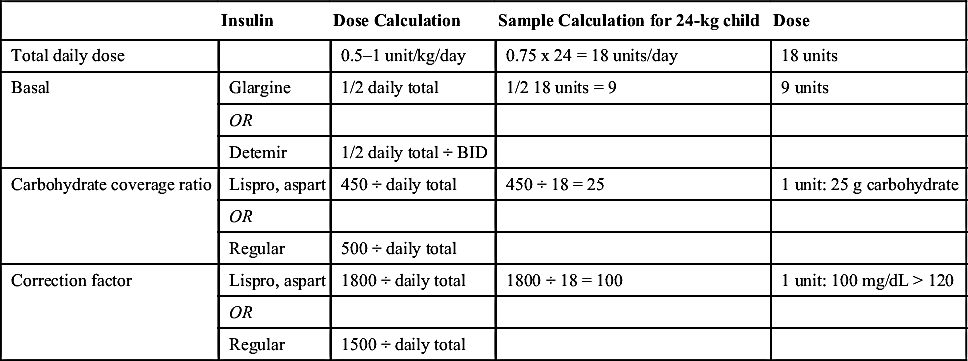
TABLE 10-3
CURRENTLY AVAILABLE INSULIN PRODUCTS
| Insulin∗ | Onset | Peak | Effective Duration |
| Rapid acting Lispro (Humalog) Aspart (Novo Log) Glulisine (Apidra) | 5–15 min | 30–90 min | 5 hr |
| Short Acting Regular U100 Regular U500 (concentrated) | 30–60 min | 2–3 hr | 5–8 hr |
| Intermediate acting Isophane insulin (NPH, Humulin N/Novolin N) | 2–4 hr | 4–10 hr | 10–16 hr |
| Long acting Glargine (Lantus) Detemir (Levemir) | 2–4 hr† Slow | No peak 6–8 hr | 20–24 hr 6–24 hr (dose related) |
| Premixed 70% NPH/30% regular (Humulin 70/30) 75% NPL/25% lispro (Humalog Mix 75/25) 50% NPL/50% lispro (Humalog Mix 50/50) 70% NPA/30% aspart (Novo Log Mix 70/30) | 30–60 min 5–15 min 5–15 min 5–15 min | Dual | 10-16 hr |
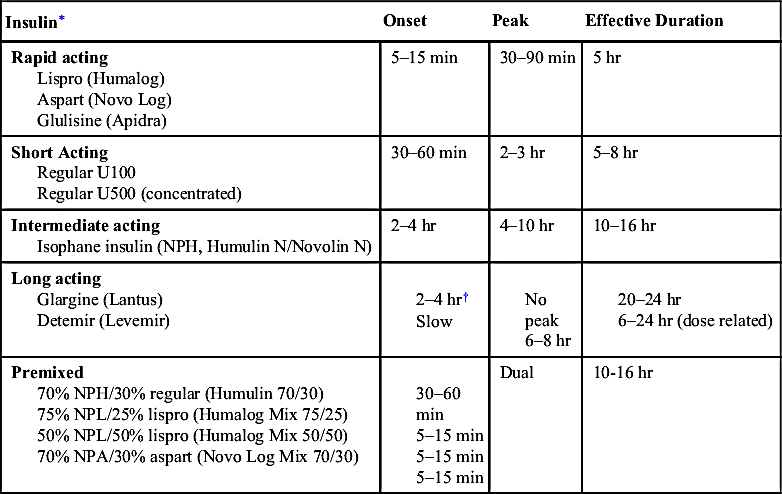
NPA, Insulin aspart protamine (neutral protamine aspart); NPH, neutral protamine Hagedom; NPL, insulin.
∗ Assuming 0.1–0.2 U/kg per injection. Onset and duration vary significantly by injection site.
† Time to steady state.
Modified from American Diabetes Association. Practical Insulin: A Handbook for Prescribing Providers, 2nd ed. Alexandria, Va: American Diabetes Association, 2007.
3. Presentation: Although not typical, can present in ketoacidosis (chronic high glucose impairs β-cell function and increases peripheral insulin resistance).
4. Screening:
a. Consider screening by measuring fasting blood glucose levels in children who are overweight (body mass index > 85th percentile for age and gender) and have two of the following risk factors:
(1) Family history of type 2 DM in a first- or second-degree relative
(2) Race/ethnicity: African American, Native American, Hispanic, or Asian or Pacific Islander
(3) Signs associated with insulin resistance (acanthosis nigricans, hypertension, dyslipidemia, polycystic ovarian disease)
b. Begin at age 10 years or onset of puberty (whichever occurs first), and repeat every 2 years.
c. Based on adult data, HbA1c may be used as a screening tool: HbA1c = 5.7%–6.4% indicates increased risk of future diabetes; 6.0%–6.5% is abnormal and indicates need for further testing (OGTT, fasting plasma glucose); >6.5% is diagnostic of diabetes.
5. Treatment: See Fig. 10-2.
E. Monitoring
1. Glucose control: Daily blood glucoses; HbA1c level every 3 months
2. Other involved organ systems: Annual eye examinations and regular screening for hypertension, proteinuria, and hyperlipidemia (monitor Q2 yr with goals of low-density lipoprotein [LDL] < 100 mg/dL, high-density [HDL] > 35 mg/dL, triglycerides [TGs] < 150 mg/dL)
III. Thyroid Function11-13
1. Interpretation of thyroid function tests (Table 10-4): See reference values for age (Table 10-5). Remember that preterm infants have different ranges (Table 10-6).
2. Thyroid scan: Used to study thyroid structure and function. Localizes ectopic thyroid tissue and hyperfunctioning and nonfunctioning thyroid nodules.
3. Technetium uptake: Measures uptake of technetium by thyroid gland. Levels are increased in Grave's disease and decreased in Hashitoxicosis and hypothyroidism (except dyshormonogenesis, when levels may be increased).
B. Hypothyroidism (Table 10-7)
1. Can be congenital or acquired. See Table 10-7 for characteristics and types of hypothyroidism.
2. Hypothyroidism and obesity16: Moderate elevations in thyroid-stimulating hormone (TSH [4–10 mIU/L]), with normal or slightly elevated triiodothyronine (T3) and thyroxine (T4) are seen in 10%–23% of obese children and adolescents. In these individuals, there does not appear to be a benefit to treating with thyroxine. Values tend to normalize with weight loss, suggesting they are the result, rather than the cause, of obesity in these individuals. Could consider testing for thyroid antibodies to further clarify whether there is true thyroid dysfunction.
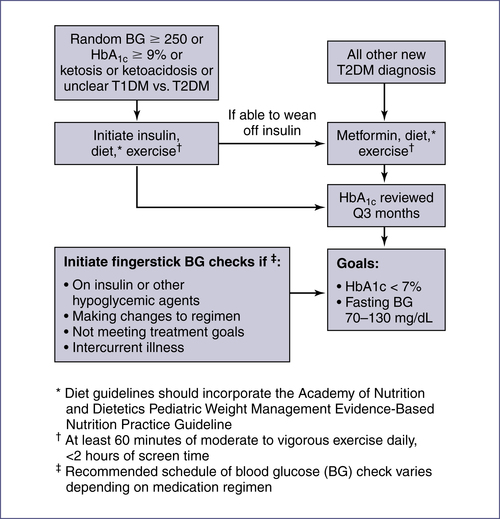
TABLE 10-4
THYROID FUNCTION TESTS: INTERPRETATION
| Disorder | TSH | T4 | Free T4 |
| Primary hyperthyroidism | L | H | High N to H |
| Primary hypothyroidism | H | L | L |
| Hypothalamic/pituitary hypothyroidism | L, N, H∗ | L | L |
| TBG deficiency | N | L | N |
| Euthyroid sick syndrome | L, N, H∗ | L | L to low N |
| TSH adenoma or pituitary resistance | N to H | H | H |
| Compensated hypothyroidism† | H | N | N |
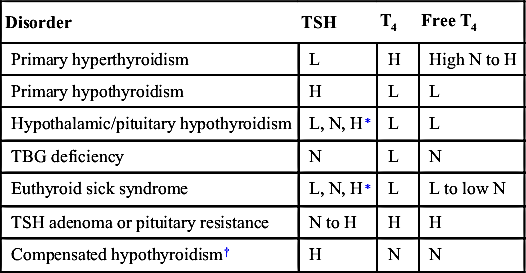
H, High; L, low; N, normal; T4, thyroxine; TBG, thyroxine-binding globulin; TSH, thyroid-stimulating hormone.
∗ Can be normal, low, or slightly high.
† Treatment may not be necessary.
TABLE 10-5
AGE-BASED NORMAL VALUES FOR ROUTINE THYROID FUNCTION TESTS14
| Age | Free T4 (ng/dL) | TSH (mIU/L) | T4 (mcg/dL) | T3 (ng/dL) | Reverse T3 (ng/dL) | TBG (mcg/mL) |
| Day of birth | 0.94–4.39 | 2.43–24.3 | 5.85–18.68 | 19.53–266.26 | 19.53–358.70 | 19.17–44.7 |
| 1 wk | 0.96–4.08 | 0.58–5.58∗ | 5.90–18.58 | 20.83–265.61 | 19.53–338.52 | 19.16–44.68 |
| 1 mo | 1.00–3.44 | 0.58–5.57∗ | 6.06–18.27 | 25.39–264.31 | 19.53–283.84 | 19.12–44.59 |
| 3 mo | 1.04–2.86 | 0.58–5.57∗ | 6.39–17.66 | 36.46–259.75 | 19.53–197.90 | 19.02–44.35 |
| 6 mo | 1.07–2.44 | 0.58–5.56∗ | 6.75–17.04 | 51.43–252.59 | 19.53–137.36 | 18.87–44 |
| 1 yr | 1.10–2.19 | 0.57–5.54 | 7.10–16.16 | 74.87–240.87 | 18.23–85.93 | 18.56–43.28 |
| 2 yr | 1.11–2.05 | 0.57–5.51 | 7.16–14.98 | 103.51–228.50 | 16.93–55.99 | 17.94–41.82 |
| 5 yr | 1.08–1.93 | 0.56–5.41 | 6.39–12.94 | 131.50–212.23 | 13.02–35.81 | 16–37.3 |
| 8 yr | 1.04–1.87 | 0.55–5.31 | 5.72–11.71 | 130.85–202.46 | 11.72–30.60 | 14.2–33.09 |
| 12 yr | 0.99–1.81 | 0.53–5.16 | 5.08–10.58 | 119.78–192.70 | 11.07–27.99 | 12.54–29.24 |
| 15 yr | 1.03–1.77 | 0.52–5.05 | 4.84–10.13 | 110.02–184.88 | 10.42–27.34 | 11.96–27.89 |
| 18 yr | 0.93–1.73 | 0.51–4.93 | 101.56–179.03 | 10.42–26.04 |
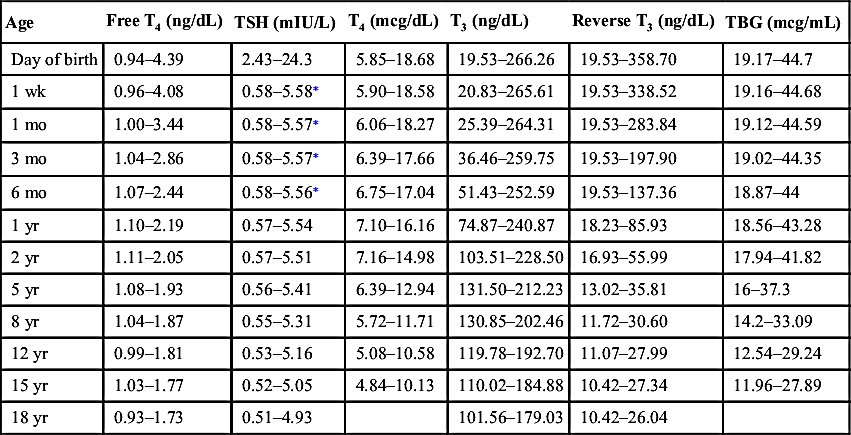
T3, Triiodothyronine; T4, thyroxine; TBG, thyroxine-binding globulin; TSH, thyroid-stimulating hormone.
NOTE: If age-specific reference ranges are provided by the laboratory running the assay, please refer to those ranges.
∗ Some labs report the reference range upper limit for TSH for children up to 12 months of age as 8.35 mU/L.
The above ranges are modified from Lem AJ, de Rijke YB, van Toor H, et al. Serum thyroid hormone levels in healthy children from birth to adulthood and in short children born small for gestational age. J Clin Endocrinol Metab. 2012;97:3170-3178.
TABLE 10-6
MEAN TSH AND T4 OF PRETERM AND TERM INFANTS 0–28 DAYS15
| Age ± SD | Cord (Day 0) | Day 7 | Day 14 | Day 28 |
| T4 (mcg/dL) | ||||
| 23–27∗ | 5.44 ± 2.02 | 4.04 ± 1.79 | 4.74 ± 2.56 | 6.14 ± 2.33 |
| 28–30 | 6.29 ± 2.02 | 6.29 ± 2.10 | 6.60 ± 2.25 | 7.46 ± 2.33 |
| 31–34 | 7.61 ± 2.25 | 9.40 ± 3.42 | 9.09 ± 3.57 | 8.94 ± 2.95 |
| >37 | 9.17 ± 1.94 | 12.67 ± 2.87 | 10.72 ± 1.40 | 9.71 ± 2.18 |
| fT4 (ng/dL) | ||||
| 23–27 | 1.28 ± 0.41 | 1.47 ± 0.56 | 1.45 ± 0.51 | 1.50 ± 0.43 |
| 28–30 | 1.45 ± 0.43 | 1.82 ± 0.66 | 1.65 ± 0.44 | 1.71 ± 0.43 |
| 31–34 | 1.49 ± 0.33 | 2.14 ± 0.57 | 1.96 ± 0.43 | 1.88 ± 0.46 |
| >37 | 1.41 ± 0.39 | 2.70 ± 0.57 | 2.03 ± 0.28 | 1.65 ± 0.34 |
| TSH (mIU/L) | ||||
| 23–27 | 6.80 ± 2.90 | 3.50 ± 2.60 | 3.90 ± 2.70 | 3.80 ± 4.70 |
| 28–30 | 7.00 ± 3.70 | 3.60 ± 2.50 | 4.90 ± 11.2 | 3.60 ± 2.50 |
| 31–34 | 7.90 ± 5.20 | 3.60 ± 4.80 | 3.80 ± 9.30 | 3.50 ± 3.40 |
| >37 | 6.70 ± 4.80 | 2.60 ± 1.80 | 2.50 ± 2.00 | 1.80 ± 0.90 |
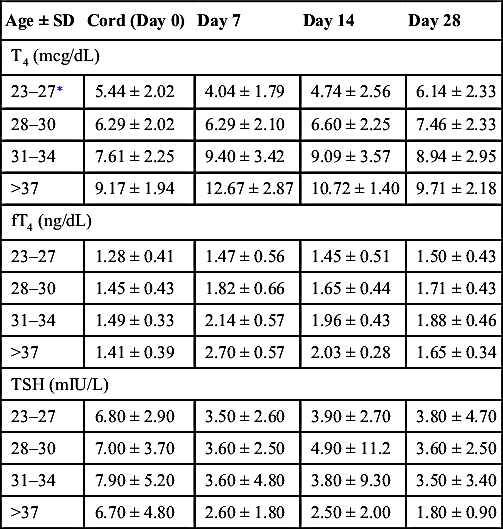
FT4, Free thyroxine; T4, thyroxine; TSH, thyroid-stimulating hormone.
∗ Weeks gestational age.
Data modified from Williams FL, Simpson J, Delahunty C, et al. Collaboration from The Scottish Preterm Thyroid Group: Developmental trends in cord and postpartum serum thyroid hormones in preterm infants. J Clin Endocrinol Metab. 2004;89:5314-5320.
TABLE 10-7
| Disease and Clinical Symptoms | Onset | Etiology | Management | Follow-up |
| Primary/Congenital | ||||
| Large fontanelles, lethargy, constipation, hoarse cry, hypotonia, hypothermia, jaundice | Symptoms usually develop within first 2 weeks of life; almost always present by 6 weeks. Some infants may be relatively asymptomatic if the cause is other than absence of the thyroid gland. Treated patients are still at risk for developmental delay. | Primary hypothyroidism: Most common cause is defect of fetal thyroid development. Other causes include TSH receptor mutation or thyroid dyshormonogenesis. OR Central hypothyroidism: Deficiency of thyrotropin-releasing hormone (TRH)or thyrotropin (TSH). | Goal is to achieve T4 in the upper half of normal range. In primary hypothyroidism, TSH should be kept <5. A minority of infants maintain persistently high TSH despite correction of T4. Replacement with L-thyroxine as soon as diagnosis is confirmed. | Monitor T4 and TSH at the end of weeks 1 and 2 of therapy and 3–4 weeks after any dose change. If levels are adequate, follow every 1–3 months during the first 12 months. |
| Acquired | ||||
| Growth deceleration; other signs may include coarse, brittle hair, dry, scaly skin, delayed tooth eruption, cold intolerance | Can occur as early as the first 2 years of life. | Hashimoto thyroiditis (diagnosis supported by presence of antithyroglobulin or antimicrosomal antibodies). Head/neck radiation. Central hypothyroidism (pituitary/hypothalamic insult). | Replacement with L-thyroxine. | As for primary/congenital. After 2 years, monitor levels every 6–12 months as dose changes become less frequent. |
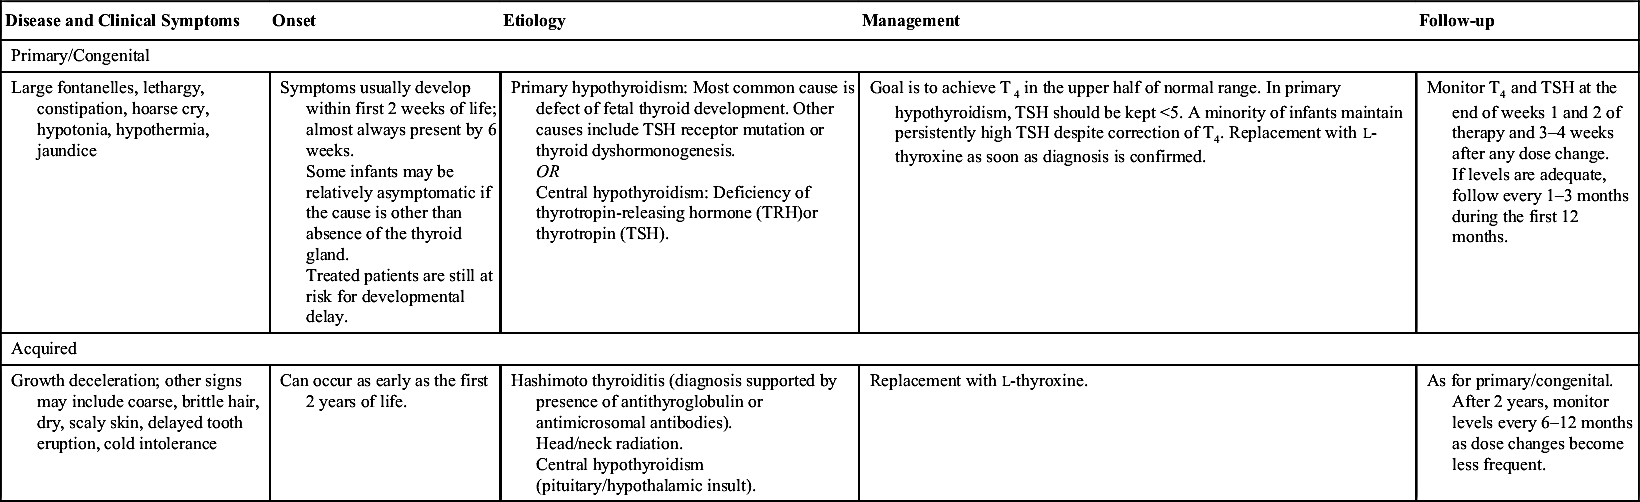
NOTE: Thyroid hormone levels in premature infants are lower than those seen in full-term infants. Further, the TSH surge seen at approximately 24 hours of age in full-term babies does not appear in preterm infants. In this population, lower levels are associated with increased illness, but the effect of replacement therapy remains controversial.
L-thyroxine, Levothyroxine; TSH, thyroid-stimulating hormone.
3. Newborn screening for hypothyroidism13,17: Mandated in all 50 states. Measures a combination of TSH and T4, based on the particular state's algorithm; 1:25 abnormal tests are confirmed. Congenital hypothyroidism has prevalance of 1:3000–4000 U.S. infants. If abnormal results are found, clinicians should follow recommendations of American College of Medical Genetics—ACT sheets and Algorithm for confirmation testing. See Chapter 13 for further resources on newborn screening.
NOTE: Because of the risk of inducing adrenal crisis if adrenocorticotropic hormone (ACTH) deficiency is present, do not begin treatment of central hypothyroidism until normal ACTH/cortisol functionis documented.
C. Hyperthyroidism
1. General:
a. Symptoms: Hyperactivity, irritability, altered mood, insomnia, heat intolerance, increased sweating, pruritus, tachycardia, palpitations, fatigue, weakness, weight loss despite increased appetite (or weight gain), increased stool frequency, oligomenorrhea or amenorrhea, fine tremor, hyperreflexia, hair loss.
b. Epidemiology: Prevalence increases with age, beginning in adolescence; 4:1 female-to-male predominance.
c. Etiology: Most common cause in childhood is Graves disease (see later). Other causes: Subacute thyroiditis, factitious hyperthyroidism (intake of exogenous hormone), TSH-secreting pituitary tumor (rare). Pituitary resistance to thyroid hormone (compensatory rise in T4, but TSH remains within normal range).
d. Laboratory findings: ↑ T4, ↑ T3, usually ↓ TSH. Further tests include TSH receptor–stimulating antibody, thyroid-stimulating immunoglobulin (TSI), antithyroglobulin and antimicrosomal antibodies, free T4, and free T3.
2. Graves disease:
a. Physical examination: Diffuse goiter, a feeling of grittiness and discomfort in the eye, retrobulbar pressure or pain, eyelid lag or retraction, periorbital edema, chemosis, scleral injection, exophthalmos, extraocular muscle dysfunction, localized dermopathy, and lymphoid hyperplasia.
b. Epidemiology: Peak incidence, age 11–15 years; 5:1 female-to-male ratio. Family history of autoimmune thyroid disease.
c. Etiology: Autoimmune (positive TSI; may also have low titers of thyroglobulin ± microsomal antibodies).
d. Laboratory findings: ↑ T4, ↑ T3, ↓ TSH (↑ iodine 123 [123I] uptake distinguishes from Hashimoto thyroiditis).
e. Treatment and monitoring: Methimazole (inhibits formation of thyroid hormone). Propylthiouracil (PTU) should not be used as first-line treatment in children, owing to higher risk of liver dysfunction than with methimazole. PTU can be considered for those with mild reactions to methimazole. Radioactive iodine (131I) or surgical thyroidectomy are options for initial treatment or refractory cases. Follow symptoms and T4 and TSH levels.
3. Hashimoto thyroiditis:
a. Presentation: ± Initial hyperthyroidism, followed by eventual thyroid burnout and hypothyroidism.
b. Etiology: Autoimmune (significantly elevated thyroglobulin and/or microsomal antibody).
c. Laboratory findings: Mild to moderate ↑ T4 (↓123I uptake distinguishes from Graves).
d. Treatment: Hyperthyroid phase is usually self-limited; patient may eventually need thyroid replacement. Propranolol if symptomatic.
4. Thyroid storm:
a. Presentation: Acute onset of hyperthermia, tachycardia, and restlessness. May progress to delirium, coma, and death.
b. Treatment: Propranolol is used to relieve signs and symptoms of thyrotoxicosis. Potassium iodide may also be used for acute hyperthyroid management. Long-term management as for Graves disease.
5. Neonatal thyrotoxicosis:
a. Presentation: Microcephaly, frontal bossing, intrauterine growth retardation (IUGR), tachycardia, systolic hypertension leading to widened pulse pressure, irritability, failure to thrive, exophthalmos, goiter, flushing, vomiting, diarrhea, jaundice, thrombocytopenia, and cardiac failure or arrhythmias. Onset from immediately after birth to weeks.
b. Etiology: Occurs exclusively in infants born to mothers with Graves disease. Caused by transplacental passage of maternal TSI. Occasionally, mothers are unaware they have Graves. Even if a mother has received definitive treatment (thyroidectomy or radiation therapy), passage of TSI remains possible.
c. Treatment and monitoring: Propranolol for symptom control. Methimazole to lower thyroxine levels. Digoxin may be indicated for heart failure. Disease usually resolves by age 6 months.
IV. Parathyroid Gland Function and Vitamin D
A. Parathyroid Gland
1. Parathyroid hormone (PTH) function: Increases serum calcium by increasing bone resorption, increasing calcium and magnesium reuptake in the kidney, increasing phosphorus excretion in the kidney, and increasing 25-hydroxyvitamin D conversion to 1,25-dihydroxyvitamin D in order to increase calcium absorption in the intestine.
2. Hypoparathyroidism:
a. Presentation: Asymptomatic or mild muscle cramps to hypocalcemic tetany, prolonged QTc, and convulsions.
b. Etiology: Results from a decrease in PTH due to decreased function or absence of the parathyroid gland. This can be due to transient hypoparathyroidism in infants, autoimmune disease, DiGeorge syndrome, iatrogenic removal of the parathyroid gland during other surgical procedures. Pseudohypoparathyroidism results from PTH resistance and is distinguished by normal or elevated PTH.
c. Laboratory findings: ↓ PTH; ↓ serum Ca2+, ↑ serum phosphorus, normal/ ↓ alkaline phosphatase, ↓ 1,25-OH−vitamin D3
d. Treatment and monitoring: Calcium supplementation for documented hypocalcemia, vitamin D supplementation with calcitriol. Carefully monitor serum calcium and phosphorus during therapy. Monitor urine calcium levels to avoid hypercalciuria.
3. Hyperparathyroidism:
a. Presentation: Hypercalcemia leading to vomiting, constipation, abdominal pain, weakness, paresthesias, malaise, and bone pain. Uncommon in childhood.
b. Etiology: Primary hyperparathyroidism is uncommon in children and is usually due to overproduction secondary to adenoma or hyperplasia. Adenomas can be associated with multiple endocrine neoplasia (MEN) syndromes (see Expert Consult, Box EC 10-A). Secondary hyperparathyroidism is more common; develops in response to hypocalcemic states like renal failure or rickets.
c. Laboratory findings, primary: ↑ PTH, ↑ serum Ca2+; ↓ serum phosphorus; normal/↑ alkaline phosphatase. In secondary hyperparathyroidism, Ca2+ normal/↓.
d. Treatment for hypercalcemia associated with primary hyperparathyroidism: Hydration is mainstay of treatment; enhances calciuria. Furosemide may be used with caution with adequate hydration. Hydrocortisone (1 mg/kg Q6 hr), reduces intestinal absorption of calcium. Calcitonin transiently opposes bone resorption. In severe hypercalcemia, bisphosphates may be considered. Surgical removal of parathyroid glands (may result in hypoparathyroidism).
1. Current recommendations suggest 600 IU/day in children >12 months of age to meet daily requirements.
TABLE 10-8
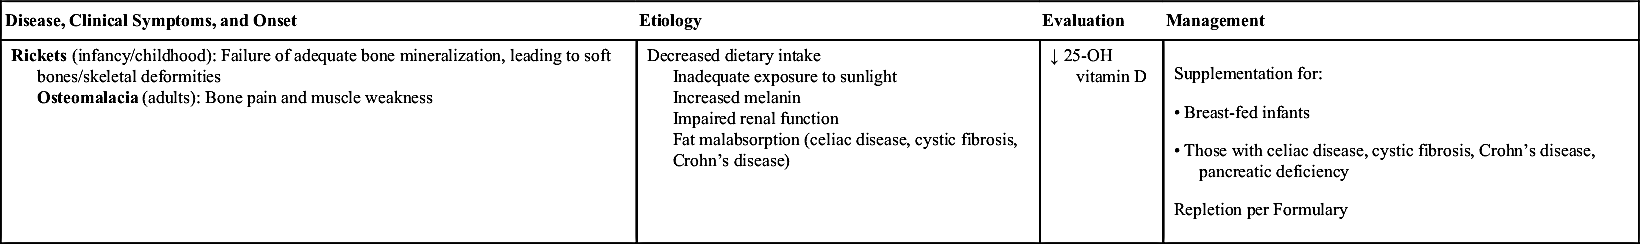
TABLE 10-9
VITAMIN D, 25-HYDROXYVITAMIN D18-20
| 25-Hydroxyvitamin D | Value (ng/mL) |
| Deficiency | <10–15∗ |
| Insufficency | 15–20 |
| Optimal level | >20–30† |
NOTE: 1,25-Dihydroxyvitamin D is the physiologically active form, but 25-hydroxyvitamin D is the value to monitor for vitamin D deficiency because this approximates body stores of vitamin D. Cutoffs are not yet well defined.
∗ Values <10–15 have been associated with bone changes found in rickets.
† Controversy exists regarding optimal 25-hydroxyvitamin D level. Some experts recommend a level >30 ng/mL as optimal. Johns Hopkins Laboratory uses 30 ng/mL as cutoff for normal.
2. The definition and consequences of vitamin D deficiency and insufficency is an evolving field. See Table 10-9 for suggested ranges of 25-hydroxyvitamin D.
V. Adrenal Function21-23
A. Adrenal Insufficiency
1. Etiology:
a. Common causes: Congenital adrenal hyperplasia (CAH) and chronic glucocorticoid treatment (suppression of ACTH secretion)
b. Other causes: Addison disease and hypothalamic or pituitary disease secondary to tumors, surgery, radiation therapy, or congenital defects
2. Evaluation:
a. AM cortisol level (see Table 10-10 for interpretation)
b. ACTH stimulation test:
(1) Purpose: Measures ability of the adrenal gland to produce cortisol in response to ACTH. Most useful in diagnosis of adrenal insufficiency.
(2) Interpretation: Normally, a rise in serum cortisol follows ACTH administration. With ACTH deficiency or prolonged adrenal suppression, there is no rise in cortisol after a single ACTH dose. Blunted cortisol response can be indicative of CAH. Lack of response after 3 consecutive days of ACTH stimulation is pathognomonic of Addison disease.
(3) Standard-dose ACTH stimulation test (250 mcg intravenously; cortisol measured at 30 minutes. Used to evaluate for primary adrenal insufficiency, although may be used to evaluate for central adrenal insufficiency:
(a) For evaluation of primary adrenal insufficiency:
<18 mcg/dL: Highly suggestive of adrenal insufficiency
>18 mcg/dL: Normal (rules out adrenal insufficiency)
(b) For evaluation of central adrenal insufficiency:
<16 mcg/dL: Highly suggestive of adrenal insufficiency
16–30 mcg/dL: Adrenal insufficiency less likely but not excluded
>30 mcg/dL: Normal (rules out adrenal insufficiency)
(4) Low-dose ACTH stimulation test (1 mcg/1.73 m2); cortisol measured at 30 minutes. Used to evaluate for central adrenal insufficiency, where it may have higher sensitivity than standard-dose test:
Level <16 mcg/dL: Suggestive of adrenal insufficiency
Level 16–22 mcg/dL: Adrenal insufficiency less likely but not excluded
Level >22 mcg/dL: Adrenal insufficiency unlikely
NOTE: No test for adrenal insufficiency has perfect sensitivity or specificity, so results must be interpreted in the individual clinical context.
c. Mineralocorticoid deficiency confirmed with ↑ renin and ↓ aldosterone
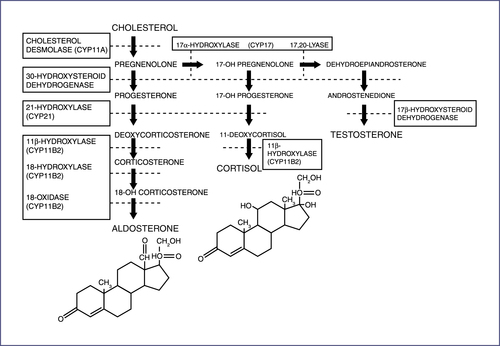
a. Group of autosomal recessive disorders characterized by a defect in one of the enzymes required in the synthesis of cortisol from cholesterol (Fig. 10-3). Cortisol deficiency results in oversecretion of ACTH and hyperplasia of the adrenal cortex.
b. Most common cause of ambiguous genitalia in females.
c. 21-Hydroxylase deficiency accounts for 90% of cases.
d. The enzymatic defect results in impaired synthesis of adrenal steroids beyond the enzymatic block and overproduction of the precursors before the block. Two major classifications:
(1) Classic (complete enzyme deficiency):
(a) Occurs with or without salt loss.
(b) Symptoms occur in the absence of stress.
(c) Adrenal crisis in untreated patients occurs at 1–2 weeks of life, with signs and symptoms of adrenal insufficiency rarely occurring before 3–4 days of life. (Non–salt-losing forms have a less severe risk for adrenal crisis, owing to preservation of mineralocorticoid synthesis.)
(d) Diagnosis: Elevated 17-hydroxyprogesterone (17-OHP) levels (often on newborn screen) (Table 10-11).
(e) Elevated testosterone in girls and androstenedione in girls and boys.
(f) For apparent male infants presenting with classic CAH, a karyotype should be evaluated to rule out the possibility of a severely masculinized female infant.
(2) Nonclassic or simple virilizing form (partial enzyme deficiency):
TABLE 10-11
| Age | Baseline (ng/dL) |
| Premature (31–35 weeks) | ≤360 |
| Term infants (3 days) | ≤420 |
| 1–12 mo | 11–170 |
| 1–4 yr | 4–115 |
| 5-9 yr | ≤90 |
| 10-13 yr | ≤169 |
| 14-17 yr | 16–283 |
| Males, Tanner II–III | 12–130 |
| Females, Tanner II–III | 18–220 |
| Male, Tanner IV–V | 51–190 |
| Females, Tanner IV–V | 36–200 |
| Male (18–30 yr) | 32–307 |
| Adult female | |
| Follicular phase | ≤185 |
| Midcycle phase | ≤225 |
| Luteal phase | ≤285 |
Reference ranges from Quest Diagnostics LC/MS assay (liquid chromatography/tandem mass spectroscopy). For preterm infants or infants born small for gestational age, see Olgemöller B, Roscher AA, Liebl B, et al. Screening for congenital adrenal hyperplasia: adjustment of 17-hydroxyprogesterone cut-off values to both age and birth weight markedly improves the predictive value. J Clin Endocrinol Metab. 2003;88:5790-5794.
(b) Morning 17-OHP levels may be elevated, but diagnosis may require an ACTH stimulation test. A significant rise in the 17-OHP level 60 minutes after ACTH injection is diagnostic. Cortisol response will be decreased.
(3) Newborn screen:
(a) Measures 17-OHP on filter paper; can be artificially elevated due to prematurity, sickness, stress; 2% specific, resulting in 98% false-positive rate
(b) Results: If 17-OHP 40–100 ng/mL, repeat. If higher, check electrolytes and serum 17-OHP. If K ↑ and Na ↓, initiate treatment with hydrocortisone.
4. Primary adrenal insufficiency (Addison disease):24
a. Syndrome of weakness, fatigue, and hyperpigmentation due to insufficient mineralocorticoid and glucocorticoid production, with compensatory ACTH overproduction. Because of its nonspecific presentation, can be missed in older children.
b. Autoimmune destruction of adrenal glands is the most common cause outside of infancy. In children, it may be part of autoimmune polyendocrine syndrome type 1 (APS-1), which also includes hypoparathyroidism and chronic mucocutaneous candidiasis. Individuals with autoimmune Addison disease should also be screened for other endocrinopathies.
a. Glucocorticoid maintenance:
(1) Adrenal insufficiency—replacement of physiologic glucocorticoid production: 6–18 mg/m2/day ÷ TID hydrocortisone PO or 1.5–3.5 mg/m2/day prednisone ÷ BID (or equivalent glucocorticoid dose of another steroid). Typically, lower doses are required for central adrenal insufficiency, intermediate doses for primary adrenal insufficiency, and higher doses for CAH. Consultation with an endocrinologist is recommended.
(2) Doses are often titrated to preserve normal skeletal growth and rate of skeletal maturation, and in CAH to suppress production of excess androgen.
b. Mineralocorticoid maintenance:
(1) These patients should have ready access to salt.
(2) For salt-losing forms of adrenal insufficiency (e.g., CAH, Addison disease): 0.1 mg/m2/day (typical range: 0.05–0.15 mg) oral (PO) fludrocortisone acetate once daily is recommended. (NOTE: Intravenous [IV] hydrocortisone at 50 mg/m2/day will supply a maintenance amount of mineralocorticoid activity. Synthetic steroids such as prednisone and dexamethasone do not supply appropriate mineralocorticoid effects.)
(3) Infants also require 1–2 g (17–34 mEq) of sodium supplementation per day.
(4) Always monitor blood pressure and electrolytes when supplementing mineralocorticoids.
c. Stress-dose glucocorticoids:
(1) Glucocorticoid dosage should increase in patients with fever or other illness to mimic normal physiologic cortisol response to stress.
(2) Minor ambulatory illness stress dose: 30–50 mg/m2/day of hydrocortisone PO ÷ TID or 6–10 mg/m2/day prednisone PO ÷ BID.
(3) Major stress (surgery/severe illness/adrenal crisis): Hydrocortisone 50 mg/m2 IV bolus, then 25–100 mg/m2/day IV (as a continuous infusion) or intramuscular (IM) injection of 25 mg/m2/dose Q6 hr
TABLE 10-12
POTENCY OF VARIOUS THERAPEUTIC STEROIDS
(Set Relative to Potency of Cortisol)
| Steroid | Glucocorticoid Effect∗ (in mg of cortisol per mg of steroid) | Mineralocorticoid Effect† (in mg of cortisol per mg of steroid) |
| Cortisol (hydrocortisone) | 1 | 1 |
| Cortisone acetate (oral) | 0.8 | 0.8 |
| Cortisone acetate (intramuscular) | 0.8 | 0.8 |
| Prednisone | 4 | 0.25 |
| Prednisolone | 4 | 0.25 |
| Methyl prednisolone | 5 | 0.4 |
| Betamethasone | 25 | 0 |
| Triamcinolone | 5 | 0 |
| Dexamethasone | 30 | 0 |
| 9α–fluorocortisone (fludrocortisone) | 15 | 200 |
| Deoxycorticosterone (DOC) acetate | 0 | 20 |
| Aldosterone | 0.3 | 200–1,000 |
∗ To determine cortisol equivalent of a given steroid dose, multiply dose of steroid by corresponding number in column for glucocorticoid or mineralocorticoid effect. To determine dose of a given steroid based on desired cortisol dose, divide desired hydrocortisone dose by corresponding number in the column.
† Total physiologic replacement for salt retention is usually 0.1 mg Florinef, regardless of patient size.
Modified from Sperling MA. Pediatric Endocrinology, 3rd ed. Philadelphia: Saunders, 2008:476.
6. Acute adrenal crisis:
a. Often precipitated by acute illness, trauma, surgery, or exposure to excess heat.
b. Presentation: Emesis, diarrhea, dehydration, hypotension, metabolic acidosis, shock.
c. Laboratory values: Often hypoglycemia, hyponatremia, and hyperkalemia. In addition, serum cortisol and aldosterone are decreased, and ACTH and renin are elevated. In infants with CAH, 17-OHP is increased.
NOTE: Performing these studies before steroid administrationis useful to confirm the diagnosis, but treatment should not be delayed.
d. Management includes rapid volume expansion to support blood pressure, sufficient dextrose to maintain blood glucose, close monitoring of electrolytes, and corticosteroid administration.
7. Cushing syndrome:25
a. Signs and symptoms (including rapid weight gain with central obesity, buffalo hump, moon face, striae, thinning of skin and other membranes, hypertension) associated with elevated cortisol levels and overexposure to glucocorticoids (either endogenous or exogenous). Relatively rare in children, with most cases resulting from iatrogenic causes.
b. Cushing evaluation:
(1) 24-hour urine collection for excess cortisol (normal value range by mass spectrometry: ≤27–30 ng/mL).
(2) Salivary cortisol level: Measured at 11 PM (spit in a tube); levels are akin to free serum cortisol. Normal range is <0.2 mcg/dL.
(3) Dexamethasone suppression test:
(a) Dexamethasone suppresses secretion of ACTH by the normal pituitary, decreasing endogenous production of cortisol. Useful in determining the etiology of glucocorticoid or androgen overproduction.
(b) Overnight dexamethasone suppression test: Measure serum cortisol at 8 AM; preceded by 1 mg of dexamethasone PO given at 11 PM the night before. Level <1.8 mcg/dL (50 nmol/L) is within normal range of suppression.
NOTE: Random cortisol is not useful in evaluation for Cushing syndrome.
1. Pheochromocytoma only accounts for ≈1% of pediatric hypertension. Often associated with syndromes: MEN IIa and IIb, Von Hippel-Lindau, neurofibromatosis (NF)1, familial paraganglioma syndrome.
2. Evaluation for pheochromocytoma should involve imaging and laboratory workup. See Expert Consult, Chapter 10, for additional information about plasma concentrations of free, fractionated metanephrines.
3. Measurement of free, fractionated metanephrines in plasma:
a. Use: Detection of pheochromocytoma
VI. Posterior Pituitary Gland—Vasopressin29
A. Syndrome of Inappropriate Antidiuretic Hormone Secretion (SIADH)
1. Presentation: Hyponatremia (Na+ < 135 mEq/L) with inappropriately concentrated urine in the setting of euvolemia or mild hypervolemia
3. Laboratory findings: ↓ serum Na+ and Cl− with normal HCO3−, hypouricemia, inappropriately concentrated urine
4. Treatment: Correct hyponatremia slowly with fluid restriction (≈10% rise in Na+ per 24 hours). In the setting of coma or seizures, use hypertonic saline to rapidly correct Na+ to ≈ 120–125 mEq/L. Definitive therapy: identify and treat the underlying cause
B. Diabetes Insipidus (DI)23
1. General: Inability to concentrate urine
a. Presentation: Infants may present with failure to thrive, vomiting, constipation, unexplained fevers. In more severe cases, severe dehydration, hypovolemic shock, and seizure may occur.
b. Etiology: May be central or nephrogenic (see below).
c. Diagnosis: Water deprivation test. Vasopressin test differentiates between central and nephrogenic DI.
(1) Water deprivation test:
(a) Purpose: Determines ability to concentrate urine; useful in diagnosis of DI. Risk of dehydration and hypernatremia, so careful supervision is required.
(b) Method:
(i) Begin test after a 24-hour period of adequate hydration and stable weight.
(ii) Obtain a baseline weight after bladder emptying.
(iii) Restrict fluids. Measure body weight and urine specific gravity and volume hourly.
(iv) Check serum Na and urine and serum osmolality Q2 hr. (Hematocrit and blood urea nitrogen [BUN] levels may also be obtained but are not critical.) Monitor carefully to ensure fluids are not ingested during the test.
(v) Terminate test if weight loss approaches 5%.
(c) Interpretation:
(i) Normal individuals and those with psychogenic DI: Urine will be concentrated to 500–1400 mOsm/L; plasma osmolality will be 288–291 mOsm/L. Urine specific gravity rises to at least 1.010, urine-to-plasma osmolality ratio is >2, urine volume decreases significantly, and there should be no appreciable weight loss. Urine osmolarity > 1000 mOsm/L (or > 600 mOsm/L for >1 hour) generally excludes a diagnosis of DI.
(ii) Central or nephrogenic DI: Specific gravity remains < 1.005. Urine osmolality remains <150 mOsm/L, with no significant reduction of urine volume. Weight loss of up to 5% usually occurs. At the end of the test, serum osmolality > 290 mOsm/L, Na > 150 mEq/L, and a rise of BUN and hematocrit provide evidence the patient has DI.
(2) Vasopressin test:
(b) Method: Vasopressin given subcutaneously (1 U/m2), preferably at the end of water deprivation test. Urine output, urine specific gravity, and water intake are monitored.
(c) Interpretation:
(i) Central DI: Patients concentrate their urine (>1.010), demonstrate a reduction of urine volume and decreased fluid intake in response to exogenous vasopressin
(ii) Nephrogenic DI: No significant change in fluid intake, urine volume, or specific gravity
(iii) Psychogenic DI: Continued fluid intake, decreased urine output, and increased specific gravity
2. Central DI:
a. Etiology: Caused by vasopressin deficiency, associated with CNS injury, including trauma and tumors. After trauma to axons of vasopressin-containing neurons, a temporary or permanent DI may result. Owing to the initial edema occurring in the area of the hypothalamus and pituitary, a short-lived period (2–5 days) of DI is observed. This is succeeded by a stage of SIADH as dying neurons release vasopressin. The final stage results in permanent DI if a significant number of neurons are injured.
b. Laboratory findings: Low urine specific gravity (<1.005), low urine osmolarity (50–200), low vasopressin (<0.5 pg/mL)
c. Treatment: IV, PO, SQ, or nasal desmopressin acetate (DDAVP); titrate dosage to urine output. Goal is ≥1-hour period of diuresis per day that stimulates thirst. Monitor electrolytes. Infants are often not treated with DDAVP because of difficulty monitoring input and output. Rather, they can be treated with increased free water and salt restriction.
3. Nephrogenic DI:
a. Etiology: Caused by renal tubular resistance to vasopressin; genetic or acquired
b. Laboratory findings: Low urine specific gravity (<1.005), low urine osmolarity (50–200 mOsm/L)
c. Treatment: Increase free water and a low-salt diet
VII. Growth and Sexual Development29-38
A. Growth
1. Target height range: Calculated as midparental stature ± 2 SD (1 SD = 2 inches)
a. Midparental stature for boys: (Paternal height + maternal height + 5 inches)/2
b. Midparental stature for girls: (Paternal height + maternal height − 5 inches)/2
a. Definition: Height less than 3rd percentile, decreasing growth velocity, height percentile below target height range.
b. Differential diagnosis: Constitutional growth delay (CGD) and familial short stature (FSS) must be distinguished from pathologic causes of short stature.
(1) FSS: Characterized by slow growth rate during the first 2–3 years of life, followed by a low-normal growth velocity. Bone age x-rays may be within normal limits for age.
(2) CGD: Typically characterized by similar growth charts as those with FSS, but a delay in onset of puberty and skeletal maturation allows for a period of catch-up growth. Family history of delayed puberty is often present. Bone age x-rays may be delayed for age.
(3) Pathologic short stature (see Fig. 10-4).

c. Initial evaluation: Detailed history/physical examination, evaluation of growth curves and pubertal stage. Initial screening tests include complete blood cell count (CBC), liver function tests, electrolytes, erythrocyte sedimentation rate, and urinalysis (including pH and specific gravity). Also consider thyroid function tests, serum insulin-like growth factor (IGF)-1 (Table 10-13) and IGF-binding protein-3 (IGFBP-3), tissue transglutaminase for celiac disease, bone age (radiograph of left wrist and hand), and karyotype (in girls). Consider a skeletal survey in a patient with disproportionate features.
3. Tall stature: Most common cause is familial tall stature or precocious puberty. Bone age may be helpful.
4. Obesity: A growing problem in pediatric population. Although the majority do not have endocrine etiology, two disease categories may be addressed when approaching the obese patient:
TABLE 10-13
INSULIN-LIKE GROWTH FACTOR 1 (IGF-1)
| Age (years) | Male (ng/mL) | Females (ng/mL) |
| <1 | ≤142 | ≤185 |
| 1–1.9 | ≤134 | ≤175 |
| 2–2.9 | ≤135 | ≤178 |
| 3–3.9 | 30–155 | 38–214 |
| 4–4.9 | 28–181 | 34–238 |
| 5–5.9 | 31–214 | 37–272 |
| 6–6.9 | 38–253 | 45–316 |
| 7–7.9 | 48–298 | 58–367 |
| 8–8.9 | 62–347 | 76–424 |
| 9–9.9 | 80–398 | 99–483 |
| 10–10.9 | 100–449 | 125–541 |
| 11–11.9 | 123–497 | 152–593 |
| 12–12.9 | 146–541 | 178–636 |
| 13–13.9 | 168–576 | 200–664 |
| 14–14.9 | 187–599 | 214–673 |
| 15–15.9 | 201–609 | 218–659 |
| 16–16.9 | 209–602 | 208–619 |
| 17–17.9 | 207–576 | 185–551 |
NOTE: A clearly normal IGF-1 level argues against growth hormone (GH) deficiency, except in young children, where there is considerable overlap between normals and those with GH deficiency.
Reference ranges from Quest Diagnostics LC/MS (liquid chromatography/tandem mass spectrometry) assay.
b. Cushing syndrome: Unlikely without linear growth failure in addition to obesity (see Section V for laboratory testing details)
5. Polycystic ovarian syndrome (PCOS):
a. Syndrome of hyperandrogenism and menstrual dysfunction
b. Diagnostic criteria:
(1) Hyperandrogenism: Clinical characteristics are hirsutism, acne, and female pattern alopecia. Biochemical characteristic is elevated free testosterone, calculated from total serum testosterone and sex hormone binding protein (SHBG).
(2) Menstrual dysfunction: Amenorrhea or oligomenorrhea.
(3) Polycystic ovaries: Ultrasound (US) characteristics are increased ovarian volume (reliable in adolescents via transabdominal US) or follicular phase with ≥12 follicles measuring 2–9 mm (reliable via transvaginal US only).
c. Management:
(1) Weight reduction and other lifestyle changes increase SHBG (thus decreasing free testosterone) can restore ovulation, and increase insulin sensitivity.
(2) Treatment of hirsutism/acne: Hormonal contraceptives.
(3) Insulin-sensitizing agents (e.g., metformin) may help mitigate metabolic consequences.
(4) Prevention of endometrial hyperplasia (increased risk of endometrial cancer) by intermittent induction of menstruation or prevention of endometrial proliferation by hormonal contraception.
B. Sexual Development
1. Delayed puberty: For girls, no pubertal development by age 14 years, or >5 years between thelarche and adrenarche. Primary amenorrhea: no menarche by age 16 years in the presence of secondary sexual characteristics, or no menarche and no secondary sexual characteristics by age 14 years. For boys, no testicular enlargement by age 14 years, or >5 year for genital development.
a. Delayed puberty may be divided according to luteinizing hormone (LH)(Table 10-14) and follicle-stimulating hormone (FSH) levels (Table 10-15):
(1) Hypergonadotropic hypogonadism (high LH and FSH): Primary gonadal failure, possibly due to Turner or Klinefelter syndromes, androgen insensitivity, tumor, chemotherapy.
(2) Hypogonadotropic hypogonadism (low or normal LH/FSH): May be due to constitutional delay or central gonadotropin deficiency. Of the latter cause, etiologies include Kallman syndrome (most common cause of isolated gonadotropin deficiency), CNS tumors, hypopituitarism.
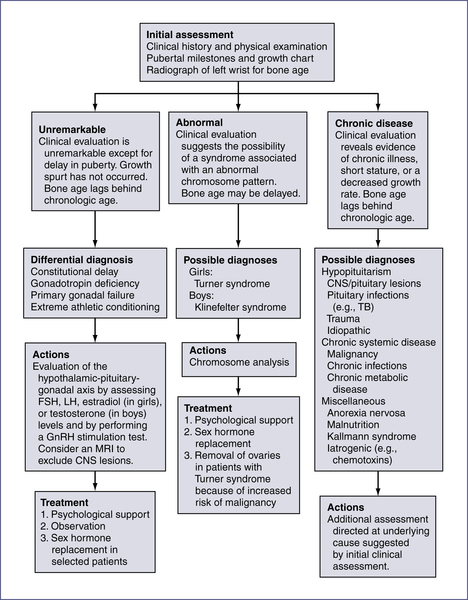
b. Evaluation of delayed puberty may also be divided into the following categories (Fig. 10-5):
(1) Constitutional delay
(2) Hypopituitarism
(3) Chromosomal abnormality
TABLE 10-14
| Age | Males (mIU/mL) | Females (mIU/mL) |
| 0–2 yr | Not established | Not established |
| 3–7 yr | ≤0.26 | ≤0.26 |
| 8–9 yr | ≤0.46 | ≤0.69 |
| 10–11 yr | ≤3.13 | ≤4.38 |
| 12–14 yr | 0.23–4.41 | 0.04–10.80 |
| 15–17 yr | 0.29–4.77 | 0.97–14.70 |
| Tanner Stages | Males (mIU/mL) | Females (mIU/mL) |
| I | ≤0.52 | ≤0.15 |
| II | ≤1.76 | ≤2.91 |
| III | ≤4.06 | ≤7.01 |
| IV–V | 0.06–4.77 | 0.10–14.70 |
Reference values are from Quest Diagnostics immunoassay. For more information visit www.questdiagnostics.com.
TABLE 10-15
| Age | Male (mIU/mL) | Female (mIU/mL) |
| 0–4 yr | Not established | Not established |
| 5–9 yr | 0.21–4.33 | 0.72–5.33 |
| 10–13 yr | 0.53–4.92 | 0.87–9.16 |
| 14–17 yr | 0.85–8.74 | 0.64–10.98 |
Reference values are from Quest Diagnostics immunoassay. For more information visit www.questdiagnostics.com.
c. Initial evaluation: LH and FSH, bone age, and thyroid studies. A gonadotropin-releasing hormone (GnRH) stimulation test can be obtained to rule out hypogonadotropic hypogonadism.
d. GnRH stimulation test:39
(1) Measures pituitary luteinizing hormone (LH) and FSH reserve: Helpful in the differential diagnosis of precocious or delayed sexual development.
(2) Method: Give 20 mcg/kg GnRH analog (Leuprolide) SQ, and measure LH and FSH levels at 0 and 60 minutes.
(3) Interpretation: Prepubertal children should show no or minimal increase in LH and FSH in response to GnRH. A rise of LH to > 3.3–5.0 IU/L is evidence of central puberty.
2. Precocious puberty: Traditionally defined as any sign of secondary sexual maturation before age 8 years in girls and age 9 years in boys. More recent data suggest early puberty may not warrant extensive evaluation or intervention if it occurs after age 6 years in African-American girls or after age 7 years in Caucasian girls.
a. Central, true, isosexual, or complete precocious puberty (CPP): Involves premature activation of hypothalamic-pituitary-gonadal axis, leading to increased GnRH and therefore increased LH/FSH; five times more likely to occur in females and often represents an idiopathic variant of normal puberty. In the majority of males with CPP, a CNS insult or structural anomaly is the cause.
TABLE 10-16
| Age | Level (pg/mL) |
| Prepubertal children | <25 |
| Men | 6–44 |
| Women | |
| Luteal phase | 26–165 |
| Follicular phase | None detected–266 |
| Midcycle | 118–355 |
| Adult women on OCP | None detected–102 |
NOTE: Normal infants have elevated estradiol at birth, which decreases to prepubertal values during the first week of life. Estradiol levels increase again between age 1 and 2 months and return to prepubertal values by age 6–12 months.
OCP, Oral contraceptive pill.
Values from JHH Laboratories.
b. Peripheral or pseudoprecocious puberty: GnRH-independent puberty; involves adrenal, gonadal, ectopic, or exogenous sources of hormone production. Most common causes are CAH, adrenal tumors, McCune-Albright syndrome, gonadal tumors, human chorionic gonadotropin (hCG)-producing tumors, and exogenous sex hormones. Hypothyroidism can also cause GnRH-independent precocity. Penile length is disproportionately greater than testicular size in pseudo-precocious puberty, whereas testicular volume is disproportionately greater than penile size in normal puberty and CPP.
c. Initial evaluation: Begin with history (assessing for premature thelarche/adrenarche) physical examination, and growth curves.
(1) Bone age (generally >2 years in advance of chronologic age in long-standing precocious puberty due to action of sex hormones)
(2) Assess degree of estrogenization or virilization: Check plasma estradiol or plasma testosterone/dehydroepiandrosterone (DHEAS), respectively. Check basal and/or GnRH-stimulated LH levels (see Table 10-14), estradiol measurement in girls (Table 10-16), testosterone levels in boys (Tables 10-17 and 10-18), 17-OHP levels (Table 10-11), DHEA levels (Tables 10-19 and 10-20), and urinary 17-ketosteroids.
(3) Imaging: Magnetic resonance imaging (MRI) of the brain may help identify a CNS lesion. In girls, pelvic ultrasonography may identify ovarian cysts, whereas in boys it may detect nonpalpable Leydig-cell tumors and should be considered in cases of asymmetric testicular volume or peripheral precocious puberty. For normal testicular size and volume see Table 10-21.
3. Ambiguous genitalia:
a. Clinical findings in a neonate suspicious for ambiguous genitalia: Anogenital ratio > 0.5 (distance between anus and posterior fourchette divided by distance between anus and base of clitoris), phallus length < 1.9 cm (mean newborn length: 2.5 SD), clitoromegaly (length > 1 cm), nonpalpable gonads in an apparent male, and hypospadias associated with separation of scrotal sacs or undescended testis.
TABLE 10-17
| Age | Male (ng/dL) | Female (ng/dL) |
| Cord blood | 17–61 | 16–44 |
| 1–10 days | ≤187 | ≤24 |
| 1–3 mo | 72–344 | ≤17 |
| 3–5 mo | ≤201 | ≤12 |
| 5–7 mo | ≤59 | ≤13 |
| 7–12 mo | ≤16 | ≤11 |
| 1–5.9 yr | ≤5 | ≤8 |
| 6–7.9 yr | ≤25 | ≤20 |
| 8–10.9 yr | ≤42 | ≤35 |
| 11–11.9 yr | ≤260 | ≤40 |
| 12–13.9 yr | ≤420 | ≤40 |
| 14–17.9 yr | ≤1000 | ≤40 |
| ≥18 (adult) | 250–1100 | 2–45 |
| Tanner Stage | ||
| Stage I | ≤5 | ≤8 |
| Stage II | ≤167 | ≤24 |
| Stage III | 21–719 | ≤28 |
| Stage IV | 25–912 | ≤31 |
| Stage V | 110–975 | ≤33 |
NOTE: Normal testosterone/dihydrotestosterone (T/DHT) ratio is <18 in adults and older children, <10 in neonates. T/DHT ratio >20 suggests 5-alpha-reductase deficiency or androgen insensitivity syndrome.
Reference ranges from Quest Diagnostics LC/MS (liquid chromatography/tandem mass spectrometry) assay.
TABLE 10-20
DEHYDROEPIANDROSTERONE SULFATE (DHEA-S)
| Age | Male (mcg/dL) | Female (mcg/dL) |
| <1 mo | ≤316 | 15–261 |
| 1–6 mo | ≤58 | ≤74 |
| 7–11 mo | ≤26 | ≤26 |
| 1–3 yr | ≤15 | ≤22 |
| 4–6 yr | ≤27 | ≤34 |
| 7–9 yr | ≤91 | ≤92 |
| 10–13 yr | ≤138 | ≤148 |
| 14–17 yr | 38–340 | 37–307 |
| Tanner Stages (ages 7–17) | ||
| I | ≤49 | ≤46 |
| II | ≤81 | 15–133 |
| III | 22–126 | 42–126 |
| IV | 33–177 | 42–241 |
| V | 110–370 | 45–320 |
Reference values from Quest Diagnostics assay. For more information see www.questdiagnostics.com.
b. Etiology: Most common cause is CAH (see Section IV.A.3). Other causes: testicular regression syndrome, androgen insensitivity, testosterone biosynthesis disorders, and chromosomal abnormalities.
c. Diagnosis: Based on karyotype, measurement of gonadotropins (LH, FSH), adrenal steroids (cortisol, 17-OHP, and ACTH stimulation test), testosterone precursors (DHEA, androstenedione), testosterone, dihydrotestosterone (DHT), and hCG stimulation test (see hCG stimulation test on Expert Consult). NOTE: Best test for 5-alpha-reductase deficiency is the testosterone-to-DHT ratio.
d. Cryptorchidism:
(2) Evaluation: Rule out virilized female with a karyotype. hCG stimulation test can be used to differentiate cryptorchidism from anorchia.
Human chorionic gonadotropin (hCG) stimulation test:
(a) Measures capacity for testosterone biosynthesis; useful in differentiation of cryptorchidism (undescended testes) from anorchia (absent testes).
(b) Method: Give 1000 units of intravenous (IV) or intramuscular (IM) hCG for 3 days, and measure serum testosterone and dihydrotestosterone on day 0 and day 4.
(c) Interpretation: Testosterone level >100 ng/dL in response to hCG stimulation is evidence for adequate testosterone biosynthesis. In cryptorchidism, testosterone rises to adult levels after hCG administration; in anorchia, there is no rise.
(3) Treatment: Removal of trapped testicle at 1 year of life.
VIII. Neonatal hypoglycemia evaluation40
A. Neonatal Hypoglycemia and Glucagon Stimulation Test40
1. Definition of hypoglycemia: Serum glucose level insufficient to meet metabolic requirements; can vary with perinatal stress, birth weight, and maternal factors. For practical purposes, value is defined as <45 mg/dL.
NOTE: Bedside glucometer is inaccurate at levels <40 mg/dL; stat serum glucose must be sent.
2. Symptoms: Abnormal cry, seizures, apnea, hypotonia, bradycardia, hypothermia.
3. Treatment: Do not delay while awaiting serum glucose results:
a. Plasma glucose 25–45 mg/dL (1.4–2.5 mM), asymptomatic: breast feed or nipple/gavage with formula
b. Plasma glucose level <25 mg/dL (<1.4 mM) ± symptoms, asymptomatic infants who do not tolerate enteral feeding, or symptomatic infants:
(1) Give IV bolus of glucose 0.25 g/kg (2.5 mL/kg of 10% glucose, or 1 mL/kg of 25% glucose) over 1–2 minutes.
(2) Continue IV glucose at a rate of 6–8 mg/kg/min (3.6–4.8 mL/kg/hr of 10% glucose).
(3) Monitor blood glucose Q30–60 min, and increase glucose delivery by 1–2 mg/kg/min if blood glucose is consistently <50 mg/dL.
4. If serum glucose is consistently <45 mg/dL: Further endocrine workup warranted. At the time of hypoglycemia (serum glucose <45 mg/dL), obtain serum levels of glucose, insulin, growth hormone, free fatty acids, and β-hydroxybutyrate.
5. Glucagon stimulation test: At the time of hypoglycemia, obtain above laboratory tests, administer glucagon, and obtain serum glucose levels Q10 min × 4. Repeat growth hormone and cortisol levels 30 minutes after documented hypoglycemia.
b. Hypoglycemia with midline defects and micropenis in a male suggest hypopituitarism, supported by low serum levels of growth hormone and cortisol at the time of hypoglycemia.
IX. Additional Normal Values
Please note that normal values may differ among laboratories because of variation in technique and type of assay used.
See Expert Consult, Chapter 10, for normal values of:
Table EC 10-A, Dihydrotestosterone (DHT)
Table EC 10-B, Catecholamines, urine
Table EC 10-C, Catecholamines, plasma
Table EC 10-D, Insulin-like growth factor binding protein
Table EC 10-E, Mean stretched penile length
Table EC 10-F, Androstenedione, serum
TABLE EC 10-B
| Compound | 3–8 years | 9–12 years | 13–17 years | Adults | |
| Dopamine (mcg/24 hr) | 80–378 | 51–474 | 51–645 | 52–480 | |
| Epinephrine (mcg/24 hr) | 1–7 | ≤8 | ≤11 | 2–14 | |
| Norepinephrine (mcg/24 hr) | 5–41 | 5–50 | 12–88 | 15–100 | |
| Homovanillic acid (mg/24 hr) | 0.5–6.7 | 1.1–6.8 | 1.4–7.2 | 1.6–7.5 | |
| Vanillyl mandelic acid (g/24 hr) | ≤2.3 | ≤3.4 | ≤3.9 | ≤6.0 | |
| 3 mo–4 yr | 5–9 years | 10–13 years | 14–17 years | 18–29 years | |
| Metanephrines (mcg/24 hr) | 25–117 | 11–139 | 51–275 | 40–189 | 25–222 |
| Normetanephrines (mcg/24 hr) | 54–249 | 31–398 | 67–503 | 69–531 | 40–412 |
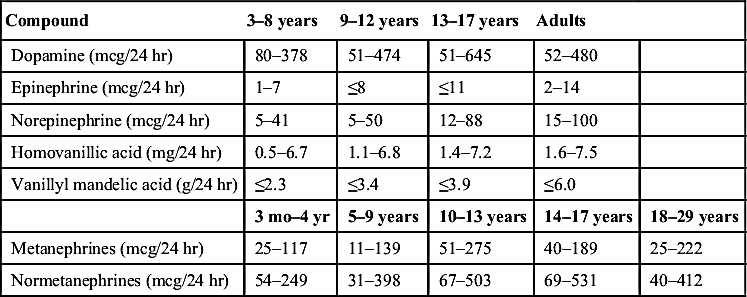
NOTE: Catecholamines are elevated in a variety of tumors, including neuroblastoma, ganglioneuroma, ganglioblastoma, and pheochromocytoma.
Reference ranges from JHH laboratories.
TABLE EC 10-C
| Supine (pg/mL) | Sitting (pg/mL) | |
| Epinephrine | ||
| 3–15 yr | ≤464 | Not determined |
| Adult | ≤50 | ≤95 |
| Norepinephrine | ||
| 3–15 yr | ≤1251 | Not determined |
| Adult | 112–658 | 217–1109 |
| Dopamine | ||
| 3–15 yr | ≤60 | Not determined |
| Adult | ≤30 | ≤30 |
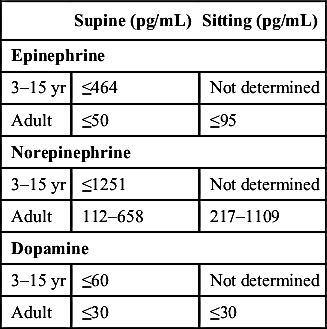
From Blondell R, Foster MB, Dave KC. Disorders of puberty. Am Family Phys. 1999;60:209-218.Reference ranges from JHH Laboratories.
TABLE EC 10-D
INSULIN-LIKE GROWTH FACTOR–BINDING PROTEIN (IGF-BP3)
| Age | mg/L | Tanner Stage | Female mg/L | Male mg/L |
| 0–7 days | ≤0.7 | Tanner I | 1.2–6.4 | 1.4–5.2 |
| 8–15 days | 0.5–1.4 | Tanner II | 2.8–6.9 | 2.3–6.3 |
| 16 days–1 yr | 0.7–3.6 | Tanner III | 3.9–9.4 | 3.2–8.9 |
| 2 yr | 0.8–3.9 | Tanner IV | 3.3–8.1 | 3.7–8.7 |
| 3 yr | 0.9–4.3 | Tanner V | 2.7–9.1 | 2.6–8.6 |
| 4 yr | 1.0–4.7 | |||
| 5 yr | 1.1–5.2 | |||
| 6 yr | 1.3–5.6 | |||
| 7 yr | 1.4–6.1 | |||
| 8 yr | 1.6–6.5 | |||
| 9 yr | 1.8–7.1 | |||
| 10 yr | 2.1–7.7 | |||
| 11 yr | 2.4–8.4 | |||
| 12 yr | 2.7–8.9 | |||
| 13 yr | 3.1–9.5 | |||
| 14 yr | 3.3–10.0 | |||
| 15 yr | 3.5–10.0 | |||
| 16 yr | 3.4–9.5 | |||
| 17 yr | 3.2–8.7 | |||
| 18 yr | 3.1–7.9 | |||
| 19 yr | 2.9–7.3 | |||
| Adults continue to vary by age |
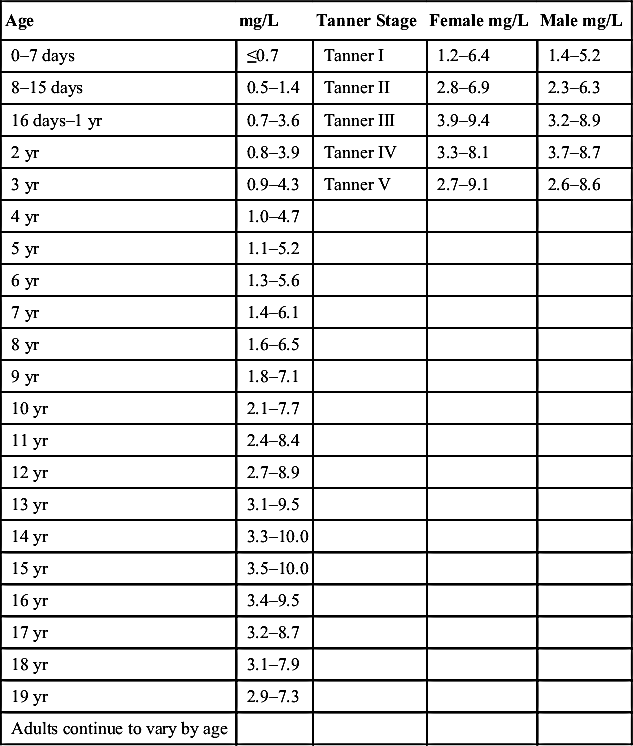
NOTE: Levels below 5th percentile suggest growth hormone deficiency. This test may have greater discrimination than the IGF-1 test in younger patients.
Reference values from Quest Diagnostics immunochemiluminometric assay (ICMA).
TABLE EC 10-E
MEAN STRETCHED PENILE LENGTH (cm)
| Age | Mean ± SD | −2.5 SD |
| Birth | ||
| 30 wk gestation | 2.5 ± 0.4 | 1.5 |
| 34 wk gestation | 3.0 ± 0.4 | 2.0 |
| Full term | 3.5 ± 0.4 | 2.5 |
| 0–5 mo | 3.9 ± 0.8 | 1.9 |
| 6–12 mo | 4.3 ± 0.8 | 2.3 |
| 1–2 yr | 4.7 ± 0.8 | 2.6 |
| 2–3 yr | 5.1 ± 0.9 | 2.9 |
| 3–4 yr | 5.5 ± 0.9 | 3.3 |
| 4–5 yr | 5.7 ± 0.9 | 3.5 |
| 5–6 yr | 6.0 ± 0.9 | 3.8 |
| 6–7 yr | 6.1 ± 0.9 | 3.9 |
| 7–8 yr | 6.2 ± 1.0 | 3.7 |
| 8–9 yr | 6.3 ± 1.0 | 3.8 |
| 9–10 yr | 6.3 ± 1.0 | 3.8 |
| 10–11 yr | 6.4 ± 1.1 | 3.7 |
| Adult | 13.3 ± 1.6 | 9.3 |
NOTE: Measured from the pubic ramus to the tip of the glans while traction is applied along the length of the phallus to the point of increased resistance.
SD, Standard deviation.
From Feldman KW, Smith DW. Fetal phallic growth and penile standards for newborn male infants. J Pediatr. 1975;86:395.
TABLE EC 10-F
| Age | Males (ng/dL) | Females (ng/dL) |
| Premature (31–35 wk) | ≤480 | ≤480 |
| Full-term infants | ≤290 | ≤290 |
| 1–12 mo | 6–78 | 6–78 |
| 1–4 yr | 5–51 | 5–51 |
| 5–9 yr | 6–115 | 6–115 |
| 10–13 yr | 12–221 | 12–221 |
| 14–17 yr | 22–225 | 22–225 |
| Tanner stage II–III | 17–82 | 43–180 |
| Tanner stage IV–V | 57–150 | 73–220 |
| Adult male (18–30 yr) | 50–220 | |
| Female follicular phase | 35–250 | |
| Female luteal phase | 30–235 |
Values from Quest Diagnostics LC/MS (liquid chromatography/tandem mass spectrometry) analysis.