Chapter 27
Blood Chemistries and Body Fluids
, and
Determining normal reference ranges of laboratory studies in pediatric patients poses some major challenges. Available literature is often limited because of the small sample sizes of patients in many studies that have been used to derive these suggested normal ranges. Please use great caution and be aware of this limitation when interpreting pediatric laboratory studies.
The values that follow are compiled from both published literature and the Johns Hopkins Hospital Department of Pathology. Normal values vary with the analytic method used. Consult your laboratory for its analytic method and range of normal values and for less commonly used parameters, which are beyond the scope of this text. Additional normal laboratory values may be found in Chapters 10, 14, and 15.
A special thanks to Lori Sokoll, PhD, and Athena Kantartzis, PhD, for their guidance in preparing this chapter.
I. Reference Values (Table 27-1)
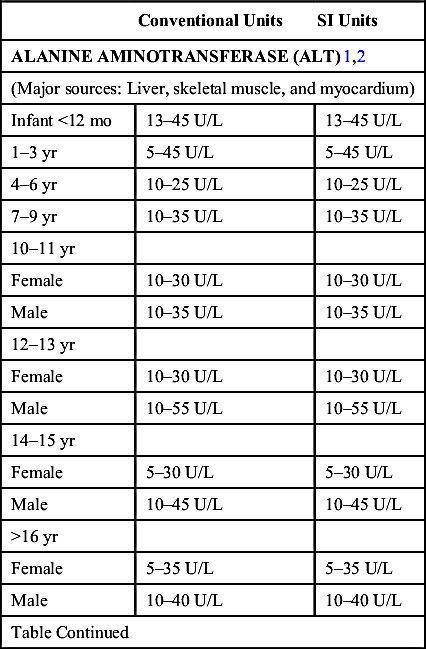
TABLE 27-1
| Conventional Units | SI Units | |
| ALANINE AMINOTRANSFERASE (ALT)1,2 | ||
| (Major sources: Liver, skeletal muscle, and myocardium) | ||
| Infant <12 mo | 13–45 U/L | 13–45 U/L |
| 1–3 yr | 5–45 U/L | 5–45 U/L |
| 4–6 yr | 10–25 U/L | 10–25 U/L |
| 7–9 yr | 10–35 U/L | 10–35 U/L |
| 10–11 yr | ||
| Female | 10–30 U/L | 10–30 U/L |
| Male | 10–35 U/L | 10–35 U/L |
| 12–13 yr | ||
| Female | 10–30 U/L | 10–30 U/L |
| Male | 10–55 U/L | 10–55 U/L |
| 14–15 yr | ||
| Female | 5–30 U/L | 5–30 U/L |
| Male | 10–45 U/L | 10–45 U/L |
| >16 yr | ||
| Female | 5–35 U/L | 5–35 U/L |
| Male | 10–40 U/L | 10–40 U/L |
| Table Continued | ||
| Conventional Units | SI Units | |
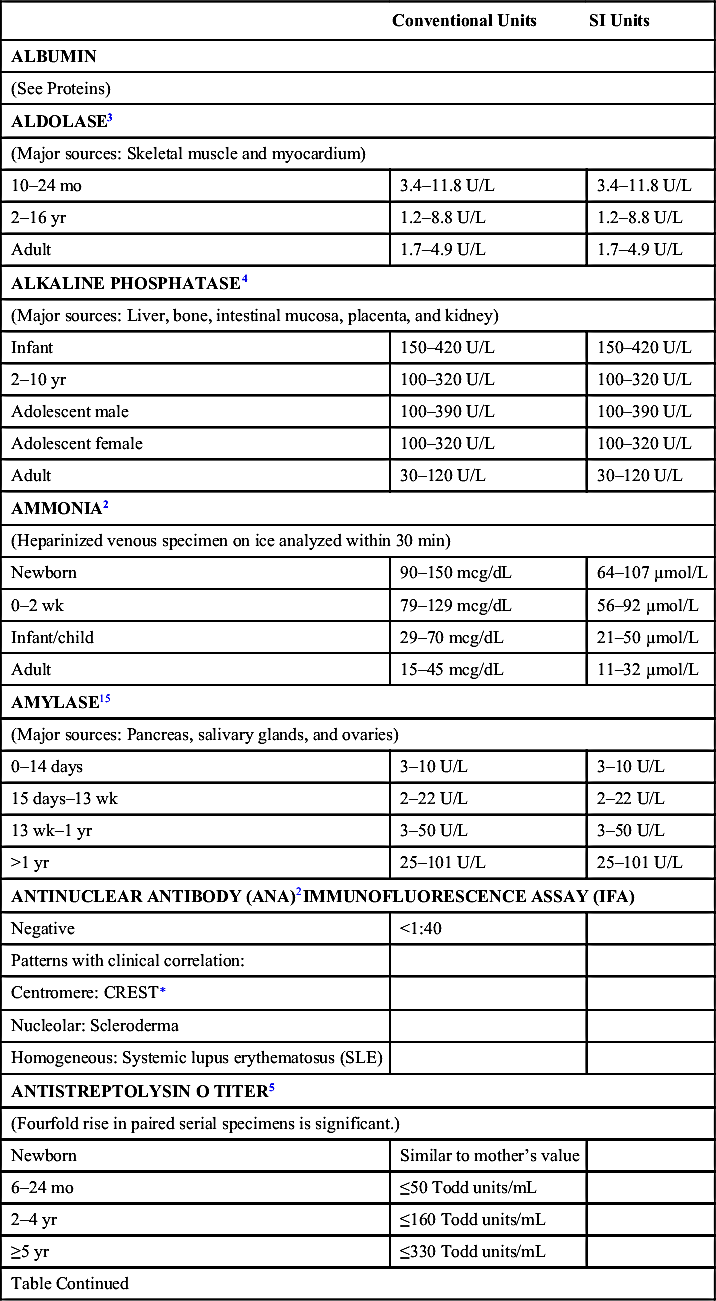
| ALBUMIN | ||
| (See Proteins) | ||
| ALDOLASE3 | ||
| (Major sources: Skeletal muscle and myocardium) | ||
| 10–24 mo | 3.4–11.8 U/L | 3.4–11.8 U/L |
| 2–16 yr | 1.2–8.8 U/L | 1.2–8.8 U/L |
| Adult | 1.7–4.9 U/L | 1.7–4.9 U/L |
| ALKALINE PHOSPHATASE4 | ||
| (Major sources: Liver, bone, intestinal mucosa, placenta, and kidney) | ||
| Infant | 150–420 U/L | 150–420 U/L |
| 2–10 yr | 100–320 U/L | 100–320 U/L |
| Adolescent male | 100–390 U/L | 100–390 U/L |
| Adolescent female | 100–320 U/L | 100–320 U/L |
| Adult | 30–120 U/L | 30–120 U/L |
| AMMONIA2 | ||
| (Heparinized venous specimen on ice analyzed within 30 min) | ||
| Newborn | 90–150 mcg/dL | 64–107 µmol/L |
| 0–2 wk | 79–129 mcg/dL | 56–92 µmol/L |
| Infant/child | 29–70 mcg/dL | 21–50 µmol/L |
| Adult | 15–45 mcg/dL | 11–32 µmol/L |
| AMYLASE15 | ||
| (Major sources: Pancreas, salivary glands, and ovaries) | ||
| 0–14 days | 3–10 U/L | 3–10 U/L |
| 15 days–13 wk | 2–22 U/L | 2–22 U/L |
| 13 wk–1 yr | 3–50 U/L | 3–50 U/L |
| >1 yr | 25–101 U/L | 25–101 U/L |
| ANTINUCLEAR ANTIBODY (ANA)2IMMUNOFLUORESCENCE ASSAY (IFA) | ||
| Negative | <1:40 | |
| Patterns with clinical correlation: | ||
| Centromere: CREST∗ | ||
| Nucleolar: Scleroderma | ||
| Homogeneous: Systemic lupus erythematosus (SLE) | ||
| ANTISTREPTOLYSIN O TITER5 | ||
| (Fourfold rise in paired serial specimens is significant.) | ||
| Newborn | Similar to mother’s value | |
| 6–24 mo | ≤50 Todd units/mL | |
| 2–4 yr | ≤160 Todd units/mL | |
| ≥5 yr | ≤330 Todd units/mL | |
| Table Continued | ||
| Conventional Units | SI Units | |
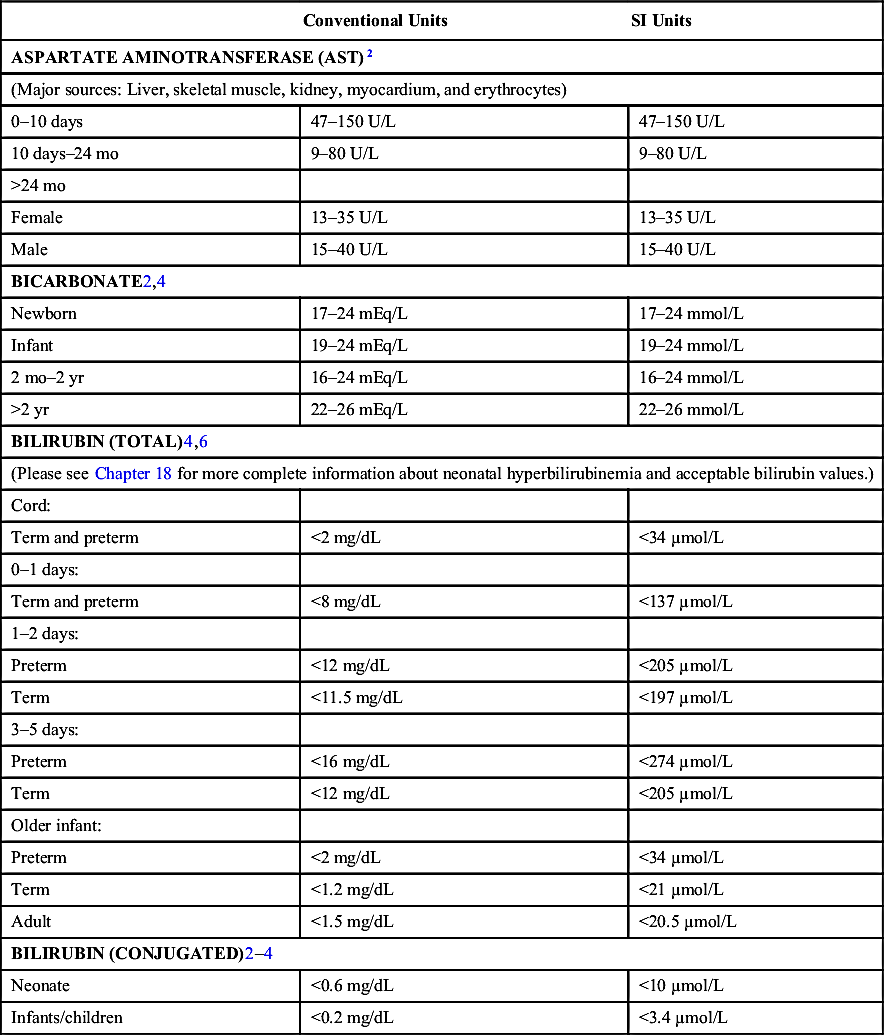
| ASPARTATE AMINOTRANSFERASE (AST)2 | ||
| (Major sources: Liver, skeletal muscle, kidney, myocardium, and erythrocytes) | ||
| 0–10 days | 47–150 U/L | 47–150 U/L |
| 10 days–24 mo | 9–80 U/L | 9–80 U/L |
| >24 mo | ||
| Female | 13–35 U/L | 13–35 U/L |
| Male | 15–40 U/L | 15–40 U/L |
| BICARBONATE2,4 | ||
| Newborn | 17–24 mEq/L | 17–24 mmol/L |
| Infant | 19–24 mEq/L | 19–24 mmol/L |
| 2 mo–2 yr | 16–24 mEq/L | 16–24 mmol/L |
| >2 yr | 22–26 mEq/L | 22–26 mmol/L |
| BILIRUBIN (TOTAL)4,6 | ||
| (Please see Chapter 18 for more complete information about neonatal hyperbilirubinemia and acceptable bilirubin values.) | ||
| Cord: | ||
| Term and preterm | <2 mg/dL | <34 µmol/L |
| 0–1 days: | ||
| Term and preterm | <8 mg/dL | <137 µmol/L |
| 1–2 days: | ||
| Preterm | <12 mg/dL | <205 µmol/L |
| Term | <11.5 mg/dL | <197 µmol/L |
| 3–5 days: | ||
| Preterm | <16 mg/dL | <274 µmol/L |
| Term | <12 mg/dL | <205 µmol/L |
| Older infant: | ||
| Preterm | <2 mg/dL | <34 µmol/L |
| Term | <1.2 mg/dL | <21 µmol/L |
| Adult | <1.5 mg/dL | <20.5 µmol/L |
| BILIRUBIN (CONJUGATED)2–4 | ||
| Neonate | <0.6 mg/dL | <10 µmol/L |
| Infants/children | <0.2 mg/dL | <3.4 µmol/L |
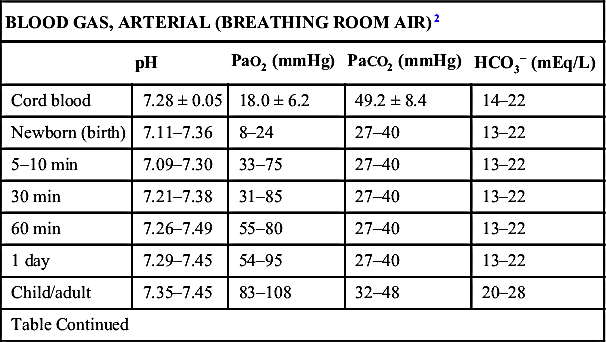
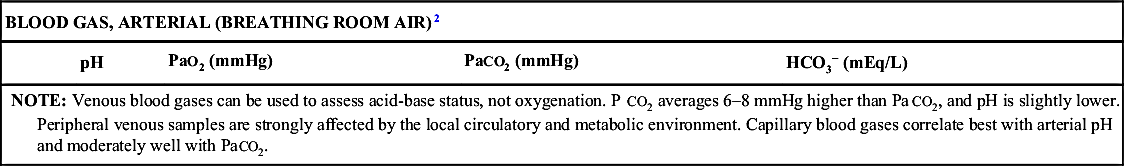
| BLOOD GAS, ARTERIAL (BREATHING ROOM AIR)2 | ||||
| pH | PaO2 (mmHg) | PaCO2 (mmHg) | HCO3− (mEq/L) | |
| Cord blood | 7.28 ± 0.05 | 18.0 ± 6.2 | 49.2 ± 8.4 | 14–22 |
| Newborn (birth) | 7.11–7.36 | 8–24 | 27–40 | 13–22 |
| 5–10 min | 7.09–7.30 | 33–75 | 27–40 | 13–22 |
| 30 min | 7.21–7.38 | 31–85 | 27–40 | 13–22 |
| 60 min | 7.26–7.49 | 55–80 | 27–40 | 13–22 |
| 1 day | 7.29–7.45 | 54–95 | 27–40 | 13–22 |
| Child/adult | 7.35–7.45 | 83–108 | 32–48 | 20–28 |
| Table Continued | ||||
| BLOOD GAS, ARTERIAL (BREATHING ROOM AIR)2 | ||||
| pH | PaO2 (mmHg) | PaCO2 (mmHg) | HCO3− (mEq/L) | |
| NOTE: Venous blood gases can be used to assess acid-base status, not oxygenation. PCO2 averages 6–8 mmHg higher than PaCO2, and pH is slightly lower. Peripheral venous samples are strongly affected by the local circulatory and metabolic environment. Capillary blood gases correlate best with arterial pH and moderately well with PaCO2. | ||||
| Conventional Units | SI Units | |
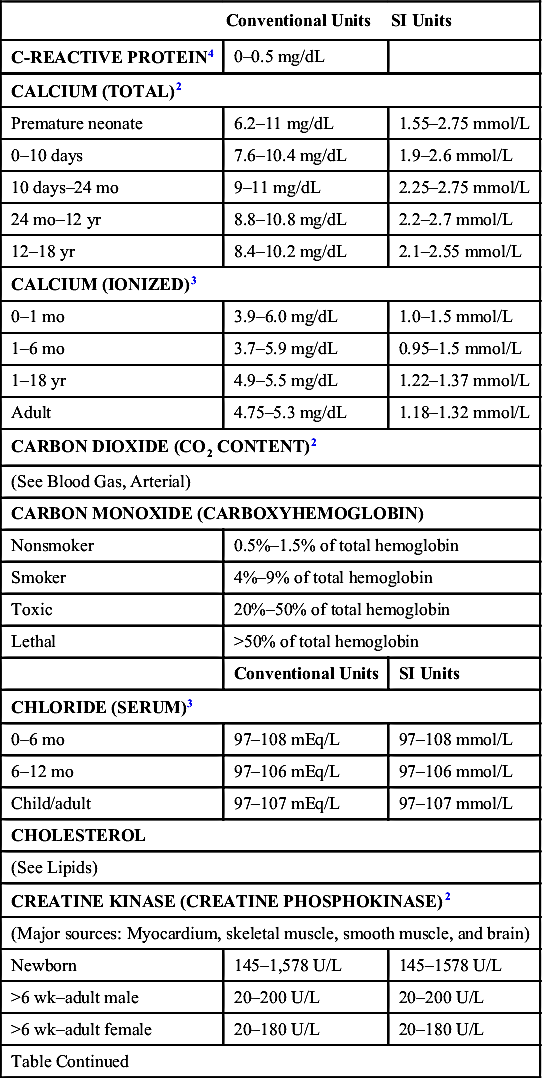
| C-REACTIVE PROTEIN4 | 0–0.5 mg/dL | |
| CALCIUM (TOTAL)2 | ||
| Premature neonate | 6.2–11 mg/dL | 1.55–2.75 mmol/L |
| 0–10 days | 7.6–10.4 mg/dL | 1.9–2.6 mmol/L |
| 10 days–24 mo | 9–11 mg/dL | 2.25–2.75 mmol/L |
| 24 mo–12 yr | 8.8–10.8 mg/dL | 2.2–2.7 mmol/L |
| 12–18 yr | 8.4–10.2 mg/dL | 2.1–2.55 mmol/L |
| CALCIUM (IONIZED)3 | ||
| 0–1 mo | 3.9–6.0 mg/dL | 1.0–1.5 mmol/L |
| 1–6 mo | 3.7–5.9 mg/dL | 0.95–1.5 mmol/L |
| 1–18 yr | 4.9–5.5 mg/dL | 1.22–1.37 mmol/L |
| Adult | 4.75–5.3 mg/dL | 1.18–1.32 mmol/L |
| CARBON DIOXIDE (CO2 CONTENT)2 | ||
| (See Blood Gas, Arterial) | ||
| CARBON MONOXIDE (CARBOXYHEMOGLOBIN) | ||
| Nonsmoker | 0.5%–1.5% of total hemoglobin | |
| Smoker | 4%–9% of total hemoglobin | |
| Toxic | 20%–50% of total hemoglobin | |
| Lethal | >50% of total hemoglobin | |
| Conventional Units | SI Units | |
| CHLORIDE (SERUM)3 | ||
| 0–6 mo | 97–108 mEq/L | 97–108 mmol/L |
| 6–12 mo | 97–106 mEq/L | 97–106 mmol/L |
| Child/adult | 97–107 mEq/L | 97–107 mmol/L |
| CHOLESTEROL | ||
| (See Lipids) | ||
| CREATINE KINASE (CREATINE PHOSPHOKINASE)2 | ||
| (Major sources: Myocardium, skeletal muscle, smooth muscle, and brain) | ||
| Newborn | 145–1,578 U/L | 145–1578 U/L |
| >6 wk–adult male | 20–200 U/L | 20–200 U/L |
| >6 wk–adult female | 20–180 U/L | 20–180 U/L |
| Table Continued | ||
| Conventional Units | SI Units | |
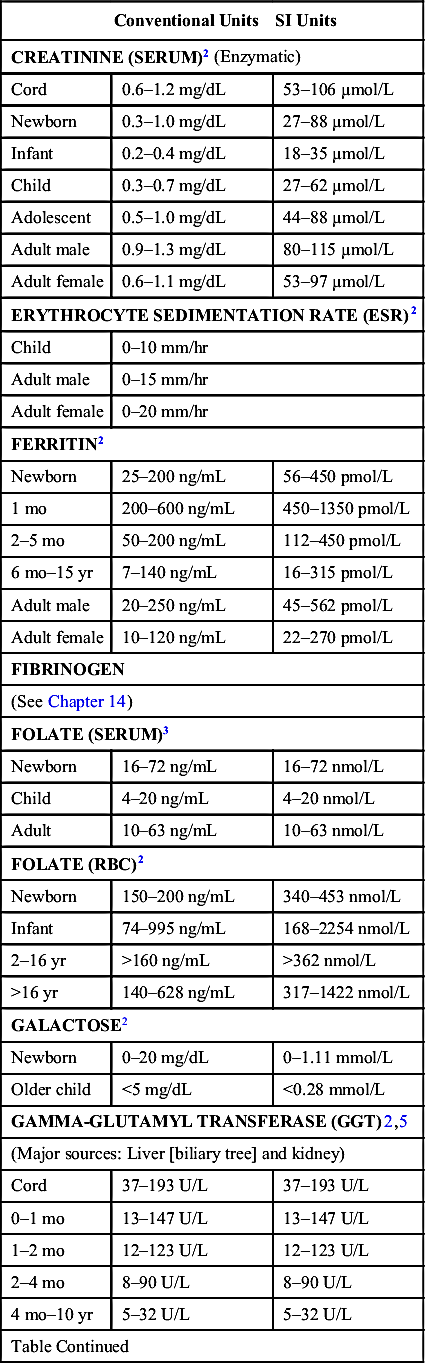
| CREATININE (SERUM)2 (Enzymatic) | ||
| Cord | 0.6–1.2 mg/dL | 53–106 µmol/L |
| Newborn | 0.3–1.0 mg/dL | 27–88 µmol/L |
| Infant | 0.2–0.4 mg/dL | 18–35 µmol/L |
| Child | 0.3–0.7 mg/dL | 27–62 µmol/L |
| Adolescent | 0.5–1.0 mg/dL | 44–88 µmol/L |
| Adult male | 0.9–1.3 mg/dL | 80–115 µmol/L |
| Adult female | 0.6–1.1 mg/dL | 53–97 µmol/L |
| ERYTHROCYTE SEDIMENTATION RATE (ESR)2 | ||
| Child | 0–10 mm/hr | |
| Adult male | 0–15 mm/hr | |
| Adult female | 0–20 mm/hr | |
| FERRITIN2 | ||
| Newborn | 25–200 ng/mL | 56–450 pmol/L |
| 1 mo | 200–600 ng/mL | 450–1350 pmol/L |
| 2–5 mo | 50–200 ng/mL | 112–450 pmol/L |
| 6 mo–15 yr | 7–140 ng/mL | 16–315 pmol/L |
| Adult male | 20–250 ng/mL | 45–562 pmol/L |
| Adult female | 10–120 ng/mL | 22–270 pmol/L |
| FIBRINOGEN | ||
| (See Chapter 14) | ||
| FOLATE (SERUM)3 | ||
| Newborn | 16–72 ng/mL | 16–72 nmol/L |
| Child | 4–20 ng/mL | 4–20 nmol/L |
| Adult | 10–63 ng/mL | 10–63 nmol/L |
| FOLATE (RBC)2 | ||
| Newborn | 150–200 ng/mL | 340–453 nmol/L |
| Infant | 74–995 ng/mL | 168–2254 nmol/L |
| 2–16 yr | >160 ng/mL | >362 nmol/L |
| >16 yr | 140–628 ng/mL | 317–1422 nmol/L |
| GALACTOSE2 | ||
| Newborn | 0–20 mg/dL | 0–1.11 mmol/L |
| Older child | <5 mg/dL | <0.28 mmol/L |
| GAMMA-GLUTAMYL TRANSFERASE (GGT)2,5 | ||
| (Major sources: Liver [biliary tree] and kidney) | ||
| Cord | 37–193 U/L | 37–193 U/L |
| 0–1 mo | 13–147 U/L | 13–147 U/L |
| 1–2 mo | 12–123 U/L | 12–123 U/L |
| 2–4 mo | 8–90 U/L | 8–90 U/L |
| 4 mo–10 yr | 5–32 U/L | 5–32 U/L |
| Table Continued | ||
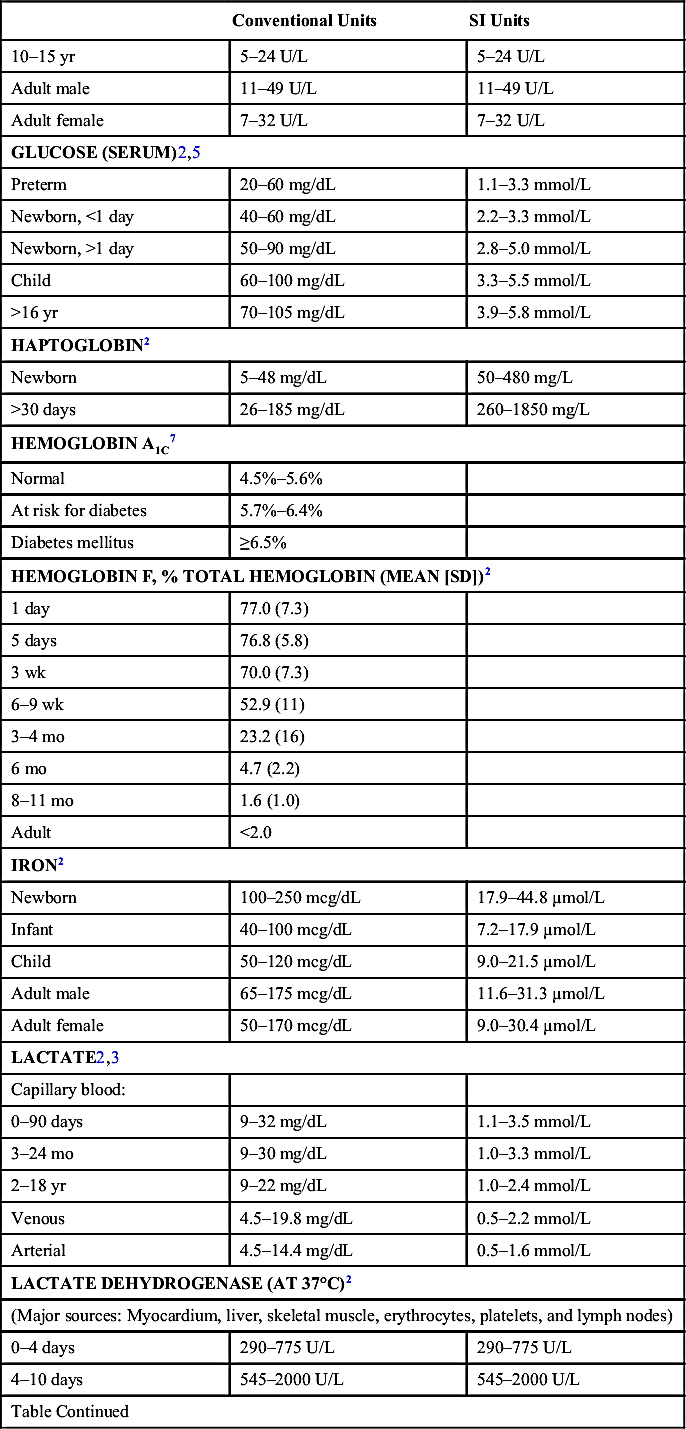
| Conventional Units | SI Units | |
| 10–15 yr | 5–24 U/L | 5–24 U/L |
| Adult male | 11–49 U/L | 11–49 U/L |
| Adult female | 7–32 U/L | 7–32 U/L |
| GLUCOSE (SERUM)2,5 | ||
| Preterm | 20–60 mg/dL | 1.1–3.3 mmol/L |
| Newborn, <1 day | 40–60 mg/dL | 2.2–3.3 mmol/L |
| Newborn, >1 day | 50–90 mg/dL | 2.8–5.0 mmol/L |
| Child | 60–100 mg/dL | 3.3–5.5 mmol/L |
| >16 yr | 70–105 mg/dL | 3.9–5.8 mmol/L |
| HAPTOGLOBIN2 | ||
| Newborn | 5–48 mg/dL | 50–480 mg/L |
| >30 days | 26–185 mg/dL | 260–1850 mg/L |
| HEMOGLOBIN A1C7 | ||
| Normal | 4.5%–5.6% | |
| At risk for diabetes | 5.7%–6.4% | |
| Diabetes mellitus | ≥6.5% | |
| HEMOGLOBIN F, % TOTAL HEMOGLOBIN (MEAN [SD])2 | ||
| 1 day | 77.0 (7.3) | |
| 5 days | 76.8 (5.8) | |
| 3 wk | 70.0 (7.3) | |
| 6–9 wk | 52.9 (11) | |
| 3–4 mo | 23.2 (16) | |
| 6 mo | 4.7 (2.2) | |
| 8–11 mo | 1.6 (1.0) | |
| Adult | <2.0 | |
| IRON2 | ||
| Newborn | 100–250 mcg/dL | 17.9–44.8 µmol/L |
| Infant | 40–100 mcg/dL | 7.2–17.9 µmol/L |
| Child | 50–120 mcg/dL | 9.0–21.5 µmol/L |
| Adult male | 65–175 mcg/dL | 11.6–31.3 µmol/L |
| Adult female | 50–170 mcg/dL | 9.0–30.4 µmol/L |
| LACTATE2,3 | ||
| Capillary blood: | ||
| 0–90 days | 9–32 mg/dL | 1.1–3.5 mmol/L |
| 3–24 mo | 9–30 mg/dL | 1.0–3.3 mmol/L |
| 2–18 yr | 9–22 mg/dL | 1.0–2.4 mmol/L |
| Venous | 4.5–19.8 mg/dL | 0.5–2.2 mmol/L |
| Arterial | 4.5–14.4 mg/dL | 0.5–1.6 mmol/L |
| LACTATE DEHYDROGENASE (AT 37°C)2 | ||
| (Major sources: Myocardium, liver, skeletal muscle, erythrocytes, platelets, and lymph nodes) | ||
| 0–4 days | 290–775 U/L | 290–775 U/L |
| 4–10 days | 545–2000 U/L | 545–2000 U/L |
| Table Continued | ||
| Conventional Units | SI Units | |
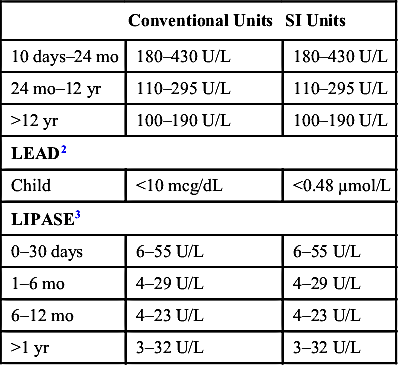
| 10 days–24 mo | 180–430 U/L | 180–430 U/L |
| 24 mo–12 yr | 110–295 U/L | 110–295 U/L |
| >12 yr | 100–190 U/L | 100–190 U/L |
| LEAD2 | ||
| Child | <10 mcg/dL | <0.48 µmol/L |
| LIPASE3 | ||
| 0–30 days | 6–55 U/L | 6–55 U/L |
| 1–6 mo | 4–29 U/L | 4–29 U/L |
| 6–12 mo | 4–23 U/L | 4–23 U/L |
| >1 yr | 3–32 U/L | 3–32 U/L |
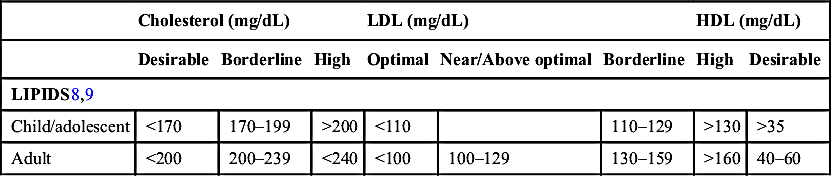
| Cholesterol (mg/dL) | LDL (mg/dL) | HDL (mg/dL) | ||||||
| Desirable | Borderline | High | Optimal | Near/Above optimal | Borderline | High | Desirable | |
| LIPIDS8,9 | ||||||||
| Child/adolescent | <170 | 170–199 | >200 | <110 | 110–129 | >130 | >35 | |
| Adult | <200 | 200–239 | <240 | <100 | 100–129 | 130–159 | >160 | 40–60 |
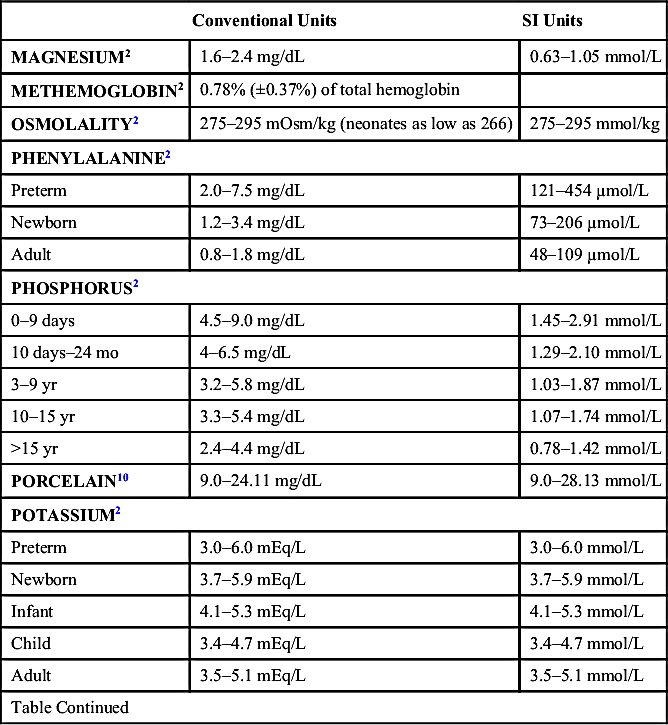
| Conventional Units | SI Units | |
| MAGNESIUM2 | 1.6–2.4 mg/dL | 0.63–1.05 mmol/L |
| METHEMOGLOBIN2 | 0.78% (±0.37%) of total hemoglobin | |
| OSMOLALITY2 | 275–295 mOsm/kg (neonates as low as 266) | 275–295 mmol/kg |
| PHENYLALANINE2 | ||
| Preterm | 2.0–7.5 mg/dL | 121–454 µmol/L |
| Newborn | 1.2–3.4 mg/dL | 73–206 µmol/L |
| Adult | 0.8–1.8 mg/dL | 48–109 µmol/L |
| PHOSPHORUS2 | ||
| 0–9 days | 4.5–9.0 mg/dL | 1.45–2.91 mmol/L |
| 10 days–24 mo | 4–6.5 mg/dL | 1.29–2.10 mmol/L |
| 3–9 yr | 3.2–5.8 mg/dL | 1.03–1.87 mmol/L |
| 10–15 yr | 3.3–5.4 mg/dL | 1.07–1.74 mmol/L |
| >15 yr | 2.4–4.4 mg/dL | 0.78–1.42 mmol/L |
| PORCELAIN10 | 9.0–24.11 mg/dL | 9.0–28.13 mmol/L |
| POTASSIUM2 | ||
| Preterm | 3.0–6.0 mEq/L | 3.0–6.0 mmol/L |
| Newborn | 3.7–5.9 mEq/L | 3.7–5.9 mmol/L |
| Infant | 4.1–5.3 mEq/L | 4.1–5.3 mmol/L |
| Child | 3.4–4.7 mEq/L | 3.4–4.7 mmol/L |
| Adult | 3.5–5.1 mEq/L | 3.5–5.1 mmol/L |
| Table Continued | ||
| Conventional Units | SI Units | |
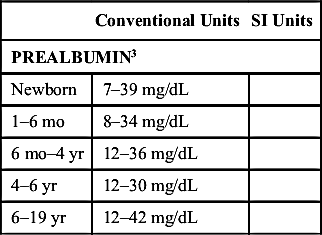
| PREALBUMIN3 | ||
| Newborn | 7–39 mg/dL | |
| 1–6 mo | 8–34 mg/dL | |
| 6 mo–4 yr | 12–36 mg/dL | |
| 4–6 yr | 12–30 mg/dL | |
| 6–19 yr | 12–42 mg/dL | |
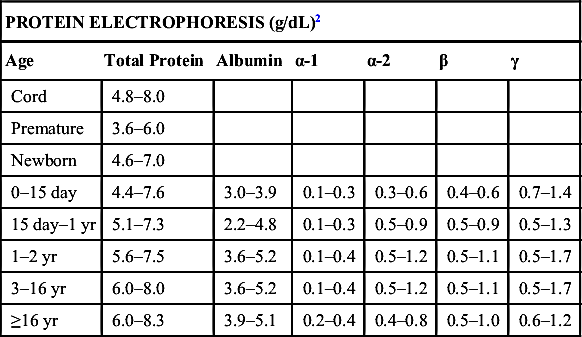
| PROTEIN ELECTROPHORESIS (g/dL)2 | ||||||
| Age | Total Protein | Albumin | α-1 | α-2 | β | γ |
| Cord | 4.8–8.0 | |||||
| Premature | 3.6–6.0 | |||||
| Newborn | 4.6–7.0 | |||||
| 0–15 day | 4.4–7.6 | 3.0–3.9 | 0.1–0.3 | 0.3–0.6 | 0.4–0.6 | 0.7–1.4 |
| 15 day–1 yr | 5.1–7.3 | 2.2–4.8 | 0.1–0.3 | 0.5–0.9 | 0.5–0.9 | 0.5–1.3 |
| 1–2 yr | 5.6–7.5 | 3.6–5.2 | 0.1–0.4 | 0.5–1.2 | 0.5–1.1 | 0.5–1.7 |
| 3–16 yr | 6.0–8.0 | 3.6–5.2 | 0.1–0.4 | 0.5–1.2 | 0.5–1.1 | 0.5–1.7 |
| ≥16 yr | 6.0–8.3 | 3.9–5.1 | 0.2–0.4 | 0.4–0.8 | 0.5–1.0 | 0.6–1.2 |
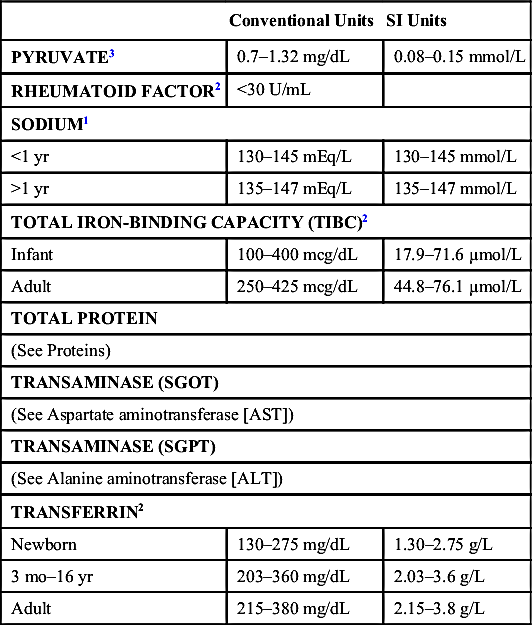
| Conventional Units | SI Units | |
| PYRUVATE3 | 0.7–1.32 mg/dL | 0.08–0.15 mmol/L |
| RHEUMATOID FACTOR2 | <30 U/mL | |
| SODIUM1 | ||
| <1 yr | 130–145 mEq/L | 130–145 mmol/L |
| >1 yr | 135–147 mEq/L | 135–147 mmol/L |
| TOTAL IRON-BINDING CAPACITY (TIBC)2 | ||
| Infant | 100–400 mcg/dL | 17.9–71.6 µmol/L |
| Adult | 250–425 mcg/dL | 44.8–76.1 µmol/L |
| TOTAL PROTEIN | ||
| (See Proteins) | ||
| TRANSAMINASE (SGOT) | ||
| (See Aspartate aminotransferase [AST]) | ||
| TRANSAMINASE (SGPT) | ||
| (See Alanine aminotransferase [ALT]) | ||
| TRANSFERRIN2 | ||
| Newborn | 130–275 mg/dL | 1.30–2.75 g/L |
| 3 mo–16 yr | 203–360 mg/dL | 2.03–3.6 g/L |
| Adult | 215–380 mg/dL | 2.15–3.8 g/L |
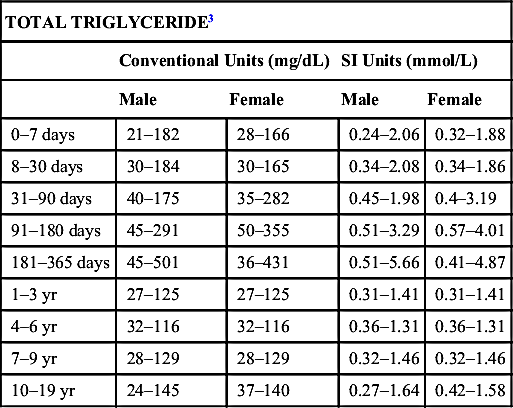
| TOTAL TRIGLYCERIDE3 | ||||
| Conventional Units (mg/dL) | SI Units (mmol/L) | |||
| Male | Female | Male | Female | |
| 0–7 days | 21–182 | 28–166 | 0.24–2.06 | 0.32–1.88 |
| 8–30 days | 30–184 | 30–165 | 0.34–2.08 | 0.34–1.86 |
| 31–90 days | 40–175 | 35–282 | 0.45–1.98 | 0.4–3.19 |
| 91–180 days | 45–291 | 50–355 | 0.51–3.29 | 0.57–4.01 |
| 181–365 days | 45–501 | 36–431 | 0.51–5.66 | 0.41–4.87 |
| 1–3 yr | 27–125 | 27–125 | 0.31–1.41 | 0.31–1.41 |
| 4–6 yr | 32–116 | 32–116 | 0.36–1.31 | 0.36–1.31 |
| 7–9 yr | 28–129 | 28–129 | 0.32–1.46 | 0.32–1.46 |
| 10–19 yr | 24–145 | 37–140 | 0.27–1.64 | 0.42–1.58 |
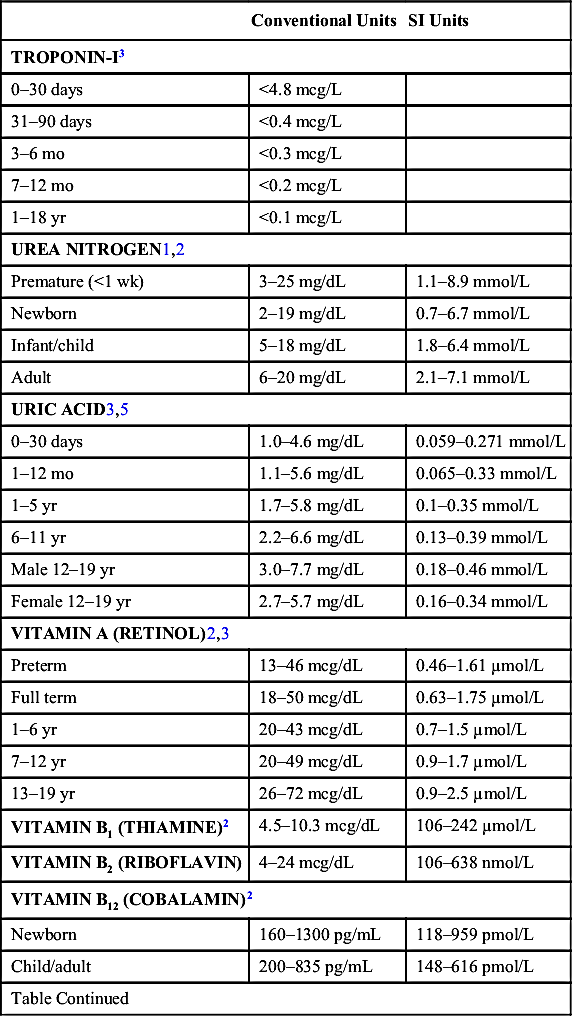
| Conventional Units | SI Units | |
| TROPONIN-I3 | ||
| 0–30 days | <4.8 mcg/L | |
| 31–90 days | <0.4 mcg/L | |
| 3–6 mo | <0.3 mcg/L | |
| 7–12 mo | <0.2 mcg/L | |
| 1–18 yr | <0.1 mcg/L | |
| UREA NITROGEN1,2 | ||
| Premature (<1 wk) | 3–25 mg/dL | 1.1–8.9 mmol/L |
| Newborn | 2–19 mg/dL | 0.7–6.7 mmol/L |
| Infant/child | 5–18 mg/dL | 1.8–6.4 mmol/L |
| Adult | 6–20 mg/dL | 2.1–7.1 mmol/L |
| URIC ACID3,5 | ||
| 0–30 days | 1.0–4.6 mg/dL | 0.059–0.271 mmol/L |
| 1–12 mo | 1.1–5.6 mg/dL | 0.065–0.33 mmol/L |
| 1–5 yr | 1.7–5.8 mg/dL | 0.1–0.35 mmol/L |
| 6–11 yr | 2.2–6.6 mg/dL | 0.13–0.39 mmol/L |
| Male 12–19 yr | 3.0–7.7 mg/dL | 0.18–0.46 mmol/L |
| Female 12–19 yr | 2.7–5.7 mg/dL | 0.16–0.34 mmol/L |
| VITAMIN A (RETINOL)2,3 | ||
| Preterm | 13–46 mcg/dL | 0.46–1.61 µmol/L |
| Full term | 18–50 mcg/dL | 0.63–1.75 µmol/L |
| 1–6 yr | 20–43 mcg/dL | 0.7–1.5 µmol/L |
| 7–12 yr | 20–49 mcg/dL | 0.9–1.7 µmol/L |
| 13–19 yr | 26–72 mcg/dL | 0.9–2.5 µmol/L |
| VITAMIN B1 (THIAMINE)2 | 4.5–10.3 mcg/dL | 106–242 µmol/L |
| VITAMIN B2 (RIBOFLAVIN) | 4–24 mcg/dL | 106–638 nmol/L |
| VITAMIN B12 (COBALAMIN)2 | ||
| Newborn | 160–1300 pg/mL | 118–959 pmol/L |
| Child/adult | 200–835 pg/mL | 148–616 pmol/L |
| Table Continued | ||
| Conventional Units | SI Units | |
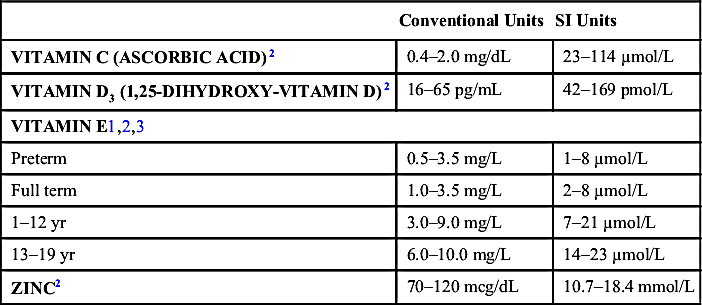
| VITAMIN C (ASCORBIC ACID)2 | 0.4–2.0 mg/dL | 23–114 µmol/L |
| VITAMIN D3 (1,25-DIHYDROXY-VITAMIN D)2 | 16–65 pg/mL | 42–169 pmol/L |
| VITAMIN E1,2,3 | ||
| Preterm | 0.5–3.5 mg/L | 1–8 µmol/L |
| Full term | 1.0–3.5 mg/L | 2–8 µmol/L |
| 1–12 yr | 3.0–9.0 mg/L | 7–21 µmol/L |
| 13–19 yr | 6.0–10.0 mg/L | 14–23 µmol/L |
| ZINC2 | 70–120 mcg/dL | 10.7–18.4 mmol/L |
∗ CREST: Calcinosis, Raynaud syndrome, Esophageal dysmotility, Sclerodactyly, Telangiectasia.
II. Evaluation of Body Fluids
A. Evaluation of Transudate versus Exudate (Table 27-2)
B. Evaluation of Cerebrospinal Fluid (Table 27-3)
C. Evaluation of Synovial Fluid (Table 27-4)
TABLE 27-2
Evaluation of Transudate VS. Exudate (Pleural, Pericardial, or Peritoneal Fluid)
| Measurement∗ | Transudate | Exudate† |
| Protein (g/dL) | <3.0 | >3.0 |
| Fluid/serum ratio | <0.5 | ≥0.5 |
| LDH (IU) | <200 | ≥200 |
| Fluid/serum ratio (isoenzymes not useful) | <0.6 | ≥0.6 |
| WBCs‡ | <10,000/µL | >10,000/µL |
| RBCs | <5000 | >5000 |
| Glucose | >40 | <40 |
| pH§ | >7.2 | <7.2 |
NOTE: Amylase >5000 U/mL or pleural fluid/serum ratio >1 suggests pancreatitis.
LDH, Lactate dehydrogenase; RBCs, red blood cells; WBCs, white blood cells.
∗ Always obtain serum for glucose, LDH, protein, amylase, etc.
† All of the following criteria do not have to be met for consideration as an exudate.
‡ In peritoneal fluid, WBC count >800/µL suggests peritonitis.
§ Collect anaerobically in a heparinized syringe.
Data from Nichols DG, Ackerman AD, Carcillo JA, et al. Rogers Textbook of Pediatric Intensive Care. 4th ed. Baltimore: Williams & Wilkins, 2008.
TABLE 27-3
Evaluation of Cerebrospinal Fluid
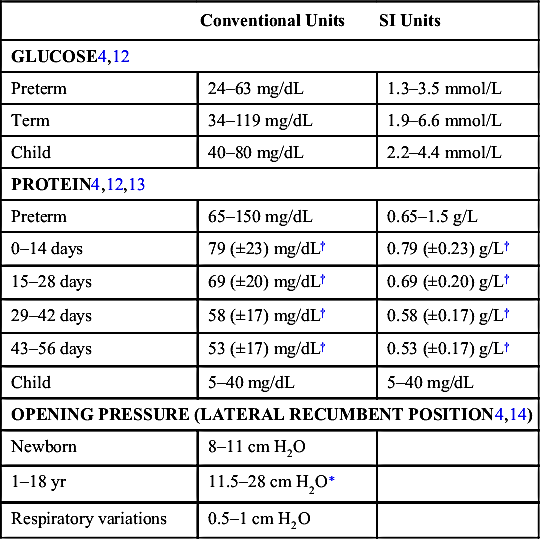
| Conventional Units | SI Units | |
| GLUCOSE4,12 | ||
| Preterm | 24–63 mg/dL | 1.3–3.5 mmol/L |
| Term | 34–119 mg/dL | 1.9–6.6 mmol/L |
| Child | 40–80 mg/dL | 2.2–4.4 mmol/L |
| PROTEIN4,12,13 | ||
| Preterm | 65–150 mg/dL | 0.65–1.5 g/L |
| 0–14 days | 79 (±23) mg/dL† | 0.79 (±0.23) g/L† |
| 15–28 days | 69 (±20) mg/dL† | 0.69 (±0.20) g/L† |
| 29–42 days | 58 (±17) mg/dL† | 0.58 (±0.17) g/L† |
| 43–56 days | 53 (±17) mg/dL† | 0.53 (±0.17) g/L† |
| Child | 5–40 mg/dL | 5–40 mg/dL |
| OPENING PRESSURE (LATERAL RECUMBENT POSITION4,14) | ||
| Newborn | 8–11 cm H2O | |
| 1–18 yr | 11.5–28 cm H2O∗ | |
| Respiratory variations | 0.5–1 cm H2O | |
∗ Up to 90th percentile.
† Mean (±SD).
TABLE 27-4
Characteristics of Synovial Fluid in the Rheumatic Diseases
| Group | Condition | Synovial Complement | Color/Clarity | Viscosity | Mucin Clot | WBC Count | PMN (%) | Miscellaneous Findings |
| Noninflammatory | Normal | N | Yellow Clear | ↑↑ | G | <200 | <25 | |
| Traumatic arthritis | N | Xanthochromic Turbid | ↑ | F–G | <2000 | <25 | Debris | |
| Osteoarthritis | N | Yellow Clear | ↑ | F–G | 1000 | <25 | ||
| Inflammatory | Systemic lupus erythematosus | ↓ | Yellow Clear | N | N | 5000 | 10 | Lupus cells |
| Rheumatic fever | N–↑ | Yellow Cloudy | ↓ | F | 5000 | 10–50 | ||
| Juvenile rheumatoid arthritis | N–↓ | Yellow Cloudy | ↓ | Poor | 15,000–20,000 | 75 | ||
| Reiter syndrome | ↑ | Yellow Opaque | ↓ | Poor | 20,000 | 80 | Reiter cells | |
| Pyogenic | Tuberculous arthritis | N–↑ | Yellow-white Cloudy | ↓ | Poor | 25,000 | 50–60 | Acid-fast bacteria |
| Septic arthritis | ↑ | Serosanguineous Turbid | ↓ | Poor | 50,000–300,000 | >75 | Low glucose, bacteria |
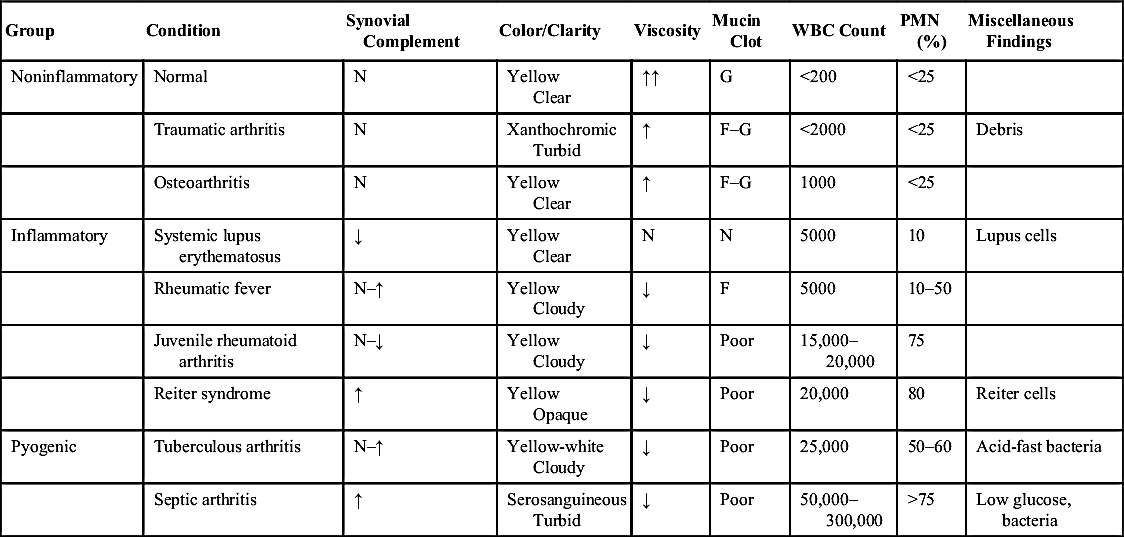
F, Fair; G, good; H, high; N, normal; PMN, polymorphonuclear leukocyte; WBC, white blood cell; ↓, decreased; ↑, increased.
From Cassidy JT, Petty RE. Textbook of Pediatric Rheumatology. 5th ed. Philadelphia: WB Saunders, 2005.
III. Conversion Formulas
A. Temperature
1. To convert degrees Celsius to degrees Fahrenheit:

2. To convert degrees Fahrenheit to degrees Celsius:

B. Length and Weight
1. Length: To convert inches to centimeters, multiply by 2.54.
2. Weight: To convert pounds to kilograms, divide by 2.2.