The Normal Electrocardiogram
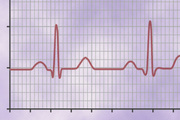
When the cardiac impulse passes through the heart, electrical current also spreads from the heart into the adjacent tissues surrounding the heart. A small portion of the current spreads all the way to the surface of the body. If electrodes are placed on the skin on opposite sides of the heart, electrical potentials generated by the current can be recorded; the recording is known as an electrocardiogram (ECG). A normal ECG for two beats of the heart is shown in Figure 11-1.
Characteristics of the Normal Electrocardiogram
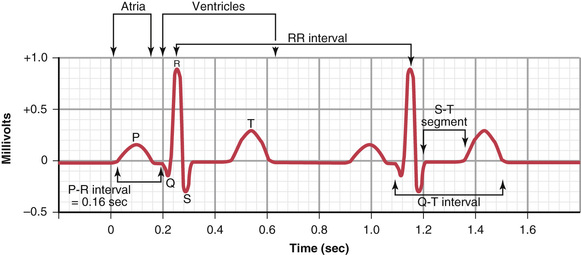
The normal ECG (see Figure 11-1) is composed of a P wave, a QRS complex, and a T wave. The QRS complex is often, but not always, three separate waves: the Q wave, the R wave, and the S wave.
The P wave is caused by electrical potentials generated when the atria depolarize before atrial contraction begins. The QRS complex is caused by potentials generated when the ventricles depolarize before contraction, that is, as the depolarization wave spreads through the ventricles. Therefore, both the P wave and the components of the QRS complex are depolarization waves.
The T wave is caused by potentials generated as the ventricles recover from the state of depolarization. This process normally occurs in ventricular muscle 0.25 to 0.35 second after depolarization. The T wave is known as a repolarization wave.
Thus, the ECG is composed of both depolarization and repolarization waves. The principles of depolarization and repolarization are discussed in Chapter 5. The distinction between depolarization waves and repolarization waves is so important in electrocardiography that further clarification is necessary.
Depolarization Waves Versus Repolarization Waves
Figure 11-2 shows a single cardiac muscle fiber in four stages of depolarization and repolarization, with the color red designating depolarization. During depolarization, the normal negative potential inside the fiber reverses and becomes slightly positive inside and negative outside.
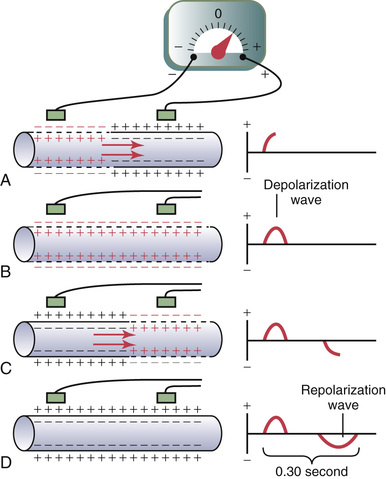
In Figure 11-2A, depolarization, demonstrated by red positive charges inside and red negative charges outside, is traveling from left to right. The first half of the fiber has already depolarized, while the remaining half is still polarized. Therefore, the left electrode on the outside of the fiber is in an area of negativity, and the right electrode is in an area of positivity, which causes the meter to record positively. To the right of the muscle fiber is shown a record of changes in potential between the two electrodes, as recorded by a high-speed recording meter. Note that when depolarization has reached the halfway mark in Figure 11-2A, the record has risen to a maximum positive value.
In Figure 11-2B, depolarization has extended over the entire muscle fiber, and the recording to the right has returned to the zero baseline because both electrodes are now in areas of equal negativity. The completed wave is a depolarization wave because it results from spread of depolarization along the muscle fiber membrane.
Figure 11-2C shows halfway repolarization of the same muscle fiber, with positivity returning to the outside of the fiber. At this point, the left electrode is in an area of positivity, and the right electrode is in an area of negativity. This polarity is opposite to the polarity in Figure 11-2A. Consequently, the recording, as shown to the right, becomes negative.
In Figure 11-2D, the muscle fiber has completely repolarized, and both electrodes are now in areas of positivity so that no potential difference is recorded between them. Thus, in the recording to the right, the potential returns once more to zero. This completed negative wave is a repolarization wave because it results from spread of repolarization along the muscle fiber membrane.
Relation of the Monophasic Action Potential of Ventricular Muscle to the QRS and T Waves in the Standard Electrocardiogram.
The monophasic action potential of ventricular muscle, discussed in Chapter 10, normally lasts between 0.25 and 0.35 second. The top part of Figure 11-3 shows a monophasic action potential recorded from a microelectrode inserted to the inside of a single ventricular muscle fiber. The upsweep of this action potential is caused by depolarization, and the return of the potential to the baseline is caused by repolarization.
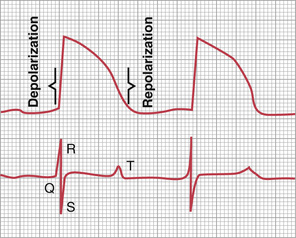
The lower half of Figure 11-3 shows a simultaneous recording of the ECG from this same ventricle. Note that the QRS waves appear at the beginning of the monophasic action potential and the T wave appears at the end. Note especially that no potential is recorded in the ECG when the ventricular muscle is either completely polarized or completely depolarized. Only when the muscle is partly polarized and partly depolarized does current flow from one part of the ventricles to another part, and therefore current also flows to the surface of the body to produce the ECG.
Relationship of Atrial and Ventricular Contraction to the Waves of the Electrocardiogram
Before contraction of muscle can occur, depolarization must spread through the muscle to initiate the chemical processes of contraction. Refer again to Figure 11-1; the P wave occurs at the beginning of contraction of the atria, and the QRS complex of waves occurs at the beginning of contraction of the ventricles. The ventricles remain contracted until after repolarization has occurred, that is, until after the end of the T wave.
The atria repolarize about 0.15 to 0.20 second after termination of the P wave, which is also approximately when the QRS complex is being recorded in the ECG. Therefore, the atrial repolarization wave, known as the atrial T wave, is usually obscured by the much larger QRS complex. For this reason, an atrial T wave seldom is observed on the ECG.
The ventricular repolarization wave is the T wave of the normal ECG. Ordinarily, ventricular muscle begins to repolarize in some fibers about 0.20 second after the beginning of the depolarization wave (the QRS complex), but in many other fibers, it takes as long as 0.35 second. Thus, the process of ventricular repolarization extends over a long period, about 0.15 second. For this reason, the T wave in the normal ECG is a prolonged wave, but the voltage of the T wave is considerably less than the voltage of the QRS complex, partly because of its prolonged length.
Voltage and Time Calibration of the Electrocardiogram
All recordings of ECGs are made with appropriate calibration lines on the recording paper. Either these calibration lines are already ruled on the paper, as is the case when a pen recorder is used, or they are recorded on the paper at the same time that the ECG is recorded, which is the case with the photographic types of electrocardiographs.
As shown in Figure 11-1, the horizontal calibration lines are arranged so that 10 of the small line divisions upward or downward in the standard ECG represent 1 millivolt, with positivity in the upward direction and negativity in the downward direction.
The vertical lines on the ECG are time calibration lines. A typical ECG is run at a paper speed of 25 millimeters per second, although faster speeds are sometimes used. Therefore, each 25 millimeters in the horizontal direction is 1 second, and each 5-millimeter segment, indicated by the dark vertical lines, represents 0.20 second. The 0.20-second intervals are then broken into five smaller intervals by thin lines, each of which represents 0.04 second.
Normal Voltages in the Electrocardiogram.
The recorded voltages of the waves in the normal ECG depend on the manner in which the electrodes are applied to the surface of the body and how close the electrodes are to the heart. When one electrode is placed directly over the ventricles and a second electrode is placed elsewhere on the body remote from the heart, the voltage of the QRS complex may be as great as 3 to 4 millivolts. Even this voltage is small in comparison with the monophasic action potential of 110 millivolts recorded directly at the heart muscle membrane. When ECGs are recorded from electrodes on the two arms or on one arm and one leg, the voltage of the QRS complex usually is 1.0 to 1.5 millivolts from the top of the R wave to the bottom of the S wave, the voltage of the P wave is between 0.1 and 0.3 millivolts, and the voltage of the T wave is between 0.2 and 0.3 millivolts.
P-Q or P-R Interval.
The time between the beginning of the P wave and the beginning of the QRS complex is the interval between the beginning of electrical excitation of the atria and the beginning of excitation of the ventricles. This period is called the P-Q interval. The normal P-Q interval is about 0.16 second. (Often this interval is called the P-R interval because the Q wave is likely to be absent.)
Q-T Interval.
Contraction of the ventricle lasts almost from the beginning of the Q wave (or R wave, if the Q wave is absent) to the end of the T wave. This interval is called the Q-T interval and ordinarily is about 0.35 second.
Rate of Heartbeat as Determined from the Electrocardiogram.
The rate of the heartbeat can be determined easily from an ECG because the heart rate is the reciprocal of the time interval between two successive heartbeats. If the interval between two beats as determined from the time calibration lines is 1 second, the heart rate is 60 beats per minute. The normal interval between two successive QRS complexes in an adult is about 0.83 second, which is a heart rate of 60/0.83 times per minute, or 72 beats/min.
Flow of Current Around the Heart During the Cardiac Cycle
Recording Electrical Potentials from a Partially Depolarized Mass of Syncytial Cardiac Muscle
Figure 11-4 shows a syncytial mass of cardiac muscle that has been stimulated at its centralmost point. Before stimulation, all the exteriors of the muscle cells had been positive and the interiors had been negative. For reasons presented in Chapter 5 in the discussion of membrane potentials, as soon as an area of cardiac syncytium becomes depolarized, negative charges leak to the outsides of the depolarized muscle fibers, making this part of the surface electronegative, as represented by the minus signs in Figure 11-4. The remaining surface of the heart, which is still polarized, is represented by the plus signs. Therefore, a meter connected with its negative terminal on the area of depolarization and its positive terminal on one of the still-polarized areas, as shown to the right in the figure, records positively.
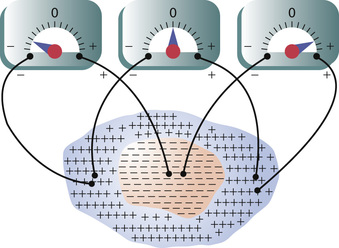
Two other electrode placements and meter readings are also demonstrated in Figure 11-4. These placements and readings should be studied carefully, and the reader should be able to explain the causes of the respective meter readings. Because the depolarization spreads in all directions through the heart, the potential differences shown in the figure persist for only a few thousandths of a second, and the actual voltage measurements can be accomplished only with a high-speed recording apparatus.
Flow of Electrical Currents in the Chest Around the Heart
Figure 11-5 shows the ventricular muscle lying within the chest. Even the lungs, although mostly filled with air, conduct electricity to a surprising extent, and fluids in other tissues surrounding the heart conduct electricity even more easily. Therefore, the heart is actually suspended in a conductive medium. When one portion of the ventricles depolarizes and therefore becomes electronegative with respect to the remainder, electrical current flows from the depolarized area to the polarized area in large circuitous routes, as noted in the figure.
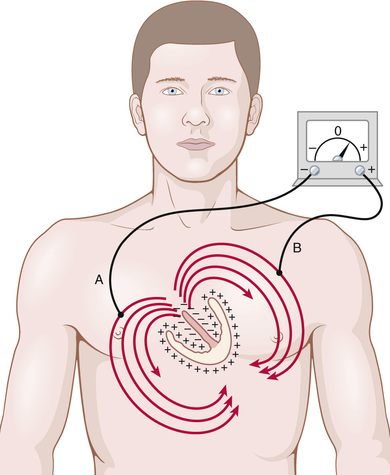
It should be recalled from the discussion of the Purkinje system in Chapter 10 that the cardiac impulse first arrives in the ventricles in the septum and shortly thereafter spreads to the inside surfaces of the remainder of the ventricles, as shown by the red areas and the negative signs in Figure 11-5. This process provides electronegativity on the insides of the ventricles and electropositivity on the outer walls of the ventricles, with electrical current flowing through the fluids surrounding the ventricles along elliptical paths, as demonstrated by the curving arrows in the figure. If one algebraically averages all the lines of current flow (the elliptical lines), one finds that the average current flow occurs with negativity toward the base of the heart and with positivity toward the apex.
During most of the remainder of the depolarization process, current also continues to flow in this same direction, while depolarization spreads from the endocardial surface outward through the ventricular muscle mass. Then, immediately before depolarization has completed its course through the ventricles, the average direction of current flow reverses for about 0.01 second, flowing from the ventricular apex toward the base, because the last part of the heart to become depolarized is the outer walls of the ventricles near the base of the heart.
Thus, in normal heart ventricles, current flows from negative to positive primarily in the direction from the base of the heart toward the apex during almost the entire cycle of depolarization, except at the very end. If a meter is connected to electrodes on the surface of the body as shown in Figure 11-5, the electrode nearer the base will be negative, whereas the electrode nearer the apex will be positive, and the recording meter will show positive recording in the ECG.
Electrocardiographic Leads
Three Bipolar Limb Leads
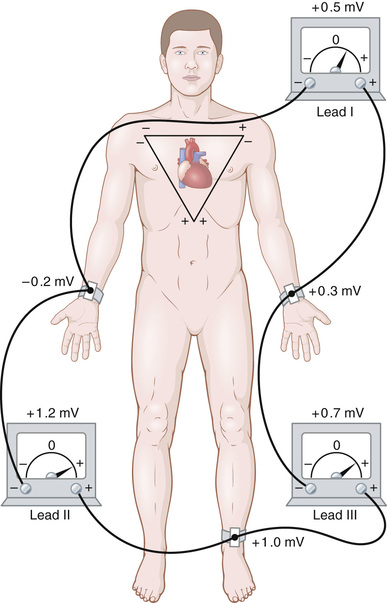
Figure 11-6 shows electrical connections between the patient's limbs and the electrocardiograph for recording ECGs from the so-called standard bipolar limb leads. The term “bipolar” means that the electrocardiogram is recorded from two electrodes located on different sides of the heart—in this case, on the limbs. Thus, a “lead” is not a single wire connecting from the body but a combination of two wires and their electrodes to make a complete circuit between the body and the electrocardiograph. The electrocardiograph in each instance is represented by an electrical meter in the diagram, although the actual electrocardiograph is a high-speed computer-based system with an electronic display.
Lead I.
In recording limb lead I, the negative terminal of the electrocardiograph is connected to the right arm and the positive terminal is connected to the left arm. Therefore, when the point where the right arm connects to the chest is electronegative with respect to the point where the left arm connects, the electrocardiograph records positively, that is, above the zero voltage line in the ECG. When the opposite is true, the electrocardiograph records below the line.
Lead II.
To record limb lead II, the negative terminal of the electrocardiograph is connected to the right arm and the positive terminal is connected to the left leg. Therefore, when the right arm is negative with respect to the left leg, the electrocardiograph records positively.
Lead III.
To record limb lead III, the negative terminal of the electrocardiograph is connected to the left arm and the positive terminal is connected to the left leg. This configuration means that the electrocardiograph records positively when the left arm is negative with respect to the left leg.
Einthoven's Triangle.
In Figure 11-6, the triangle, called Einthoven's triangle, is drawn around the area of the heart. This triangle illustrates that the two arms and the left leg form apices of a triangle surrounding the heart. The two apices at the upper part of the triangle represent the points at which the two arms connect electrically with the fluids around the heart, and the lower apex is the point at which the left leg connects with the fluids.
Einthoven's Law.
Einthoven's law states that if the ECGs are recorded simultaneously with the three limb leads, the sum of the potentials recorded in leads I and III will equal the potential in lead II.

In other words, if the electrical potentials of any two of the three bipolar limb electrocardiographic leads are known at any given instant, the third one can be determined by simply summing the first two. Note, however, that the positive and negative signs of the different leads must be observed when making this summation.
For instance, let us assume that momentarily, as noted in Figure 11-6, the right arm is −0.2 millivolts (negative) with respect to the average potential in the body, the left arm is +0.3 millivolts (positive), and the left leg is +1.0 millivolts (positive). Observing the meters in the figure, one can see that lead I records a positive potential of +0.5 millivolts because this is the difference between the −0.2 millivolts on the right arm and the +0.3 millivolts on the left arm. Similarly, lead III records a positive potential of +0.7 millivolts, and lead II records a positive potential of +1.2 millivolts because these are the instantaneous potential differences between the respective pairs of limbs.
Now, note that the sum of the voltages in leads I and III equals the voltage in lead II; that is, 0.5 plus 0.7 equals 1.2. Mathematically, this principle, called Einthoven's law, holds true at any given instant while the three “standard” bipolar ECGs are being recorded.
Normal Electrocardiograms Recorded from the Three Standard Bipolar Limb Leads.
Figure 11-7 shows recordings of the ECGs in leads I, II, and III. It is obvious that the ECGs in these three leads are similar to one another because they all record positive P waves and positive T waves, and the major portion of the QRS complex is also positive in each ECG.

On analysis of the three ECGs, it can be shown, with careful measurements and proper observance of polarities, that at any given instant the sum of the potentials in leads I and III equals the potential in lead II, thus illustrating the validity of Einthoven's law.
Because the recordings from all the bipolar limb leads are similar to one another, it does not matter greatly which lead is recorded when one wants to diagnose different cardiac arrhythmias, because diagnosis of arrhythmias depends mainly on the time relations between the different waves of the cardiac cycle. However, when one wants to diagnose damage in the ventricular or atrial muscle or in the Purkinje conducting system, it matters greatly which leads are recorded because abnormalities of cardiac muscle contraction or cardiac impulse conduction change the patterns of the ECGs markedly in some leads yet may not affect other leads. Electrocardiographic interpretation of these two types of conditions—cardiac myopathies and cardiac arrhythmias—is discussed separately in Chapters 12 and 13.
Chest Leads (Precordial Leads)
Often ECGs are recorded with one electrode placed on the anterior surface of the chest directly over the heart at one of the points shown in Figure 11-8. This electrode is connected to the positive terminal of the electrocardiograph, and the negative electrode, called the indifferent electrode, is connected through equal electrical resistances to the right arm, left arm, and left leg all at the same time, as also shown in the figure. Usually six standard chest leads are recorded, one at a time, from the anterior chest wall, with the chest electrode being placed sequentially at the six points shown in the diagram. The different recordings are known as leads V1, V2, V3, V4, V5, and V6.
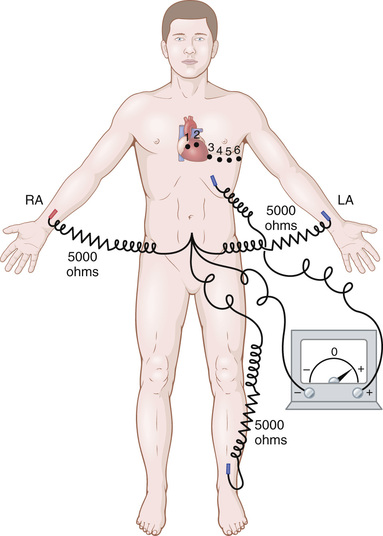
Figure 11-9 illustrates the ECGs of the healthy heart as recorded from these six standard chest leads. Because the heart surfaces are close to the chest wall, each chest lead records mainly the electrical potential of the cardiac musculature immediately beneath the electrode. Therefore, relatively minute abnormalities in the ventricles, particularly in the anterior ventricular wall, can cause marked changes in the ECGs recorded from individual chest leads.

In leads V1 and V2, the QRS recordings of the normal heart are mainly negative because, as shown in Figure 11-8, the chest electrode in these leads is nearer to the base of the heart than to the apex, and the base of the heart is the direction of electronegativity during most of the ventricular depolarization process. Conversely, the QRS complexes in leads V4, V5, and V6 are mainly positive because the chest electrode in these leads is nearer the heart apex, which is the direction of electropositivity during most of depolarization.
Augmented Unipolar Limb Leads
Another system of leads in wide use is the augmented unipolar limb lead. In this type of recording, two of the limbs are connected through electrical resistances to the negative terminal of the electrocardiograph, and the third limb is connected to the positive terminal. When the positive terminal is on the right arm, the lead is known as the aVR lead; when on the left arm, it is known as the aVL lead; and when on the left leg, it is known as the aVF lead.
Normal recordings of the augmented unipolar limb leads are shown in Figure 11-10. They are all similar to the standard limb lead recordings, except that the recording from the aVR lead is inverted. (Why does this inversion occur? Study the polarity connections to the electrocardiograph to determine the answer to this question.)

Methods for Recording Electrocardiograms
 Sometimes the electrical currents generated by the cardiac muscle during each beat of the heart change electrical potentials and polarities on the respective sides of the heart in less than 0.01 second. Therefore, it is essential that any apparatus for recording ECGs be capable of responding rapidly to these changes in potentials. Modern clinical electrocardiographs use computer-based systems and electronic display.
 Ambulatory Electrocardiography
Standard ECGs provide assessment of cardiac electrical events over a brief duration, usually while the patient is resting. In conditions associated with infrequent but important abnormalities of cardiac rhythms, it may be useful to examine the ECG over a longer period, thereby permitting evaluation of changing cardiac electrical phenomena that are transient and may be missed with a standard ECG. Extending the ECG to allow assessment of cardiac electrical events while the patient is ambulating during normal daily activities is called ambulatory electrocardiography.
Ambulatory ECG monitoring is typically used when a patient demonstrates symptoms that are thought to be caused by transient arrhythmias or other transient cardiac abnormalities. These symptoms may include chest pain, syncope (fainting) or near syncope, dizziness, and irregular heartbeats. The crucial information needed to diagnose serious, transient arrhythmias or other cardiac conditions is a recording of an ECG during the precise time that the symptom is occurring. Because the day-to-day variability in the frequency of arrhythmias is substantial, detection often requires ambulatory ECG monitoring throughout the day.
There are two categories of ambulatory ECG recorders: (1) continuous recorders, typically used for 24 to 48 hours to investigate the relationship of symptoms and ECG events that are likely to occur within that time frame, and (2) intermittent recorders, which are used for longer periods (weeks to months) to provide brief, intermittent recordings for detection of events that occur infrequently. In some cases a small device, about the size of a pack of chewing gum and called an implantable loop recorder, is implanted just under the skin in the chest to monitor the heart's electrical activity intermittently for as long as 2 to 3 years. The device can be programmed to initiate a recording when the heart rate fall below, or rises above, a predetermined level, or it can be activated manually by the patient when a symptom such as dizziness occurs. Improvements in solid-state digital technology and recorders equipped with microprocessors now permit continuous or intermittent transmission of digital ECG data over phone lines, and sophisticated software systems provide rapid “online” computerized analysis of the data as they are acquired. 