Laboratory Techniques for Recognition of Endocrine Disorders
Patrick M. Sluss, Frances J. Hayes
• The practice of endocrinology relies heavily on accurate laboratory measurements. Small changes in hormone levels, biomarkers, or molecular markers are often more specific and earlier indicators of disease than the appearance of physical symptoms.
• Analytic methods for assessing endocrine problems are continually expanding. Traditional measurement of endocrine factors, protein, and steroid hormones and related factors has been supplemented by a wide array of disease biomarkers, particularly with respect to endocrine cancers.
• Newer systems are often manufactured outside the laboratory. Although the configurations are generally more “user friendly,” they also become more of a “black box,” concealing most of the details of the system. Numeric values, especially when reported to several decimal places, can falsely suggest levels of accuracy and reproducibility beyond the technical limits of the technology employed.
• Understanding the basic principles of method validation and quality control is essential if endocrinologists are to be able to assess the reliability and robustness of numeric values reported and to work effectively with the laboratory to reconcile test values that do not match clinical presentations.
• Laboratory testing as practiced today contributes significantly, both directly and indirectly, to the cost of care, which over the past decade or so has increased faster than improvements in clinical outcomes. Clinicians and pathologists are increasingly required to understand the inner workings of laboratory medicine and work as a team in determining optimal management strategies to contain the costs of care without compromising quality.

Endocrinology is a practice of medicine that is highly dependent on accurate laboratory measurements. Small changes in hormone levels, biomarkers, or molecular markers often may be more specific and more sensitive for early disease detection (or risk) than the classic physical signs and symptoms. Most endocrinologists no longer have facilities to develop and validate laboratory assays. They must rely on centralized hospital or commercial reference laboratories. Understanding the nuances of laboratory testing can greatly aid the clinician in working with the laboratory, particularly when faced with disparate clinical observations and laboratory results.
Laboratory testing as practiced today contributes significantly, both directly and indirectly, to the cost of care, which over the past decade or so has increased faster than improvements in clinical outcomes.1 Current treatment guidelines, especially in endocrine practice, rely heavily on early laboratory testing. Thus, clinicians and pathologists are increasingly required to understand the inner workings of laboratory medicine and work as a team in determining optimal management strategies to contain the costs of care without compromising quality.
This chapter provides an overview of the analytic techniques typically used for diagnosing and monitoring the progress of endocrine disorders. Historically the quantitative measurement of endocrine factors, protein, and steroid hormones and related factors, such as steroid binding proteins, in blood and urine has been the primary goal. More recently, a wide array of disease biomarkers, particularly with respect to endocrine cancers, have become valuable targets for measurement in the clinical laboratory. Analytic validation is then discussed. The parameters of analytic validation are not method specific, and principles are presented to help endocrinologists better assess the performance of the analytic systems that they are using. Techniques used by clinical laboratories to control and assure quality testing results and services follow to provide guidance in appreciating the reliability and robustness of numeric values reported and in working with the laboratory to reconcile test values that do not match clinical presentations. Finally, especially for the academic practitioner, the classes of assays are discussed to provide some clarity on the regulatory requirements laboratories are required to meet in providing test results for patient care, federally supported human studies, and federally regulated clinical trials.
Laboratory Methods
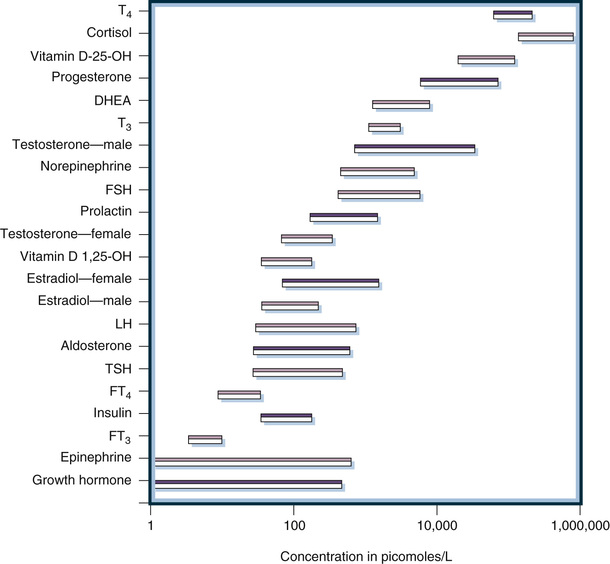
Historically, laboratory methods unique to the clinical practice of endocrinology were directed at the measurement of peripheral levels of hormones or hormone metabolites in urine. This measurement is analytically challenging because concentrations of most hormones are much lower than those of general chemistry analytes. Specialized techniques are necessary to measure these low concentrations that can be reported in molar units, mass units, or standardized units, such as the World Health Organization (WHO) International Unit (IU). Figure 6-1 illustrates the concentrations of representative hormones in plasma from healthy individuals. Expressed in molar units to allow direct comparisons, peripheral hormone levels range from 10−6 to 10−12 mol/L (i.e., micromolar to picomolar concentrations). Thus, clinically useful analytic methods must have exquisite sensitivity. Furthermore, as also illustrated in Figure 6-1, the range of concentrations is very broad (often several orders of magnitude), necessitating methods with a very wide dynamic range of measurement. Antibody-based methods are ideally suited to achieve sensitivity and wide dynamic ranges and were the first methods successfully used both to define endocrine systems and to be applied clinically in patient care. Because of their suitability for cost effectiveness, high throughput, and potential for automation, antibody methods replaced earlier chromatographic/mass spectrometric methods that were used in the discovery and characterization of hormones, particularly steroid hormones. Initially, competitive binding assays using polyclonal antibodies were utilized; then with the development of monoclonal antibody technology in the 1980s immunometric, or double antibody, methods were utilized. Both of these analytic designs are automated and are in widespread use today: competitive binding assays are used for measuring small molecules and immunometric assay is used for measuring antigens containing multiple antibody-binding epitopes (i.e., protein hormones and biomarkers).
As will be discussed in detail later, antibody-based assays are subject to interference and lack of specificity that can result in inaccurate measurements. Even when a given assay has been well validated and reference intervals are known (see discussion under “Analytic Validation”), this limitation is manifest as producing measurements that are method specific, vitiating the ability of clinicians to compare measurements reported using different assays (e.g., assays from different laboratories) for the same hormone or biomarker. Although preanalytic methods such as extraction and chromatography have been tried to improve the accuracy of immunoassays used in research settings, these methods are very seldom utilized in clinical laboratories today because of their high cost, complexity, and lack of commercial availability; all are by definition laboratory developed tests (see “Classes of Assays”).
Since the early 2000s, technological advances in mass spectrometry–based assay systems have led to the rapid and ongoing replacement of antibody-based methods for the clinical measurement of hormones and biomarkers relevant to the endocrine practice. Currently these more complex and expensive methods are utilized primarily by commercial reference and large academic hospital laboratories, but as the technology becomes more cost effective and user friendly its use will clearly increase. Thus, it is important for clinicians to appreciate the principles of these assays as well as those of the older, albeit still widely used, antibody-based methods.
The final technologies considered in this section are molecular-based assays. These methods are not specifically designed for endocrine practice but are generic for identifying and in some cases quantifying genetic variance. Subsequent to the sequencing of the human genome and the continuing evolution of molecular methods and knowledge, these methods are rapidly penetrating endocrine practice. Although these methods are still in the early stages of clinical use and generally require specialized informatics and interpretative support, laboratories are increasingly providing molecular-based testing with respect to determining endocrine cancers, inherited disease, and individualized therapeutics.
Antibody-Based Methods
Classic Competitive Binding Immunoassays
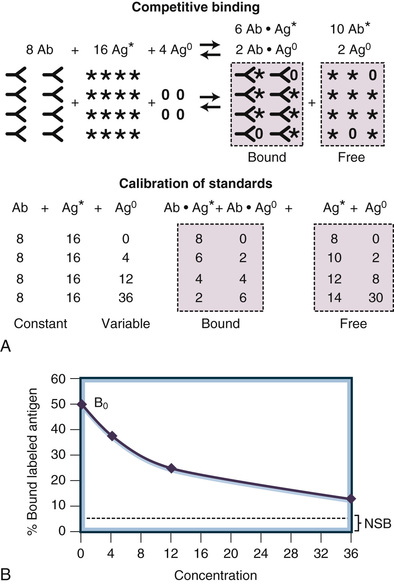
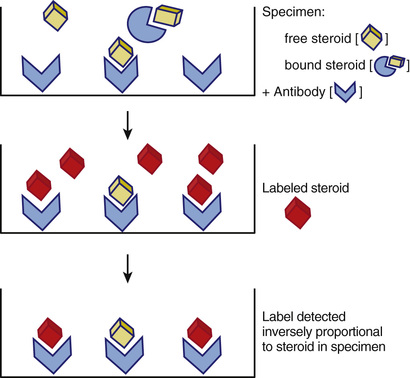
The term competitive binding assay refers to a measurement method in which an analyte (e.g., a hormone or biomarker) in a specimen competes with labeled reagent analyte for a limited number of binding sites on a binding protein. The earliest clinical assays used for the measurement of circulating concentrations of endocrine hormones utilized radioisotope-labeled analyte and antibodies in the classic radioimmunoassay format illustrated in Figure 6-2. The three basic components of a competitive immunoassay are antibody, labeled analyte, and unlabeled analyte.2,3 The basic principle of this methodology is to allow an equilibrium or steady-state condition (e.g., competition) to be established between a labeled analyte and the unlabeled analyte in calibrators or specimens binding to the antibody. The reaction obeys the law of mass action and is driven by the affinity of the antibody as shown in Figure 6-2. If the concentrations of antibody and labeled analyte are held constant, the amount of labeled analyte bound is inversely proportional to the concentration of the competing unlabeled analyte, as illustrated in Figure 6-3. By comparing the percentage of bound antigen (% [Bound/Total]) generated by an unknown specimen to the dose-response curve generated by known concentrations of analyte (see Fig. 6-3B), the amount of analyte in a specimen can be quantified.

Competitive antibody-based assays are referred to generically as immunoassays. The analytic sensitivity of a competitive immunoassay is approximately inversely related to the affinity of the antiserum, such that an antiserum with an affinity constant of 109 L/M can be used to measure analytes in the nanomolar concentration range. This methodology has evolved significantly since the development of the prototypical radioimmunoassay in the late 1950s. Currently, although radioimmunoassays still have a role in the research laboratory, the immunoassays most widely utilized in clinical endocrine testing are fully automated, nonisotopic instrument systems whose manufacture and reagents are regulated by the Food and Drug Administration (FDA). Each of the component parts of the competitive immunoassay is discussed in detail later in this chapter.
Antibody.
Antibodies are ideal as the binding component in a competitive binding assay that is highly specific and can measure very low concentrations of analyte in complex mixtures such as serum or plasma. Antibodies are inherently specific and both their specificity and affinity can be manipulated in developing immunoassays. Immunoassays developed prior to the mid-1980s relied upon polyclonal antiserum produced in animals. Limited quantities of high-affinity antisera that react primarily with the specific target antigen are obtained and can be used either as diluted antiserum or, most often, as purified immunoglobulins.
A polyclonal antiserum represents a composite of many immunologic clones, with each clone having a different affinity and different antigenic epitope specificity. Most clones have affinities in the 107 to 109 L/M range. The affinity of the antiserum or purified immunoglobulins for the analyte (i.e., the immunogen) is the sum of the affinities of all the various clones. Antisera used in immunoassays typically have affinity constants above the 1012 L/M range and can easily measure picomolar concentrations of analyte in biologic fluids. Various techniques are used to develop a specific antiserum. For example, the antigen may be altered chemically to block cross-reacting epitopes either before or after immunization. Historically, immunoaffinity purification of antiserum to obtain epitope-specific immunoglobulins has been effectively used, and this technology can also be applied to preanalytic assay steps to enhance the specificity of immunoassays as well as chromatographic or mass spectrometric assays by selecting or eliminating cross-reacting factors.4-6 The major disadvantage of a polyclonal antiserum is the limited quantity produced. Commercial manufacturers require large quantities of immunoassay reagents to support a large number of laboratories, and these reagents require rigorous validation. Thus, the majority of commercial immunoassay systems available today are based on monoclonal antibodies that can be produced in virtually limitless quantities.
Monoclonal antisera are used in most current immunoassays and are required for immunometric assays because they are epitope, as opposed to antigen, specific and can be produced virtually without limit. These antibodies are obtained by immunizing animals using techniques similar to those used for polyclonal antisera. Instead of harvesting the antisera from the blood, lymphocytes from the spleen are fused with myeloma cells to make cells (hybridomas) that will grow in culture continuously and produce monospecific antibodies.7-10 These fused cells are separated into clones by means of serial plating techniques similar to those used in subculturing bacteria. The supernatant of these monoclonal cell lines (or ascites fluid if the cells are transplanted into carrier mice) contains monoclonal antisera. The selection processes used to separate the initial clones can be targeted to identify specific clones, producing antibodies with high affinities and low cross-reactivity to related compounds.11
In addition to the ability to produce limitless quantities of antibody, the epitope specificity of monoclonal antibodies allows assays to be designed for large analytes (containing multiple nonoverlapping epitopes), which do not depend on competition; these immunometric assays are often referred to as two-site or sandwich assays (see later). However, the high specificity of monoclonal-based assays can cause problems for some endocrine assays. Many hormones circulate in the blood as heterogeneous mixtures of multiple biologically active forms. Some of these forms are caused by genetic differences in patients, and others are related to metabolic precursors and degradation products of the hormone. Genetic differences cause some patients to produce variant forms of a hormone such as luteinizing hormone (LH). These genetic differences can cause marked variations in measurements made using assays with specific monoclonals, compared with more uniform measurements made using assays with polyclonal antisera that cross-react with the multiple forms.12 Well-characterized monoclonal antisera can be mixed together to make an engineered polyclonal antiserum with improved sensitivity and specificity.13 Cross-reactivity with precursor forms of the analyte and with metabolic degradation products can cause major differences in assays. For example, cross-reactivity with six molecular forms of human chorionic gonadotropin (hCG) causes differences in hCG assays, and cross-reactivity with metabolic fragments causes differences in parathyroid hormone (PTH) assays.14,15 Cortisol is another analyte for which major cross-reactivity with other steroids, such as corticosterone, 11-deoxycortisol, cortisone, and numerous synthetic steroids, causes significant immunoassay interferences.16 Matrix effects with albumin also can cause major differences in cortisol immunoassays (see “Mass Spectrometry” for a more robust method for measuring steroids).17
Labeled Antigen.
In radioimmunoassays, radioactive iodine (125I or 131I) was originally used to label the antigen. Subsequently, a large variety of methods have been developed to label the analytes.18-23 Today most commercial kits and all automated immunoassays use nonisotopic signaling systems to measure hormone concentrations. These assays use colorimetric, fluorometric, or chemiluminescent signals rather than radioactivity to quantify the relative amount of antigen bound to the antibody used in the assay. The advantages of these nonisotopic labeling technologies include biosafety, longer reagent shelf life, ease of automation, and reduced cost. On the other hand, they can be more subject to matrix interferences than radioactive detection systems. Radioactivity is not affected by changes in protein concentration, hemolysis, color, or drugs (except for other radioactive compounds), whereas many of the current signal systems can yield spurious results when such interferences are present. Later in this chapter, potential troubleshooting steps are outlined to help clinicians evaluate the integrity of test measurements when spurious results are suspected.
Labeled antigen assays have the disadvantage that assay specificity and accuracy depend on the purity of the labeled antigen. Especially with respect to labeling small molecules, such as steroid hormones, purification of the labeled antigen can be challenging and certainly contributes to lot-to-lot variance in assay performance. Additionally, sensitivity in this assay design is influenced by the specific activity of the labeled product (i.e., the amount of label incorporated into the antigen on a molar basis). An alternative design for competition assays is to attach the antigen to a solid phase and label the antibody. A competitive binding assay is then achieved by allowing unlabeled antigen to compete with solid-phase antigen for labeled antibody binding. Currently this design is found in research-only tests available in the United States. Although it addresses issues associated with antigen labeling, this format is subject to similar issues associated with modification of antibody binding characteristics as the antigen is chemically attached to a solid-phase or due to restricting its conformation once the antigen is attached.
Unlabeled Antigen.
The labeled and unlabeled antigens compete for this limited number of binding sites on the antiserum. The competition is not always equal because the labeled antigen (tracer) and the native antigen may react differently with the antibody. This disparity in reactivity may be caused by alteration of the antigen due to labeling, as discussed earlier, or by differences in the endogenous antigen compared with the form of the antigen used in the reagents. The latter is a problem often encountered with protein hormones or biomarkers that often exhibit a wide range of isoforms and degradation products in peripheral circulation. Because the assay can be calibrated with certified reference materials having known concentrations, differences in reactivity of labeled compared to unlabeled antigen do not prevent obtaining useful clinical measurements as long as the reactions are reproducible and appropriate reference intervals are established. Such differences do, however, result in method-specific measurements, and in this case assay results cannot be extrapolated among assays using different reagents.
Separation of Reactants/Automation.
As illustrated in Figures 6-2 and 6-3, immunoassays depend on detecting only the labeled antigen bound by the antibody. Thus, the entire antibody component of the assay must be recovered and separated for any unbound reactants (i.e., labeled or unlabeled antigens not bound to antibody). Over the years since the introduction of radioimmunoassays a vast technology has been developed to accomplish this separation. Approaches vary from methods to precipitate immunoglobulins and recover them by centrifugation or filtration to very innovative ways to create solid-phase antibodies (i.e., antibodies attached to solid surfaces that can be washed to remove unreacted reagents after the binding process is completed).
Separation of immune complexes by precipitation and centrifugation is labor intensive and, like the use of radioactivity itself, not amenable to full automation. This approach is still widely used in research applications but seldom utilized in clinical testing. In contrast, solid-phase approaches are widely employed and can be batch or fully automated. Three frequently used solid-phase materials are microtiter plates, polystyrene or latex beads, and paramagnetic particles. Most recently the use of immunoassay systems at the point of care and miniaturization of assay systems are driving the development of novel methods of creating solid-phase antibody systems.21,23-25 Separation of solid-phase immune complexes from the unbound moieties is accomplished by plate washers, bead washers, magnetic wash stations, or microfluidics. Centrifugation is not required, enabling full automation of the assay.
Antibodies can be attached to solid-phase materials directly or indirectly. Antibodies can be passively attached directly to plastic surfaces by hydrophobic interactions, and this method is often used in the manufacture of enzyme-linked immunosorbent assays (ELISA). Clinical assays, requiring more defined procedures and long reagent shelf lives, typically involve chemical procedures in which amino acid groups or carbohydrate groups on the Fc portion of immunoglobulins are covalently coupled to the solid phase. This can be achieved directly by coupling the antibody used in the assay to the solid phase or indirectly by covalently coupling a universal capture to the solid phase. Examples of universal capture systems are solid-phase particles with covalently attached streptavidin to capture biotinylated assay antibodies or solid-phase particles covalently coated with goat antimouse IgG as attachment moiety for mouse monoclonal-based assays. Another novel way of accomplishing this separation is to attach high-affinity linkers to antiserum, which then can be coupled to a complementary linker on the solid phase.
Quantitation.
Figure 6-3 illustrates the principles of quantitative measurement using competitive immunoassay techniques. In the schematic diagram, 8 units of antibody react with 16 units of labeled antigen and 4 units of native antigen. At equilibrium (assuming equal reactivity), 6 units of label and 2 units of native antigen are bound to the limited supply of antibody. The antigen bound to the antibody is separated from the liquid antigen by any of several methods, and the amount of labeled antigen in the bound portion is quantified (see Fig. 6-3A). The assay is calibrated by measuring standards with known concentrations and cross-plotting the signal (i.e., counts of the gamma rays emitted from the radioactive label) versus the concentration of the standard to generate a dose-response curve. As the concentration increases, the signal decreases exponentially (Fig. 6-3B).
Statistical data-processing techniques are needed to translate the assay signals into concentrations. These dose-response curves typically are not linear, and numerous curve-fitting algorithms have been developed. Before the introduction of microprocessors, tedious, error-prone manual calculations were required to mathematically transform the data into linear models. Today, curve fitting usually is accomplished electronically with the use of programs that automatically test the robustness of fit of multiparameter curves after statistically eliminating discordant data points.26,27 However, users of these systems must understand their limitations and should pay attention to any warnings presented by the programs during processing of the data. Commercial immunoanalyzers, used by the majority of clinical laboratories currently, are closed systems. The manufacturer validates not only the method (see “Analytic Validation”) but also the curve-fitting software, which cannot be altered by the user. Thus, clinical laboratories and clinicians see only the final values for the signal generated and calculated analyte concentration for a given specimen.
In clinical practice today competitive assays are used primarily for this measurement of small molecules, such as steroid hormones or bioactive peptides, which present only one antigenic epitope. For molecules in which multiple epitopes are present, allowing more than one antibody to bind each molecule, two-site or immunometric assays are used. Immunometric assays, discussed in detail in the following section, are advantageous because they do not require the time-consuming establishment of a binding steady-state condition and thus can be performed much faster. Speed of test performance is an important factor in the clinical laboratory supporting acute care. Speed is also directly related to high testing throughput, which is an important cost factor to optimize in modern clinical laboratories.
Immunoassays, indeed any antibody-based method, measure concentrations rather than biologic activity. The reactive site for most antibodies is relatively small, about 5 to 10 amino acids for linear peptides. Some antibody reactions are specific for the tertiary structure that corresponds to unique molecular configurations. In either case, linear or conformational antigenic epitopes, the structural elements of the hormone involved in receptor activation and biologic signaling, are not necessarily identical to antigenic epitopes. The clinician must keep this in mind when interpreting the results of antibody-based assays. When measurements are ordered to identify abnormal secretion of hormones the possible disparity between antigenic and biologic epitopes is not as relevant as when measurements are ordered to assess the endocrine stimulus received by the target glands.
Epitope-Specific Immunometric Assays
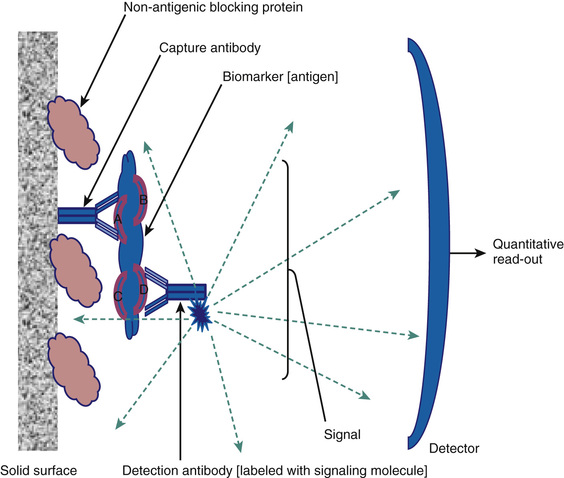
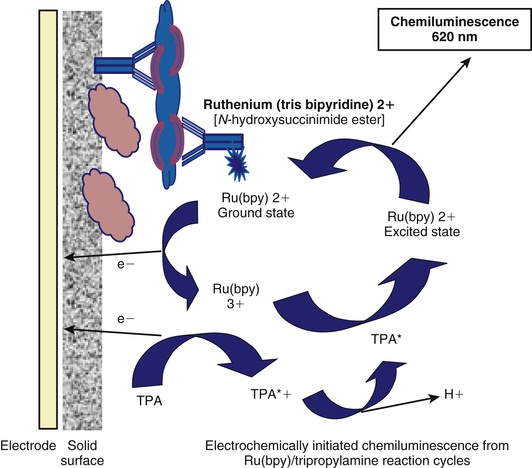
As briefly mentioned earlier, for larger analytes that contain more than one nonoverlapping antigenic epitope, the development of methods to produce monoclonal antibodies facilitates a unique assay design in which two antibodies are used. This format is illustrated in Figure 6-4. The analyte in this example has four nonoverlapping epitopes: A, B, C, and D. A solid-phase monoclonal antibody (referred to as the capture antibody) that is specific to one site (in this example, A) can be used to bind the antigen in calibrators or specimens. Using a second, labeled monoclonal antibody (referred to as the detection antibody) that is specific to one of the other epitopes (in the example, D), the captured antigen can be quantified after washing away the unreacted reagents. Because there are four distinct antibody-binding sites on the analyte, 12 different assays can be configured using four monoclonal antibodies to each of these epitopes. It is important to realize that each of these 12 formats is a distinct assay with unique performance characteristics, each requiring validation. The detection systems employed include all the options discussed earlier for labeling protein antigens in immunoassay formats. Figure 6-5 illustrates one of the most common signaling systems used today in either fully automated clinical immunoanalyzers or as specialized plate assays for research and discovery testing. The detection antibody is covalently labeled with ruthenium (tris bipyridine), which can be excited by an electric circuit that draws an electron from the molecule, leading ultimately to a high-energy state that will emit light when it decays; this is an electrochemiluminescent signaling system.28 The assay buffer contains an excess of the electron donor tripropylamine (TPA). The Ru2+ (tris bipyridine ruthenium metal cation) complex is used as the chemical luminescent label, and the TPA is used as the emitter. Ru2+ undergoes an electrochemical oxidation reaction on the electrode surface and transitions to an excited state to become Ru3+. When the excited state returns to the ground state, light is emitted. The magnetic particles that are captured on the electrode are immunocomplexes that consist of sample and Ru metal complex (Ru2+) and emit light at a specified voltage. The amount of light emitted is proportional to the weight of the immunocomplex and thus the weight of the sample. It can therefore be used for quantitative measurement. This design is typical of modern detection systems in that the signal generated is controlled in the analyzer (in this case light production initiated by activating the electrode), and a regenerating system (in this case TPA in the assay buffer) is employed to enhance the signal generated, hence achieving high sensitivity detection.
In contrast to competitive immunoassays, these assays use a large excess of antibody-binding sites compared with the concentration of antigen. The capture antibody immunoextracts the antigen from the sample, and the signal antibody binds to the capture antibody-antigen complex to form a tertiary complex. These assays are referred to as immunometric because the binding reaction is very fast (first-order kinetics due to excess antibody) and it is not necessary to establish a binding steady state (a requirement for competition assays) in the assay before quantifying the amount of label associated with the immune complex. Immunometric assay can be performed very quickly (5-15 minutes compared to 30 minutes to days for competition assays) and typically have very broad measuring ranges (several log orders).
In contrast to competition assays the dose-response curve generated in an immunometric assay is directly proportional to the analyte concentration (Fig. 6-6). The signal increases progressively with the concentration. For lower concentrations, the signal generated represents the amount of labeled antibody bound to the solid-phase immune complex after binding and washing steps are completed. The amount of labeled antibody bound increases proportionally to the amount of analyte present in the immune complex, which is directly proportional to the amount of analyte in the specimen or calibrator. Quantitative measurements are achieved in the same manner as those used in competition assays. The signal generated by the specimen (the “unknown” in Fig. 6-6) is compared to the calibration curve generated by known concentrations of the analyte (plotted on the x-axis in Fig. 6-6).
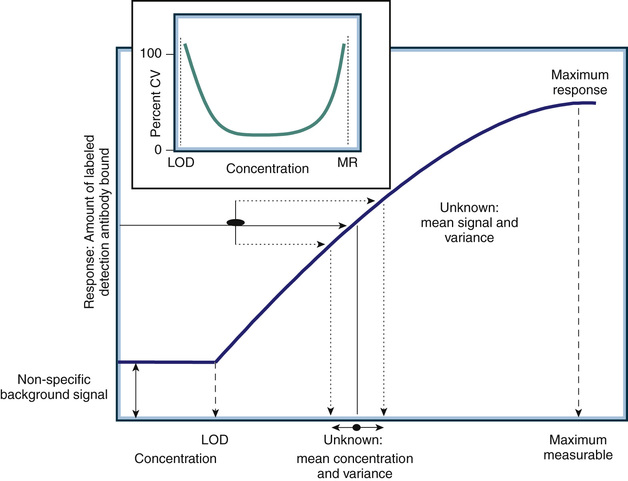
As with any assay, there is a minimum detection limit (referred to as the limit of detection, or LOD) at which the signal generated by the analyte is not statistically different from that generated in the absence of analyte (referred to as nonspecific signal). Note that for an immunometric assay the LOD is associated with a small signal, but in a competition assay the LOD is associated with a large signal (compare the dose-response curve in Fig. 6-6 to that illustrated in Fig. 6-3B). All antibody-based assays also have an upper limit of measurement associated with the maximum signal that can be generated by the assay. The working or dynamic range of the assay encompasses only analyte concentrations between the LOD and the maximum response. Analyte concentrations above the maximum response or below the LOD level do not generate signal changes (e.g., there is no dose-response relationship). Thus, the measurement variance across the dynamic range of an antibody-based assay is heteroscedastic. The insert in Figure 6-6 shows the measurement variance expressed as the percent coefficient of variance (CV) of repeated measurements of the same specimen. The CV is calculated as the standard deviation (SD) of the repeated measures divided by the mean value of the measurements. The highest percent CV (e.g., CV × 100) will occur at the extremes of the measurement where the analyte dose response is lost. This point is critical when interpreting assay results or monitoring quality control performance. Variance determined in the middle of the dynamic range of an assay will always underestimate the variance at the extremes.
Although the laboratory can control variance associated with high analyte concentrations by determining at what level of analyte to dilute and retest the specimen, variance associated with relatively low concentrations cannot be altered for a given assay without changing the kinetics of the system (i.e., the concentrations of reagents and/or incubation conditions). Changing the kinetics of a commercial clinical assay is not possible because the systems are “locked” to comply with FDA manufacturing regulations.
The combined specificity of two antibodies can produce exquisitely sensitive and specific immunoassays. In the past, a common problem with early competitive immunoassays was cross-reactivity among the structurally similar gonadotropins: LH, follicle-stimulating hormone (FSH), thyrotropin (thyroid-stimulating hormone, or TSH), and hCG. The α-subunits of each of these hormones are almost identical, and the β-subunits have considerable structural homology. The polyclonal antisera used for measuring one of these hormones in many of the earlier immunoassays had significant cross-reactivity for the other gonadotropins. The cross-reactivity of a pair of antibodies is less than the cross-reactivity of each of the individual antibodies because any cross-reacting substance must contain both of the binding epitopes in order to simultaneously bind to both antibodies. For example, consider two antibodies for LH, each having 1% cross-reactivity with hCG. The cross-reactivity of the pair is less than the product of the two cross-reactivities or, in this case, less than 0.01%. Most current immunoassays for LH have a cross-reactivity of less than 0.01%. This low cross-reactivity is important, because pregnant patients or patients with choriocarcinoma can have very high hCG concentrations that could interfere with measurements of the other gonadotropin hormones. Most hormones circulate in the blood in multiple forms. Some hormones (e.g., prolactin, growth hormone) circulate with macro forms, which can cause difficulty in their analysis if specimens are not pretreated.29,30 For hormones composed of subunits (e.g., the gonadotropins), both the intact and the free subunits circulate in blood. Immunometric assays can be made specific for intact molecules by pairing an antibody specific for the α-β bridge site of the subunits with a second antibody specific for the β-subunit. Assays using these antibody pairs retain the two-antibody low cross-reactivity needed for measuring gonadotropins and do not react with the free subunit forms of the hormones.
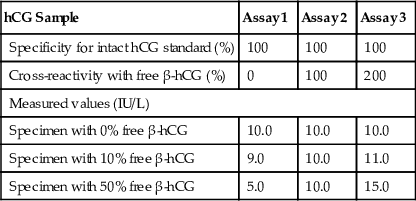
The heterogeneous forms of circulating hormones and differences in specificity characteristics of immunoassays for these forms make calibration and harmonization difficult. Two immunoassays calibrated with the same reference preparation can give widely varying measurements on patient specimens. Consider the example of hCG in Table 6-1. The three assays are calibrated with a pure preparation of intact hCG, such as the WHO Third International Reference Preparation. The three assays differ in their cross-reactivity with free β-hCG (0%, 100%, and 200%, respectively). These assays give identical measurements for a specimen containing only intact hCG but progressively disparate values as the percentage of free β-hCG in the specimen increases. In reality, the standardization issue is much more complex, because multiple forms of hormones (i.e., intact hormone, free subunits, nicked forms, glycoslyated forms, degradation products) circulate in patients, and each assay has different cross-reactivity characteristics with respect to these forms.31-34
TABLE 6-1
Effect of Immunoassay Specificity on Calibration of Human Chorionic Gonadotropin (hCG) Assays
| hCG Sample | Assay 1 | Assay 2 | Assay 3 |
| Specificity for intact hCG standard (%) | 100 | 100 | 100 |
| Cross-reactivity with free β-hCG (%) | 0 | 100 | 200 |
| Measured values (IU/L) | |||
| Specimen with 0% free β-hCG | 10.0 | 10.0 | 10.0 |
| Specimen with 10% free β-hCG | 9.0 | 10.0 | 11.0 |
| Specimen with 50% free β-hCG | 5.0 | 10.0 | 15.0 |
Because of their speed, specificity, and sensitivity, immunometric assay designs have also been applied successfully to point-of-care testing devices. A typical design is shown in Figure 6-7. In this example, a laminar flow system is shown with two solid-phase monoclonal antibodies affixed to the flow device. One antibody is specific for the analyte and the other, located on a different section of the analytic strip, is directed at the capture antibody itself. This strip contains a reservoir of detection antibody covalently coupled to gold microparticles. A drop of specimen (blood, serum, plasma, urine, etc.) is placed on one end of the strip and carried across the analytic strip by laminar flow, passing first through the detection antibody reservoir and then over the capture antibodies in sequence. The final state, as illustrated in Figure 6-7, results in a band of gold particles over the capture antibody region that is proportional to the amount of analyte in the specimen and a positive control band of gold particles over the antidetection antibody region. Such tests are generally qualitative but with the use of a standardized meter for measuring the gold bands and calibrator can be quantitative. Increasingly these systems are being miniaturized and optimized for quantitative measures at the point of care and other nonlaboratory settings (e.g., field testing and low-resource settings). Although still primarily research tools, similar technologies are utilized in developing multiarray assays (e.g., “lab on a chip” assays) that will likely become part of the clinical laboratory's repertoire of tools in the future.19,24,25,35,36

Molecular Structure–Based Methods
Extraction Methods
Extraction of hormones from serum and urine specimens before measurement is a technique that can enhance both the sensitivity and the specificity of immunoassays and mass spectrometry–based assays. Generally extraction procedures applied to the measurement of steroids are based on the polarity or water solubility of the molecules. Extraction methods for proteins/peptides can be based on molecular size as well as polarity. It is essential in any extraction method that recovery (the amount of analyte extracted) is consistent across all specimens. If the extraction recovery is less than 100% but consistent, the method will produce biased yet usable, albeit method-specific, results. If the recovery is different among specimens and cannot be corrected by monitoring, the assay is not valid.
Numerous extraction systems have been developed, including organic-aqueous partitioning to remove water-soluble interferences seen with steroids, solid-phase extraction with absorption and selective elution from resins such as silica gels, and immunoaffinity chromatography. Early immunoassays for steroids relied heavily on extraction prior to assay and provided a basis for assessing interference in subsequent direct assays.37,38 However, extraction before immunoassay is seldom used in clinical assays today. Extraction techniques are difficult to automate, require skills and equipment not available in many clinical laboratories, and generally require correction based on measuring recovery. Monitoring recovery in automated immunoassays is very difficult and creates issues with regulatory compliance (i.e., modification of manufacturer methods). In contrast, extraction methods are a key element in preanalytic processing for mass spectrometry–based assays (see later) in which it is possible to measure recovery using an internal standard added to every specimen being tested. Extraction can also be applied to the measurement of proteins/peptides. Most current mass spectrometry assays for steroids involve deproteinization of the specimen (extraction of the steroids) prior to further extraction/purification preanalytically. Similarly, mass spectrometry–based assay of proteins/peptides generally utilizes a batch extraction based on molecular size or polarity. A good deal of progress has been made in developing preanalytic extraction methods prior to assay.39-50
Chromatographic Systems
The second major method of measuring hormone concentrations involves chromatographic separation of the various biochemical forms and quantitation of specific characteristics of the molecules. High-performance liquid chromatography (HPLC) systems use multiple forms of detection, including light absorption, fluorescence, and electrochemical properties.51-53 Chromatography also is frequently combined with mass spectrometry (see later). There are two major advantages of these techniques: They can be used to simultaneously measure multiple forms of an analyte, and they are not dependent on unique immunologic reagents. Therefore, harmonization of measurements made with different assays is more feasible. The major disadvantages of these methods are their complexity and their limited availability.
Many chemical separation techniques are based on chromatography, but the two most commonly used for liquid chromatography are normal-phase HPLC and reverse-phase HPLC. In both systems, a bonded solid-phase column is made that interacts with the analytes as they flow past in a liquid solvent. In normal-phase HPLC, the functional groups of the stationary phase are polar (e.g., amino or nitrile ions) relative to the nonpolar stationary phase (e.g., hexane); in reverse-phase HPLC, a nonpolar stationary phase (e.g., C18 octadecylsilane molecules bonded to silica) is used. Polymeric packings made of mixed copolymers have been made with C4, C8, and C18 functional groups directly incorporated so that they are more stable over a wide pH range. The mobile and stationary phases are selected to optimize adherence of the analytes to the stationary phase. The adhered molecules can be eluted differentially from the solid phase, after washing to separate specific forms of the analyte from interfering substances. If the composition of the mobile phase remains constant throughout the run, the process is called an isocratic elution. If the mobile-phase composition is abruptly changed, a step elution occurs. If the composition is gradually changed throughout the run, a gradient elution occurs.
The efficiency of separation in a chromatography system is a function of the flow rates of the different substances. The resolution of the system is a measure of the separation of the two solute bands in terms of their relative retention volumes (Vf) and their bandwidths (ω). Resolution (Rs) of solutes A and B is calculated as follows:
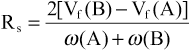
Values of Rs lower than 0.8 result in inadequate separation, and values greater than 1.25 correspond to baseline separation. The resolution of a chromatography column is a function of flow rates and thermodynamic factors.
HPLC remains the method of choice for clinical measurements of catecholamines in biologic fluids.54,55 Simultaneous measurement of the three catecholamines (epinephrine, norepinephrine, and dopamine) can be obtained. Prior extraction by absorption on activated alumina and acid elution helps to improve specificity. Dihydroxybenzylamine, a molecule similar to endogenous catecholamines, can be used as an internal standard.
Mass Spectrometry
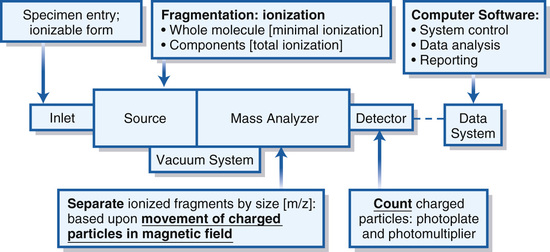
Mass spectrometry depends on the movement of charged particles through a magnetic field in order to separate and quantify them on the basis of their mass, or more rigorously their mass-to-charge ratio (m/z).56 A mass spectrometer is an instrument designed to ionize analytes, accelerate them into a device (mass analyzer) that separates them based on their m/z, and quantifies their relative abundance. Figure 6-8 illustrates the components and principles of a generic mass spectrometer. The heart of the system is the mass analyzer, which utilizes adjustable magnetic fields to accelerate or deflect volatile (e.g., in gaseous form) ions, typically in a vacuum so that the ion's flight path is determined only by the magnetic field. A source is used to ionize and if necessary volatilize and fragment analytes in order to introduce them into the mass analyzer. Analytes are introduced into the source via an inlet that can be as simple as an injection port or as sophisticated as a laser-driven matrix desorption system or photo-ionization chamber. Charged particles passing through the mass analyzer are counted by a simple Faraday plate detector, which generates an electric current proportional in intensity to the frequency (abundance) of ions striking the detector. As will become apparent as the components are discussed in more detail later, mass spectrometers used in endocrine clinical testing are quite complex, with analytes being delivered to the inlet via a chromatography system, subtle selection of ions with m/z characteristics unique to the analyte, and measurement based on system calibration and recovery of internal standards. All of these aspects are controlled by the data system (computer software), which also generates data outputs that comply with clinical reporting requirements and increasingly can be integrated into fully electronic laboratory and medical record systems.
Analytic mass spectrometry developed in tandem with the discovery and characterization of endocrine steroids during the 1930s, 1940s, and 1950s.57 The source for these instruments ionized the analyte by electron impact (i.e., by bombarding gas molecules from the sample with electrons emitted from a heated filament), creating a full fragmentation of the analyte and multiple charged particles of each of the composite atoms. By determining the relative abundance and mass of each ionized particle the molecular structure of the steroid could be constructed. However, the methodology requires that the steroids, indeed any analyte, be purified and volatilized prior to fragmentation and ionization in the source. Most steroid hormones are easily heat damaged and must be derivatized with molecules that can be volatilized and ionized before mass analysis. This methodology was used in strictly research applications in which it was invaluable in delineating the physiology of reproductive steroids. The development of gas chromatography, in conjunction with electron impact mass analyzers (GC/MS), led to the clinical use of mass spectrometry, which was applied first to endocrine steroids and subsequently to other small biologically important molecules. GC/MS, using quadrupole analyzers in scanning mode (see later), remains a key technology in the research laboratory today and arguably is the method of choice for the study of steroid hormone metabolites.58 GC/MS was replaced for clinical endocrine steroid testing by the cheaper, higher throughput antibody-based assays, which remain the primary method in all but very large academic hospital or reference laboratories. However, dramatic advances in mass spectrometry design have led to the availability of instruments that are rapidly replacing many antibody-based assays, especially competition immunoassays, in clinical laboratories.
The technological advances leading up to modern mass spectrometers involve primarily the source and the mass analyzer components. The most dramatic advance in sources, with respect to clinical applications of mass spectrometry in endocrine testing, was the development of electrospray ionization (ESI).59,60 This technology underlies the direct connection of liquid chromatography systems to mass spectrometry and is currently the method of choice for measuring analytes relevant to endocrinology, such as steroid hormones, in biologic fluids. The principle of ESI is illustrated in Figure 6-9. The specimen to be measured in the effluent from a chromatography system is pushed at low speed through a capillary column into the source region of the spectrometer to create an aerosol when high voltage (positive or negative) is applied to the tube in the presence of a nebulizing gas. As the droplets in the aerosol dry, often with the aid of a drying gas, the molecules in the specimen become charged and volatilized. In gaseous form these molecules then enter the mass analyzer.
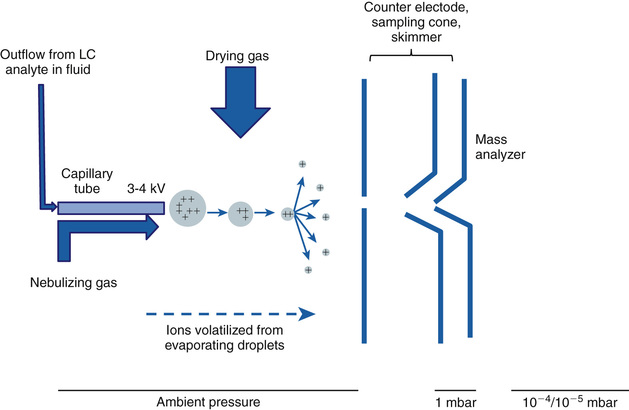
ESI has directly resulted in the development of systems that are rapidly replacing the antibody-based competition assays in the clinical laboratory. The most obvious advantage is that liquid chromatography systems can be coupled directly to the mass spectrometer. This system allows the extensive knowledge of steroid and peptide purification by liquid chromatography to be directly applied in mass spectrometry systems that for the first time can be automated and support high throughput testing. Because the analysis time (seconds) in a mass analyzer is much shorter than the time required for chromatographic separations (minutes) several independent liquid chromatography systems can be supported by one mass spectrometer. Thus, the technical advantages of the mass spectrometer (measurements based directly on the molecular composition of the analyte rather than indirect competition of the analyte for antibody binding) can be realized in the practical setting of clinical testing services.
The ionization achieved by ESI is also an important technological advance. Although the exact mechanisms are still unclear, ESI is characterized by ionization at low temperatures and pressures and results in relatively little fragmentation of the analyte so that a molecular ion is always generated. This procedure has allowed the development of exquisitely specific methods. Most significant with respect to current clinical testing is tandem mass spectrometry, especially triple quadrupole mass analyzers linked together.
The design of a quadrupole mass analyzer is illustrated in Figure 6-10. The analyzer is composed of four round electrodes. Voltage of the same polarity is applied to directly opposite electrodes, and opposite voltage polarity is applied to adjacent ones. An oscillating electric field is generated within the quadrupole when an alternating current (voltage V, frequency ω, and time t) is applied with a superimposed direct current (voltage U). Thus, charged particles (ions) moving through the quadrupole follow oscillating paths and only ions with a specific m/z can pass through to the downstream detector. Ions with greater or lesser m/z collide with the electrodes and are not detected. By controlling the applied voltages the analyzer can be operated to select ions of specific m/z for detection (or transit). Because ions are moving rapidly and voltage can be controlled rapidly, the analysis time is very short. The analyzer thus can be operated in three distinct modes to (1) filter ion for the quantitation of only one m/z, (2) scan to sequentially quantify all ions by m/z, or (3) trap ions within the quadrupole.

Combining three quadrupole analyzers results in a very powerful system (Fig. 6-11), often referred to as the Triple Quad mass spectrometer and often just as LC/MS-MS or LC/tandem MS in the clinical literature. The molecular ions generated by ESI can be filtered by the first mass analyzer (quadrupole) to capture, in a second mass analyzer, a molecular ion whose m/z is consistent with that of the target analyte. The captured molecular ion is fragmented and ionized in the second analyzer, which becomes the source for the third analyzer that either analyzes all the fragments or selects one that is unique to the parent ion. By operating the first and second quadrupoles in various modes different analytic goals can be achieved. The primary approaches used for endocrine testing are multiple reaction monitoring and product ion scanning.
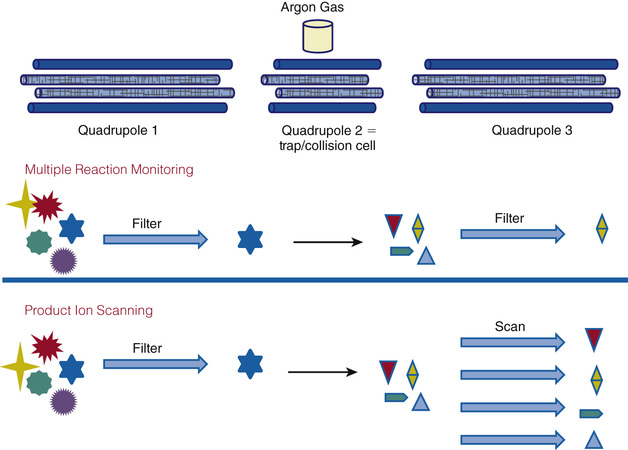
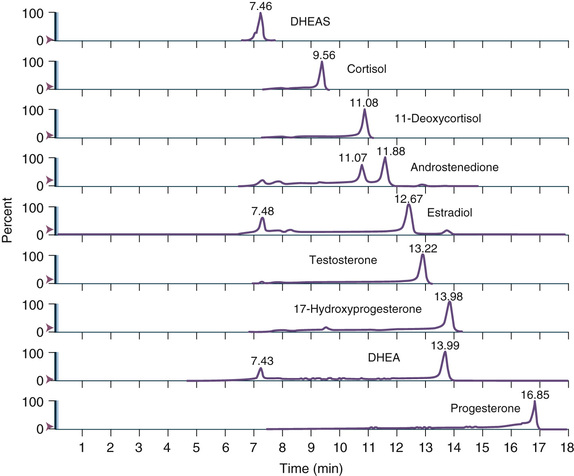
Multiple reaction monitoring mode allows both analytic analyzers (quadrupoles 1 and 3) to be fixed, selecting for a specific m/z. This adjustment increases specificity and sensitivity. This mode is used to monitor specific analytes and to confirm unambiguously the presence of a compound in a matrix. For example, two unique ions (first/second analyzer) for testosterone are 289.221/97.140 and 289.222/109.130. Because steroid hormones have well-known and unique elution times from LC systems, this mode is also widely employed for steroid profiling, as illustrated in Figure 6-12.
Product ion scanning allows a parent or precursor ion to be selected in quadrupole 1, and the scan in quadrupole 3 measures all the product ions resulting from fragmentation of that ion. This is a particularly useful method of operation for providing structural information concerning small organic molecules or for generating peptide sequence information.
Mass analyzer design continues to evolve rapidly. Another system that deserves consideration with respect to endocrine clinical testing is time-of-flight mass spectrometers (TOFMSs). As illustrated in Figure 6-13, TOFMSs are simple, albeit more highly engineered, instruments designed to determine m/z based on the time required to traverse a vacuum tube. The source is designed to align and accelerate ions after ionization so that they all enter the vacuum tube at the same time. The time required to traverse the vacuum tube is proportional to m/z (more precisely, the square root of the m/z); smaller or more highly charged ions will move faster to the detector. Most modern TOFMSs have electronic reflectors to effectively increase path length and thus resolution. The advantageous qualities of this type of analyzer include a very wide range of measurement, and it is compatible with pulse ionization sources such as matrix-assisted laser desorption/ionization (MALDI) methods. MALDI-TOFMS is widely used in proteomics and recently has become a powerful clinical tool in infectious disease testing. It is likely to find increasing applications in endocrine clinical laboratories for large protein measurements. For example, current antibody-based methods for proteins such as TSH, prolactin, and thyroglobulin are often inaccurate in the presence of endogenous antibody. Mass spectrometry, particularly the MALDI-TOFMS, given its ability to measure large proteins, is an attractive approach to addressing this issue.

Free Hormone Methods
The design of assays, either antibody or mass spectrometry based, to measure steroid hormones and sterols (such as vitamin D) present special issues that warrant discussion. These analytes, which for the sake of simplicity will be discussed as steroid hormones, are extremely hydrophobic. In aqueous environments, particularly blood and blood-derived specimens in which measurement is intended, steroid hormones are associated with hydrophobic regions of proteins or bound tightly to high-affinity, specific transport proteins. The former includes albumin, prealbumin, transthyretin, and apolipoproteins, among others, and the latter include specific transport proteins listed in Table 6-2. Less than 5% to 10% of most steroid hormones circulate as free (unbound) analyte, and assay design requires that the protein-bound analyte be released or does not interfere in the assay in order to have an accurate measure of the total hormone present. Although not universally applicable, in many cases the physiologic effects of steroid hormones depend on the free hormone concentration rather than the total hormone concentration. Of course, under normal conditions the free and total hormone concentrations are directly related. This concept, known as the free hormone hypothesis, is the basis for the design of methods specifically intended to measure just the free hormone levels.61-66 The free hormone hypothesis itself is controversial and a critical discussion of it is beyond the scope of this chapter; however, the reader is directed to specific applications in the clinical chapters of this text. Here it is hoped that a technology-based discussion will give the reader an appreciation of the various methods that have been and are currently used to measure free hormones.
TABLE 6-2
Circulating High-Affinity Protein Carriers of Steroid Hormones
| Protein Carrier | Primary Ligand(s) | Note |
| Corticosteroid-binding globulin (CBG) | Glucocorticoids, mineralocorticoids | Also binds cell membranes |
| Sex hormone–binding globulin | Dihydrotestosterone, testosterone, estradiol | Also binds cell membranes |
| Thyroxine-binding globulin (TBG) | Thyroxine (T4), triiodothyronine (T3) | |
| Vitamin A–binding protein(s) | Vitamin A (retinol) | |
| Vitamin D–binding protein | 25(OH) vitamin D2, 25(OH) vitamin D3, 1,25(OH) vitamin D2, 1,25 vitamin D3 | Also binds cell membranes |
There are two basic types of assay designs for measuring free hormones: (1) assays based on the physical separation of bound and free hormone prior to measurement and (2) antibody-based binding assays designed to measure only the free hormone.
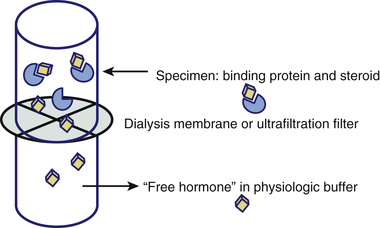
Figure 6-14 illustrates the design of assays based on physically separating bound from free steroid hormones. Classically a dialysis membrane was used to separate two fluid-filled chambers (e.g., tubes). The pore size of the dialysis membrane is specific to the analyte/binding proteins but in principle allows free movement of free steroid hormone while retaining the higher molecular weight binding proteins and conjugated binding protein-steroid hormone complexes. Thus, by placing the specimen in one chamber (top in Fig. 6-14) and matrix-appropriate buffer in the other and allowing the diffusion of free hormone to equilibrate, the free hormone can be measured directly by this equilibrium dialysis approach. Subsequent variations on the method include using an ultrafiltration membrane to allow faster (e.g., no need to wait for an equilibrium to be established) separation of bound from free steroid hormone (as illustrated in Fig. 6-14) or to chemically separate the high-molecular-weight bound hormone from the free hormone (e.g., precipitation of SHBG-bound steroid using ammonium sulfate). The biggest challenge associated with this approach, regardless of how separating bound from free steroid hormone was achieved, is the measurement of the very low concentrations of free steroid hormone after separation (e.g., in the dialysate or lower chamber in Fig. 6-14). Thus, a variation on the equilibrium dialysis design is to add labeled steroid hormone to the specimen prior to dialysis. High specific activity labels, such as radioisotopes, allow the detection of trace amounts of free hormone after dialysis. It is then possible to use the percentage of free hormone based on the distribution of labeled hormone to calculate the mass of free hormone from a direct measurement of total hormone by traditional methods.
One might easily get the misimpression, especially now that LC/MS-MS systems with sufficiently high sensitivity have been combined with it, that equilibrium dialysis is the method of choice or a gold standard method for measuring free hormones.57,67,68 However, it must be emphasized that currently there is no established reference method for the measurement of free steroid hormones and that the vast majority of separation methods, including equilibrium dialysis, have not been applied in a fashion that is necessarily valid or directly applicable to in vivo conditions.62,66,69-72
Antibody-based binding assays designed to measure only the free hormone can be divided into two classes: (1) two-step assays and (2) one-step assays.
The two-step immunoassay relies on labeled steroid and is illustrated in Figure 6-15. Solid-phase antibody is used to capture the free hormone present in the specimen. The amount, if any, of bound hormone capture will depend on the relative affinity of the steroid for the antibody versus the binding protein. If the antibody affinity is much higher, the bound steroid will be stripped from the binding protein. If the antibody affinity is relatively low compared to the binding protein, only free hormone will be bound. In either case after washing the solid-phase antibody, unoccupied antibody-binding sites are titrated using labeled steroid, which after a second wash step can be quantified. The signal generated by the captured labeled steroid is inversely proportional to the amount of free hormone in the specimens. It is important to note that free in this assay format is defined by the relative affinity of the antibody used and the endogenous steroid binding proteins.
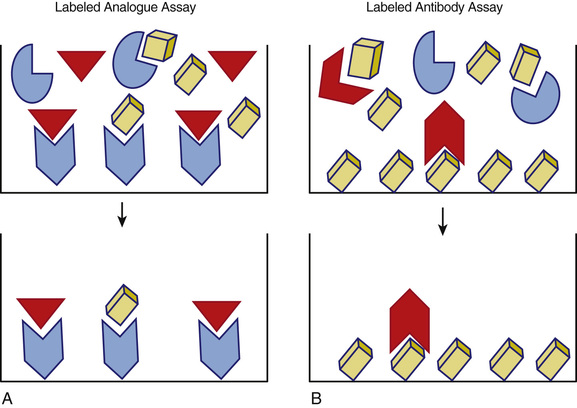
One-step immunoassays are designed using either labeled steroid or labeled antibody. The basic formats are illustrated in Figure 6-16. These assays are fast and easy to perform given their relatively simple format, which is also quite amenable to automation. The use of a labeled steroid analogue is summarized in Figure 6-16A. The labeled analogue is not recognized by the binding protein but is able to compete with free hormone for antibody-binding sites on the solid phase. This type of assay depends on the validity of the assumption that the signal generated, which is inversely proportional to the concentration of free steroid in the specimen, is solely due to the competition with free hormone. This has been shown not to be true for free testosterone assays and is likely valid only over a limited range for binding protein concentrations for free thyroxine assays.66,71,73-77 An alternative approach is shown in Figure 6-16B in which a labeled antibody is employed in an assay based upon its binding to solid-phase antigen (e.g., the analyte of interest). In this design the signal generated reflects the amount of labeled antibody bound to the solid phase which, after reaching a steady state, is inversely proportional to the concentration of free steroid hormone in the specimen. The advantage of this newer approach is that a relatively higher signal is measured (e.g., improved sensitivity and precision), and it is not necessary to alter the structure of the steroid (other than that which may be associated with attachment to the solid phase).
It is important to recognized that for free steroid assay designs, the kinetics of competition and binding are very complex given the variety of proteins interacting with steroid hormones over a wide range of affinities. Specimens with low concentrations of binding proteins, including low-affinity but high-capacity binders such as albumin, are particularly challenging. As is true for any assay, all of these free hormone measurement methods require careful validation and method-specific reference intervals to be clinically useful.62,63,69,70,72,78,79
Nucleic Acid–Based Methods
Nucleic acid–based assays are designed to identify variations in an individual's DNA or RNA sequence that reflect molecular variance (e.g., mutations, rearrangements) that alters gene expression, regulatory pathways, and bioactive molecules in a fashion relevant to human disease (i.e., early diagnosis or increased disease susceptibility). Genetic variance results in a range of alterations from whole chromosome effects visible by karyotyping/cytogenetics to point mutations leading ultimately to changes in protein expression or functionality. As small molecules, such as steroid hormones, depend on protein enzymes, genetic alterations may affect all aspects of endocrine function and hence are important analytic targets. A plethora of analytic methods exist for the analysis of nucleic acids.
Discussion of the full range of methods is beyond the scope of this review, but these methods can be grouped into three major categories: (1) chromosome visualization methods, with or without application of sequence-selective enzymatic fragmentation, (2) assays based on binding of labeled nucleic acid probes, which obey Watson and Crick base-pairing rules and thus are sequence specific, and (3) direct sequencing of DNA or RNA. Methods in categories 2 and 3 are generally combined with methods for the amplification or selective enrichment of target sequences, but methods in category 1 generally depend on microscopy (whole chromosome analysis), fragmentation, gel electrophoresis, and blotting techniques (e.g., Southern blotting for DNA or Northern blotting for RNA). Thus, the key elements to appreciate are hybridization, restriction enzyme fragmentation, electrophoretic separation, amplification, and nucleic acid sequencing. Methods composed of various combinations of these principles are available for scanning DNA sequences for new variants, scoring DNA sequences for known variants, and expression analysis of DNA or RNA target sequences. Direct sequencing effectively scores known variants as well as identifies new variants.
Currently, molecular methods being utilized by clinical laboratories are primarily for well-known inherited diseases, cancer diagnostics and management, and increasingly in infectious disease applications. Based on developments in research laboratories, particularly with respect to next generation sequencing, these methods are likely to impact clinical endocrine testing in the very near future.80-82 The majority of nucleic acid–based assays are laboratory-developed methods applied in research settings or highly specialized clinical reference laboratories. However, this picture is rapidly changing as devices suitable for use in hospital clinical laboratories are increasingly becoming available.
Hybridization Assays (Mutation Assays, Genotyping)
Nucleic acid molecules have a unique ability to bind with high affinity to complementary base-pair sequences. When a fragment of a known sequence (probe) is mixed under specific conditions with a specimen containing a complementary sequence, hybridization occurs. This feature is analogous to the antibody-antigen binding used in immunoassays. Many of the formats used for immunoassay have been adapted to nucleic acid assays, including some of the same signal systems (e.g., radioactivity, fluorescence, chemiluminescence) and the same solid-phase capture systems (e.g., magnetic beads, biotin-streptavidin binding). In situ hybridization, which involves the binding of probes to intact tissue and cells, provides information about morphologic localization analogous to that provided by immunohistochemistry. Combining hybridization methods with enzymatic procedures to amplify, extend, and ligate DNA targets or probes greatly enhances the analytic sensitivity and specificity of hybridization-based methods. Hybridization methods, like other binding assays, are quite amenable to automation and incorporation into relatively simple devices suitable for clinical laboratory utilization.
Restriction Fragmentation
DNA restriction enzymes break DNA strands at specific sites based on the nucleic acid sequence. Thus, digestion with a given restriction enzyme or combination of restriction enzymes will produce fragments of different lengths that are directly related to the DNA sequence. Mutations that alter the sequence of the enzyme cleavage site(s) will result in altered fragment size patterns, referred to as restriction fragment length polymorphisms (RFLPs), which can be visualized after fragment separation by gel electrophoresis or other separation methods. For known mutations the affected DNA sequence can be amplified (see later) prior to RFLP analysis (or by single-nucleotide extension if the mutation does not alter a restriction enzyme cleavage site). A large number of online tools are available to support researchers designing methods involving the use of restriction enzymes.83,84 These tools can be useful in designing validation studies of commercially available assays for molecular variance.
Electrophoretic Separation
E.M. Southern invented an electrophoretic separation technique known as Southern blotting.66 Restriction enzymes are used to digest a sample of DNA into fragments, and the product is subjected to electrophoresis. The separated bands of DNA are then transferred to a solid support and hybridized. Northern blotting is a similar technique in which RNA is used as the starting material. Western blotting refers to electrophoresis and transfer of proteins. Currently a wide range of methods for electrophoretic separation and blotting of DNA, RNA, and proteins are available and incorporated into clinically relevant methods. All are relatively complex laboratory-developed methods.
Amplification
Nucleic acid assays have an advantage in that low concentrations can be amplified in vitro before quantitation. The best-known amplification procedure is the polymerase chain reaction (PCR). The three steps in the process (denaturation, annealing, and elongation) occur rapidly at different temperatures. Each cycle of amplification can occur in less than 90 seconds by cycling the temperature. The target double-stranded DNA is denatured at high temperature to make two single-stranded DNA fragments. Oligonucleotide primers, which are specific for the target region, are annealed to the DNA when the temperature is lowered. Addition of DNA polymerase allows the primer DNA to extend across the amplification region, thus doubling the number of DNA copies.
At 85% to 90% efficiency, this process can amplify the DNA by about 250,000-fold in 20 cycles. This huge amplification is subject to major problems with contamination if special precautions are not taken.
Sequencing Methods
Traditionally sequencing was performed using DNA polymerase to selectively incorporate dideoxynucleotides (causing chain termination) during in vitro DNA replication. This method, which was developed by Sanger and is now referred to as Sanger sequencing, remains the gold standard.85,86 Although this method, which was used in the first sequencing of the human genome, is straightforward and reliable, it is primarily used in directed sequencing of relatively small lengths of DNA.
Next-generation sequencing is a very different approach to sequencing and refers to a wide array of applications including whole genome sequencing, exon sequencing, DNA-protein interaction assays, and RNA sequencing.80,87-89 These approaches hold tremendous clinical diagnostic potential because they are faster and cheaper than Sanger sequencing, are amenable to automation, and are rapidly being commercialized. Methods encompassed in next-generation sequencing are evolving very rapidly but currently include massively parallel signature sequencing, polony sequencing, pyrosequencing, dye sequencing (Illumina), and sequencing by ligation (Applied Biosystems).
Analytic Validation
In this section the basic elements of method validation are outlined and are applicable to any quantitative assay method discussed in the methods sections earlier. It is only the degree to which the parameters are determined and the frequency with which they are verified that vary from method to method or as a function of assay class. Clearly, to be clinically valuable an analytic method must be valid; that is, the results or measurements generated are accurate and reproducible within the context of use (i.e., specified concentration limits, specimen types, clinical settings). This is often expressed as demonstrating that the method is “fit for use.” In more straightforward terms, any given method is valid only within specifications of use. In practical terms, methods are validated, or more accurately, their validity is verified, by clinical laboratories to the extent required by appropriate regulatory guidelines (see section on “Classes of Assays”).
The validation process begins with the design and development of the method, regardless of the technical processes involved. Clinical laboratories approach validation differently depending on the technologies and reagents used. Commercial systems (instruments and reagents) are validated by the manufacturer, who is also responsible for quality control of subsequent reagent lots and instrument change. Clinical laboratories conduct limited studies to verify the validation. When using instruments and reagents made or modified by the clinical laboratory, full validation is necessary. In both settings the clinical laboratory relies on professional guidelines specific to the technology.
Failure to fully appreciate these subtleties can lead to very erroneous perspectives of the results reported by a given laboratory or obtained by a given method. For example, the majority of assays used to diagnose endocrine diseases are accurate only over specific ranges of analytes, only with reference to specific and generally nonstandardized calibration materials, and only when applied to specific specimen types. In many cases results that are essential to patient care are method-specific and cannot be extrapolated between methods and laboratories.
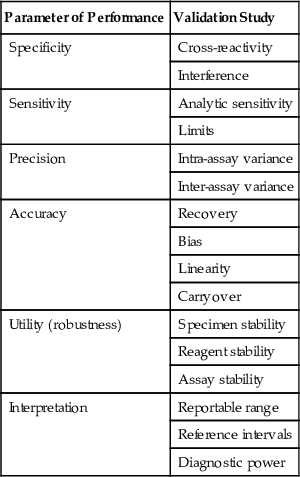
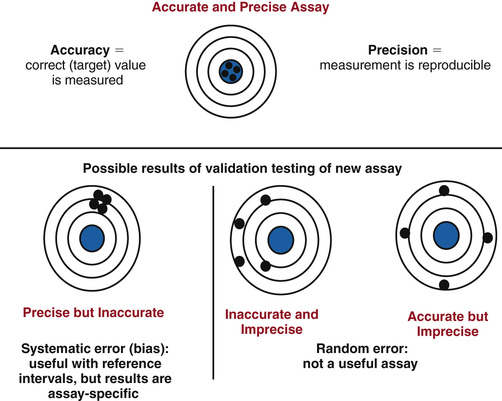
The basic elements of method validation are listed in Table 6-3 along with the typical studies conducted to characterize each parameter. The parameters that define an assay's analytic performance are dependent on the technology and reagents employed and are often referred to as intrinsic characteristics. These characteristics include sensitivity, specificity, precision, and accuracy. Validation must also include specification of the assay's utility and provide data to support the clinical interpretation of results generated by the assay; these are listed in Table 6-3 as utility and interpretation parameters. As illustrated in Figure 6-17, intrinsic parameters are interrelated. For example, as illustrated in Figure 6-18, accuracy and precision are related parameters and must be optimized and validated in conjunction with each other. In the context of method development, assay validation is typically an iterative as shown in Figure 6-19. It is after an assay optimized analytically for specificity, sensitivity, precision, and accuracy is applied to clinical testing that these parameters can be fully evaluated and interpretive specifications established.
TABLE 6-3
Parameters and Studies for Method Validation
| Parameter of Performance | Validation Study |
| Specificity | Cross-reactivity |
| Interference | |
| Sensitivity | Analytic sensitivity |
| Limits | |
| Precision | Intra-assay variance |
| Inter-assay variance | |
| Accuracy | Recovery |
| Bias | |
| Linearity | |
| Carryover | |
| Utility (robustness) | Specimen stability |
| Reagent stability | |
| Assay stability | |
| Interpretation | Reportable range |
| Reference intervals | |
| Diagnostic power |


Intrinsic Performance Parameters
Analytic Specificity
Analytic specificity can be simply defined as the ability of the assay to measure only the intended analyte. In other words, the value obtained from a measurement reflects only the concentration of the target analyte. Clearly, then, specificity is closely related to accuracy; an assay cannot be accurate if it is not specific. On the other hand, an assay may be specific but not accurate if, for example, the assay measures only the target analyte but produces a value that over- or underestimates its concentration due to calibration or recovery or other technical issues. From a more practical perspective specificity is often defined based on the signal generated in the assay (i.e., the signal produced in a specific assay is generated only by the target analyte). Few assays, regardless of the technology employed, are truly specific in this sense; typically the signal measured can be generated by components of the specimen or assay systems in addition to the target analyte. Thus, practical validation of specificity encompasses not only specificity per se but also interferences, such as matrix effects or ion suppression, that can alter the derived concentration, resulting in an inaccurate measurement. It is important to emphasize that interference can be specimen-specific and is a challenge to assay validation as well as quality control and quality assurance.
Cross-Reactivity.
Assay cross-reactivity can be generically defined as signal generation by similar analytes. Typically it is a definable and predictable assay characteristic (e.g., any specimen containing cross-reacting analytes will not be accurately measured).
Cross-reactivity in antibody-based assays is due primarily to the specificity of the antibody-binding sites employed in the assay. For example, steroids with similar structure may bind to the antibody and compete with the labeled analyte to produce the same signal (decrease in labeled analyte binding) as the target analyte. Similarly, proteins containing a binding epitope similar to the ones targeted in an immunometric assay can generate signal (i.e., increased binding of the detection antibody). Cross-reactivity is not a term typically used with respect to structural or nucleic acid–based assays, but the concept is applicable. For example, if the fragment ion used for quantification can be generated by more than one analyte, the signal generated is not specific. Similarly if the sequence target for a nucleic acid–binding assay is large, the detection probe may bind to more than one analyte. In all cases the cross-reactivity is not necessarily complete in that the cross-reacting analyte may generate the same, more, or less signal than the target analyte. Thus, the degree to which cross-reactivity vitiates assay measurements will be dependent on the concentration of cross-reacting analyte and the degree to which it cross-reacts.
Assays are validated with respect to cross-reactivity primarily by two approaches: (1) response curve comparison and (2) spiked specimen measurement.
Response curve comparisons are done by adding known amounts of analytes expected to cross-react (based on the design of the assay) to the appropriate matrix to generate a dose-response curve for each analyte to be tested. These response curves are compared to those used to quantify the target analyte (e.g., the calibration curve). Whenever possible the curves are compared at the half-maximal response point where precision and sensitivity (see later) are highest. The degree of cross-reactivity can then be expressed as a percentage. An example of the procedure is shown in Figure 6-20. The half-maximal response (50% Bmax/total labeled antibody bound) is generated by a concentration of 200 mass/mL of the target analyte. In contrast, 2000 mass/mL of the cross-reacting analyte is required to generate a half-maximal response. Thus, the cross-reactivity of this cross-reacting analyte is 10% (i.e., percent cross-reactivity = [200/2000] × 100). It is important to appreciate that this approach is valid only if the response curves are parallel.
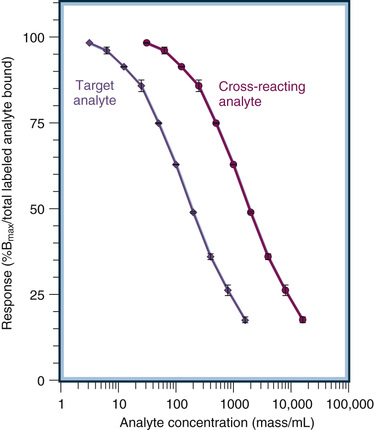
Spiked specimen measurement is often used to determine analyte cross-reactivity. This approach involves adding the cross-reacting analyte to a specimen that has been measured and then performing re-assay to determine if the added analyte cross-reacted. This approach is often seen in the package inserts of commercial assays. An example is shown in Table 6-4 for a commercial assay for the measurement of cortisol in human serum or plasma. The concentration achieved by spiking human serum is indicated for each potential cross-reactant listed. The unspiked human serum contained 12 µg/dL of endogenous cortisol as measured in the assay. Thus, a cross-reactivity of 36.6% for fludrocortisone means that a cortisol value of 16.4 µg/dL was measured after the addition of 100 µg/dL of fludrocortisone to the specimen. Spiked specimen cross-reactivity data must be interpreted carefully as it assumes that the percent of cross-reactivity will be the same at all levels of cross-reactant and that the concentrations of cross-reactant tested are clinically relevant.
TABLE 6-4
Example of Spiked Specimen Cross-Reactivity Data From a Commercial Immunoassay
| Compound | Concentration (µg/dL) | Cross-Reactivity (%) |
| Aldosterone | 1000 | 0 |
| Beclomethasone | 1000 | 0 |
| Budesonide | 1000 | 0 |
| Canrenone | 1000 | 0.1 |
| Corticosterone | 1000 | 0.9 |
| Cortisol 21-glucuronide | 1000 | 0.2 |
| Cortisone | 1000 | 2.7 |
| β-Cortol | 1000 | 0 |
| β-Cortolone | 1000 | 0 |
| 11-Deoxycorticosterone | 100 | 0 |
| 11-Deoxycortisol | 100 | 1.9 |
| Dexamethasone | 1000 | 0 |
| DHEA | 1000 | 0 |
| DHEAS | 1000 | 0 |
| β-Estradiol | 1000 | 0 |
| Estriol | 1000 | 0 |
| Estrone | 1000 | 0 |
| Fludrocortisone | 100 | 36.6 |
| Fluticasone propionate | 1000 | 0 |
Interference.
As alluded to previously, interference is can be due to the influence of a specimen component on the signal generated by the target analyte or to the generation of signal by the interfering substance. In the latter case, what distinguishes interference from cross-reactivity is the lack of parallelism in the signal generation by interfering substances. The interfering substance or the mechanism of interference is something known; frequently encountered examples are given in the following paragraphs. In other cases neither the mechanism nor interfering substance is known; in this case interference is referred to as a matrix effect. Matrix effects are typically identified only during the validation of accuracy (see later). They can be specimen-specific in which case they are identified only during the investigation of results that are inconsistent with the clinical setting or other analytic results. It is critical that the clinical laboratory keep in mind that any analytic method can be subject to specimen-specific interferences unknown to the laboratory or indicated by routine quality control monitoring. Thus, despite a numeric value, often to several decimal places, reported from a validated method, an analytic result from any single specimen must be interpreted in the overall clinical context.
Well-known interference with assays that depend on light or fluorescence signaling can be due to hemolyzed, lipemic, and icteric specimens. Interference can also be a function of physically influencing the system. For example, a severe degree of lipemia as can result in inaccurate measurement of water-soluble analytes. Interference can also be analyte-specific. Proteins sensitive to proteolysis are inaccurately measured in hemolyzed specimens (by the proteases released during hemolysis rather than color interference with light detection, which also occurs in hemolyzed specimens).
Two interferences well known to affect immunometric assays (but an issue to some extent for all antibody-based assays) are hook effects and heterophile antibody interferences.
The mechanism of the hook effect is illustrated in Figure 6-21. As the antigen concentration approaches the effective binding capacity of the capture antibody system, the signal no longer increases. At this point laboratory specifications for maximum reportable signal are exceeded and the specimen is diluted to obtain an accurate measurement. However, analyte concentrations vastly exceeding the binding capacity of the capture antibody result in also blocking the detection antibody, resulting in a decrease in signal back into the reportable range. Extending the principle to the extreme, it is theoretically possible to have so much analyte present that all the binding sites on both the capture and detection antibodies are occupied; in this case no detection antibody can be bound to the solid phase and the signal is baseline, which would be interpreted as no analyte present! Hook effects occur and are extremely important to recognize in the context of measuring hormones in patients with tumors that secret large quantities of the hormone. Hook effects have been extensively reported for prolactin, hCG, thyroglobulin, calcitonin, and α-fetoprotein.29,30,90-98
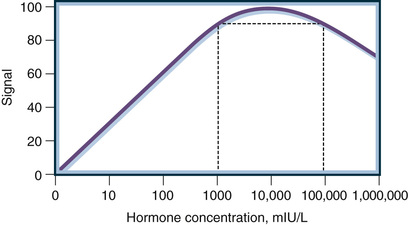
Heterophile antibody interference is, if not a misnomer, certainly a process that encompasses more than just the ability of endogenous antibodies to animal immunoglobulins to interfere in immunometric assays. The mechanism is simple and is illustrated in Figure 6-22. Any analyte-independent process that alters the amount of detection antibody bound to the solid will result in inaccurate assay values. As shown in Figure 6-22, endogenous antibodies (called heterophile antibodies) to animal immunoglobulins can, because antibodies are bivalent, link the detection antibody to the solid-phase capture antibody in the absence of analyte, resulting in a falsely high value reported. Animal immunoglobulins are foreign proteins, and thus the majority of humans are expected to have low titers of animal immunoglobulin antibodies. Immunometric assays are designed with blockers to eliminate heterophile antibody interference. However, some individuals have high titers of heterophile antibodies, which overcome the assay blockers and do result in accurate measurements. In some cases, such as patients treated with drugs containing animal immunoglobulins (e.g., monoclonal-based therapeutics), it is clear why the patient has high titers; in others it is difficult to identify a priori individuals whose specimens might be subject to this artifact.99-109 Heterophiles are not the only form of endogenous antibody that can interfere with immunometric assays by this mechanism (e.g., antibody-based analyte-independent interference). Figure 6-22 shows that endogenous antibodies to epitopes on the target analyte can also result in inaccurate measurements, in this case falsely low results, because the endogenous antibodies block the quantitative detection of analyte. Although the protein hormones and biomarkers relevant to endocrine practice do not elicit the formation of endogenous antibodies in healthy individuals, patients with various autoimmune conditions or other disease processes may have endogenous antibodies that interfere with specific immunometric assays. A classic example of nonheterophile endogenous antibody interference is the interference in thyroglobulin assays by thyroglobulin antibodies in cancer patients.110-112
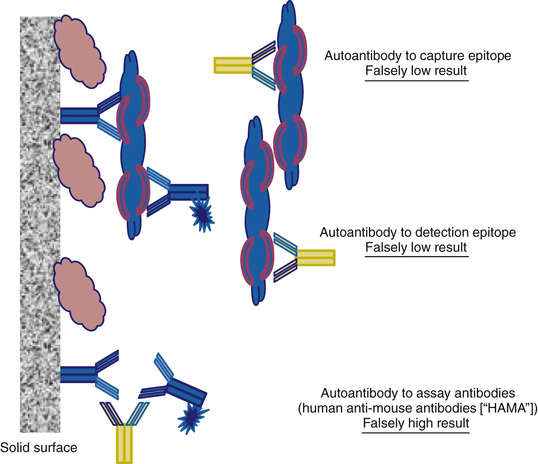
Endogenous antibodies and binding proteins can also interfere with the interpretation of values obtained from antibody-based assays. For example, endogenous antibodies bound to prolactin create what is referred to as macroprolactin. Macroprolactin is not biologically active but is measured in many immunometric assays. This results in prolactin levels being reported that are discordant with clinical manifestations of hyperprolactinemia.94,113 Another example is the ability of competition assays to measure small molecules, such as thyroid or sex hormones, that are inactive when bound to high-affinity carrier proteins, such as thyroxine-binding globulin or sex hormone–binding globulin. In this case, values reported by immunoassay can grossly overestimate the biologic signal represented by the hormone measurement.
Analytic Sensitivity
Strictly, analytic sensitivity is the slope of the response curve. It is determined simply as the change in signal as a function of the change in analyte concentration and represents the smallest change in analyte concentration that can be measured. An example calibration curve is shown in Figure 6-23. The slope of this calibration curve determined by least squares linear regression analysis was 1.01 pg/mL with a goodness of fit of r2 = 0.993 and an intercept of 1.05. Thus the smallest difference that can be measured overall is 1.01 pg/mL with an LOD (intercept) of 1.08 pg/mL. This approach is useful only when the calibration curve is linear (or linearized by log transformation of the analyte concentrations) and the zero calibrator is accurately determined (i.e., there is no matrix effect on the blank measurement). Dose-response curves for clinical assays, regardless of technology employed, are seldom linear, and detector impression can be high. Thus, limits of detection and direct estimates of variance at clinically meaningful analyte concentrations are typically more meaningful in describing assay performance.

The analytic LOD, often less rigorously referred to as sensitivity, is a statistical definition of the lowest concentration that can be measured (i.e., distinguished for zero analyte in the assay system). This concentration is mathematically determined as the upper 95% limit of replicate measurements of the zero standard, calculated from the average signal plus 2.0 SD. The LOD for the curve in Figure 6-23 is 1.80 pg/mL. This minimal detection limit is valid only for the average of multiple replicate measurements. When individual determinations are performed on a specimen having a true concentration exactly at the minimal detection limit, the probability that the measurement is above the noise level of the assay is only about 50%.
A second parameter for the lowest level of reliable measurement for an assay is the functional detection limit, or the limit of quantitation. For this value to be measured, multiple pools with low concentrations are made and analyzed in the replicate. A cross-plot of the coefficient of variation of the measurements versus concentration allows one to generate a precise profile. The concentration corresponding to a coefficient of variation of 20% is the functional detection limit. This term typically applies to across-assay variation, but it also can be calculated for within-assay variation if one uses the tests to evaluate results measured within one run (e.g., provocative and suppression tests).
Precision
Precision is a measure of the replication of repeated measurements of the same specimen; it is a function of the time between repeats and the concentration of the analyte. Both short-term precision (within a run or within a day) and long-term precision (across calibrations and across batches of reagents) should be documented at clinically appropriate concentration levels.114 In general, normal-range, abnormally low range, and abnormally high range targets are chosen for precision studies; however, targets focused on critical medical decision limits may be more appropriate for some analytes.
Twenty measurements are generally considered minimal at each level for both short-term and long-term precision validations. Precision usually is expressed as the coefficient of variation, calculated as 100 times the SD divided by the average of the replicate measurements.115 There is no universal agreement on the performance criteria for analytic precision, although numerous recommendations have been put forth. Two major approaches to defining these criteria have been (1) comparison with biologic variation and (2) expert opinion of clinicians based on their perceived impact of laboratory variation on clinical decisions.
The total variation clinically observed in test measurements is a combination of the analytic and biologic variations. For instance, if the analytic SD is less than one fourth of the biologic SD, the analytic component increases the SD of the total error by less than 3%. If the analytic precision is less than one half of the biologic SD, the total error increases by only 12%. These observations have led to recommendations for maintaining precision of less than one fourth or one half of the biologic variation.
The expert opinion precision recommendations are based on estimates of the magnitude of change of a test value that would cause clinicians to alter their clinical decisions.
Accuracy
Two methods of assessing the recovery of assays are (1) measuring the proportional changes caused by mixing high-concentration and low-concentration specimens and (2) measuring the increase in test values after the reference analyte is added. Some analytes circulate in the blood in multiple forms, and some of these forms may be bound to carrier proteins. The recovery rate of pure substances added to a specimen may be low if the assay does not measure some of the bound forms. Mixtures of patient specimens may not be measured correctly if one of the specimens contains cross-reacting substances such as autoantibodies. A thorough understanding of the chemical forms of the analyte and their cross-reactivities in the assay is important during assessment of recovery data.
Measuring the proportional changes caused by mixing high-concentration and low-concentration specimens is referred to as a linearity validation. An example is shown in Figure 6-24. A specimen containing a relatively high analyte concentration is diluted with a specimen containing “no” analyte. Practically, “no” analyte means analyte levels less than the detection limit of the assay as specimens with no analyte are typically not available. Figure 6-24A shows the measurement of diluted specimens as a function of dilution. The point at which concentration no longer changes with increasing dilution is called the limit of blank (in this example, 10 pg/mL). The limit of blank can be significantly higher than the LOD or the limit of quantitation in some assays. Dilution linearity data (as in Fig. 6-24A) can be replotted (as in Fig. 6-24B) to evaluate the accuracy of an assay in terms of the analytic recovery of added analyte. Usually data are fitted by a linear regression. Assuming that the x- and y-axes have identical scaling, the slope*100 is the percent analytic recovery. Analytic recoveries less than or more than 100 reflect the bias of measurement for a given assay.
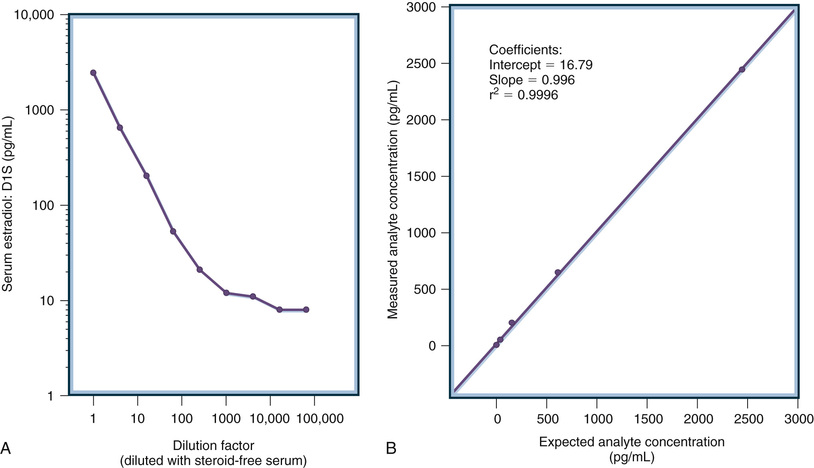
Measuring the increase in test values after a reference analyte is added is referred to as a spiked recovery validation. The analytic approach is identical to that illustrated in Figure 6-24B except that the expected analytic concentration is based on the addition of analyte to specimens rather than calculated based on the dilution of specimens. The most appropriate analytes for use in analytic recovery studies are certified reference materials, such as those from the WHO or the National Institute of Standards and Technology (NIST), although such well-characterized materials are not available for all analytes. Ideally a rigorous method validation would also include comparison to a reference method (i.e., a method that has been carefully validated previously). These are generally performed by highly specialized laboratories, and reference methods do not yet exist for many analytes of interest in endocrine testing or for novel biomarkers.116-124
At a minimum, the evaluation of accuracy by any of the methods described previously should be conducted using specimens from healthy subjects and specimens from patients with the diseases being investigated.125 Whenever possible, the assay should be traceable to established reference standards or methods. Between 100 and 200 different specimens distributed over the assay range are recommended for method comparisons.126-130 Although acceptable performance criteria for method comparisons are not well established, some important characteristics to examine are as follows:
• Any grossly discordant test values
• The degree of scatter about the regression curve
• The size of the regression offset on the vertical axis
• The number of points crossing between the low, normal, and high reference intervals for the two methods
The European Union has enacted an In Vitro Diagnostics Directive that requires manufacturers marketing in the European Union to establish that their products are “traceable to reference standards and reference procedures of a higher order” when such references exist.132 Hopefully, medically relevant performance characteristics that define the allowable ranges for differences between a specific assay's test values and the traceable standards will be linked with this traceability requirement. This combination of traceability and allowable error requirements could serve to harmonize many test methods worldwide, because most diagnostic companies market internationally. Standardization and harmonization of hormone assays have become priorities for quality health care.119,124,131,132
Carryover
Many diagnostic systems use automated sample-handling devices. If a specimen to be tested is preceded by a specimen with a very high concentration, a trace amount remaining from the first specimen may significantly increase the reported concentration in the second specimen. The choice of the concentration that should be tested for carryover depends on the pathophysiology of the disease, but high values may need to be tested because some endocrine disorders can produce high values. Validations also typically include assessing possible carryover from the sampling probe and for plate-based assays assessing detector carryover from nearby wells.
Utilization Parameters
Once an assay has been analytically validated, it is necessary to validate its utilization. The key aspects of utilization involve defining limits associated with specimen and reagent stability and ensuring that the assay is stable over time.
Specimen Stability
Validating specimen stability typically involves testing a series of aliquots taken to determine if the analyte measurement changes over time. This evaluation typically includes specimens representing the full range of specimen types to be tested (see later) and encompasses processing times and temperatures expected with respect to specimen collection and transport to the laboratory as well as stability during laboratory processing and on instrument time and during the assay itself. This is a critical aspect of method validation that can be very costly and labor intensive.
Reagent Stability
The stability of reagents used in the assay must also be defined. This includes both on-board stability and shelf-life stability for commercial, automated systems that are widely used in modern clinical laboratories. Although reagent expiration dates are determined and provided by commercial manufacturers, they must be verified under the actual working conditions of the laboratory and take into account workflow processes such as reconstituting lyophilized calibrators or refreezing calibrator/control aliquots. For laboratory-developed methods such as LC/MS-MS, the laboratory must also determine expiration dates for all reagent components and stock materials.
Robustness (Assay Stability)
Robustness is typically defined as the stability of measurement over time, which includes variance associated with reagent lot changes, equipment changes, and technologist performance.133 Robustness validation provides the specifications for the reliability of the method during extended normal usage. These specifications become the basis for setting limits on variance, and it is critical that laboratories inform clinicians of changes that exceed these practice-relevant limits. For example, changes in antisera can cause significant changes in immunoassay performance, which in turn require revising reference interval and clinical decision points.
Interpretation Parameters
Reportable Range
The reportable range of an assay usually spans from the limit of quantitation to the concentration of the highest calibrator. Signal measured above the highest standard requires specimen dilution and retesting. This is typically done automatically in instrument systems but must be done manually in plate assay systems. In either case, an important aspect of method validation is to assess accuracy when a specimen must be diluted. Dilution is often associated with alternation of matrix effects and other interferences in an assay. Thus, an assay that is accurate over the calibration range may not be accurate over the full reportable range when dilutions are utilized to obtain quantitative measurements. The validity of the analytic range is documented by the linearity and recovery studies. Most clinical laboratories confirm the reportable range of each assay at least twice a year.
Reference Intervals
Reference intervals, also commonly referred to as normal ranges, describe the analyte values expected from a given assay when healthy individuals are tested.134-136 This is in contrast to clinical decision points, or cutoff values, determined for identifying patients with specific disease conditions (see “Diagnostic Power” following). The development and validation of reference intervals for endocrine tests can be very complex tasks as they require defining the healthy population by clinical evaluation137,138 and testing large numbers of healthy individuals,134,136 which often involves obtaining informed consent and related costly activities. Manufacturers of commercially available assays are required to provide reference intervals, but these do not necessarily represent the subpopulation served by the laboratory.
The normal reference interval for most laboratory tests is based on estimates of the central 95 percentile limits of measurements in healthy subjects. A minimum of 120 subjects is needed to reliably define the 2.5 and 97.5 percentiles. Formal statistical consultation is usually required to determine the appropriate number of subjects to test and to develop statistical models for defining multivariate reference ranges.139-141
The reference intervals for many endocrine tests depend on gender, age, developmental status, and other test values. Figure 6-25 illustrates this complexity. Shown are the ranges of values (shaded areas) expected on a daily basis for hormone measurements in healthy young women across the menstrual cycle.

Diagnostic Power
Determining the clinical usefulness of the assay is typically the last step in validation. For commercially available assays the manufacturer is required to do this. The degree to which the assay is validated in this regard depends on specific FDA regulatory requirements (see “Classes of Assays” section later). Clinical laboratories using these assays are required to verify clinical utility claims depending on the specific requirements of the relevant accrediting organization, but generally the approach is to verify the clinical sensitivity and specificity of the assay using specimens from patients known to have or not have a specific clinical condition that the assay is designed to address. In contrast, for laboratory-developed methods, which include mass spectrometry and many molecular-based assays, the clinical laboratory is required to determine clinical decision points (cutoff values). In either case, good laboratory practice includes verification of clinical utility periodically as part of the laboratory's quality control (QC) and quality assurance (QA) programs. The details of clinical utility validation are beyond the scope of this chapter, but a high-level understanding of the processes is important because clinical sensitivity and specificity and cutoff parameters can help clinicians determine the relative weight to give assay results in the context of the entire clinical picture. Many excellent discussions have been published to provide in-depth details for interested readers.142-146
Clinical sensitivity and specificity are not to be confused with analytic sensitivity and specificity, which are assay characteristics. In contrast, clinical sensitivity and specificity quantify the ability of the assay, or any clinical diagnostic procedure, to correctly identify disease states, and these parameters are expressed as percentages. Clinical sensitivity is the percentage of patients with positive test results who actually have the target condition (i.e., they have the disease the assay is intended to identify); it is the true rate of accurate diagnosis. Subtraction of the clinical sensitivity from 100 provides the rate of false-positive results for an assay (i.e., the percentage of patients with positive test results who do not have the disease).
Clinical specificity deals with patients with negative assay results. It is the percentage who actually do not have the disease (i.e., who are correctly identified as negative by the assay). Subtracting the clinical specificity from 100 gives the false-negative rate of the assay.
Clearly, to determine clinical sensitivity and specificity the laboratory must have two key things: (1) specimens from patients known to have or not have the disease and (2) either reference intervals or clinical cutoff points to provide a positive or negative interpretation to quantitative test results. Obtaining specimens from patients with known conditions for the purpose of assay validation/verification is challenging as the process requires accurate clinical information, Health Insurance Portability and Accountability Act (HIPAA) compliance, and specimens collected and handled in a fashion consistent with normal workflow. All these steps can be expensive and challenging and are best accomplished with the close collaboration of physicians who utilize the laboratory services.
Clinicians must appreciate that laboratory-derived clinical sensitivities and specificities are subject to many potential biases. First, in many cases laboratories rely on already established assays to provide the disease status information; in other words, they are comparing to predicate device results rather than clinical information. Even when using clinically characterized individuals to provide the disease-positive specimens, bias can be incorporated if the healthy group is not age- or gender-matched. Finally, using either clinical cutoffs or reference intervals to define a positive versus negative assay result is subject to statistical biases, such as normal versus non-normal distribution of measurement.
Operational Parameters (Preanalytic Considerations)
Specimen Types
Many types of specimens are routinely used for the measurement of analytes in bodily fluids. The most common are whole blood, serum, plasma, urine, and saliva. Less frequently, fluids or cells derived from fine-needle aspirates are sent to the clinical laboratory for analysis. It is critical to understand that each type of specimen must be subjected to rigorous validation to ensure accurate measurements. Simply because an assay is valid for a given specimen type does not mean that it is valid for any specimen type. Even if an assay is capable of reproducible and specific measurement of an analyte in different specimen types, there may be clinically significant bias depending on the specimen type tested. Reference intervals and clinical cutoff values must be verified for each specimen type utilized.
Whole Blood.
Whole blood specimens have both the limitation and the advantage of time dependency. The ability to detect rapid changes to a provocative stimulus is a strong advantage, whereas the unsuspected changes resulting from pulsatile secretions may be a major limitation. Whole blood is advantageous when the analyte is very labile as the specimen can be collected and tested quickly. The ability to test whole blood without processing at the point of care can be cost effective and enhance patient management as well as effectively address problems of specimen stability with respect to very labile analytes. Blood drops collected on filter paper from punctures of a finger or heel are a convenient system for collecting, transporting, and measuring hormones.147,148
If standardized collection conditions and extraction techniques are used, these measurements correlate well with serum measurements. Integration of immunochemistry with computer chip technology has also led to immunochips that can measure multiple analytes using a single drop of blood.149
The use of whole blood is severely limited by several factors: (1) whole blood must be prevented from clotting during analysis, necessitating the use of anticoagulants, which often interfere in assays, and (2) whole blood is a very complex mixture of components that can directly interfere with analytic methods. Solutions to these problems include (1) dilution of the whole blood specimen in the assay, which in turn requires that the analyte being measured is in relatively high concentration or that the assay is extremely sensitive, and (2) preanalytic processing to remove the cellular fraction or reduce the complexity of the specimen. Traditionally specimen types most often used for endocrine testing are serum or plasma for these reasons.
Serum.
Serum is obtained from whole blood specimens simply by allowing the blood to clot. Allowing whole blood to clot in glass tubes allows the serum to be completely and easily separated from the clot by centrifugation. The resultant serum specimen is free of cells, and many of the proteins involved in the clotting process are also removed. This has been the method of choice for large protein analytes such as immunoglobulins or for very stable analytes such as steroid hormones. In some laboratories testing has involved replacing the glass phlebotomy tube with safer plastic ones that will not break during handling, especially in the newer fully automated laboratories. Unfortunately whole blood does not clot cleanly or quickly in plastic tubes and clot activators or enhancers are added to the tubes. These factors can interfere with many analytic methods and must be carefully validated.
Plasma.
Plasma is obtained by chemically preventing the clotting process and then centrifuging to remove the cellular components of whole blood. There are a number of approaches to preventing clotting; most commonly, ethylenediaminetetra-acetic acid (EDTA), citrate, or heparin is added to prevent clotting. These chemicals, especially EDTA, have the additional advantage of inhibiting proteolysis and are thus also advantageous when testing labile analytes such as adrenocorticotropic hormone (ACTH) or PTH. Other additives are also added to stable plasma for specific tests; for example, sodium fluoride is added to EDTA tubes to inhibit glycolysis when glucose measurements are desired. Of course, all of these additives have the potential to interfere with specific assay methods.
Separation of the cellular elements in anticoagulated whole blood can be enhanced by the use of gel separators. This type of tube is often preferred in automated aliquoting systems. Unfortunately, the gel used can interfere directly or indirectly (e.g., by trapping analytes) in some analytic methods.
Phlebotomy tubes with additives also create special considerations when collecting blood in multiple tube types. Tubes must be drawn in a specific order to avoid contamination with additives that are known to interfere in standard laboratory tests. Failure to collect additive tubes in the proper order is not identifiable once the tubes are received in the laboratory and can lead to serious inaccuracies in test results. The correct order for drawing the most commonly used phlebotomy tubes is shown in Figure 6-26.150 The stopper color is standardized to indicate what additives each tube contains. For example, the tube with a red stopper (3) contains only clot activators, and the yellow stopper tube (2) contains both clot activators and a separation gel. The lavender-topped tube (6) contains EDTA and must be drawn after a clot tube for serum (2 or 3) or tubes containing heparin (4 and 5).
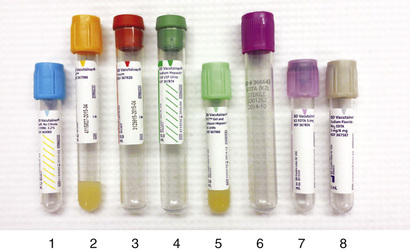
Urine.
Urine often contains not only the original hormone but also key metabolites that may or may not have biologic activity. The 24-hour urine specimen is used for many endocrine tests. Such urine specimens represent a time average that integrates over the multiple pulsatile spikes of hormone secretion occurring throughout the day. The 24-hour urine specimen also has the advantage of better analytic sensitivity for some hormones and metabolites.55,151-158
Drawbacks include the inconvenience of collecting the 24-hour specimen and delays in collection. Another limitation of urine specimens is uncertainty regarding the completeness of the collection. Measurement of urinary creatinine concentrations helps in monitoring collection completeness, especially when this value is compared with the patient's muscle mass. Many urinary hormones are conjugated to carrier proteins before excretion. Therefore, both hepatic function and, to a lesser degree, renal function may alter urinary hormone values.
Saliva.
Saliva is an attractive alternative specimen for measuring non–protein-bound hormones and small molecules.159-162 Small analytes in blood pass into oral fluid by crossing capillary walls and basement membranes and by passing through lipophilic membranes of epithelial cells.163 This transport involves passive diffusion, ultrafiltration, active transport, or some combination of these processes. The concentration in saliva depends on the concentration of the non–protein-bound analyte in blood, the salivary pH, the acid dissociation constant (pKa) of the analyte, and the size of the analyte. Analytes entering saliva by passive diffusion usually are less than 500 Da in size, non–protein-bound, and nonionized. As with any specimen type, it is essential to fully validate the use of saliva in each analytic method and to establish the data needed for interpretation of test results, such as reference intervals.
Saliva measurements reportedly correlate with blood measurements for some hormones such as cortisol, progesterone, estradiol, and testosterone, but they do not correlate well for others (e.g., thyroid and pituitary hormones).164-172 Multiple preanalytic variables can affect the salivary measurement. Stimulation of oral fluid production by chewing or by the use of candy or drops that contain stimulants such as citric acid can increase oral fluid volume and stabilize pH but may alter some analyte concentrations. Several commercial devices are available for collection of oral fluid; however, these devices need to be validated for each analyte and each assay system to ensure they adequately recover each of the analytes.
Saliva is also an effective specimen type for obtaining genomic DNA and other nucleic acid assay applications. Its use in this regard is now well established and rapidly advancing.173-175
Fluids and Tissue From Fine-Needle Aspiration.
Fine-needle aspiration (FNA) involves the insertion of a hollow needle into tissue, typically a suspicious lump or inflamed tissue, to withdraw fluid or cells for diagnostic evaluation. The procedure is usually performed manually by the surgeon or a cytopathologist when a palpable lump is present or the tissue target can be seen (e.g., during a surgical procedure). Deep sampling can be achieved using x-ray or ultrasound guidance. Analysis of the cellular components of a FNA is done in the cytopathology laboratory and involves the examination of cells by histologic and immunohistologic procedures.
FNA fluids thus represent a unique specimen type for analysis of biomarkers by traditional immunoassays or by LC/MS-MS methods. However, FNA fluids present special considerations with respect to handling, stability, validation, and interpretation. Aspirated fluids are typically obtained in volumes too small to directly assay and often will clot due to contamination with whole blood. Analyte stability as well as assay parameter validation must be determined using aspirated fluid and diluents required to provide the necessary volume and anticoagulation prior to testing. Interpretation is often difficult because reference intervals applicable to individual patients are seldom available and often analytes, such as thyroglobulin in neck mass aspirates, are high enough to cause artifacts in assays (such as hook effects in antibody-based assays).
Aspirated cells can provide sufficient DNA and RNA for genetic analysis. Currently this is an area of intensive investigation that has only just begun to be applied by clinical laboratories. Typical methods being applied include expression arrays, real-time PCR, and DNA methylation assays as well as the widespread and traditional application of immunohistochemical assays for specific biomarkers.177 For example, expression arrays can provide clinically valuable information for the 15% to 30% of thyroid nodules subjected to FNA and characterized as indeterminate by cytologic tests.178
Other current clinical applications of FNA in conjunction with diagnostic assays include chorionic villus sampling179,180 and measurement of biomarkers in aspirates from pancreatic tumors.181-183
Quality Control
Laboratory quality control procedures are intended to ensure that the tests are being performed within defined limits established during the validation of the assay.184-188 The goal of these procedures is to identify circumstances when results obtained may not be accurate. They rely heavily on the testing of materials with known analyte concentrations. Quality control failures are meant to detect instrument problems (hardware or instrument failures), reagent or calibration failures, and human mistakes (improper handling of reagents or specimens, training problems, or shift change communication failures).
Statistically, there are two major forms of analytic errors: random and systematic. Random error relates to reproducibility; systematic error relates to the offset or bias of the test values from the target or reference value. Performance criteria can be defined for each of these parameters, and quality control systems can be programmed to monitor compliance with these criteria. Control systems must have low false-positive rates as well as high statistical power to detect assay deviations. The multirule algorithms developed by Westgard and colleagues use combinations of control rules—such as two consecutive controls outside warning limits, one control outside action limits, or moving average trend analyzers outside limits—to achieve good statistical error detection characteristics.185-188 Traditionally, quality control programs have focused primarily on precision; however, analytic bias also can cause major clinical problems. If fixed decision levels are used to trigger clinical actions (e.g., therapy, additional investigations), changes in the analytic set-point of an assay can cause major changes in the number of follow-up cases. More modern quality control systems use moving averages of patient test values to help monitor changes in analytic bias. Increasing numbers of web-based systems are available for laboratories to share quality performance data, allowing better statistical evaluations (larger numbers of values to identify shifts and drifts in quality control measurements).
Quality Assurance
Quality assurance procedures go beyond monitoring test values for control materials. Testing of quality control materials only identifies errors that occur during testing per se (i.e., the analytic phase of the overall process from ordering a test until the results are reported back to the physician). A look at when errors typically occur provides important insight into the issues. As illustrated in Figure 6-27, errors that occur during the analytic process represent less than a third of all errors associated with laboratory testing.

Quality assurance procedures are part of the regulatory requirements of a clinical laboratory. All laboratories have procedures to monitor things like specimen transport times and report accuracy, which are processes that can be established solely within the laboratory. A key element of quality assurance, and one that should be emphasized for clinicians who are critical to its success, is the identification and investigation of test values that are discordant. Some of these discordant test values may be analytically correct, but others may be erroneous. Clinicians must help identify and investigate these suspicious test values by requesting laboratories to perform a few simple validation procedures.
Repeated testing of the same specimen is a valuable first step. If the specimen has been stored under stable conditions, the absolute value of the difference between the initial and the repeated measurements should be less than 3 analytic SDs 95% of the time. Normally, the 95% confidence range is associated with the mean ± 2 SDs; with repeated laboratory tests, however, errors are associated with the first as well as the second measurement. The confidence interval for the uncertainty of the difference between two measurements can be calculated using the statistical rules for propagation of errors.
To better understand this propagation of error, consider:

where X1 is the first measurement, X2 is the repeated measurement, and D is the difference.
The variance of D is the sum of the variance of X1 and the variance of X2. The SD of D is the square root of the variance of D, or the square root of twice the variance of X1. The SD of D equates to the square root of 2 multiplied by SD(X). Therefore, 95% of the absolute values for D should be within square root of 2 times 2 SD(X), or approximately 3 SD(X). If a repeat measurement exceeds this 3 SD(X) limit, the initial (or reagent) measurement is probably in error.
Linearity and recovery are valuable techniques for evaluating test validity in individual specimens. If the initial test value is elevated, serial dilution of the specimen in the assay diluent and reassay should be considered. If the initial value is low, one may consider adding known quantities of the analyte to part of the specimen. Analyzing these spiked or diluted specimens with the original specimen allows one to evaluate both reproducibility and recovery. It may be helpful to analyze the linearity or recovery of the assay standards at the same time, to provide internal controls of the dilution or spiking procedures and the appropriateness of the diluent and spiking material. If the replication, dilution, or recovery experiment appears successful, further analytic troubleshooting will vary according to the method used. For example, immunoassays may be affected by interference caused by heterophile antibodies or hook effects as described earlier. Addition of nonimmune mouse serum or heterophile antibody-blocking solutions may neutralize these effects. Chromatographic assays are usually more robust than immunoassays but often lack the specificity. Specimens with suspected interference on one type of assay can be reanalyzed by means of an alternative methodology. Interferences with cross-reacting drugs and metabolic products can be minimized with selective extraction or identified by adding drug to nondiscordant specimens.
Classes of Assays
In the United States the regulations governing clinical laboratories fall into several categories based on the manufacture of assay components, the intended use of the assay, and how the assay service is billed. In order to be reimbursed by Medicare and other health insurance organizations laboratories must comply with federal legislation known as the Clinical Laboratory Improvement Amendments (CLIA). This legislation requires that laboratories be certified by specified organizations (e.g., the College of American Pathologists or the Joint Commission for the Accreditation of Hospital Organizations) and is administered by the Centers for Medicare & Medicaid Services (CMS) within the United States Department of Health and Human Services (DHHS). CMS also administers the HIPAA of 1996 and other quality standards that laboratories must comply with under federal law. CMS/CLIA certification requires quality inspections every 2 years to ensure that laboratories are meeting the standards outlined in the federal CLIA guidelines and the performance standards specified by the laboratory's inspecting agency. Inspecting agency standards are based on the CLIA guidelines.
In contrast, the manufacture and sale of assay reagents and instruments are regulated by guidelines called current Good Manufacturing Practices (cGMPs), which cover very specific topics and are periodically amended.189-194 Compliance with cGMPs is enforced by the FDA under federal law.195 Besides the manufacture and sale of instruments and reagents, laboratory-developed methods used in patient care are encompassed within the jurisdiction of the FDA. The FDA does not certify compliance and conducts its own quality inspections. Failure to comply with cGMPs is a violation of federal law (as opposed to reimbursement requirements under CLIA) and can result in laboratory closure as well as potential fines and legal actions. Sale of assay instruments and reagents requires premarket approval by the FDA or FDA clearance under Section 510(k), depending on the clinical use of the product and its potential impact on patient care.
Common elements to clinical laboratory standards and CLIA and cGMP guidelines include laboratory evaluation and documentation of validation verification for commercially available reagents and instruments, which have been 510(k) approved or preapproved by the FDA and whose continued manufacture is overseen by the FDA. Requirements for laboratory-developed methods, which include any modifications of FDA-approved/cleared commercial procedures, are more extensive, and validation per se is expected.
Conclusion
The analytic methods of assessing endocrine problems in patients are continually expanding. The newer systems are often based on analytic techniques similar to those outlined in this chapter, but the configurations are generally more user friendly. These advances make the systems more convenient, but they also become more of a “black box” that conceals most of the details of the system. The methods, their descriptions, and approach to their validation, as outlined in this chapter, are intended to provide the clinician with insights into the inner workings of these systems and to encourage a more detailed level of interaction with the clinical laboratory in its ever more challenging endeavors to provide cost-effective, yet high-quality support for patient care.
Acknowledgment
The authors gratefully acknowledge the work of George G. Klee, MD, PhD, who authored this chapter in the previous edition. The authors also thank Dr. Neal Lindeman and Dr. Kent Lewandrowski for reading the draft manuscript and for their helpful suggestions.