Electrocardiography
Leonard Ganz
Electrocardiography, which has changed surprisingly little since initially introduced by Einthoven in the early 1900s, allows simultaneous recording of myocardial activation from several vantage points on the body's surface, thereby permitting analysis of electrical activation in different myocardial regions. Surface electrocardiography may be supplemented with intracardiac recordings, which are particularly helpful in the diagnosis and management of cardiac arrhythmias (Chapter 62).
 Normal Function and Electrocardiogram
 Normal Cardiac Activation
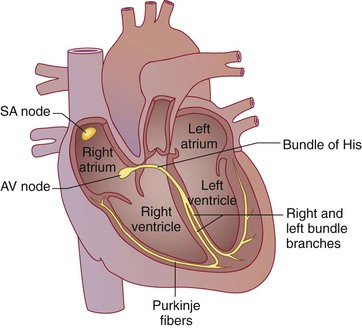
Electrical activation of the heart depends on the spread of a depolarizing wave front from pacemaker cells through cardiac muscle as well as through specialized conducting tissues (Fig. 54-1). Under normal circumstances, cells in the sinoatrial nodal complex in the high lateral epicardial right atrium spontaneously depolarize at the highest rate and therefore constitute the dominant cardiac pacemaker (Chapter 61). This electrical wave front spreads throughout the right and left atria; specialized conducting tracts called Bachmann bundle speed the depolarizing wave front to the left atrium. Electrical atrial activation triggers atrial muscle contraction, which propels blood through the tricuspid and mitral valves into the right and left ventricles. Normally, the atrioventricular (AV) node, where conduction delay is physiologic, serves as the only electrical connection linking the atria and ventricles; the AV valve rings are insulated. The depolarizing wave front exits the AV node into the bundle of His, a specialized conducting tissue capable of rapid conduction. The bundle of His bifurcates into right and left bundle branches; the left bundle branch divides into the left anterior and left posterior fascicles. The bundle branches and their more distal ramifications of specialized conducting tissue are called the Purkinje system. From these specialized conducting tissues, the depolarizing wave front enters into and then moves through ventricular muscle. As in the atria, ventricular electrical activation begets muscle contraction, which pumps blood through the semilunar valves into the pulmonary and systemic circulations. After electrical activation, or depolarization, a period of electrical recovery, or repolarization, is necessary before repeated activation.
At the cellular level, a complex orchestration of ion channels opening and closing determines the membrane potential throughout this process. The flow of ions into and out of the myocardial cells inscribes an action potential that reflects depolarization and repolarization as well as the spontaneous depolarization of pacemaker cells (Chapter 61).
Electrocardiographic Waves
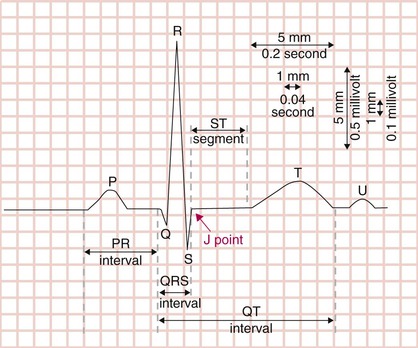
Labeled alphabetically, beginning with the P wave, the basic waves of the electrocardiogram (ECG) correspond to these electrical events (Fig. 54-2). The P wave represents atrial muscle depolarization; in severe hyperkalemia, atrial electrical activation may be unaccompanied by atrial muscle activation, and no P wave is inscribed. The QRS complex represents ventricular muscle depolarization; the disparity between ventricular and atrial muscle mass typically yields a QRS complex much larger in voltage amplitude than the P wave. Recorded from multiple vantage points, the QRS complex harbors tremendous information about the structure and function of ventricular tissue. Under normal circumstances, the PR interval, which is the segment from the onset of the P wave to the onset of the QRS complex, represents the delay between atrial and ventricular depolarization. The ST segment and T wave (and occasionally the U wave) reflect ventricular repolarization, a process of electrical recovery that must take place before the ventricle can be depolarized again. The J (junction) point denotes the end of the QRS complex and beginning of the ST segment. Atrial muscle also requires repolarization before the next depolarizing wave front. Because ventricular mass far exceeds atrial muscle mass, the low-amplitude atrial repolarization wave is buried underneath the QRS complex and is rarely manifested on the ECG.
One rarely seen ECG finding, the J wave (of Osborn), breaks with the alphabetic convention of the other electrocardiographic waves. Defined as a positive deflection on the QRS downstroke or at the J point, the J wave is seen most commonly in hypothermia (Fig. 54-3). It has also been described in hypercalcemia and brain injury and may increase the risk of idiopathic ventricular fibrillation (see later).
Electrocardiography Standards
A standard ECG is recorded on paper with 1-mm (“small” boxes) as well as 5-mm (“big” boxes) gridlines (see Fig. 54-2). Voltage amplitude is measured on the vertical axis (typically 10 mm equaling 1 mV) and time on the horizontal axis. Because the usual ECG recording speed is 25 mm/sec, each 1-mm gridline (small box) represents 0.04 second (40 msec), and each 5-mm gridline (big box) equals 0.2 second (200 msec). These standard calibrations can be modified in unusual circumstances, but such modifications are typically printed on the ECG.
A standard ECG is recorded during a 10-second period, although a rhythm or monitor strip can be recorded for substantially longer if necessary. Multiple leads are typically recorded simultaneously from the top to the bottom of the page. The usual groupings of leads include I, II, and III; aVR, aVL, and aVF; V1, V2, and V3; and V4, V5, and V6 (see later). Each group of leads is recorded for 2.5 seconds. A single lead (or multilead) rhythm strip is recorded below for the entire 10 seconds. Thus, as the ECG is scanned from left to right, one sees 10 seconds of cardiac activity, with each complex recorded simultaneously in multiple leads.
Normal Intervals
Each of the various ECG waves and intervals has normal ranges, defined from large numbers of electrocardiographic recordings in (presumably) healthy subjects (Table 54-1; see Fig. 54-2).
TABLE 54-1
NORMAL ELECTROCARDIOGRAPHIC INTERVALS
| Heart rate | 50-100 beats per minute |
| P wave duration | < 0.12 sec (120 msec) |
| PR interval | 0.09-0.20 sec (90-200 msec) |
| QRS duration | 0.075-0.11 sec (75-110 msec) |
| QTc | males: 0.39-0.45 sec (390-450 msec); females: 0.39-0.46 sec (390-460 msec) |
| QRS axis | −30 to +90 degrees |
The RR interval (or PP interval), which is the measurement from R wave to R wave (or P wave to P wave), allows calculation of the heart rate. Because there are 60,000 msec in a minute, the heart rate (HR) in beats per minute can be easily calculated from the RR or PP interval in milliseconds:
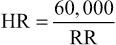
Although the normal resting heart rate has traditionally been defined as being 60 to 100 beats per minute, a range of 50 to 90 at rest may actually be more reflective of normal physiology. When the heart rate is grossly irregular, as in atrial fibrillation (Chapter 64), the RR interval can be averaged over a number of cardiac cycles to estimate the heart rate. Because a standard ECG records 10 seconds in time, the heart rate (beats per minute) will equal the number of QRS complexes recorded on a standard ECG multiplied by 6. Alternatively, in a regular rhythm, the heart rate can be quickly estimated by counting the number of big boxes between consecutive QRS complexes or P waves (i.e., 2 large boxes = 150 beats per minute, 3 large boxes = 100 beats per minute, 4 large boxes = 75 beats per minute, 5 large boxes = 60 beats per minute, and so on).
P Wave Duration
The P wave duration, from the beginning to the end of a P wave, is typically less than 0.12 second (120 msec, three small boxes) in length. A broader P wave reflects an intra-atrial or interatrial conduction delay, or both. Abnormalities in P wave amplitude, morphology, and axis may reflect atrial enlargement.
PR Interval
The PR interval, measured from the onset of the P wave to the onset of the QRS complex, normally lasts between 0.09 and 0.2 second (90 to 200 msec). One-to-one AV conduction with a PR interval longer than 0.2 second has traditionally been called first-degree AV block, but delayed AV conduction may be a more appropriate term. Conduction through the atrial tissue, the AV node, and the His-Purkinje system contributes to the PR interval. When the PR interval is prolonged, delay is usually present in the AV node, although other sites of delay are possible. In the Framingham Heart Study, PR interval prolongation was associated with an increased risk of atrial fibrillation, a higher likelihood of later needing a pacemaker, and a higher overall mortality. A short PR interval may reflect ventricular preexcitation (Wolff-Parkinson-White syndrome), a junctional rhythm, or enhanced AV nodal conduction.
QRS Complex
The QRS complex, which reflects ventricular muscle electrical activation, carries important information in patients with coronary artery disease, cardiomyopathy, metabolic abnormalities, and other conditions. Capital letters (Q, R, S) denote large-amplitude deflections (≥5 mm or 0.5 mV), whereas lowercase letters (q, r, s) signify low-amplitude deflections (<5 mm or 0.5 mV). Q, q, S, and s waves are negative excursions from the isoelectric baseline, whereas R and r waves are positive deflections. Q and q waves are initial negative deflections, and S and s waves are negative deflections that follow a positive deflection (R or r wave); a QS complex is an entirely negative deflection. Q waves may reflect prior myocardial infarction (Chapter 73). An R′ or r′ wave refers to a second positive deflection after an S (or s) wave. The duration of the QRS complex reflects the time required for ventricular depolarization. Ventricular activation usually requires at least 0.075 second (75 msec, nearly two small boxes). There is some debate about the upper limit of the normal range for QRS duration; a consensus document specified 0.11 second (110 msec, nearly three small boxes). If the QRS duration is prolonged, an intraventricular or interventricular conduction delay (or both) is present. Particular patterns of interventricular conduction delay are termed bundle branch block (see later).
QT Interval
The QT interval, which reflects ventricular repolarization, is measured from the onset of the QRS complex to the end of the T wave. The QT interval is generally measured in leads II, V5, and V6 (see later) and reported as the longest interval among the three, averaged over three to five cycles. If the QT interval cannot be accurately measured in these leads, other leads may be used. The QT interval must be corrected to allow comparison of this interval at differing heart rates. Bazett's formula defines a corrected QT interval (QTc):
Bazett's formula works reasonably well at heart rates in the normal range but overcorrects at high rates and undercorrects at low rates. Although more complex regression formulas have been developed to correct the QT interval at different heart rates, none has achieved widespread clinical use. Irregular rhythms (notably atrial fibrillation) complicate calculation of the QTc. Some investigators recommend measuring at least three QT intervals to get an average and then using an RR interval averaged over 10 cycles in Bazett's formula. The Fridericia formula,
may actually be more accurate than Bazett's formula in atrial fibrillation.1
The presence of a U wave complicates measurement of the QT (and therefore QTc) interval because it is not always clear where the T wave ends and whether the U wave should be included in a QTU interval. If the isoelectric baseline is reached between the T and U waves, the U wave is not generally included in the QT interval. If the T wave “merges” into the U wave without reaching the isoelectric baseline, the U wave is included in the QT (or QTU) interval. The QTc in a given patient may vary somewhat during the course of the day and tends to be slightly longer in young and middle-aged women than in men. The upper limit of a normal QTc is somewhat debatable, but a cutoff of 0.45 second (450 msec) in men and 0.46 second (460 msec) in women is generally used. The QT interval is sensitive to drug effects as well as to electrolyte and metabolic derangements. Patients with widened QRS complexes frequently have prolonged QT and QTc intervals. In these patients, the JT interval (from J point to the end of T wave) may be a more accurate index of repolarization, but normal standards have not been established.
Patients with a prolonged QTc, whether congenital or acquired, may be at risk for torsades de pointes ventricular tachycardia (Chapter 65). A short QTc interval (<390 msec) is unusual, and the rare patient with the short QT syndrome is at risk for malignant ventricular arrhythmias. Both short and longer QTc intervals are associated with a higher risk for development of atrial fibrillation, even in the absence of underlying structural heart disease.2
Electrocardiographic Leads
Recording a single ECG lead allows calculation of the heart rate and, frequently, accurate diagnosis of the heart rhythm. When the ECG is recorded from multiple skin leads simultaneously, the direction (or vector) of activation as the electrical wave front moves through the heart can be inferred. Although a number of different lead systems are possible (and some are actually used in research settings), standard electrocardiography uses 12 leads from 12 vantage points, recorded with 10 electrodes, six on the chest wall and four on the limbs. In reality, only three limb leads are actually used to generate recordings; the right leg lead serves as an electrical ground. The limb leads, called the frontal plane leads, generate bipolar and augmented unipolar lead recordings. The chest or precordial electrodes record unipolar recordings. Bipolar leads record the potential difference between two skin electrodes. In unipolar recordings, the lead of interest, the exploring electrode, is compared with a reference electrode. By convention, a positive deflection is recorded if the electrical wave front is moving toward the positive electrode in a bipolar pair or toward the exploring electrode in a unipolar lead.
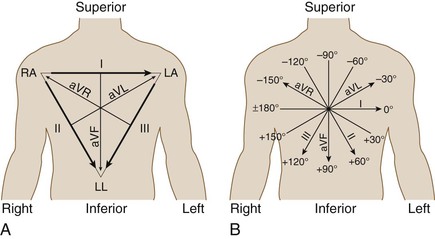
The bipolar limb leads measure potential differences between electrodes on pairs of limb electrodes and closely resemble Einthoven original string galvanometer recordings. Lead I compares the right arm (negative) and left arm (positive); lead II, the right arm (negative) and left leg (positive); and lead III, the left arm (negative) and left leg (positive) (E-Fig. 54-1). Because the direction of both atrial and ventricular depolarization is away from the right arm and toward the left arm, a positive P wave and QRS complex are generally recorded in lead I. Similarly, the P wave and QRS complexes are positive in leads II and III in normal sinus rhythm because atrial and ventricular activation proceeds in a craniocaudal direction.
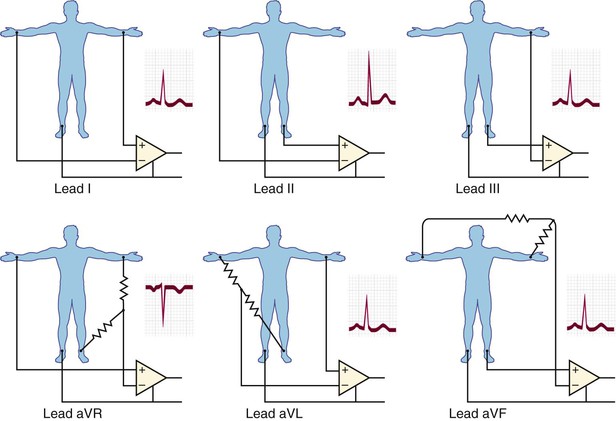
Leads aVR, aVL, and aVF are augmented unipolar leads in which the potential in each limb is compared with a reference electrode. For lead aVR, the potential of the right arm is compared with a reference composed of the left arm and left leg electrodes. Lead aVL compares the left arm potential with a reference combining the right arm and left leg; aVF compares the left leg with a right and left arm reference. Because atrial and ventricular activation normally moves from right to left and in a craniocaudal direction, the P wave and QRS complex are negative in lead aVR but positive in lead aVF. In lead aVL, P waves and QRS complexes are generally upright, although an rS complex may be recorded, particularly in young patients.
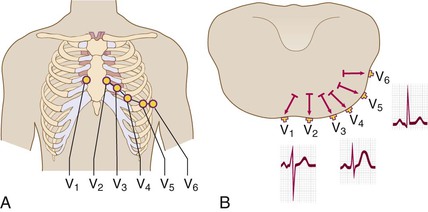
The precordial electrodes are positioned at specific points on the chest wall (E-Fig. 54-2A). These unipolar leads compare electrical potential between the chest electrode and a reference electrode called the Wilson central terminal. The Wilson central terminal combines the right arm, left arm, and left leg potentials through 5000-Ω resistors. The six precordial leads define atrial and ventricular activation with respect to a somewhat transverse plane through the chest wall (E-Fig. 54-2B). In this plane, atrial activation moves from right to left. Initial ventricular activation involving the septum is directed from left to right; left ventricular depolarization, which dominates right ventricular depolarization because of the differential in myocardial mass, then moves apically and laterally. In lead V1, to the right of the sternum, the P wave is biphasic (reflecting right and then left atrial activation). Initial ventricular activation of the septum inscribes an r wave, whereas subsequent activation away from lead V1 records a dominant S wave. In lead V6, the P wave is positive, and initial ventricular septal depolarization inscribes a tiny “septal” q wave (usually ≤0.02 second). Subsequent ventricular depolarization records a dominant R wave.
Right-sided chest leads should be recorded when right ventricular abnormalities are suspected. RV3, the mirror image of lead V3, is routinely recorded in pediatric patients because of the possibility of congenital heart disease. In adults, ST elevation in lead RV3 is specific for acute right ventricular infarction in those being evaluated for an acute inferior wall myocardial infarction.
Axis
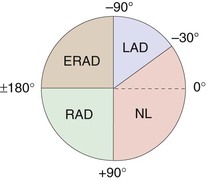
An axis of electrical activation can be defined in the frontal plane axis by combining the bipolar and augmented unipolar limb leads (E-Fig. 54-3A). By convention, the axis parallel to lead I, toward the left, is called 0 degrees. A frontal plane axis between −30 and +90 degrees is normal, whereas other axes are abnormal (Fig. 54-4) in adults. Right axis deviation beyond +90 degrees is often a normal variant in children and adolescents. The frontal plane axis can be estimated by identifying the limb lead in which the QRS complex is most nearly isoelectric (similar positive and negative deflections); the axis is perpendicular to this lead (E-Fig. 54-3B). Because two lines pointing 180 degrees apart can be drawn perpendicular to any given line, examination of the other limb leads defines the direction in which the axis points. If the QRS complex is positive in any given limb lead, the axis will be oriented toward that limb lead, not away from it. Alternatively, the axis is in the normal range if the QRS complexes are primarily positive in both leads I and II.
An axis is not defined in the precordial leads. Rather, because the typical progression from leads V1 to V6 is from a predominantly negative to a positive QRS complex, the transition point is usually defined as the point at which the amplitude of the R wave first exceeds the amplitude of the S wave. Clockwise rotation (transition zone at V4 or later) may portend a higher risk of future coronary events, and counterclockwise rotation (transition zone at V3 or earlier) a lower risk of events.3
Approach to Interpreting the Electrocardiogram
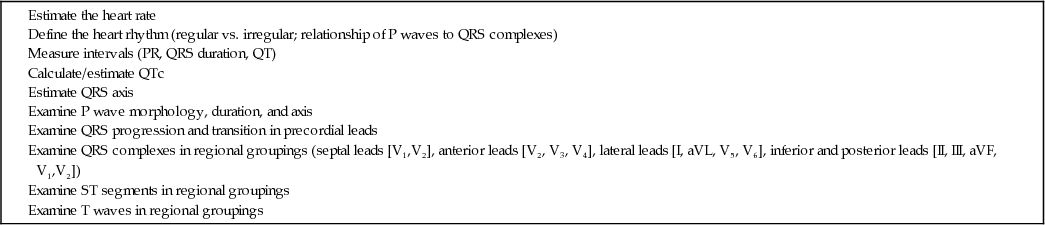
A stepwise approach to interpreting the ECG ensures that no features of the tracing will be overlooked (Table 54-2).
TABLE 54-2
STEPWISE APPROACH TO INTERPRETING THE ELECTROCARDIOGRAM
Normal Electrocardiogram
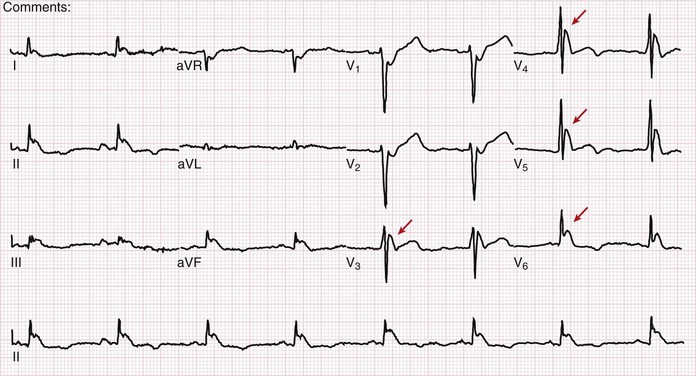
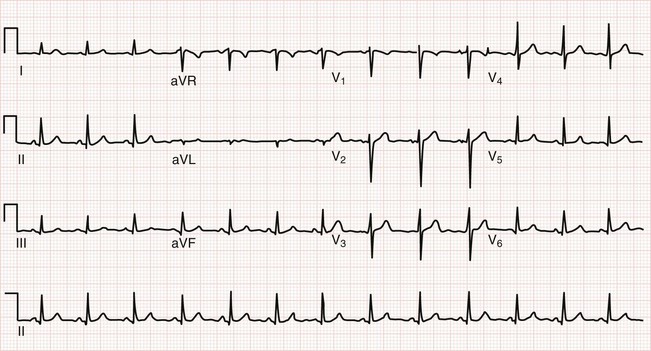
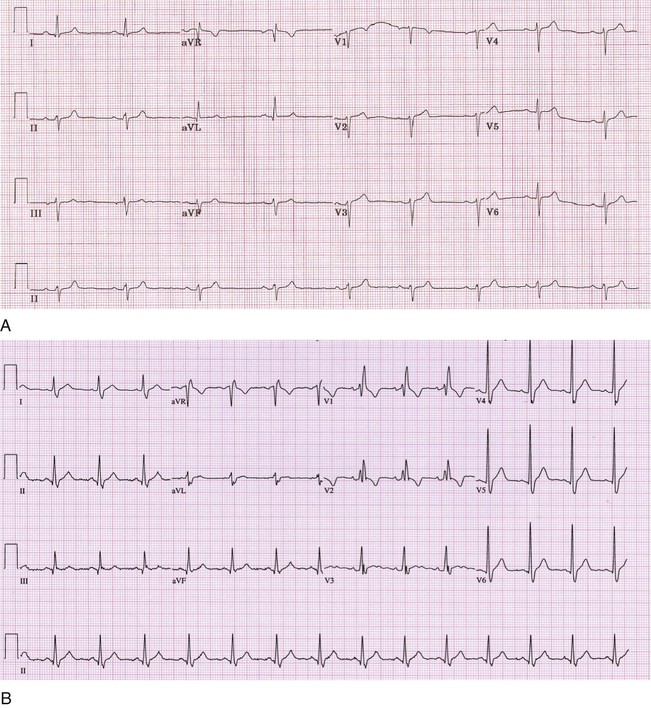
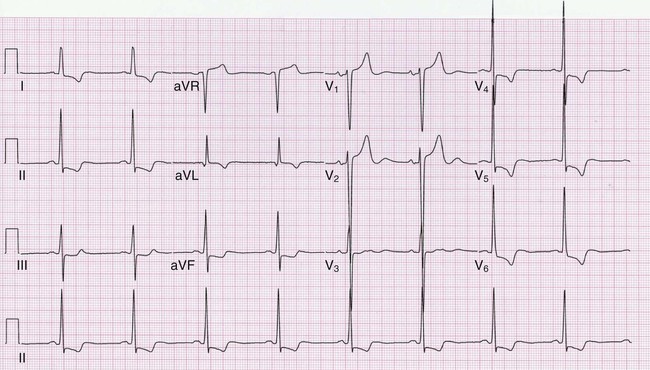
Figure 54-5 is an example of a normal ECG. Sinus rhythm occurs at about 78 beats per minute, with minor variations in the RR intervals (sinus arrhythmia). The PR interval, QRS duration, and QTc are all normal. The QRS complex is most nearly isoelectric in lead aVL, so the QRS axis will be perpendicular to lead aVL. Because aVL points to −30 degrees, the QRS axis must be approximately −120 or +60 degrees. Because the QRS complex is positive in leads I and II (large R waves), the QRS axis is approximately +60 degrees. The transition in the precordial leads is typically at lead V3 or V4. The P wave is biphasic in lead V1 and then positive in the other precordial leads. Septal q waves, reflecting not lateral infarction but rather normal early septal depolarization, are present in leads V5 and V6. Tiny q waves, a normal variant, are seen in the inferior leads.
Abnormal Electrocardiogram
Electrocardiography in patients with coronary artery disease is reviewed in Chapters 71 to 73.4 Arrhythmias are reviewed in Chapters 61 to 66.
Conduction Abnormalities and Axis Deviation
Abnormalities of the specialized conduction system (i.e., His-Purkinje system) reflect slow or absent conduction in a particular structure (Table 54-3 and Fig. 54-6). Left anterior or posterior fascicular block does not prolong the QRS duration beyond 120 msec. Incomplete bundle branch refers to QRS patterns that are morphologically similar to left or right bundle branch block, but with a duration of less than 0.12 sec (120 msec). An interventricular conduction delay is generally defined as a QRS duration of more than 0.11 second (110 msec). When the QRS has a duration of at least 0.12 second (120 msec), it often has the configuration of a specific bundle branch block. An isolated left bundle branch block in an otherwise healthy person is associated with a two-fold higher risk for development of a cardiovascular event or dying of a cardiovascular cause. As a result, this finding should trigger an evaluation for possible cardiac disease. By comparison, a complete right bundle branch block generally has not been associated with an increased risk, although one study suggested up to a 30% increased risk in cardiovascular mortality.5
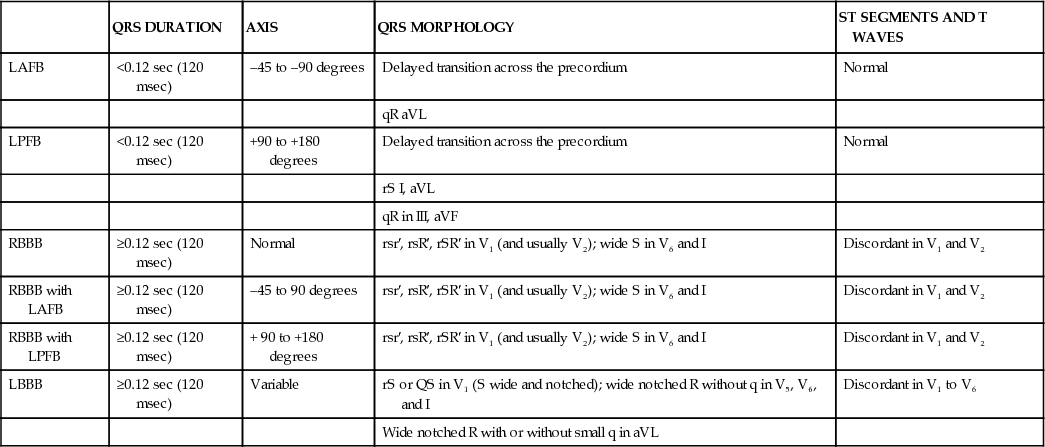
TABLE 54-3
FASCICULAR AND BUNDLE BRANCH BLOCKS
| QRS DURATION | AXIS | QRS MORPHOLOGY | ST SEGMENTS AND T WAVES | |
| LAFB | <0.12 sec (120 msec) | –45 to –90 degrees | Delayed transition across the precordium | Normal |
| qR aVL | ||||
| LPFB | <0.12 sec (120 msec) | +90 to +180 degrees | Delayed transition across the precordium | Normal |
| rS I, aVL | ||||
| qR in III, aVF | ||||
| RBBB | ≥0.12 sec (120 msec) | Normal | rsr′, rsR′, rSR′ in V1 (and usually V2); wide S in V6 and I | Discordant in V1 and V2 |
| RBBB with LAFB | ≥0.12 sec (120 msec) | –45 to 90 degrees | rsr′, rsR′, rSR′ in V1 (and usually V2); wide S in V6 and I | Discordant in V1 and V2 |
| RBBB with LPFB | ≥0.12 sec (120 msec) | + 90 to +180 degrees | rsr′, rsR′, rSR′ in V1 (and usually V2); wide S in V6 and I | Discordant in V1 and V2 |
| LBBB | ≥0.12 sec (120 msec) | Variable | rS or QS in V1 (S wide and notched); wide notched R without q in V5, V6, and I | Discordant in V1 to V6 |
| Wide notched R with or without small q in aVL |
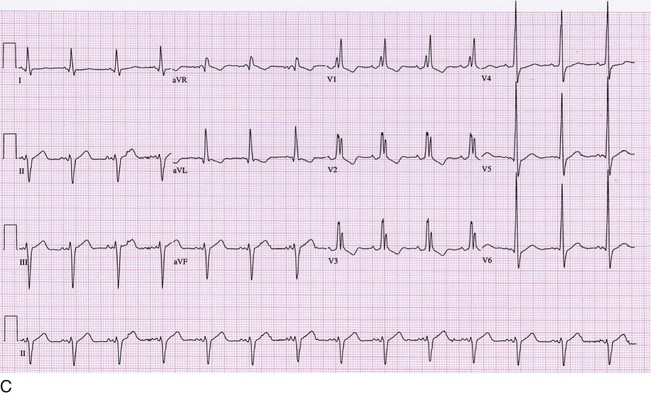
Chamber Hypertrophy
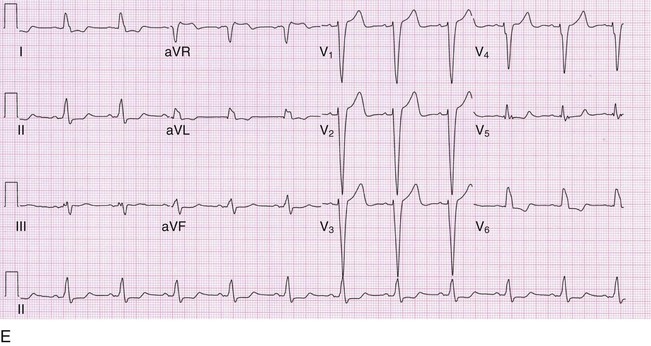
A number of criteria for defining left ventricular hypertrophy (LVH; Fig. 54-7) and right ventricular hypertrophy (RVH) have been proposed. All of the LVH criteria suffer from poor sensitivity (ranging from 30 to 50%), although the specificity is good (85 to 95%). The Cornell voltage criterion, developed with an echocardiographic standard for LVH, simply adds the S wave amplitude in V3 and the R wave amplitude in aVL; a total of more than 2.0 mV in women and 2.8 mV in men implies LVH. In many clinical settings, the Cornell criterion has replaced the more complicated Romhilt-Estes criteria, which assign points for QRS amplitude, repolarization abnormalities (“strain” pattern), left axis deviation, and other electrocardiographic features. RVH is much less common than LVH. Electrocardiographic criteria for diagnosis of RVH have even lower sensitivity (10 to 20%) than for LVH, although the specificity is similar. The Sokolow-Lyon criterion for RVH adds the R wave amplitude in lead V1 to the S wave amplitude in lead V5 or V6; a sum of 1.05 mV or more implies RVH.
Low QRS Voltage
Low QRS voltage is defined as limb lead voltage of less than 5 mm (0.5 mV) in all leads or precordial voltage of less than 10 mm (1 mV) in all leads. The differential diagnosis is broad (Table 54-4), and many patients will not have a clinically apparent underlying explanation.
Repolarization Abnormalities
Abnormalities of the ST segment or T waves, or both, are extremely common (Table 54-5). T waves may be in the same direction (concordant) with the QRS complex or discordant. Electrolyte and other metabolic abnormalities, drug effects (particularly digoxin and antiarrhythmic drugs), and secondary effects caused by LVH, bundle branch block, or pacing are all commonly responsible. Furthermore, abnormal depolarization patterns frequently beget abnormal repolarization.
TABLE 54-5
CAUSES OF REPOLARIZATION ABNORMALITIES
Athlete's heart
Early repolarization (normal variant)
Myocardial ischemia/injury
Pericarditis
Electrolyte abnormalities
Left ventricular hypertrophy
Intraventricular conduction delay/bundle branch block
Drug effects (digitalis, antiarrhythmic drugs)
Long QT syndrome
Stroke/neurologic catastrophe
Early repolarization, a relatively common pattern of ST segment elevation, occurs more commonly in patients with idiopathic ventricular fibrillation compared with controls and has also been associated with an increased risk of cardiac mortality.6 The risk is about 30% higher with 0.1 mV of ST elevation but three-fold higher with more than 0.2 mV of ST elevation. J waves in the absence of hypothermia also increase the risk of idiopathic ventricular fibrillation about four-fold.7
Pitfalls of Automated Computerized Electrocardiographic Readings
Automatic computerized ECG interpretations are generally accurate for calculating heart rates, axes, and intervals but have a sensitivity of only about 70% and a positive predictive value of only about 75% for diagnosis of acute myocardial infarction on the first electrocardiogram.8 Computerized readings are not reliable for diagnosis of rhythm disturbances, a striking weakness of these programs. Over-reading by a physician, including comparison with previous tracings when available, remains mandatory. Formal over-reading by a cardiologist is also recommended, even though it may not alter clinical care very often compared with over-reading by an emergency physician or internist.9
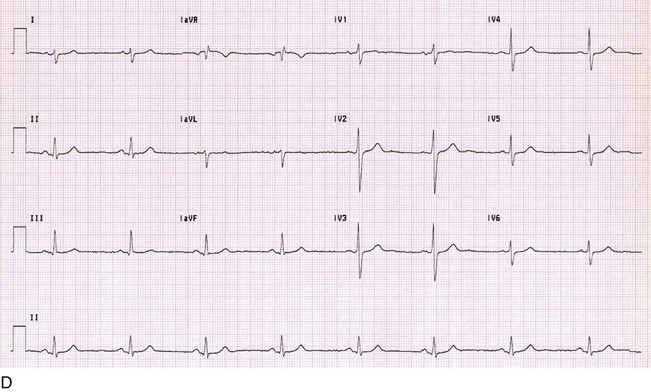
Electrocardiograms in Athletes
Extensive physical training leads to structural, electrophysiologic, and autonomic adaptations that can appear abnormal on an uninformed ECG reading.10 Among the most important ECG findings are rhythms suggesting hypervagotonia, early repolarization, and increased chamber size (Table 54-6 and Fig. 54-8).11 Differentiation between physiologic adaptations to exercise and potentially life-threatening abnormalities can be difficult and often requires expert consultation.
TABLE 54-6
GENERALLY BENIGN FINDINGS IN AN ATHLETE'S ELECTROCARDIOGRAM
Sinus arrhythmia, sinus bradycardia, wandering atrial rhythm, junctional rhythm
First-degree atrioventricular block
Mobitz I (Wenckebach) second-degree atrioventricular block
Incomplete right bundle branch block
Isolated voltage criteria for left ventricular hypertrophy (e.g., without repolarization abnormalities, left axis deviation, left atrial abnormality, pathologic Q waves)
Early repolarization pattern
Screening Electrocardiograms
Although frequently recommended by cardiologists and primary care physicians, screening ECGs and exercise ECGs (i.e., exercise stress test) have not been shown to improve outcomes in asymptomatic adults. The U.S. Preventive Services Task Force recommends against screening resting or exercise ECG in asymptomatic adults who are at low risk of coronary heart disease events (Chapter 52).12,13 For asymptomatic adults at intermediate or high risk, evidence is insufficient to make a recommendation.